 Joanna Aleksandra Kubiak
 Miroslaw Zimnoch
- 1Poznan University of Technology, Institute of Environmental Engineering and Building Installations, Poznan, Poland
- 2AGH-University of Science and Technology, Faculty of Physics and Applied Computer Science, Krakow, Poland
The article presents the results of statistical analyzes of meteorological and atmospheric radon concentration measurements carried out in Krakow in the years 2004–2013. Based on the diurnal variability, an estimation of the height of the nocturnal boundary layer was performed and compared with the ERA5 data. The average concentration of radon in the air of that period in Kraków was equal to (5.262 ± 0.017) Bqm−3. The diurnal and seasonal variability of radon concentration was found. The correlation of meteorological parameters calculated based on hourly mean data was analyzed. The correlations obtained were statistically significant, for wind speed (r= -0.38, p<0.001), and air humidity (r=0.33, p<0.001). The possibility of determining of the nocturnal boundary layer height on the basis of radon measurements has been confirmed; however, the calculation model needs to be refined.
1 Introduction
Radon is a noble gas. It is formed by radioactive decay of radium (226Ra) (Mamont-Cieśla, 2021) in minerals containing radium being one of the uranium series elements that is a very widespread element in the environment. During the decay process part of the atoms are injected into soil pores (emanation process) where they are transported following the diffusion process to the surface. In the next step, as result of so called exhalation, radon atoms are released into the atmosphere. Radon under normal conditions is colorless and odorless. The three natural isotopes of radon are 219Rn, 220Rn and 222Rn, respectively actinon, thoron and radon. The last one, radon, being the product of 226Ra decay, has the longest half-life, which lasts 3.82 days and has the highest concentration in air among other radon isotopes. The half-life is much longer than the timescale of turbulent mixing in the boundary layer (about 1 h). On the other hand, the half-life is short enough to limit the mixing processes of radon between the boundary layer and the free troposphere (Galeriu et al., 2011). This makes radon a good tracer of mixing processes in the boundary layer (Williams et al., 2013; Chambers et al., 2015; Wang et al., 2016; Wang et al., 2020)
In Krakow, due to the geographical location in a river valley and frequent temperature inversion situations, periods of higher atmospheric concentration are observed. Radon concentration in the atmosphere is varying throughout the year, exhibiting both diurnal and seasonal variations.
The atmosphere in which the influence of the earth’s surface plays a minor role is called the free atmosphere (Mölders & Kramm, 2014). By making computational models on a relatively small scale, the impact of the earth’s surface becomes an important issue. We are then dealing with surface excitations. The range of the atmosphere within which those effects of friction must be considered is called the planetary boundary layer (PBL) (Stull, 1988).
The PBL fluctuates significantly as a result of solar energy fluctuations reaching the earth’s surface. The solar radiation during the day is absorbed by the surface, heating of the lower part of the PBL, inducing the mixing of the atmosphere through the process of natural convection. After sunset, when the surface is cooled down, the temperature gradient is inversing and vertical air motions stop. As a result, a stable nocturnal boundary layer (NBL) is created, which then tends to suppress turbulent flows and accumulates all substances emitted from or close to the surface (including radon and air pollutants). This, in turn, stimulates increased concentration of these components in NBL.
After sunrise, the earth begins to heat up again, and the vertical mixing of the air resumes, causing the planetary boundary layer height to increase and diluting the trace components accumulated close to the ground during the night. This mechanism stimulates the diurnal variability of the radon concentration in PBL. At night, the concentration of radon is higher than during the day. After sunset, the formation of a stable planetary boundary layer occurs as a result of the disappearance of vertical air movements (Stull, 1988). During the day, radon dissolves in a large volume and with existing convection, the radon concentration during the day will be lower (Sesana et al., 2003; Zimnoch et al., 2014). Assuming there is no mixing between PBL and the free atmosphere and neglecting the advection transport assuming homogenic radon surface flux, we can formulate a mass balance equation (Griffiths et al., 2013):
where H is the height of the mixing layer (m),
The daily structure of PBL has a significant impact on the dispersion of pollutants in the atmosphere layer; therefore, its knowledge is important from the point of view of air quality affecting the health of society (Couach et al., 2003; Quan et al., 2013).
The aim of the work is to analyze the results of the radon measurements and to use them for estimation of a mixing height in the boundary layer. The motivation of research was to validate radon based estimation of NBL mixing height in topographically complicated urban area of the city. Presented data demonstrate a typical atmospheric radon variability in urban environment located in a concave terrain in different time scales (long term, seasonal and diurnal). A successful attempt was made to calculate the height of the planetary boundary layer based on the method proposed by Griffiths et al. (2013). The obtained results were validated by comparison with diagnostic boundary layer height data from ERA5 dataset. The validation showed that tested method underestimates mixing height in such terrain. Based on the obtained results a modification of the method has been proposed by application of empirical correction factor improving significantly data compliance.
2 Materials and methods
2.1 Site description
Radon measurements were made in Kraków, the second largest city (ca. 800,000 inhabitants) located in southern Poland. The city is situated in the valley of the Wisła River that passes the city area from west to east. The valley is parallel to the border of the Carpathian Mountains to the south and the border of Polish Uplands to the north. The soil type at the measurement site was dominated by loam. Due to its location in the valley, the local climate of Kraków is characterized by frequent thermal inversions and weak winds (Bokwa, 2011; Zimnoch et al., 2014; Bokwa et al., 2015).
2.2 Measurements and methods
2.2.1 Radon concentration
The radon monitor was installed at the AGH University of Science and Technology campus, on the roof of the Faculty of Physics and Applied Computer Science ca. 20 m a.g.l. (19°55′E 50°04′N 220 m a.s.l.). Measurements were conducted in the years 2004–2017, however, measurements from the years 2004–2013 were used for analysis, because the last part of the record was removed due to technical reasons. Measurements were made using a radon monitor developed in the University of Heidelberg. The measuring principle is based on the measurement of α radiation from short-lived radon decay products (
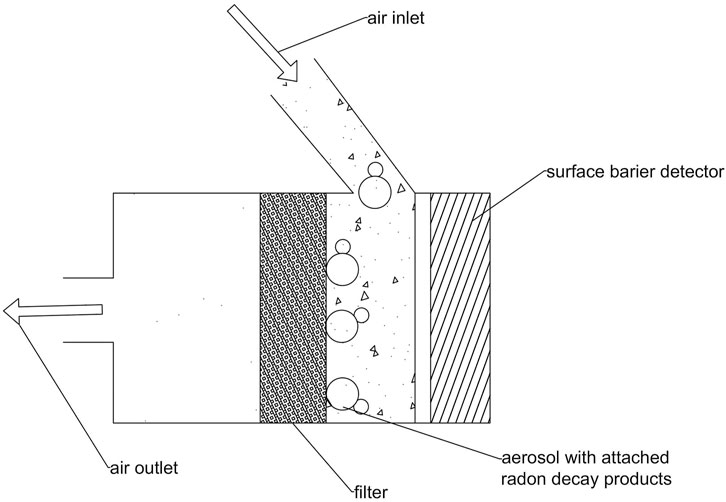
FIGURE 1. Scheme of the Rn monitor measurement head. Own study based on investment (Levin, 2000).
2.2.2 Other measurements
In addition to measuring radon concentration, metrological measurements for the period 2011–2013 were also conducted on the roof of the faculty building. Data were collected with minute time resolution and averaged to the hourly means. The measurements included temperature, relative humidity, atmospheric pressure, wind speed and direction, and rainfall.
ERA5 Dataset provided by ECMWF were used to compare the obtained radon-based results of NBL height (Hersbach et al., 2018). ERA5 delivers hourly estimates of a large number of atmospheric, land, and oceanic climate variables. The data are available on a 30 km grid and represent the atmosphere using 137 levels from the surface up to a height of 80 km. The diagnostic boundary layer height data from ERA5 at 4:00 a.m. UTC and 2:00 a.m. UTC were used for a comparison of the estimated NBL height based on radon measurements. In order to contain a continuous field representing all, unstable, neutral and stable PBL stability situations, a bulk Richardson method is used as a diagnostic. This method follows the conclusions of the study by Seidel et al. (2012). Selected time was chosen because usually at that time the stable nocturnal boundary layer is fully developed. The comparison of calculations based on radon and ERA5 data from 2:00 and 4:00 h showed a similar correlation coefficients (consecutively, correlations at a level of about r=0.54, r=0.57). Finally, because of higher r value, data from 4:00 was used for the following analysis.
2.3 Boundary layer height estimation method
The vertical profile of atmospheric radon is strongly affected by vertical mixing processes, particularly during stable stratification conditions (a night time). In order to estimate a mixing height in the boundary layer based on radon measurements, one has to assume a constant vertical profile concentration or a certain concentration profile. To assess boundary layer mixing height, a method proposed by (Griffiths et al., 2013) has been used.
The method represented by formula 2 allowed the authors to estimate the NBL height, calculated on the basis of radon measurements interpreted by Griffiths et al. (2013) as the accumulated equivalent mixing height, a mixing length scale computed from the net increase in radon concentration since the start of the night.
where C is maximum concentration during the night (Bqm-3),
Based on the analysis of the diurnal variability, the interval t between minimum and maximum radon concentration was assumed constant for the whole period (t= 36,000 s). The parameter F represents the radon flux from the surface into the atmosphere. Based on previous studies (Zimnoch et al., 2014), it was decided to resign from the constant F value and to create a function reflecting the sinusoidal flux change during the year with the monthly resolution, maintaining the maximum and minimum values. The minimum flux was adopted in April with a value equal to 9.5 mBqm-2s-1 and a maximum of 21 mBqm-2s-1 in October. To calculate NBL height, it was assumed that the data coverage on a given day and the day before have at least 50% of the radon activity results. To eliminate measurement errors (outliers), a data set has been filtered, and only values of the NBL height from 0 to 1000 m has been used.
3 Results and discussion
The results of the radon measurements have been thoroughly checked and all erroneous data has been removed from the record. Some longer periods of missing measurements resulting from the device malfunction have been omitted from a long-term analysis. The final data record obtained after the quality check along with the availability of data and statistical distribution is presented on Figure 2. The mean for all data was (5.262 ± 0.017) Bqm-3, the median was 3.7 Bqm-3, 95th percentile was 15 Bqm-3.
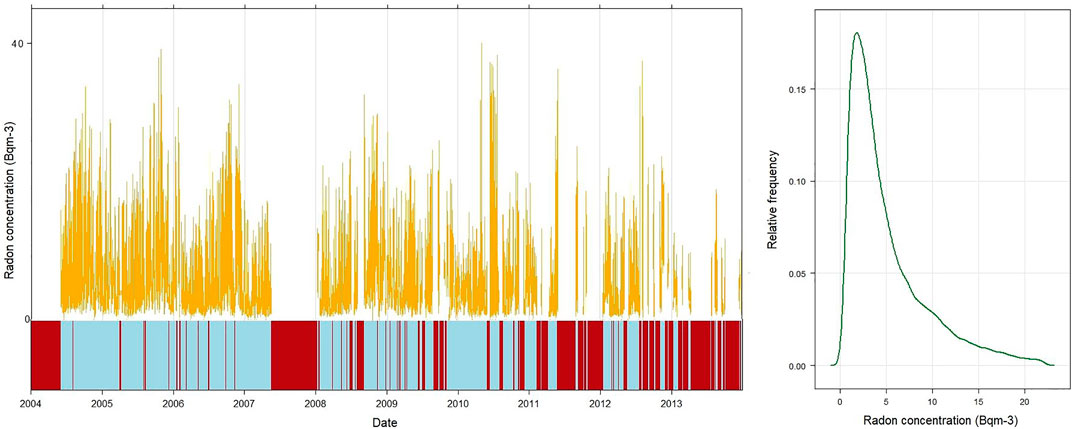
FIGURE 2. Total radon record (orange line), availability plot (red bars) and statistical distribution plot for all measurements from the period 2004–2013. Data coverage)excluding long term gaps) for the whole period is equal to ca. 68%. Basic statistical parameters of the record are: mean=5.3 Bqm-3, median=3.7 Bqm−3, 95th percentile=15 Bqm-3, maximum=39.9 Bqm-3.
The statistics calculated for each year are not significantly different. No long-term trend is observed (Figure 3). Without taking into account the data gaps in the measurements, 32.1% of the data for the radon concentration are missing. Taking into account the periods of measurement breaks in the years 2004–2013, 41% of the data are missing. The year 2013 is the year with the most defects - 79% of data are missing. The box plot below (Figure 3) does not include the years 2004, 2007, 2010 and 2013 because for these periods there are no more than 50% of the measurements per year, which could distort the annual statistics for those years.
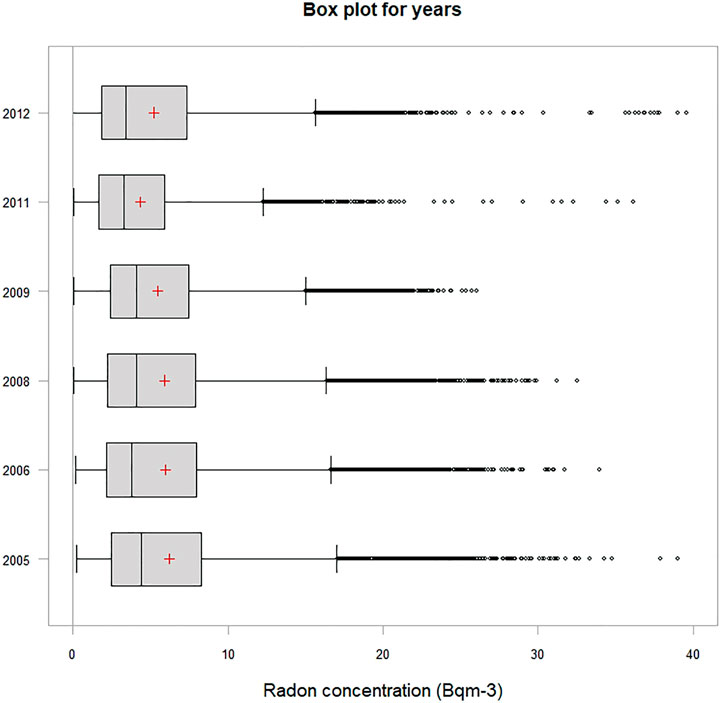
FIGURE 3. Annual averaged box-and-whisker plot of all radon concentration measurements. The left and right box borders represent 25th and 75th percentiles, whiskers extends interquartile range by factor 1.5, vertical bar represents the median, red cross, the mean value and black circles, the outliers.
3.1 Seasonal variability of radon
Based on the average radon values calculated for each month from the full record, clear seasonal variability of radon is observed. The highest mean values of radon concentration were determined for the months of October to November with an average radon concentration at the level (7.92±0.08) Bqm-3 and (8.02±0.08) Bqm-3 respectively. In November there is also the largest data spread (standard deviation 5.9 Bqm-3). Minima were observed from March to May both in mean values (March (3.37±0.04) Bqm-3; April (3.77±0.04) Bqm-3; May (3.75±0.04) Bqm-3) and standard deviations (March 2.92 Bqm-3; April 3.42 Bqm-3; May 3.51 Bqm-3) (Figure 4). In fall-winter seasons, radon concentrations are higher compared to spring-summer seasons, which is consistent with the results presented in (Sesana et al., 2003). The explanation of such variability can be seasonal variation of night time (longer nights with elevated radon concentration during the winter season) as well as more frequent temperature inversion in NBL observed in winter in Krakow (location of the city in river valley).
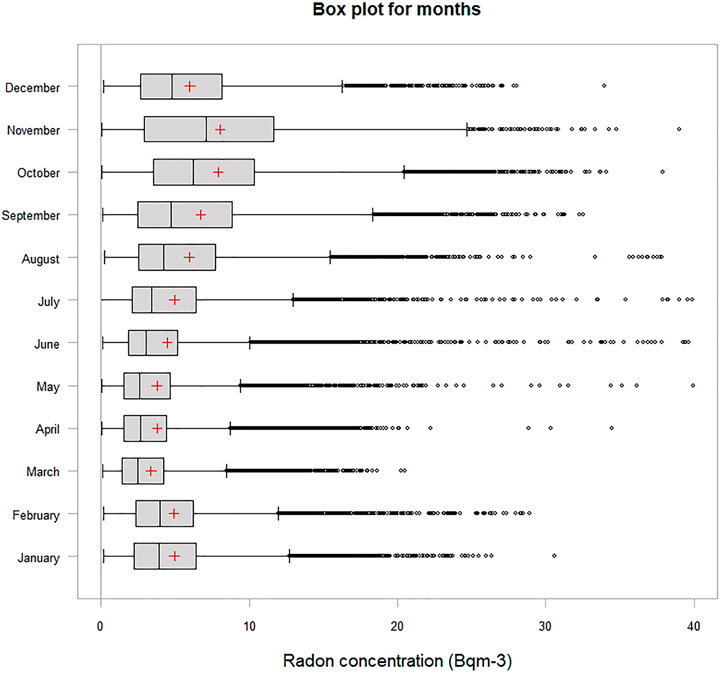
FIGURE 4. Monthly averaged box-and-whisker plot of all radon concentration measurements. The left and right box borders represent 25th and 75th percentiles, whiskers extends interquartile range by factor 1.5, vertical bar represents the median, red cross, the mean value and black circles, the outliers.
3.2 Diurnal variability of radon
To determine the diurnal variability, the averages for each hour in each month were calculated based on the entire data record. The plot presented in Figure 5 shows a clear diurnal variability of radon concentration. Maximum values of average radon concentration were observed at hours 3:00–4:00 ((7.66±0.12) Bqm-3) while at 13:00–14:00 the lowest values can be observed (((3.27±0.05) Bqm-3). This is consistent with theoretical considerations related to energy arriving from the Sun during the day. The diurnal variability depends on the existence of turbulent mixing within the PBL during the day and stable stratification at night. Other authors also reported similar character (Sesana et al., 2003).
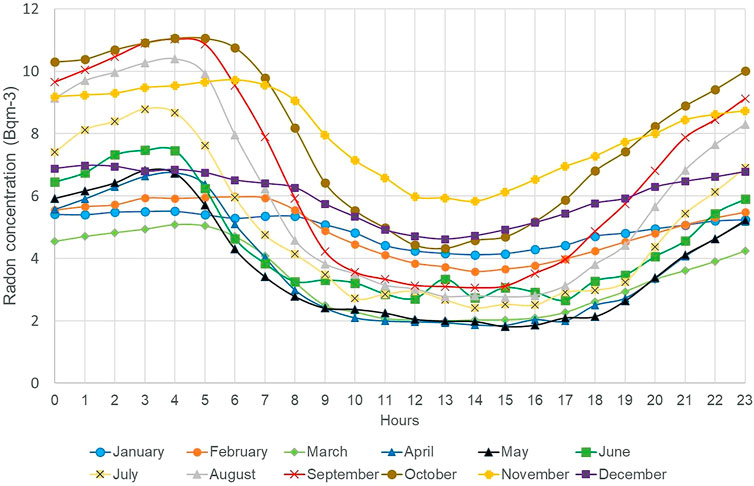
FIGURE 5. Monthly averaged mean diurnal cycle of all radon concentration measurements.
A noticeable variation in the maximum and minimum radon concentrations depending on the month is also clearly visible. January is characterized by the flattest course of variability being the result of low solar energy flux during that month. For the winter months, the radon maximum is shifted closer to 8:00 a.m. and the daily minimum period is shortened as a result of shorter days during the winter. For the remaining months, the diurnal variability of radon concentration is more pronounced.
3.3 Meteorological correlations for radon measurements
Due to the availability of meteorological data, correlation based on hourly average between radon concentration and meteorological parameters have been investigated for the period 2011–2013. The results are presented in Table 1. For all calculated correlations, the p-value is less than 0.001. The strongest Pearson correlation value was obtained for wind speed (r=-0.38, p<0.001) and relative humidity (r=0.33, p<0.001). A negative correlation between radon and wind speed confirms an intensification of the mixing process in PBL stimulated by a higher wind speed leading to dilution of radon in a larger volume. The positive correlation between radon and relative humidity may be indirectly due to the link between high wind speed and low relative humidity conditions. The period with the highest number of wind-calm periods was January (Figure 6). The highest average wind speed was recorded in the months from February to May and the lowest from November to January. The highest average radon concentration was recorded in November. In the months from February to May, the lowest average values of radon concentration are recorded. There is no significant relationship between the recorded radon concentration and the wind direction (Figure 7). Surprisingly low negative correlation between radon and air temperature was obtained (r=-0.19). To better understand this effect a separate correlation factors was calculated for each month separately. The results are presented in Table 2. It is clearly seen that a strong correlation difference is existing between warm (April-September) and cold (November-March) periods. A mean correlation is equal -0.08 ± 0.11 and -0.38 ± 0.18 for warm and cold periods respectively. It is not clear what mechanism is controlling such effect. One possible explanation is more frequent temperature inversion in NBL associated with temperature drop during cold season which stimulate radon buildup in NBL. Opposite, during the warm season there must be a mechanisms preventing radon build-up like urban brises existing particularly during hot weather conditions in the cities. A difference between obtained results and data reported by other authors (Duenas et al., 1996; Galeriu et al., 2011) may be attributed to specific location of the city in river valley but it needs a future investigation. Investigation of relationship between radon and meteorological parameters provided some indicators related to the possible influence of these parameters on the calculation of the mixing depth. It looks like wind speed is significantly influencing radon level so estimation of NBL height during synoptic events (like passing fronts associated with higher wind speed) may lead to wrong results.

TABLE 1. Correlation coefficient between radon concentration and meteorological parameters.
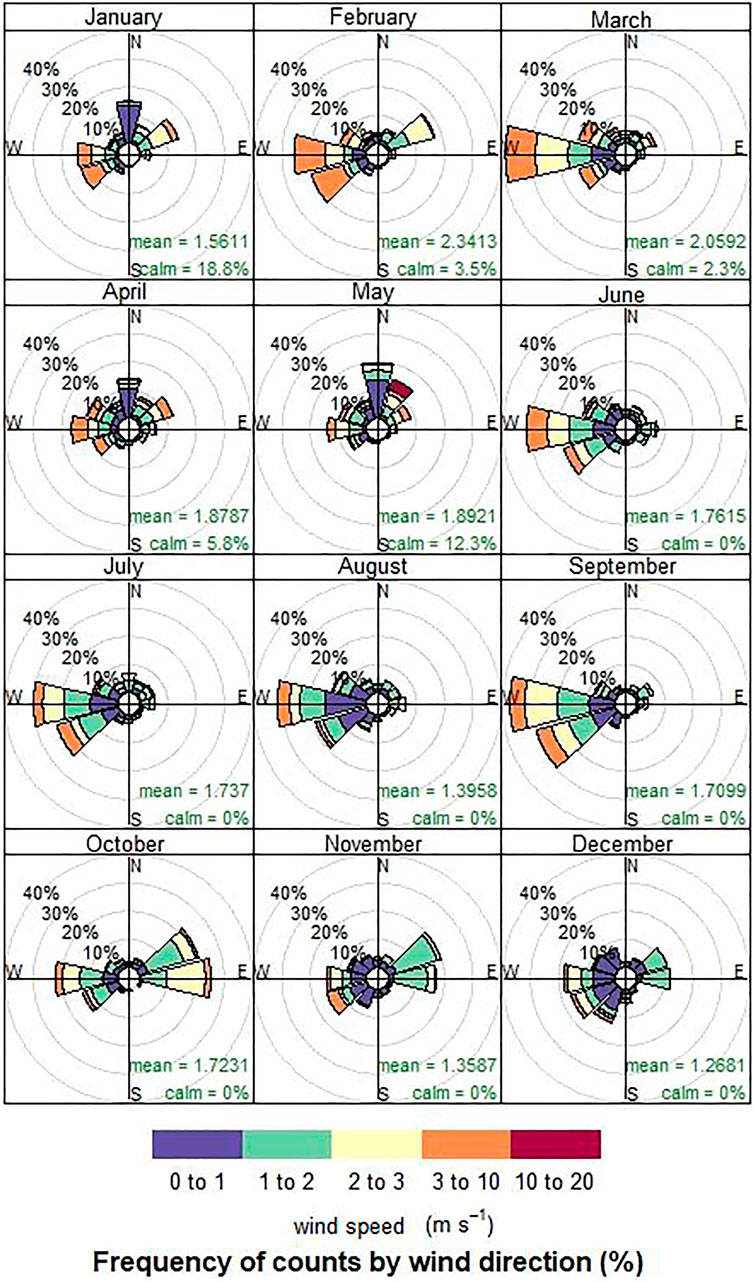
FIGURE 6. Monthly averaged wind roses from the period 2011-2013.
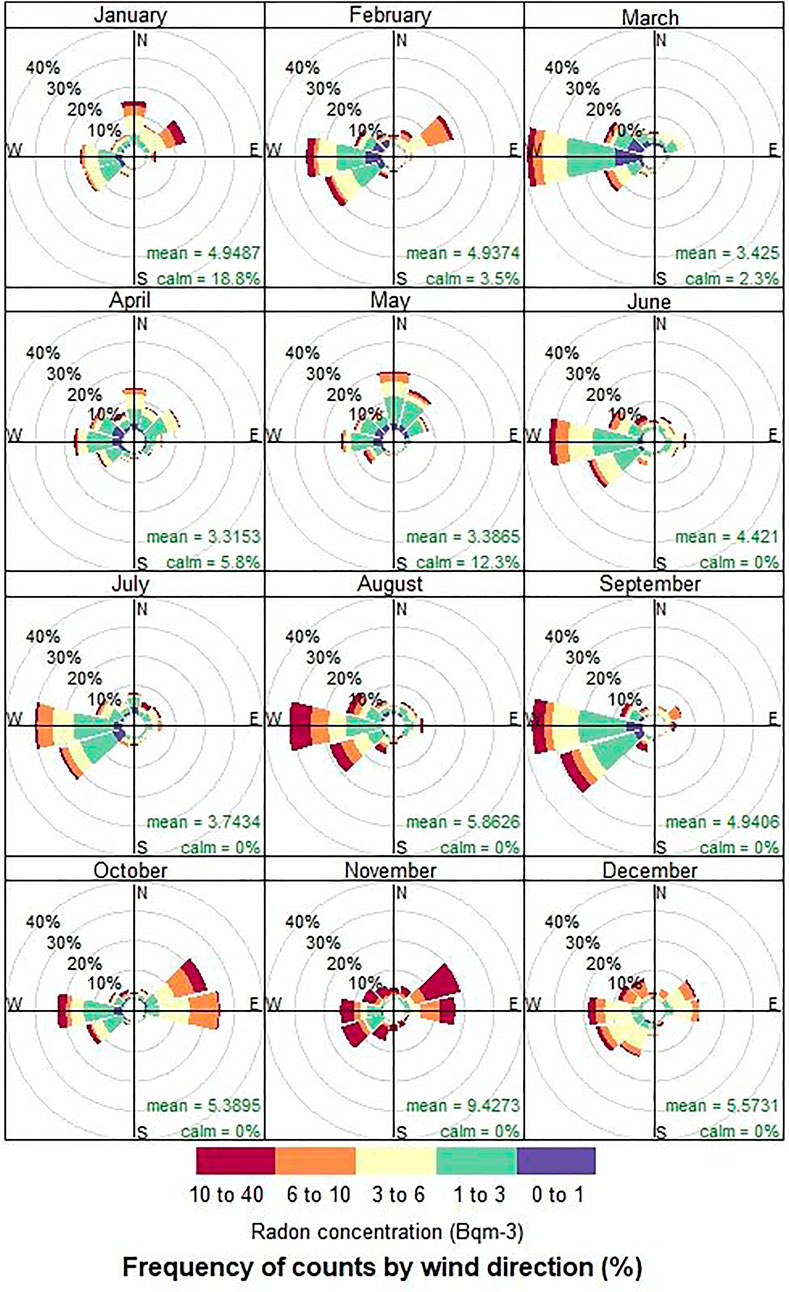
FIGURE 7. Monthly averaged radon roses from the period 2011-2013.

TABLE 2. The monthly averaged correlation coefficient (p<0.001) between radon and air temperature.
3.4 Height of the nocturnal boundary layer
The height of the nocturnal boundary layer was calculated using the formula 2 and compared with ERA5 data. The correlation between monthly mean values of NBL height obtained from radon method and ERA5 dataset are shown on Figure 8. A significant positive correlation was obtained (R2=0.85), however a significant difference between the results obtained from both methods are observed (Correlation slope equal to 2.6 and bias equal to 73m). The average height of the nocturnal boundary layer in Krakow was (119 ± 4) m from radon-based method and (239 ± 6) m from ERA5 dataset.
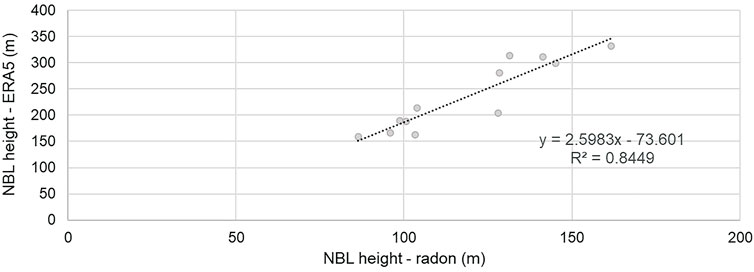
FIGURE 8. Correlation of monthly mean NBL heights obtained from radon-based method and from the ERA5 data.
The monthly averaged NBL heights were calculated for the radon estimations and ERA5 data based on the entire record. The seasonal variability of NBL height calculated using the radon method and obtained from ERA5 data are similar, however, a significant offset is observed (Figure 9). This offset depends slightly on the months. The lowest correlation between the ERA5 data and the estimates of heights based on radon was achieved for January (r=0.41, p<0.001) (Table 3). For the months considered to be winter, the correlation is smaller compared to the other months. The highest correlation value at the level of more than 0.7 is for August and September. A better correlation observed during the summer period may be the result of a more significant difference in the PBL mixing between day and night during this time. Another possible reason is related to radon soil flux. During the winter season, snow cover efficiently reduces this flux leading to underestimation of NBL height.
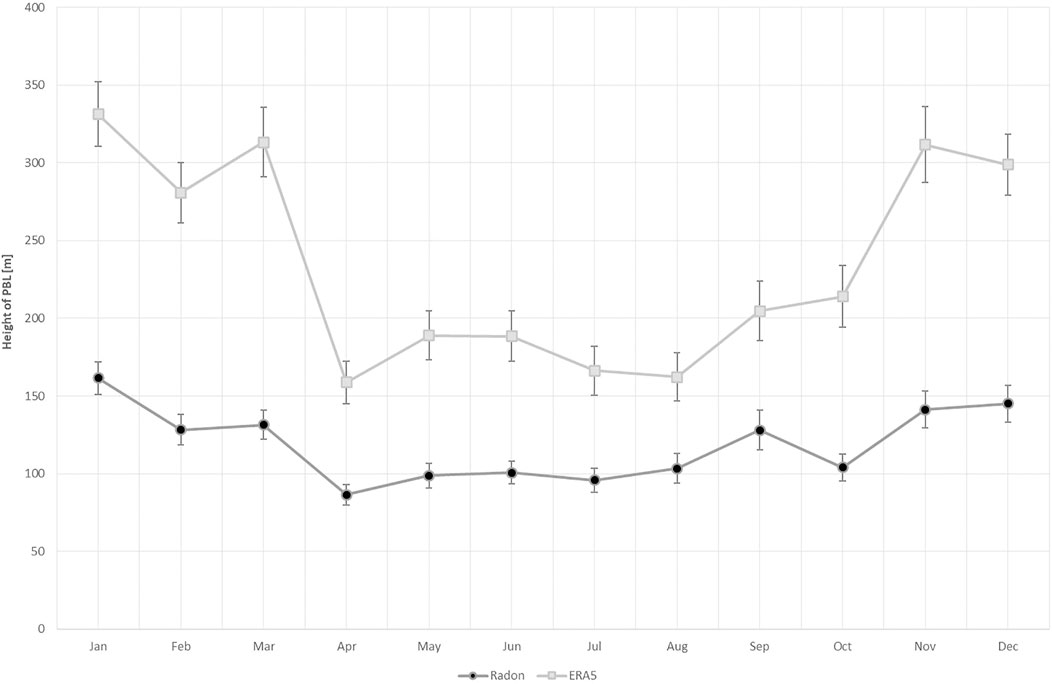
FIGURE 9. Monthly averaged NBL heights calculated from radon-based method (circles)and from the ERA5 data (squares) calculated from entry data. Error bars represent a standard deviation (1-σ) of mean values.
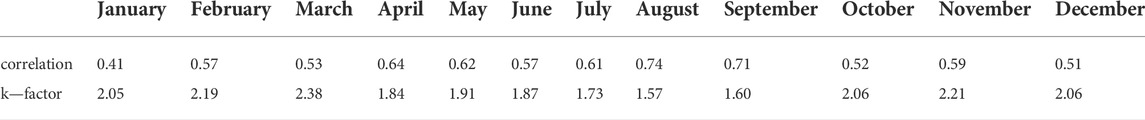
TABLE 3. The monthly averaged correlation coefficient (p<0.001) between radon-based estimation and the ERA5 data of NBL heights and calculated calculated k factor for radon-based NBL height estimation method.
3.5 Improved NBL estimation
In order to minimize bias and improve the consistency of estimations made with the radon-based method, which are usually lower than those obtained from ERA5, an empirical correction coefficient k has been applied. A proposed value for k was calculated as a ratio of NBL height obtained from both datasets based on their monthly mean values presented on Figure 9. The numerical k values are presented in Table 3. As reported in the table, this coefficient is not constant and varies throughout the year from 1.57 in August to 2.38 in March. The assessment of k-factor uncertainty requires further investigation.
An example of radon-based NBL height data calculated with and without k factor compared with ERA5 record for a 2 monthly periods (August and December 2004) are presented on the Figures 10A,B. The application of the k-factor increases the consistency between both records especially for the summer period. Comparison of two monthly records indicates that more consistent data between both methods are observed in warm period. Data from winter time are more noisy and differences looks more chaotic suggesting that during this season there are more interfering factors, like flux variability, long term temperature inversions.
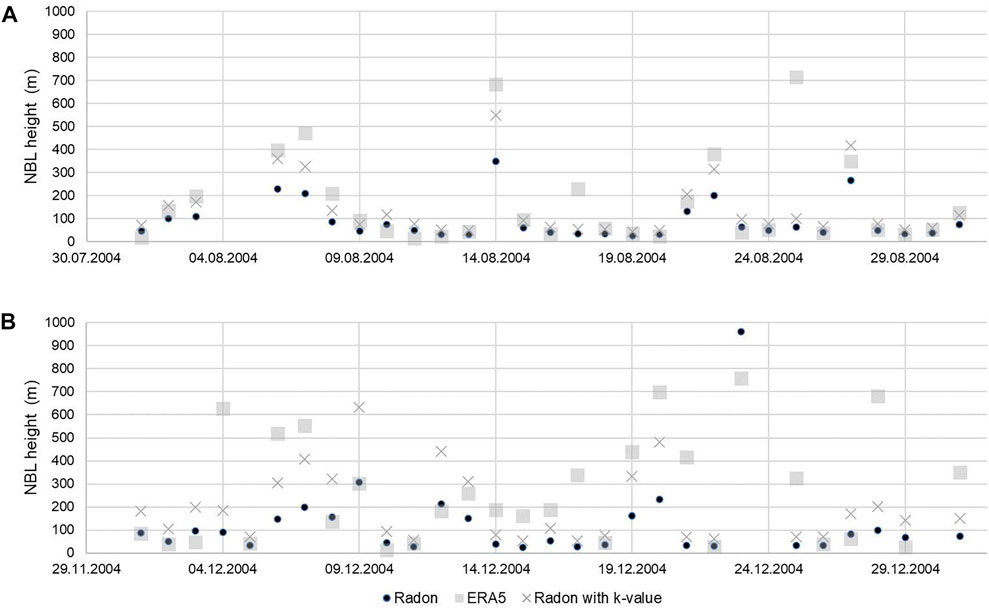
FIGURE 10. Daily averaged NBL heights calculated from radon-based method (circles), corrected radon-based method (crosses) and from the ERA5 data (triangles) calculated for summer time [August 2004—(A)] and winter time [December 2004—(B)].
4 Conclusion
The analysis of long-term atmospheric radon measurements performed in Krakow between 2004 and 2013 showed a clear annual and diurnal variability. Maximum monthly mean values was determined for October and November. The minima were observed from March to May; Calculation of hourly mean radon concentrations based on the whole period shows a clear diurnal variability of radon, which is consistent with the theory of planetary boundary layer formation (Stull, 1988; Sesana et al., 2003).
The highest hourly correlations for meteorological parameters and radon were obtained for wind speed and relative humidity. For wind, the correlation is negative with the r value equal to -0.38 (p <0.001). For relative humidity, a positive correlation was obtained at the following level: r = 0.33, p <0.001. No statistically significant value was obtained for the dew point temperature and precipitation intensity. The directions of correlation are consistent with the research of other scientists (Duenas et al., 1996; Galeriu et al., 2011), only the relative humidity stands out, for which the researchers noted a negative correlation of about 0.6 (Duenas et al., 1996; Galeriu et al., 2011). For temperatures, a higher correlation was expected due to diurnal variability (Galeriu et al., 2011). Monthly analysis of the correlation between radon and temperature shown much stronger relationship during the cold period. One of possible reasons is more frequent temperature inversions during the winter and more intense air circulation inside the city during the Summer.
On the basis of the research, the nocturnal boundary layer height can be calculated based on the minimum and maximum diurnal radon concentration however there are clear limitations of the method. Diurnal variability of radon is controlled by several factors including the exhalation rate which may be altered by snow cover or intense precipitation or advective transport especially important in the cities located in the valleys. Proper precise estimation of NBL height requires consideration of these factors, but based on obtained results, it looks that the method supplemented by empirical correction factor can be successfully used for raw estimation of mixing height especially during the warm period. For the winter months, the correlation between the radon-based method of NBL height estimation and the data from the ERA 5 is lower than in the remaining months. In the winter months, snow cover is most common and the soil is frozen, which results in a more efficient blockage of radon exhalation from the soil, hence the estimate becomes less accurate. In winter we observe more stable conditions in PBL and this creates a greater vertical concentration gradient that can persist around the clock, which in turn may cause a greater underestimation of the layer height. In summer, a larger Sun energy flux mixes PBL more strongly during the day, making the initial conditions more reproducible for our analyzes. To better estimate the height of the NBL, it would be necessary to check the influence of atmospheric conditions, such as wind on the calculations. It is definitely worth taking a closer look at the weather conditions in winter. There should also be a better way to filter the calculated NBL results. Probably the NBL estimation with the use of radon is possible only for strictly defined metrological conditions.
Data availability statement
The raw data containing radon concentration and meteorological data supporting the conclusion of this article will be made available upon request, without undue reservation. ERA5 dataset is available for download from the Copernicus Climate Change Service (see Hersbach et al., 2018).
Author contributions
JK, and MZ contributed to conception and design of the study. MZ organized the database. JK performed the statistical analysis. JK wrote the first draft of the manuscript. JK, and MZ wrote sections of the manuscript. All authors contributed to manuscript revision, read, and approved the submitted version.
Funding
This research has been partly supported by AGH UST statutory tasks No. 11.11.220.01/1 within subsidy of the Ministry of Education and Science.
Acknowledgments
The authors thank Prof. Ingeborg Levin from the Institute of Environmental Physics, University of Heidelberg, for providing the radon monitor, and two referees for insightful reviews that have significantly improved the quality of the manuscript.
Conflict of interest
The authors declare that the research was conducted in the absence of any commercial or financial relationships that could be construed as a potential conflict of interest.
Publisher’s note
All claims expressed in this article are solely those of the authors and do not necessarily represent those of their affiliated organizations, or those of the publisher, the editors and the reviewers. Any product that may be evaluated in this article, or claim that may be made by its manufacturer, is not guaranteed or endorsed by the publisher.
References
Bokwa, A., Hajto, M. J., Walawender, J. P., and Szymanowski, M. (2015). Influence of diversified relief on the urban heat island in the city of Kraków, Poland. Theor. Appl. Climatol. 122 (1), 365–382. doi:10.1007/s00704-015-1577-9
Bokwa, A. (2011). Influence of air temperature inversions on the air pollution dispersion conditions in Krakow, 126. Krakow: Prace Geograficzne.
Chambers, S. D., Wang, F., Williams, A. G., Xiaodong, D., Zhang, H., Lonati, G., et al. (2015). Quantifying the influences of atmospheric stability on air pollution in Lanzhou, China, using a radon-based stability monitor. Atmos. Environ. 107, 233–243. doi:10.1016/j.atmosenv.2015.02.016
Couach, O., Balin, I., Jiménez, R., Ristori, P., Perego, S., Kirchner, F., et al. (2003). An investigation of ozone and planetary boundary layer dynamics over the complex topography of Grenoble combining measurements and modeling. Atmos. Chem. Phys. 3 (3), 549–562. doi:10.5194/acp-3-549-2003
Duenas, C., Perez, M., Fernandez, M., and Carretero, J. (1996). Radon concentrations in surface air and vertical atmospheric stability of the lower atmosphere. J. Environ. Radioact. 31 (1), 87–102. doi:10.1016/0265-931x(95)00058-i
Galeriu, D., Melintescu, A., Stochioiu, A., Nicolae, D., and Balin, I. (2011). Radon, as a tracer for mixing height dynamics-an overview and RADO perspectives. Romanian Rep. Phys. 63 (1), 115
Griffiths, A., Parkes, S., Chambers, S., McCabe, M., and Williams, A. (2013). Improved mixing height monitoring through a combination of lidar and radon measurements. Atmos. Meas. Tech. 6 (2), 207–218. doi:10.5194/amt-6-207-2013
Hersbach, H., Bell, B., Berrisford, P., Biavati, G., Horanyi, A., Munoz Sabater, J., et al. (2018). ERA5 hourly data on single levels from 1959 to present. Copernicus Climate Change Service (C3S) Climate Data Store (CDS). doi:10.24381/cds.adbb2d47
Levin, I. (2000). Manual for the Radon Monitor, developed at the Institut für Umweltphysik. Heidelberg: University of Heidelberg.
Levin, I., Born, M., Cuntz, M., Langendörfer, U., Mantsch, S., Naegler, T., et al. (2002). Observations of atmospheric variability and soil exhalation rate of radon-222 at a Russian forest site. Technical approach and deployment for boundary layer studies. Tellus B 54 (5), 462–475. doi:10.1034/j.1600-0889.2002.01346.x
Mamont-Cieśla, K. (2021). Radon – promieniotwórczy gaz w środowisku człowieka, centralne laboratorium ochrony radiologicznej. Retrieved 21.11.2021 from https://www.clor.waw.pl/images/pliki/Pomiar_Radonu/Radon-1a_Kalina_radon.pdf.
Quan, J., Gao, Y., Zhang, Q., Tie, X., Cao, J., Han, S., et al. (2013). Evolution of planetary boundary layer under different weather conditions, and its impact on aerosol concentrations. Particuology 11 (1), 34–40. doi:10.1016/j.partic.2012.04.005
Seidel, D., Zhang, Y., Beljaars, A., Golaz, J.-C., and Medeiros, B. (2012). Climatology of the planetary boundary layer over the continental United States and Europe. J. Geophys. Res. 117, D17106. doi:10.1029/2012jd018143
Sesana, L., Caprioli, E., and Marcazzan, G. (2003). Long period study of outdoor radon concentration in Milan and correlation between its temporal variations and dispersion properties of atmosphere. J. Environ. Radioact. 65 (2), 147–160. doi:10.1016/s0265-931x(02)00093-0
Stull, R. B. (1988). An introduction to boundary layer meteorology, 13. Dordrecht: Springer Science & Business Media.
Wang, F., Chambers, S. D., Zhang, Z., Williams, A. G., Deng, X., Zhang, H., et al. (2016). Quantifying stability influences on air pollution in Lanzhou, China, using a radon-based “stability monitor”: Seasonality and extreme events. Atmos. Environ. 145, 376–391. doi:10.1016/j.atmosenv.2016.09.014
Wang, F., Zhang, Z., Chambers, S. D., Tian, X., Zhu, R., Mei, M., et al. (2020). Quantifying influences of nocturnal mixing on air quality using an atmospheric radon measurement case study in the city of jinhua, China. Aerosol Air Qual. Res. 20 (3), 620. doi:10.4209/aaqr.2019.10.0506
Williams, A., Chambers, S., and Griffiths, A. (2013). Bulk mixing and decoupling of the nocturnal stable boundary layer characterized using a ubiquitous natural tracer. Bound. Layer. Meteorol. 149 (3), 381–402. doi:10.1007/s10546-013-9849-3
Keywords: radon, isotopes, nocturnal boundary layer, atmosphere, pollution
Citation: Kubiak JA and Zimnoch M (2022) Assessment of the nocturnal boundary layer height based on long-term atmospheric radon measurements. Front. Earth Sci. 10:955791. doi: 10.3389/feart.2022.955791
Received: 29 May 2022; Accepted: 22 August 2022;
Published: 14 September 2022.
Edited by:
Hiroto Kawashima, Akita Prefectural University, JapanReviewed by:
Jolanta Godłowska, Institute of Meteorology and Water Management, PolandDafina Kikaj, National Physical Laboratory, United Kingdom
Copyright © 2022 Kubiak and Zimnoch. This is an open-access article distributed under the terms of the Creative Commons Attribution License (CC BY). The use, distribution or reproduction in other forums is permitted, provided the original author(s) and the copyright owner(s) are credited and that the original publication in this journal is cited, in accordance with accepted academic practice. No use, distribution or reproduction is permitted which does not comply with these terms.
*Correspondence: Miroslaw Zimnoch, emltbm9jaEBhZ2guZWR1LnBs