 Juan Sulca
 Mathias Vuille
 Bo Dong
94% of researchers rate our articles as excellent or good
Learn more about the work of our research integrity team to safeguard the quality of each article we publish.
Find out more
ORIGINAL RESEARCH article
Front. Earth Sci., 12 September 2022
Sec. Atmospheric Science
Volume 10 - 2022 | https://doi.org/10.3389/feart.2022.954954
This article is part of the Research TopicPacific Multi-Decadal Variability and Enso Impact on the South American ClimateView all 5 articles
The impacts of the interdecadal variability of the Pacific and the Atlantic Oceans on precipitation over the Central Andes during the austral summer (December-January-February, DJF) are investigated for the 1921–2010 period based on monthly gridded precipitation data and low-pass filtered time series of the Niño 4 index (IN4), the Niño 1 + 2 index with Niño 3.4 index removed (IN1+2*), Atlantic Multidecadal Oscillation (AMO), and Interdecadal Pacific Oscillation (IPO) indices, and the three first rotated principal components of the interdecadal component of the sea surface temperature (SST) anomalies over the Atlantic Ocean. A rotated empirical orthogonal function (REOF) analysis of precipitation in the Central Andes (10°S–30°S) yields two leading modes, RPC1 and RPC2, which represent 40.4% and 18.6% of the total variance, respectively. REOF1 features a precipitation dipole between the northern Bolivian and the Chilean Altiplano. REOF2 also features a precipitation dipole, with highest negative loading over the southern Peruvian Andes. The REOF1 positive phase is associated with moisture transport from the lowlands toward the Bolivian Altiplano, induced by upper-level easterly wind anomalies over the Central Andes. At the same time conditions tend to be dry over the southern Peruvian Andes. The positive phase of REOF2 is related to weakened moisture transport, induced by upper-level westerly wind anomalies over Peru. The IPO warm phase induces significant dry anomalies over the Bolivian Altiplano, albeit weaker than during the IN4 warm phase, via upper-level westerly wind anomalies over the Central Andes. No significant relationship was found between Central Andean precipitation and the AMO on interdecadal timescales.
The South American monsoon system (SAMS) is characterized by a marked annual cycle with an onset during October, mature phase between December and February, and demise in April (e.g., Zhou and Lau, 1998; Raia and Cavalcanti, 2008; Garreaud et al., 2009; Grimm, 2011; Marengo et al., 2012). During austral summer (DJF), the maximum precipitation falls over the south-central Amazon, and the northwest-southeast oriented South Atlantic Convergence Zone (SACZ) produces a cloud band with enhanced precipitation that appears to merge with the intense convection over the Amazon Basin, extending from tropical South America (SA) southeastward into the South Atlantic Ocean (Kodama, 1992; Liebmann et al., 1999; Grimm et al., 2020). The South American low-level jet (SALLJ) is the main feature of the low-level circulation over South America. The SALLJ is located to the east of the Andes, transporting warm and moist air from the Amazon basin toward the subtropics (Montini et al., 2019). In the upper troposphere, at 200 hPa, the main feature of the atmospheric circulation over the South American continent is the Bolivian High - Nordeste Low (BH–NL) system (Chen et al., 1999). Chen et al. (1999) pointed out that the latent heat released during convection over the Amazon basin influences the fundamental structure and intensity of the BH-NL system. The BH–NL system is not present during the austral winter when the upper-level westerly zonal flow is established over South America.
A large body of literature by now exists documenting how the interannual variability of austral summer precipitation over the Central Andes (10–30°S) is influenced by changes in the atmospheric circulation in response to tropical Pacific SST anomalies (Garreaud et al., 2003; Vuille and Keimig, 2004; Segura et al., 2020). Comparably little, however, has been published related to decadal and multidecadal variability of precipitation and how it may be related to low-frequency SST variations in the Pacific and Atlantic Oceans, such as those expressed by the Atlantic Multidecadal Oscillation (AMO) or the Interdecadal Pacific Oscillation (IPO). How the multidecadal component of El Niño—Southern Oscillation (ENSO) variability over the eastern and central Pacific modulates long-term precipitation changes over this region of the Andes is also largely unknown. This incomplete information is primarily related to the paucity of long observational records required to investigate such mechanisms and related precipitation changes in the Andes. Here, we try to address this gap in our current understanding by focusing on the influence of several oceanic (multi-)decadal indices that we hypothesize to be related to long-term precipitation changes in the Central Andes, namely the IPO and the AMO, but also the multidecadal components of ENSO variability in the eastern and central Pacific and the multidecadal component of Atlantic variability.
The Niño 4, Niño 3.4, Niño 3 and Niño 1 + 2 indices are commonly used to describe the SST anomalies over the equatorial Pacific (ENSO) and their atmospheric teleconnections. Anomalously warm Pacific SST anomalies over the Niño 1 + 2 index region induce precipitation along the coasts of northern Peru and southern Ecuador in DJF (Lagos et al., 2008). Conversely, anomalously warm SST over the Niño 4 index region led to a reduction in precipitation over the Peruvian Altiplano during austral summer (Lagos et al., 2008). La Niña events in the Niño 1 + 2 and Niño 4 regions present the same impacts as El Niño, but with opposite signs.
Few studies have tried to characterize the influence of the interdecadal signal of Pacific SST on DJF precipitation over the Central Andes. For instance, Segura et al. (2016) analyzed the discharge time series and water level data of Lake Titicaca. They found a negative relationship between precipitation in the Central Andes and SST anomalies over the central Pacific on interdecadal time scales. But, to our knowledge, so far no study has analyzed how the multidecadal components of the Niño 4 and Niño 1 + 2 indices affect austral summer precipitation over the Central Andes.
According to Vuille et al. (2000) there is no significant influence of tropical Atlantic SST anomalies on DJF precipitation over the Central Andes on interannual timescales. Conversely, few studies evidenced that the interdecadal component of Atlantic SST anomalies affects precipitation over the Central Andes in DJF. For instance, based on tree-ring records over the last two centuries, a significant multidecadal precipitation signal of 40 years related to the AMO was identified over the eastern Andes of Peru (Humanes-Fuente et al., 2020). This precipitation reconstruction also suggests that this multidecadal precipitation signal extends over much of the central and northern Peruvian Andes.
The interdecadal variability of SST anomalies over the Pacific basin has been documented in several studies through different indices such as the Pacific Decadal Oscillation (PDO; Mantua et al., 1997) and the Interdecadal Pacific Oscillation (IPO; Zhang et al., 1997). The IPO is the dominant mode of decadal to multidecadal variations of SSTs in the Pacific basin, which resembles ENSO-related SST anomaly patterns (Zhang et al., 1997; Power et al., 1999). Studies suggested that the PDO and IPO contain essentially the same interdecadal signal (e.g., Deser et al., 2004). The exact mechanism behind the IPO is not fully understood, although multiple hypotheses have been provided (Liu, 2012).
Several studies found that the IPO modulates precipitation and temperature over Australia, the southwestern United States, South America, and other regions (Dai, 2013; Dong and Dai, 2015 (DD15); Grimm et al., 2016; Dong et al., 2018). Grimm and Saboia (2015) found that the IPO modulates the intensity of the two leading summer modes of precipitation over South America. For instance, the warm phase of the IPO reduces summer precipitation over northwestern SA and the equatorial eastern Amazon, while it enhances summer precipitation over central Argentina and parts of the southern Amazon basin. Conversely, the influence of the IPO is mixed, with no clear signal over the Central Andes (Grimm and Saboia, 2015; DD15). In addition, the IPO is responsible for significant perturbations in the Walker cell over the equatorial Pacific, which can result in severe flooding over the Amazon basin (Barichivich et al., 2018).
The Atlantic Multidecadal Oscillation (AMO) is characterized by in-phase warming or cooling of the North Atlantic by about 0.4°C that occurs with a periodicity of roughly 65–80-years (Enfield et al., 2001). Several studies have shown that the AMO is correlated with SST variability in the Pacific. For example, Enfield et al. (2001) documented that the AMO is significantly positively correlated with SSTs over the North Pacific north of 30°N and negatively, albeit insignificantly, correlated over the central Pacific. Timmerman et al. (2007) found that the cold (warm) AMO phase is associated with strong (weak) ENSO variability and a reduced (increased) magnitude of the annual cycle of the SST in the eastern tropical Pacific.
The AMO also modulates precipitation over South America and its teleconnections with ENSO (Kayano and Capistrano, 2014; Flantua et al., 2016; Grimm et al., 2016; Barichivich et al., 2018; Figliuolo et al., 2020). Flantua et al. (2016) found a negative correlation between AMO and annual precipitation in the western Cordillera of the southern Peruvian Andes. On the other hand, Barichivich et al. (2018) found that the AMO and the cross-equatorial Atlantic SST gradient correlate with the decadal signal of drought frequency in the Amazon since the 1920s, with a higher frequency of droughts during the positive AMO phase, associated with warm tropical North Atlantic SSTs. Grimm and Saboia (2015) found that the AMO does not have a clear influence on the DJF precipitation over the Bolivian and Peruvian Altiplano.
Kayano and Capistrano (2014) found that ENSO-related negative precipitation anomalies in the western Cordillera of the southern Peruvian Andes prevail during austral summer during the negative AMO phase. Conversely, the warm AMO phase is negatively correlated with DJF precipitation over the southern Central Andes.
The two phases of the AMO result in different patterns of austral summer precipitation anomalies, depending on the phases of the central and eastern ENSO indices between 15°N and 15°S (Figliuolo et al., 2020). For example, the eastern Pacific El Niño enhances (reduces) DJF precipitation over the central Peruvian Andes during the warm (cold) AMO phase. The opposite case occurs during the central Pacific El Niño. Recently, He et al. (2021) found that the multidecadal variability in the Pacific and Atlantic can lead to joint impacts from both basins that depend on the phase state in each basin and that they may be quite different from the impacts observed if the two modes of variability are considered in isolation.
The North Atlantic Oscillation (NAO) is a large-scale climate mode that features the redistribution of atmospheric mass between the Arctic and subtropical Atlantic, inducing a north–south seesaw in the North Atlantic sea level pressure field (Hurrell et al., 2003). Several studies show that the NAO has significant impacts on the interdecadal variability of precipitation over North America, North Africa, Eurasia, South America, and the Arctic (Scaife et al., 2008; Li et al., 2013). Grimm and Saboia (2015) found that the first three leading rotated modes of the interdecadal component of the DJF precipitation of South America are negatively correlated with the NAO. However, the coarse resolution of the precipitation data analyzed limited the quantification of the relationship between NAO and precipitation over the Central Andes on interdecadal timescales.
Here we focus on the impact of multidecadal SST variations on precipitation over the Central Andes from 10°S to 30°S. In this region, the Andes split into an eastern and a western Cordillera, separated by a high plateau, with a mean elevation of 3,600 m, commonly referred to as the Altiplano (Figure 1). The wet season over the Altiplano occurs between September and March of the following year (Garreaud et al., 2003). The maximum precipitation falling during austral summer is associated with the peak of the SAMS, when the enhanced upper-level easterly flow is established over the Central Andes (Garreaud et al., 2003). Moreover, Lenters and Cook (1997) show that rainfall in the Central Andes aids in further strengthening and southward displacing of the BH. Conversely, the dry season is characterized by steady upper-level westerly flow over the entire Central Andes (Garreaud et al., 2003; Vuille and Keimig, 2004; Garreaud et al., 2009; Segura et al., 2020).
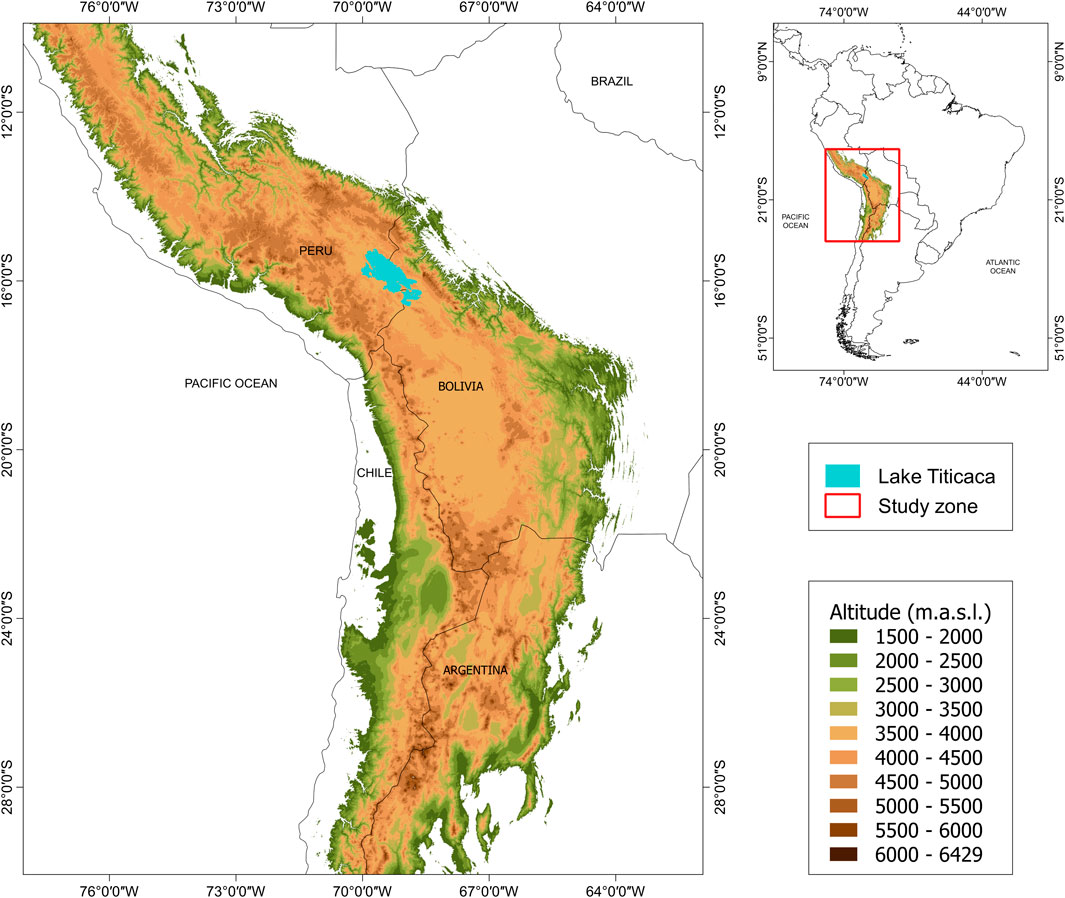
FIGURE 1. Location of the Central Andes. Shading indicates topographic elevation of the Andes mountains in m asl.
Vuille and Keimig (2004) found that DJF precipitation over the northern (i.e., southern Peruvian Andes) and southern (i.e., the central and southern Bolivian Altiplano) parts of the Central Andes are not always in phase and are not associated with the same regional mechanisms. For instance, wet summers over the northern Central Andes are associated with upper-level easterly wind anomalies in quasi-geostrophic balance with reduced meridional baroclinity due to low-latitude (mid-latitude) cooling (warming). In contrast, the upper-level easterly wind anomalies over the southern Central Andes during wet summers are caused by the southward displacement of Bolivian High that weakens upper-level westerly winds, thereby favoring episodic easterly transport of humid air masses toward the subtropical Andes.
On interdecadal timescales, Grimm and Saboia (2015) found that precipitation over the Peruvian Andes and the western Amazon present an interdecadal variability >20 years. Although Grimm and Saboia (2015) analyzed a coarse precipitation dataset (2.5° × 2.5°) for the 1950–2000 period, they found that the two first rotated EOFs of the interdecadal component (>20 years) of DJF precipitation over South America present significant precipitation anomalies over the Central Andes. REOF1 features precipitation anomalies over the Peruvian Altiplano and the southern and central parts of the Bolivian Altiplano. REOF2 presents positive anomalies over the Peruvian Altiplano while negative anomalies prevail over the northern Bolivian Altiplano. However, neither REOF1 nor REOF2 feature significant precipitation anomalies over the southern Peruvian Andes.
Hence most studies to date have focused on statistical linkages but have not fully explored dynamical causation. Furthermore, to our knowledge, hitherto no studies have investigated how the Pacific and Atlantic Oceans may influence precipitation specifically in the Central Andes on interdecadal timescales.
Although there have been studies on interdecadal precipitation variability over South America that disclosed links to global SST anomalies and climate indices (e.g., Flantua et al., 2016; He et al., 2021) and have shown circulation anomalies associated with spring and summer interdecadal precipitation modes, in this study we focus on the Central Andes. We intend to characterize the dynamical mechanisms through which DJF precipitation in the Central Andes is affected by the interdecadal components of the Niño 4 and Niño 1 + 2 indices (IN4 and IN1+2*), the IPO, the interdecadal variability of the Atlantic Ocean and the AMO. Our results thereby contribute to establishing a more robust predictive framework in this region, including a longer, decadal-scale planning horizon for implementing adaptation strategies to address rainfall extremes such as droughts, which significantly affect this region (Sulca et al., 2016; Andrade, 2018; SENAMHI, 2019; Zubieta et al., 2021).
This article is organized as follows. Section 2 discusses the data and Section 3 presents the methods that were applied. Section 4 presents the spatial characteristics of the interdecadal components of the SST anomalies over the equatorial Pacific Ocean (IN4 and IN1+2*), IPO, the interdecadal variability of the Atlantic Ocean and AMO indices in the 1921–2010 period. Section 5 presents the analysis of the impacts of the IN4, IN1+2*, IPO, the interdecadal variability of the Atlantic Ocean and AMO on the austral summer precipitation over the Central Andes on interdecadal timescales. Section 6 analyzes the interdecadal variability of the austral summer precipitation over the Central Andes. Finally, the last section summarizes this study and ends with some conclusions.
Monthly gridded precipitation (P) data over land from 1921 to 2010 was obtained from the Global Precipitation Climatology Centre (GPCC full v2020, http://gpcc.dwd.de; Schneider et al., 2020). The GPCC dataset has a horizontal resolution of 0.25° × 0.25°.
In addition, monthly gridded precipitation from the Peruvian Interpolated Data of SENAMHI’s Climatological and Hydrological Observations version 2.1 (PISCO v2.1; Aybar et al., 2020) and Rain for Peru and Ecuador (RAIN4PE v1.0; Fernandez-Palomino et al., 2021) datasets were used to quantify the uncertainties of the DJF precipitation over the tropical Andes from the GPCC dataset. PISCO v2.1 and RAIN4PE v1.0 have a horizontal resolution of 10 km × 10 km and cover the 1981–2015 period. PISCO v2.1 (RAIN4PE) can be downloaded freely at https://iridl.ldeo.columbia.edu/SOURCES/.SENAMHI/.HSR/.PISCO/.Prec/.v2p1/.unstable/.monthly/.Prec/(https://datapub.gfz-potsdam.de/download/10.5880.PIK.2020.010enouiv/). To compare all precipitation datasets, we performed a bilinear interpolation of PISCO v2.1 and RAIN4PE datasets from 10 km × 10 km to 25 km × 25 km horizontal resolution.
ERA-20C Reanalysis (Poli et al., 2016) monthly mean horizontal wind, sea level pressure and geopotential height data were obtained from the European Center for Medium-Range Weather Forecasts (ECMWF). The ERA-20C reanalysis has a horizontal resolution of 1° × 1° and covers the 1921–2010 period. We chose the ERA-20C reanalysis because Imfeld et al. (2019) pointed out that this reanalysis is one of the best products to reproduce austral summer climate over the southern Peruvian Andes in the 1964–2010 period on interannual timescales (see their Table 3). The ERA-20C reanalysis was also chosen because it reproduces the climatology of the South American Low-Level Jet (SALLJ) and the active SALLJ episodes well (Jones and Carvalho, 2018).
The SST dataset, HadISST v1.1, was obtained from the Met Office Hadley Centre (Rayner et al., 2003). The resolution of the HadISST data is 1° × 1° and covers the 1921–2019 period.
The AMO index time series was obtained from the National Oceanic and Atmospheric Administration-Physical Sciences Laboratory (NOAA-PSL; Enfield et al., 2001). The AMO index is computed as the time series of the area-weighted average of SSTs over the North Atlantic (0–70°N). The AMO index covers the 1921–2019 period, which can be downloaded freely at https://psl.noaa.gov/data/correlation/amon.us.long.mean.data.
The Niño 4, Niño 3.4 and Niño 1 + 2 indices for the western, central and eastern equatorial Pacific SST anomalies were obtained from the NOAA ESRL Physical Sciences Laboratory website (https://psl.noaa.gov/gcos_wgsp/Timeseries). The Niño 4, Niño 3.4 and Niño 1 + 2 indices were calculated as the averaged HadISST1 SST anomalies inside the regions (5°N–5°S, 160°E–150°W), (5°S–5°N, 170–120°W) and (0–10°S, 80–90°W), respectively.
The monthly time series of the South Pacific Convergence Zone (SPCZ) index proposed in Salinger et al. (2014) was used. The SPCZ index is based on the austral summer average of the difference of monthly precipitation between the Apia (13°48′S, 171°48′W) and the Suva (18°9′S, 178°26′E) stations and covers the 1921–2010 period.
The North Atlantic Oscillation (NAO) index was obtained from the Climatic Research Unit (CRU) (https://crudata.uea.ac.uk/cru/data/nao/nao_3dp.dat). The NAO index was calculated as the sea level pressure difference between Gibraltar and Iceland (Jones et al., 1997), scaled by a factor of −1.
We defined an index for the SST anomalies over the southern and northern parts of the tropical Atlantic Ocean (tSATL and tNATL) as the average inside of the regions (39.5°W–10.5°E, 23.5°S–0.5°N) and (60.5–10.5°W, 1.5–23.5°N), respectively. These two regions were defined in An et al. (2021).
The IPO index was obtained following the methodology described in Dong and Dai (2015). First, DD15 calculated a 3-year moving average of global SST for EOF analysis for the 1921–2010 period, and then applied two consecutive 9-year moving average filters on the principal component (PC) time series. Since the methodology proposed in DD15 allows us to focus on interdecadal variability of >20 years, we chose the same filter criterion proposed in DD15 to obtain the interdecadal component of the time series and gridded monthly datasets analyzed in this study.
The interdecadal component of the tSATL, tNATL, SPCZ, AMO, and NAO indices (ItSATL, ItNATL, ISPCZ, AMO, and INAO) were calculated by applying the same filter criterion described in DD15.
To establish the influence of the Pacific SST anomalies in the Niño 4 and the Niño 1 + 2 regions on SST patterns of the equatorial Pacific, we computed the interdecadal component of the Niño 4 and the Niño 1 + 2 indices (IN4 and IN1+2), again following the same methodology as described in DD15.
To isolate the effect of the SST anomalies over the IN1+2 index region, independent from Niño 3.4, on large-scale-circulation and precipitation over the Central Andes in DJF, we used the residual component of the regression of the Niño 1 + 2 index against the Niño 3.4 index. This new index is denotated as IN1+2*.
We extracted the interdecadal component of the SST anomalies and the standardized DJF precipitation over the Central Andes by applying the same filter criterion as described in DD15.
We computed the rotated principal components of the interdecadal variability of the standardized DJF precipitation over the Central Andes (10°S–30°S, 80.125°W–59.875°W) for the 1921–2010 period for topographic elevations above 1,500 m asl.
We also computed the rotated principal components of the interdecadal variability of the standardized DJF season for SST anomalies over the Atlantic Ocean (50.5°S–30.5°N, 89.5°W–9.5°E) for the 1921–2010 period. We labeled the three rotated principal components of the interdecadal variability of the standardized DJF SST anomalies over the Atlantic Ocean as IATL1, IATL2, and IATL3.
To describe the relationship between global SST anomalies and DJF precipitation over the Central Andes on interdecadal timescales, we performed a correlation analysis between the smoothed DJF SST field and the two rotated leading RPCs of the interdecadal component of the standardized DJF precipitation over the Central Andes.
To depict the impacts of the Pacific and Atlantic SST indices and climate modes (IN4, IN1+2, IPO, IN1+2*, AMO, IATL1, ItNATL, IATL2, ItSATL, and IATL3) on DJF precipitation over the Central Andes, we performed a correlation analysis between the time series of the ten SST indices (Figure 2) and the two leading rotated PCs of the DJF precipitation anomalies over the Central Andes during the 1921–2010 period. The statistical significance is based on a Student’s t-test that accounts for autocorrelation using the effective degrees of freedom (Davis, 1976; Chen, 1982; Zhao and Khalil, 1993; Dong and Dai, 2015).
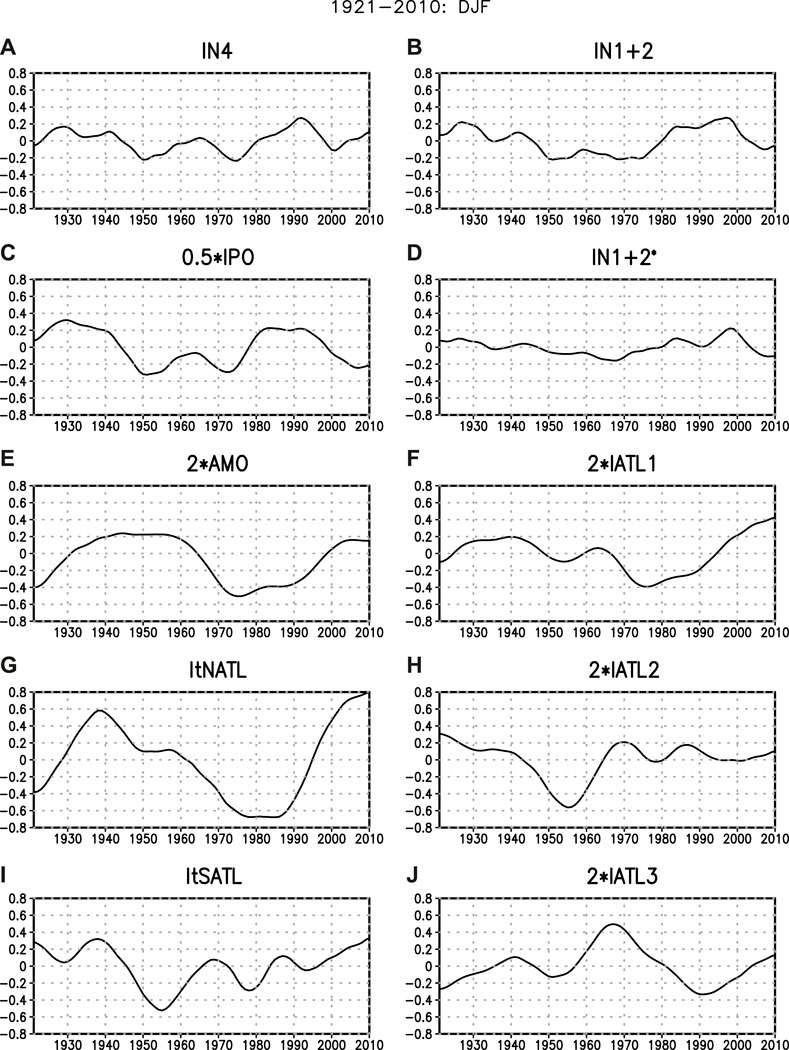
FIGURE 2. The DJF standardized time series of (A) Interdecadal Niño 4 (IN4) index, (B) Interdecadal Niño 1 + 2 (IN1+2) index, (C) Interdecadal Pacific Oscillation (IPO), (D) Interdecadal Niño 1 + 2 index with the Niño 3.4 influence removed (IN1+2*), (E) Atlantic Multidecadal Oscillation (AMO), (F) the first rotated principal component of the interdecadal variability of the Atlantic SST (IATL1), (G) Interdecadal tropical North Atlantic (ItNATL) index, (H) the second rotated principal variability of the interdecadal variability of the Atlantic SST (IATL2), (I) Interdecadal tropical South Atlantic (ItSATL) index, and (J) the third rotated principal component of the interdecadal variability of the Atlantic SST (IATL3). Note that the y-axis scale in (E), (F), (H) and (J) was rescaled by a factor of 2.
To identify changes in the regional atmospheric circulation over the Pacific Ocean and South America associated with the Pacific and Atlantic SST indices and climate modes (IN4, IN1+2, IPO, IN1+2*, AMO, IATL1, ItNATL, IATL2, ItSATL and IATL3; Figure 2) in DJF, we calculated the regression coefficients of the interdecadal components of the 200 hPa wind and geopotential height anomalies, 850 hPa humidity transport, divergence, and vertically integrated humidity transport onto standardized time series of the ten SST indices for the 1921–2010 period.
Figure 3 shows the spatial footprint of the individual indices by correlating their time series with the global SST field in DJF.
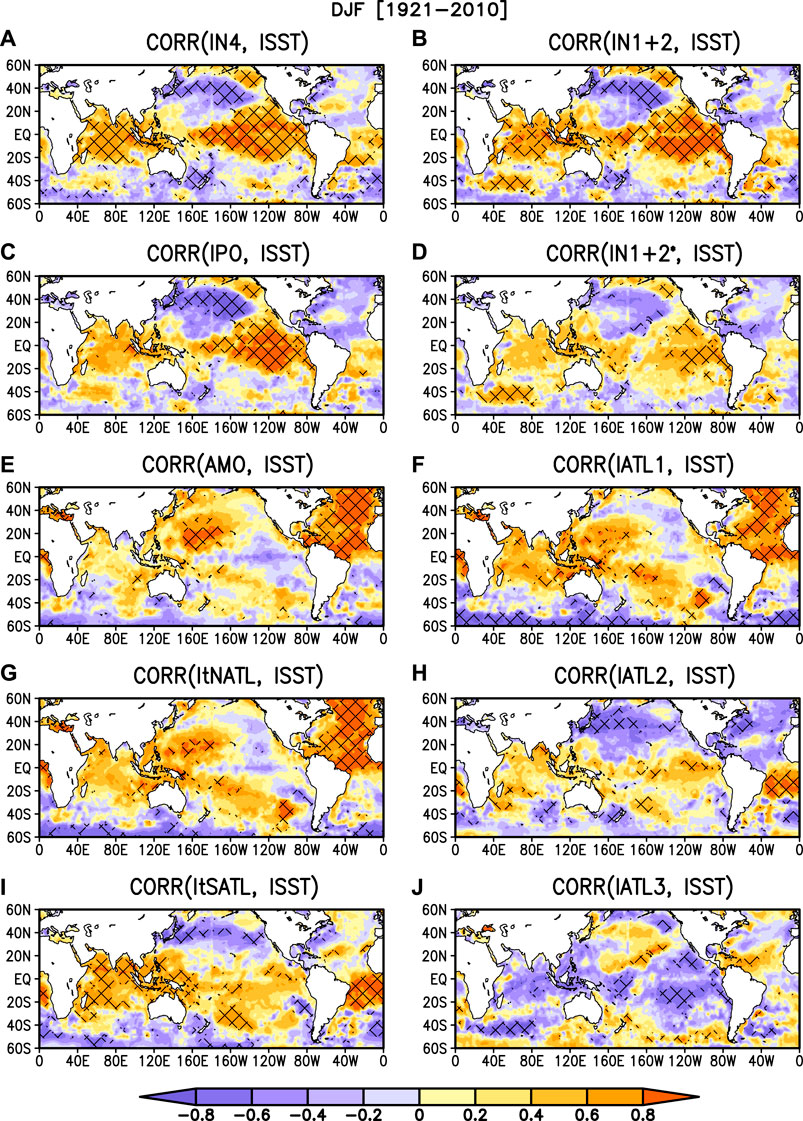
FIGURE 3. Spatial correlation of the interdecadal component of the sea surface temperature (ISSTA) anomalies (ISSTA, C°) with (A) Interdecadal Niño 4 (IN4) index, (B) Interdecadal Niño 1 + 2 (IN1+2) index, (C) Interdecadal Pacific Oscillation (IPO), (D) Interdecadal Niño 1 + 2 with Niño 4 removed (IN1+2*) index, (E) Atlantic Multidecadal Oscillation (AMO), (F) first rotated principal component of the interdecadal variability of the Atlantic SST (IATL1), (G) Interdecadal tropical North Atlantic (ItNATL) index, (H) second rotated principal component of the interdecadal variability of the Atlantic SST (IATL2), (I) Interdecadal tropical South Atlantic (ItSATL) index, and (J) third rotated principal component of the interdecadal variability of the Atlantic SST (IATL3). The analysis is based on austral summer (December-January-February, DJF) averages for the 1921–2010 period. Hatching represents a statistically significant correlation at the 95% confidence level.
The Interdecadal Niño 4 (IN4) index (Figure 3A) displays positive correlations over the entire equatorial Pacific, that extend toward California’s coast and the southern part of the eastern Pacific Ocean. The most significant positive correlations are located over the western and central parts of the equatorial Pacific Ocean and the entire Indian Ocean. At the same time, the positive IN4 phase is associated with negative correlations over the northern part of the North Pacific Ocean.
The Interdecadal Niño 1 + 2 (IN1+2) index (Figure 3B) resembles the SST anomaly pattern of the IN4 index, but the most significant positive correlations are located over the eastern equatorial Pacific and extend toward California’s coast and the Indian Ocean.
The spatial footprint of the IPO (Figure 3C) is characterized by significant positive correlations over much of the tropical Pacific, extending northward along the west coast of North America. The most significant positive correlations are restricted to the eastern Pacific Ocean, but do not reach the northwestern coast of South America. Negative correlations dominate over the North Pacific Ocean but are stronger than in the case of the IN4 and IN1+2. The lack of significant positive correlations over the Indian Ocean during the warm phase of the IPO is associated with the weaker intensity of the Walker cell during strong episodes of eastern Pacific El Niño than during strong episodes of the central Pacific El Niño (Sulca, 2021).
The IN1+2 index with the Pacific ENSO influence removed (IN1+2*, Figure 3D), presents positive correlations over the Indian Ocean and tropical Pacific, but significant positive correlations are also present over the eastern Pacific, extending toward the northwestern coast of South America. Negative correlations prevail over the tropical North Atlantic but are not significant.
Figure 3E illustrates the well-known AMO footprint, with positive correlations dominating the entire North Atlantic and weaker positive correlations located over the central North Pacific. Thus, our AMO footprint is consistent with the correlation pattern of the AMO documented in Enfield et al. (2001).
The first REOF of the interdecadal variability of the Atlantic SST (IATL1, Figure 3F), explaining 40.5% total variance, features positive correlations over the North Atlantic, the Indian Ocean and the South Pacific in the region of the SPCZ (Salinger et al., 2014). Significant positive correlations prevail over most of the North Atlantic and the Pacific north of 0°N. The IATL1 and the AMO are significantly positively correlated (r = 0.76, p < 0.05), indicating that first mode of the interdecadal variability of the North Atlantic SST is the AMO.
Figure 3G shows that the ItNATL warm phase resembles the SST patterns of the AMO and IATL1 warm phases (r = 0.87, p < 0.05 and r = 0.94, p < 0.05), but it also presents significant positive correlations over the SPCZ. The strong positive correlation between the ItNATL and the AMO is consistent with the numeric experiments documented in An et al. (2021), who found that the time series of the 8-year low-pass-filtered SST anomalies over the tropical North Atlantic and extratropical North Atlantic resemble the AMO index, indicating that the AMO signal is uniform over the entire North Atlantic.
The second REOF of the interdecadal variability of the Atlantic SST (IATL2, Figure 3H), explaining 30.6% of the total variance, presents significant positive correlations over the tropical South Atlantic, while the positive correlations over the northeastern Pacific, the Indian Ocean and the SPCZ are not statistically significant. Negative correlations are present over most of the North Atlantic.
Figure 3I illustrates that the ItSATL index resembles the SST pattern of the IATL2 (r = 0.82, p < 0.05), but it also presents significant positive correlations over the westernmost Pacific Ocean, the Indian Ocean and the SPCZ. In comparison with the IATL2, the ItSATL index cannot reproduce the negative correlations over the North Atlantic. Hence, the IATL2 is formed by the overlap of the cold phase of the AMO and the ItSATL warm phase.
Finally, the third REOF of the interdecadal variability of the Atlantic SST (IATL3, Figure 3J), representing 13.3% of total variance, features significant correlations over the South Atlantic and the Caribbean Sea. There is a band of significant positive correlations between 40 and 60°S extending from southeastern Australia to the southernmost tip of South America. This SST pattern resembles the positive phase of REOF2 of the DJF precipitation of South America for the interdecadal component >8 years documented in Grimm and Saboia (2015). These results suggest the equatorward propagation of extratropical Rossby wave trains from southeastern Australia to the southernmost part of the southern Atlantic Ocean (Drumond and Ambrizzi, 2008). Negative correlations dominate over most of the tropical Pacific, but significant negative correlations prevail over the eastern Pacific, extending toward California’s coast. This is consistent with the significant negative correlation of the IATL3 with the IN1+2 (r = −0.71, p < 0.05) and IN1+2* (r = −0.73, p < 0.05).
IATL3 is also positively correlated with the interdecadal component of the North Atlantic Oscillation (INAO) index (r = 0.92, p < 0.05). Moreover, the IATL3 and INAO share a similar global SST pattern (not shown), consistent with the correlation between the interdecadal sea level pressure component (ISLP) and the INAO, that features a correlation dipole over the North Atlantic (Supplementary Figure S1). The SST pattern of the IATL3 is quite similar to the positive phase of REOF2 of the interdecadal variability of summer precipitation over South America, which features a strong negative correlation with the NAO (Grimm and Saboia, 2015). Hence, the interdecadal component of the NAO is connected to the positive phase of IATL3.
Figures 4–7 show the spatial correlation and regression coefficients in DJF between the IN4, IN1+2, IPO, IN1+2*, AMO, IATL1, ItNATL, IATL2, ItSATL and IATL3 indices and the interdecadal component of precipitation over the Central Andes, and the large-scale 200 hPa wind and geopotential height, 850 hPa humidity transport, divergence, and vertically-integrated humidity transport fields, respectively.
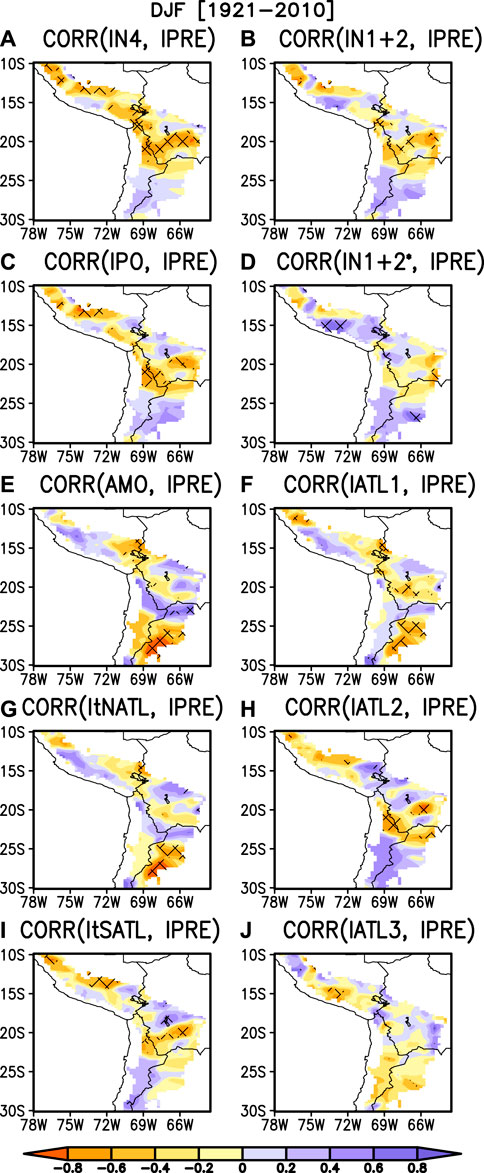
FIGURE 4. Spatial correlation of the interdecadal component of the DJF precipitation anomalies (IPRE, mm day−1) with (A) Interdecadal Niño 4 (IN4) index, (B) Interdecadal Niño 1 + 2 (IN1+2) index, (C) Interdecadal Pacific Oscillation (IPO), (D) Interdecadal Niño 1 + 2 with Niño 4 removed (IN1+2*) index, (E) Atlantic Multidecadal Oscillation (AMO), (F) first rotated principal component of the interdecadal variability of the Atlantic SST (IATL1), (G) Interdecadal tropical North Atlantic (ItNATL) index, (H) second rotated principal component of the interdecadal variability of the Atlantic SST (IATL1), (I) Interdecadal tropical South Atlantic (ItSATL) index, and (J) third rotated principal component of the interdecadal variability of the Atlantic SST (IATL3). Hatching represents a statistically significant correlation at the 95% confidence level. Analysis based on monthly precipitation data from the Global Precipitation Climatology Centre (GPCC). The analysis covers the 1921–2010 period.
The IN4 index is negatively correlated with precipitation over much of the Central Andes (north of 22°S), except the western Cordillera of the southern Peruvian Andes (Figure 4A). Consistent with this negative relationship in the highlands of the Central Andes, Figure 5A shows northwesterly wind anomalies dominating over the Central Andes at 200 hPa during the IN4 warm phase. Indeed, these upper-level westerly wind anomalies weaken the moisture transport from the lowlands toward the central Andes. The negative relationship over the eastern part of the central Peruvian Andes is associated with significant divergence anomalies and southeasterly anomalies of 850 hPa humidity transport along the eastern slope of the Andes Mountains (Figure 6A) and southeasterly anomalies of vertically integrated moisture transport (Figure 7A). These anomalies also suggest a weakening of the SALLJ during the IN4 warm phase.
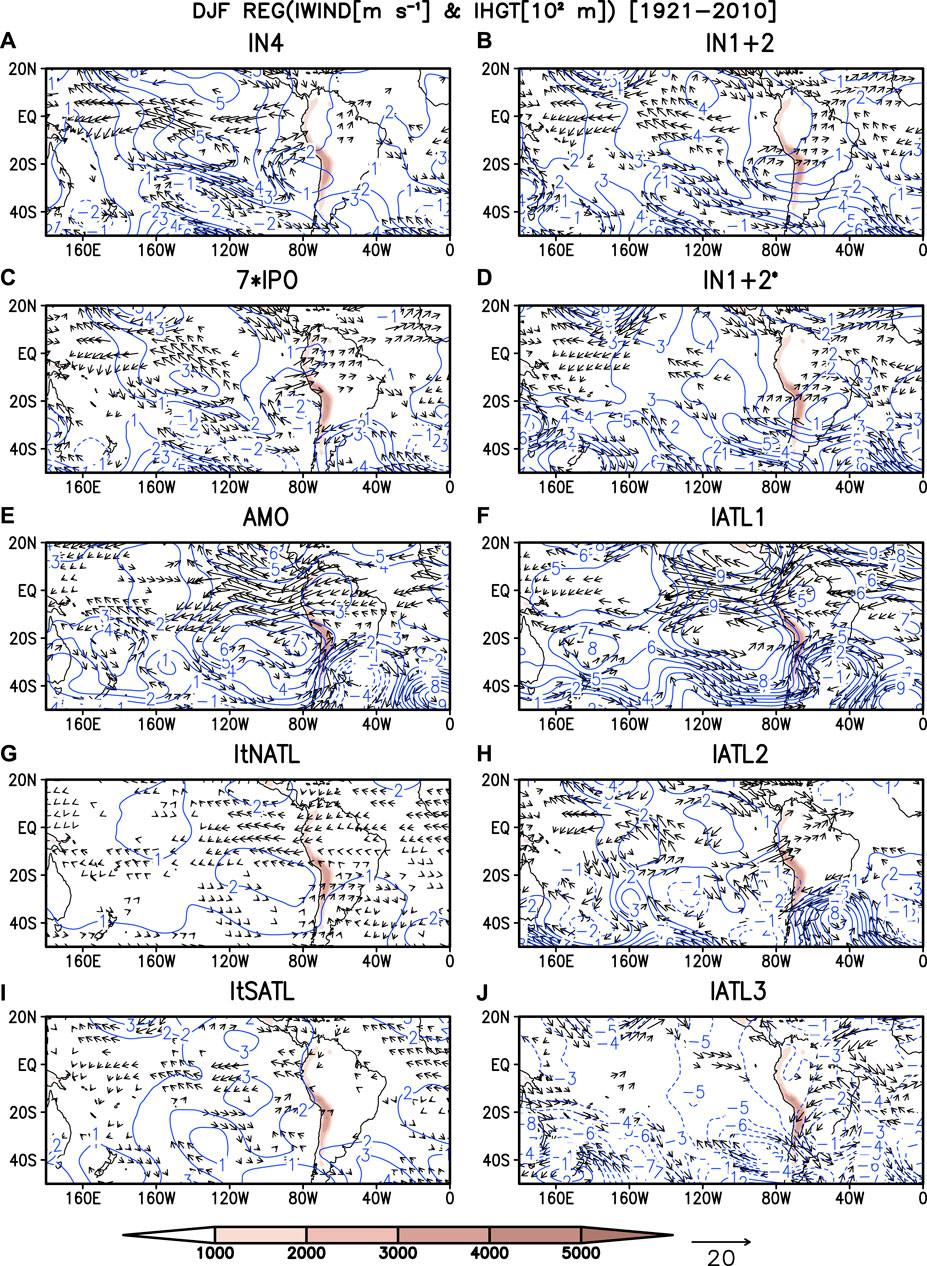
FIGURE 5. Linear regression coefficients between interdecadal component of the DJF wind and geopotential height anomalies over South America at 200 hPa and (A) the Interdecadal Niño 4 (IN4). (B) Interdecadal Niño 1 + 2 (IN1+2) index, (C) Interdecadal Pacific Oscillation (IPO), (D) Interdecadal Niño 1 + 2 with Interdecadal Niño 4 removed (IN1+2*), (E) Atlantic Multidecadal Oscillation (AMO), (F) the first rotated principal component of the interdecadal variability of the Atlantic SST (IATL1), (G) Interdecadal tropical North Atlantic (ItNATL) index, (H) the second rotated principal components of the interdecadal variability of the Atlantic SST (IATL2), (I) Interdecadal tropical South Atlantic (ItSATL) index, and (J) the third rotated principal component of the interdecadal variability of the Atlantic SST (IATL3). Values are in m s−1 and 102 m for one standard deviation of corresponding indices. Contour interval of geopotential height anomalies is 100 m per standard deviation and negative contours are dashed. The contours of geopotential height anomalies equal to zero were omitted. Black vectors have zonal and meridional components statistically significant at the 95% confidence level. Andes topography above 1,000 m is indicated by brown shading. The ERA-20C reanalysis was used in this analysis. Analysis covers the 1921–2010 period.
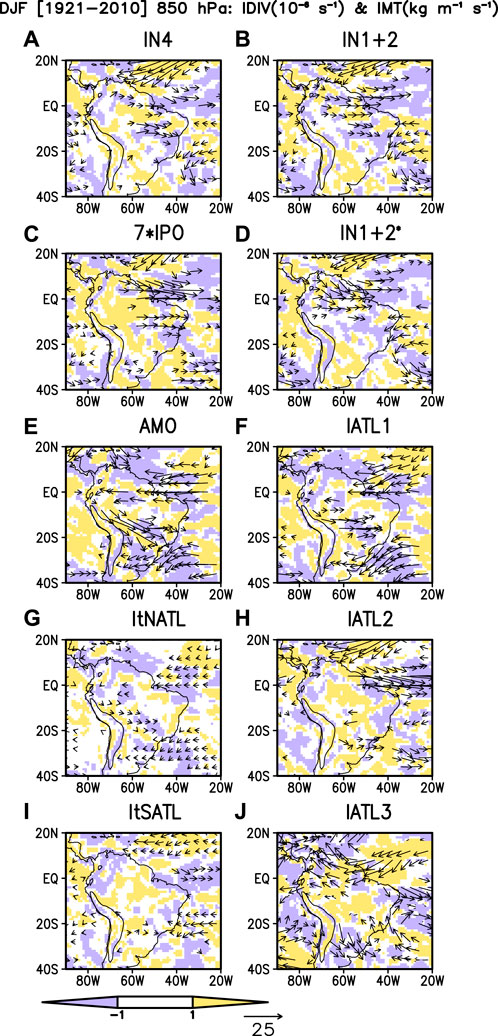
FIGURE 6. Linear regression coefficients between interdecadal component of the DJF humidity transport and divergence anomalies over South America at 850 hPa and (A) the Interdecadal Niño 4 (IN4), (B) Interdecadal Niño 1 + 2 (IN1+2) index, (C) Interdecadal Pacific Oscillation (IPO), (D) Interdecadal Niño 1 + 2 with Interdecadal Niño 4 removed (IN1+2*), (E) Atlantic Multidecadal Oscillation (AMO), (F) first rotated principal component of the interdecadal variability of the Atlantic SST (IATL1), (G) Interdecadal tropical North Atlantic (ItNATL) index, (H) second rotated principal component of the interdecadal variability of the Atlantic SST (IATL2), (I) Interdecadal tropical South Atlantic (ItSATL) index, and (J) third rotated principal component of the interdecadal variability of the Atlantic SST (IATL3). Values are in kg m s−1 and 10–6 s−1 for one standard deviation of corresponding indices. Black vectors and shading are statistically significant at the 95% confidence level. The black contour represents the topography of the tropical Andes at 1,500 m asl. The ERA-20C reanalysis was used in this analysis. The analysis covers the 1921–2010 period.
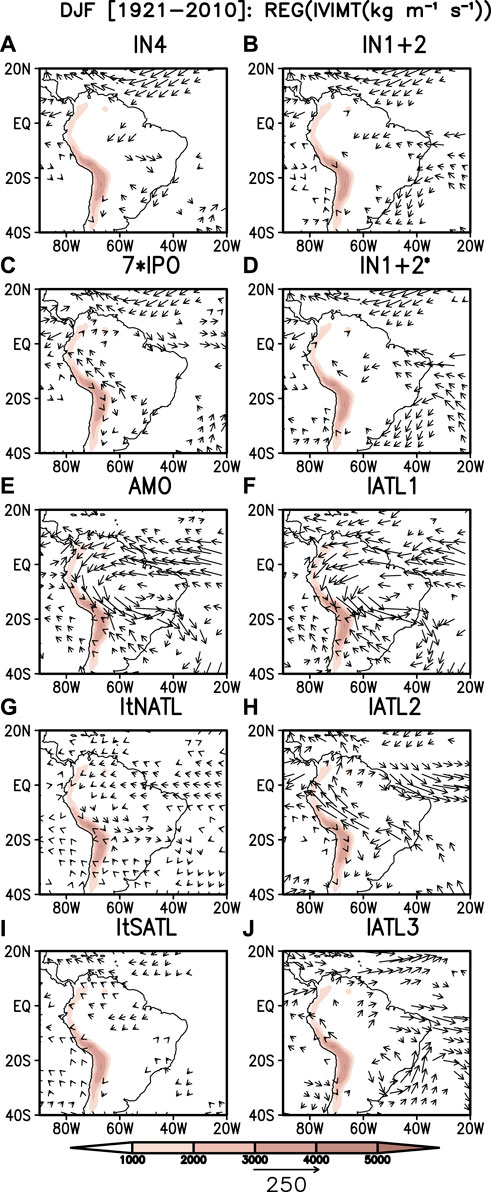
FIGURE 7. Linear regression coefficients between interdecadal component of the DJF vertically-integrated humidity transport anomalies over South America and (A) the Interdecadal Niño 4 (IN4), (B) Interdecadal Niño 1 + 2 (IN1+2) index, (C) Interdecadal Pacific Oscillation (IPO), (D) Interdecadal Niño 1 + 2 with Interdecadal Niño 4 removed (IN1+2*), (E) Atlantic Multidecadal Oscillation (AMO), (F) first rotated principal component of the interdecadal variability of the Atlantic SST (IATL1), (G) Interdecadal tropical North Atlantic (ItNATL) index, (H) second rotated principal component of the interdecadal variability of the Atlantic SST (IATL2), (I) Interdecadal tropical South Atlantic (ItSATL) index, and (J) third rotated principal component of the interdecadal variability of the Atlantic SST (IATL3). Values are in kg m s−1 for one standard deviation of corresponding indices. Black vectors and shading are statistically significant at the 95% confidence level. Andes topography above 1,000 m is indicated by brown shading. The ERA-20C reanalysis was used in this analysis. The analysis covers the 1921–2010 period.
The IN1+2 index shows a correlation pattern with precipitation that is similar to the IN4 footprint, but correlations are generally less significant than for the IN4 index (Figure 4B). Consistent with the negative correlations, a cyclonic circulation is established at 200 hPa to the south of the Central Andes, resulting in westerly wind anomalies dominating over the Central Andes at 200 hPa (Figure 5B). At low levels, the IN1+2 index presents quite similar patterns, but stronger, than in the IN4 warm phase (Figures 6B, 7B).
The correlation of the IPO index with precipitation (Figure 4C) is almost identical to the results obtained for the IN4 index (Figure 6A), but values are lower and less significant. The IPO is significantly negatively correlated with precipitation over most of the western Cordillera of southern Peru, and the western Bolivian and Chilean Altiplano (19°S–24°S) (Figure 4C). The dry anomalies again are in agreement with the significant westerly wind anomalies over the Central Andes at 200 hPa and the 850 hPa humidity transport and divergence, and vertically-integrated humidity transport fields during the IPO warm phase (Figure 5C, 6C, 7C).
The IN1+2* index shows a positive relationship with precipitation over much of the Central Andes, but the correlation coefficients are significant primarily over the southwestern Peruvian Cordillera (Figure 4D). This positive relationship appears to be at odds with the significant southwesterly wind anomalies that dominate over the Central Andes at 200 hPa (Figure 5D) during the IN1+2* warm phase. Figures 6D, 7D illustrate the existence of significant negative divergence anomalies over the Central Andes and significant southeasterly anomalies of 850 hPa humidity transport along both sides of the Andes Mountains. It suggests that the moisture influx is being induced by the anomalous southeasterly moisture transport along the coasts of southern and central Peru.
According to all these results, the location of the maximum SST anomalies over the equatorial Indo-Pacific plays a key role in the intensity and significance of the dry anomalies over the Central Andes through the modulation of the location and intensity of the upper-level westerly wind anomalies over the Central Andes on interdecadal timescales. Since the IN4 presents stronger significant dry anomalies over the Central Andes than the IN1+2, IPO, and IN1+2* indices, the warm phase of the central equatorial Pacific appears to be the major pathway through which interdecadal equatorial Pacific SST anomalies induce dry events over the Central Andes.
Figure 4E illustrates that the AMO is not significantly correlated with precipitation over the Central Andes, as negative correlations just barely reach significance over the southeasternmost part of the Central Andes (south of 25°S). This is consistent with the weak negative correlations over the Central Andes in the REOF1 of the interdecadal component of the DJF precipitation over South America during the AMO warm phase (Grimm and Saboia, 2015). The regression field of 200 hPa wind reveals that easterly and westerly wind anomalies tend to prevail over the Central Andes to the south and north of 22°S during the AMO warm phase (Figure 5E), explaining the significant negative correlations over the southeasternmost part of the Central Andes and the nonsignificant positive correlations over most of the Central Andes north of 23°S (Figure 4E). Significant low-level (850 hPa) northwesterly moisture flux anomalies, vertically-integrated moisture transport, and significant positive divergence anomalies along the eastern side of the Andes Mountains, suggest an enhanced SALLJ during the positive phase of the AMO (Figures 6E, 7E).
The precipitation anomalies during the positive phases of IATL1 and ItNATL resemble the one during the AMO warm phase, but IATL1 also features significant negative correlations over the southern Bolivian Altiplano and the central Peruvian Andes (Figures 4F,G). Moreover, the regression fields of the IATL1 and ItNATL indices also resemble the 200 hPa wind and geopotential height (Figures 5F,G), 850 hPa moisture flux, divergence (Figures 6F,G), and vertically-integrated moisture flux (Figures 7F,G) fields of the AMO, even though they are weaker than in the case of the AMO. But IATL1 features significant westerly moisture flux anomalies at 850 hPa over the southern and central parts of Brazil, suggesting that these low-level westerly anomalies weaken moisture transport from the Amazon basin to the southern Bolivian Andes (Figure 6F).
Figure 4H illustrates that IATL2 is significantly negatively correlated with precipitation over the tri-corner region between Bolivia, Chile and Argentina (22°S–24°S). The 200 hPa wind regression field reveals that easterly and westerly upper-level wind anomalies prevail over the Central Andes south and north of 20°S, respectively, during the IATL2 positive phase (Figure 5H), explaining the significant precipitation departures over the joint Bolivia/Chile/Argentina border region (Figure 4H). The regression fields of the 850 hPa moisture transport, vertically-integrated moisture transport and divergence anomalies are consistent with the 200 hPa wind anomalies. Indeed, the negative correlations over the northeastern Central Andes are associated with significant southwesterly moisture flux anomalies at 850 hPa and with vertically-integrated moisture flux and positive divergence along the eastern slope of the Central Andes, suggesting a weakening of the SALLJ (Figures 6H, 7H).
The IATL2 and ItSATL have quite similar correlation patterns with precipitation, but ItSATL features significant negative correlations over the western Cordillera of the southern Peruvian Andes. The 200 hPa wind and geopotential height anomalies, vertically integrated humidity transport, 850 hPa moisture flux and divergence fields (Figure 4I, 5I, 6I, 7I) show that the warm phase of ItSATL cannot reproduce the same large-scale patterns seen during the IATL2 positive phase.
Finally, Figure 4J illustrates that IATL3 is significantly negatively correlated with precipitation over the western Cordillera of the southern Peruvian Andes. The 200 hPa wind regression field reveals that westerly wind anomalies prevail over the Peruvian Andes and easterly and westerly wind anomalies over the Bolivian and Chilean Andes north and south of 25°S, respectively, during the positive phase of IATL3 (Figure 5J), consistent with the significant precipitation departures over the southern Peruvian Andes and the Bolivian/Chilean Altiplano (Figure 4J). These wind anomalies form part of an upper-level anticyclonic circulation anomaly, centered at 45°W, 25°S, suggesting a southeastward displacement of the Bolivian High. The divergence and vertically-integrated moisture transport regression fields reveal negative divergence anomalies over the entire Central Andes and Amazon basin and an anticyclonic circulation located over southeastern South America at 50°W, 25°S (Figures 6J, 7J). The southeastward displacement of the Bolivian High is dynamically tied to the southward displacement of the SACZ. Indeed, Drumond and Ambrizzi (2008) found that positive SST anomalies to the southeast of Australia can induce extratropical Rossby wave trains toward the southern part of the South Atlantic Ocean.
Since this study is focusing on the atmospheric teleconnections from the tropical Pacific and Atlantic SST to the Central Andes, we first compared the performance of the GPCC, PISCOv2.1 and RAIN4PE datasets by assessing how well they reproduce the well-known DJF correlation between the Niño 4 index and precipitation anomalies over the Central Andes seen in rain-gauge stations in the 1982–2015 period (Figure 8A). Figure 8B shows that the GPCC dataset accurately reproduces the significant negative correlations associated with the Niño 4 index over the Central Andes. Similarly, PISCOv2.1 features the same significant negative correlations (>−0.6, p < 0.05) associated with the Niño 4 index in the Central Andes, (Figure 8C). The good match between in-situ stations and the PISCOv2.1 dataset is no surprise since PISCOv2.1 is based on an interpolation of in-situ rain-gauge stations (Aybar et al., 2020). Here we show, however, that GPCC, despite its much lower station density, still is able to faithfully reproduce this relationship. (Figures 8A,C). RAIN4PE also reproduces the negative correlations associated with the Niño 4 index over most of the Central Andes (Figure 8D). In summary, these results show that the GPCC dataset adequately describes the interannual variability of the DJF precipitation over the Central Andes and is capable of reproducing the relationship between the Niño 4 index and DJF precipitation in the study region.
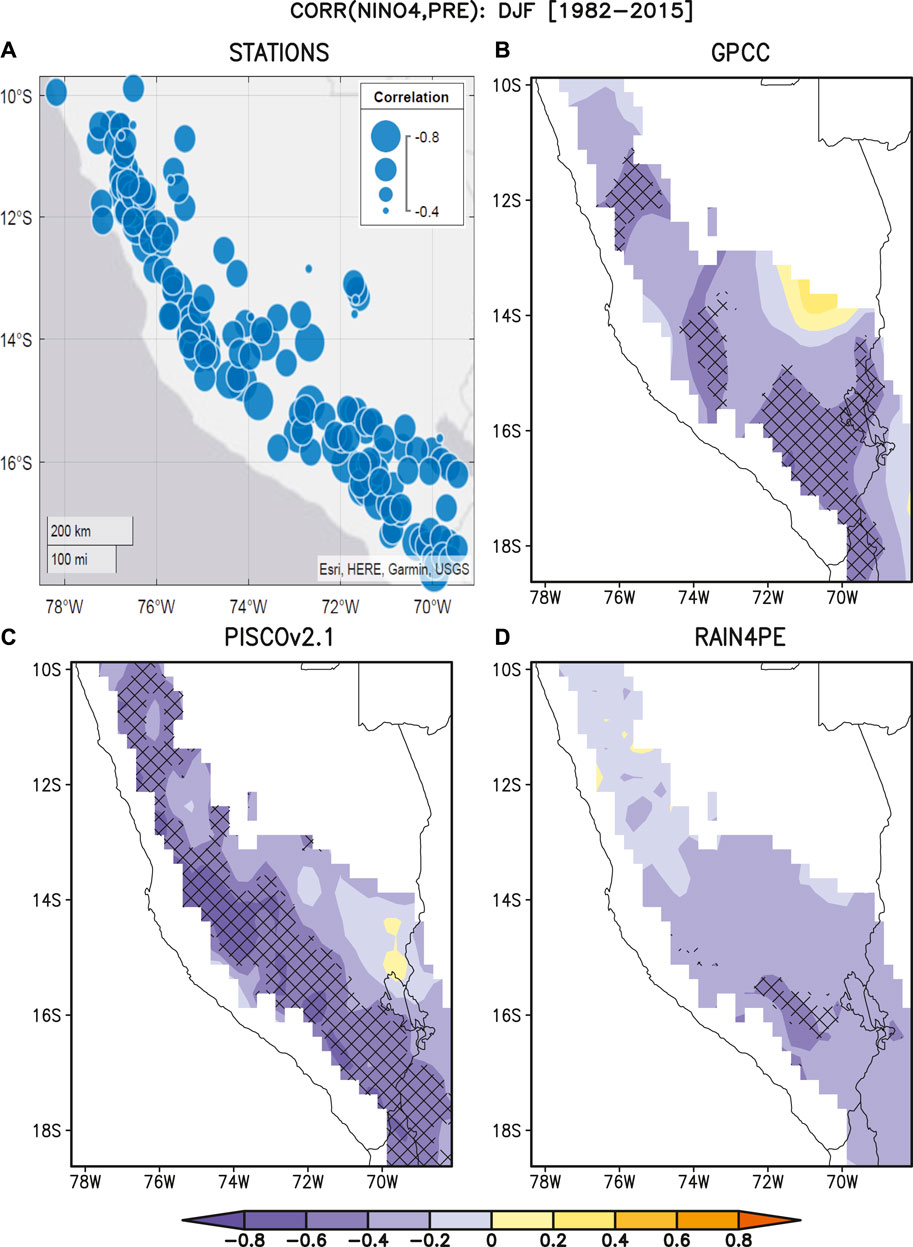
FIGURE 8. Spatial correlation between DJF anomalies of the Niño 4 index and DJF precipitation in the Central Andes above 1,500 m asl from (A) stations, (B) GPCC, (C) PISCOv2.1 and (D) RAIN4PE datasets. The analysis is based on the 1982–2015 period. Blue circles represent statistically significant correlation at the 95% confidence level in rain-gauge stations. Hatching indicates regions with a statistically significant correlations at the 95% confidence level.
We next compare the spatial correlation of the DJF precipitation anomalies between the different products in the 1982–2015 period on interannual timescales. Figure 9A shows that the DJF precipitation anomalies are significantly positively correlated between GPCC and PISCOv2.1 over most of the Central Andes.
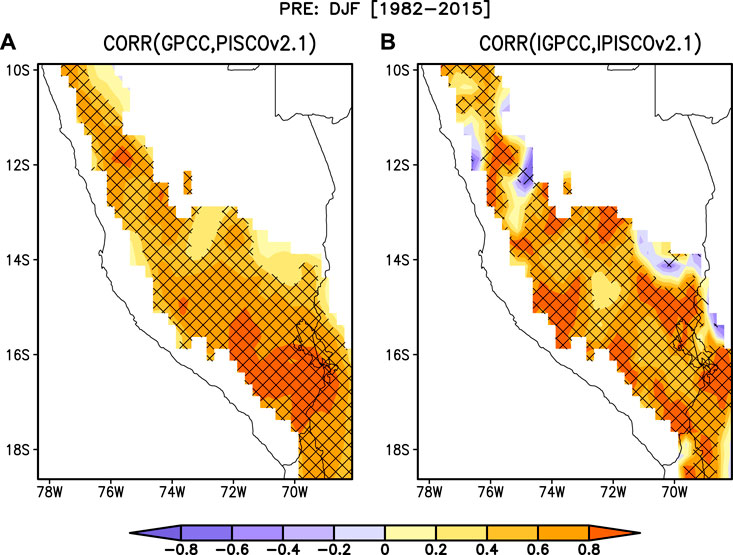
FIGURE 9. (A) Spatial correlation of the interannual DJF precipitation anomalies in the Central Andes above 1,500 m asl between GPCC and PISCO v2.1 datasets during the 1982–2015 period. (B) As in (A) but for the interdecadal component. Hatching indicates regions with a statistically significant correlation at the 95% confidence level.
We repeated the same correlation analysis for the interdecadal component of the DJF precipitation anomalies over the Central Andes between GPCC with PISCOv2.1 in the same 1982–2015 period (Figure 9B). Figure 9B shows that the interdecadal component of the DJF precipitation anomalies from GPCC and PISCOv2.1 are significantly positively correlated over most of the Central Andes. The positive correlations between IGPCC and IPISCOv2.1 indicate that GPCC reproduces the interdecadal signal of the DJF precipitation anomalies over the Central Andes as recorded by in-situ data.
Since the GPCC dataset reproduces the interannual and interdecadal signals of the DJF precipitation anomalies over most of the northern Central Andes (north of 18.4°S) in the 1982–2015 period as seen in the station-based PISCOv2.1 dataset, the gridded GPCC precipitation product appear suitable to accurately characterize the interdecadal variability of the summertime precipitation anomalies in the Central Andes in the 1982–2015 period. Although PISCOv2.1 does not extend back beyond 1981, we have confidence that the GPCC data can serve as a basis to analyze interdecadal precipitation variability prior to this time period. In fact, He et al. (2021) compared the joint influence of interdecadal Atlantic and Pacific SST variability on South American precipitation going back to 1920. They found that the results using the GPCC dataset are consistent with those from other datasets (CRU TS, and UDelaware), even if the uncertainty and associated errors will undoubtedly increase going back in time, as the station density decreases (see discussion in Becker et al., 2013, and Condom et al., 2020).
Finally, the results in Section 6.2 below will show that the interannual and interdecadal components of the DJF precipitation anomalies in the Central Andes as derived from the GPCC dataset are physically plausible and dynamically consistent with the atmospheric regional circulation anomalies over South America provided by the ERA-20C reanalysis in the 1921–2010 period.
In order to decompose the precipitation signal into the regional components with common interdecadal modes of variance, we applied a rotated empirical orthogonal function (REOF) based on the correlation matrix of the standardized seasonal DJF precipitation anomalies over the Central Andes for 1921–2010 period. The two leading rotated modes explain 40.4% and 18.6% of the total variance. Their two rotated EOFs have different precipitation patterns over the Central Andes (Figure 10). For instance, REOF1 features a dipole with high negative loadings over the Chilean Andes (23°S–30°S) and high positive loadings over the Bolivian Altiplano between 17°S and 23°S (Figure 10A). This indicates that DJF precipitation in the Bolivian Altiplano and Chilean Altiplano varies out-of-phase on interdecadal timescales.
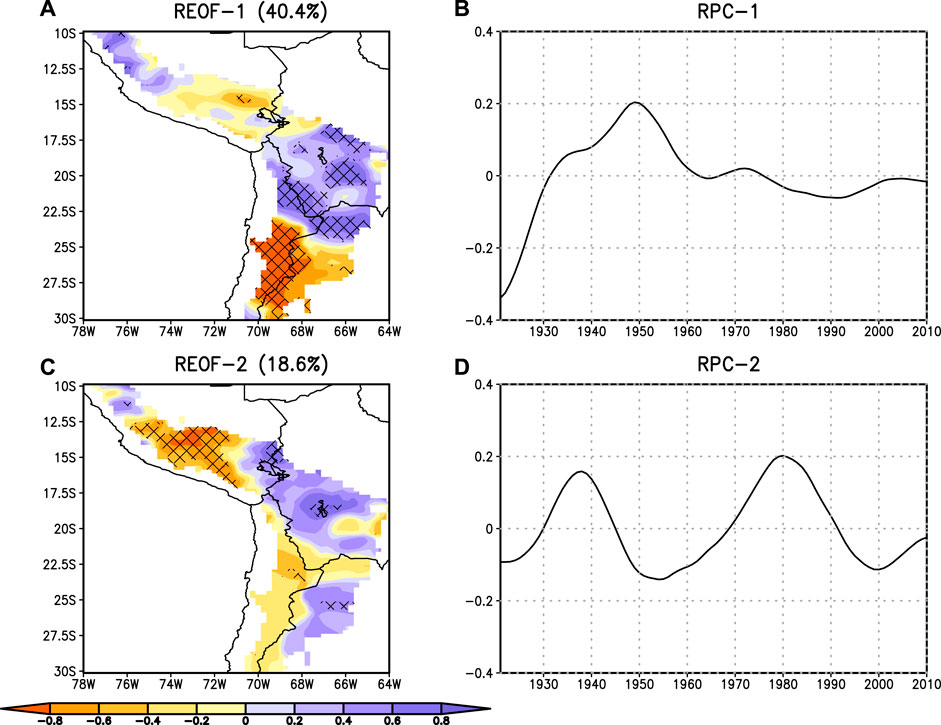
FIGURE 10. (A) The first REOF 1 of interdecadal DJF precipitation over the Central Andes. Number in parenthesis indicates total variance explained. Hatching indicates regions with a statistically significant correlation between the local REOF loading and the corresponding RPC at the 95% confidence level. Note that analysis is limited to regions above 1,500 m asl. (C) As in (A) but for REOF 2. (B) Time series of RPC1 of interdecadal DJF precipitation over the Central Andes. (D) As in (B) but for RPC2. Analysis based on the 1921–2010 period.
REOF2 features statistically significant loadings over the southern Peruvian Andes (12.5°S–17.5°S) (Figure 10B), in a spatial configuration that is reminiscent of an independent mode that was identified on interannual timescales by Vuille and Keimig (2004). According to these results, the precipitation over most of the Bolivian Altiplano is out-of-phase with precipitation over the northern and southern parts of the Central Andes on interdecadal timescales, suggesting that DJF precipitation over the Bolivian Altiplano is affected by two different large-scale forcings on interdecadal timescales.
To further investigate the causal relationship between wet phases on the Altiplano and the large-scale atmospheric circulation on interdecadal timescales, we analyzed the regression fields of the 200 hPa DJF wind and geopotential height, 850 hPa moisture flux and divergence and vertically integrated humidity transport fields, as well as the SST correlation fields associated with the time series of the two leading RPCs of the interdecadal component of DJF precipitation over the Central Andes (Figures 11, 12).
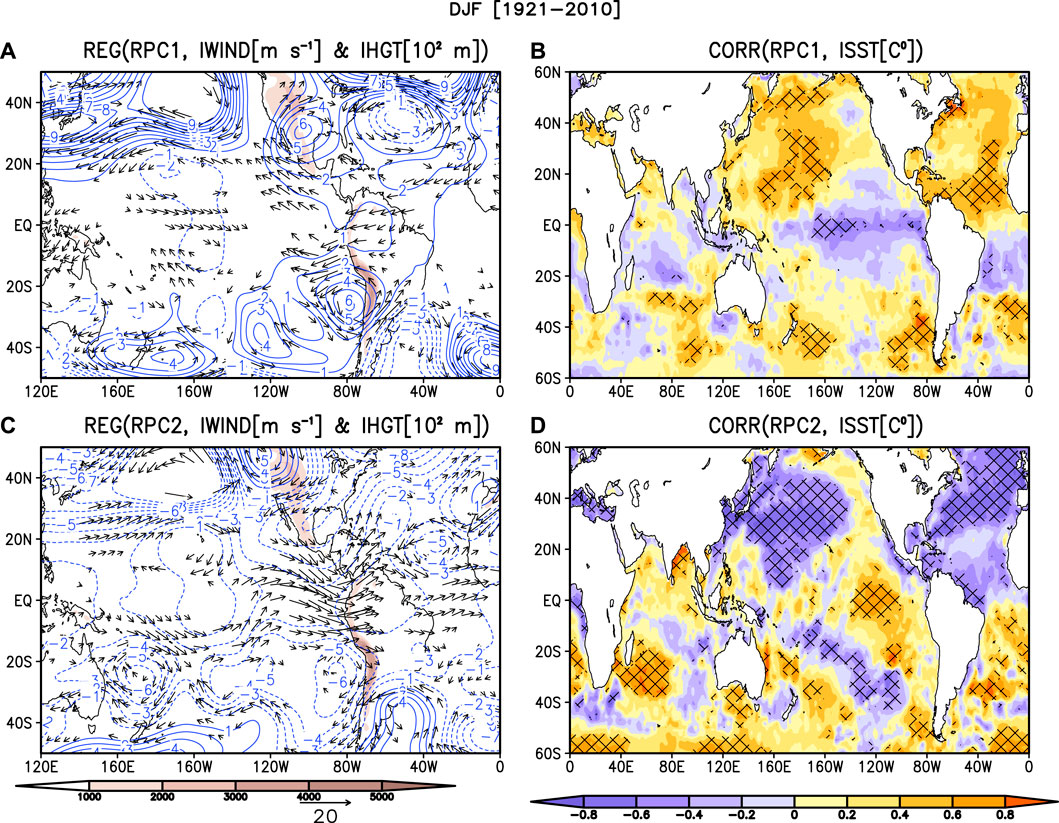
FIGURE 11. Linear regression coefficients between the interdecadal component of the DJF wind and geopotential height anomalies over South America at 200 hPa and (A) the first rotated principal component of the interdecadal variability of the DJF precipitation (RPC1) over the Central Andes. (C) As in (A) but for the second rotated principal component of the interdecadal variability of the DJF precipitation (RPC2). Values are in m s−1 and 100 m for one standard deviation of each corresponding RPC. The contours of geopotential height anomalies equal to zero were omitted and negative contours are dashed. Black vectors have zonal and meridional wind components statistically significant at the 95% confidence level. Andes topography above 1,000 m is indicated by brown shading. The analysis based on the ERA-20C reanalysis. (B,D) Correlation coefficients between RPC1 and RPC2 and the interdecadal component of the DJF global SST for the 1921–2010 period. Hatching represents a statistically significant correlation at the 95% confidence level. The analysis covers the 1921–2010 period.
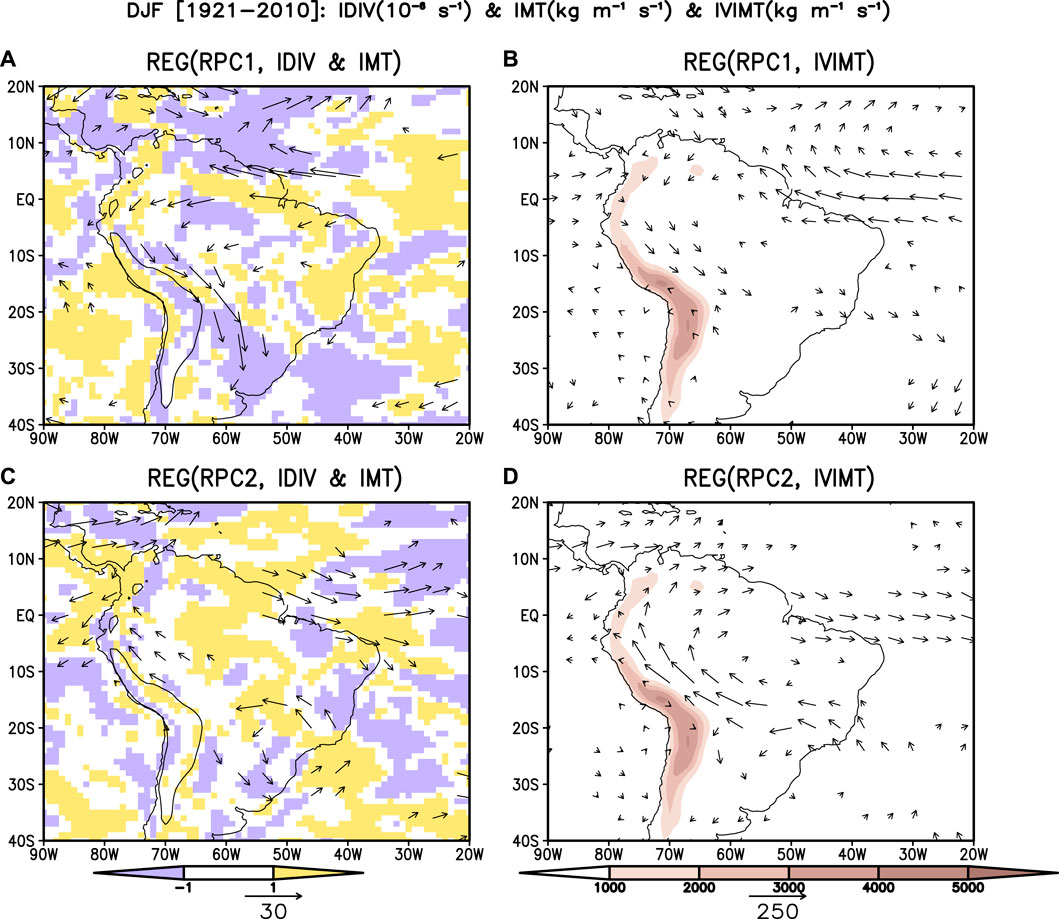
FIGURE 12. Linear regression coefficients between the interdecadal component of the DJF moisture transport and divergence anomalies over South America at 850 hPa and (A) the first rotated principal component of the interdecadal variability of the DJF precipitation over the Central Andes (RPC1). (C) As in (A) but for the second rotated principal component of the interdecadal variability of the DJF precipitation over the Central Andes (RPC2). (B,D) As in (A,C) but for vertically integrated moisture transport anomalies. The moisture transport (kg m−1 s−1 per standard deviation) anomalies statistically significant at the 95% confidence level are shown in bold. Shading represents divergence above (below) 1 × 10⁻⁶ s−1 (−1 × 10⁻⁶ s−1) per standard deviation. Black vectors are statistically significant at the 95% confidence level. Vectors are only shown where either zonal or meridional component is statistically significant at the 95% level. ERA-20C reanalysis was used in this analysis. The analysis is based on the 1921–2010 period.
The positive phase of RPC1 is associated with anomalous upper-level easterly wind anomalies over the central part of the Central Andes at 200 hPa, while westerlies prevail over the southern part of the Central Andes (south of 26°S), associated with a southwestern displacement of the Bolivian High (Figure 11A). Moreover, anomalous northwesterly 850 hPa moisture transport and vertically-integrated moisture flux occurs along the eastern side of the Peruvian Andes, while southeasterly vertically-integrated humidity flux dominates over the central and southern parts of the Central Andes during the warm phase of RPC1, indicating a strengthening of the SALLJ and enhanced moisture transport from the lowlands to the Bolivian Altiplano (Figures 12A,B). These low-level circulation anomalies are consistent with the negative and positive divergence anomalies over the central Peruvian Andes and the central part of the Central Andes, respectively (Figure 12A).
The enhancement of the easterly moisture flux from the lowlands toward the central part of the Central Andes may indicate enhanced turbulent entrainment and downward mixing of easterly momentum over the Andean ridge, as proposed being a key ingredient for wet summers over the Central Andes on interannual timescales (Garreaud et al., 2003; Vuille and Keimig, 2004). Our results suggest that a similar mechanism may also be dominant on interdecadal timescales.
The upper-level wind anomalies suggest a southwestward shift of the Bolivian High centered at 79°W, 27°S during the positive phase of RPC1. The SST correlation field indicates an SST dipole over the Atlantic, with negative correlations over the tropical South Atlantic and positive correlations over the North Atlantic, while negative correlations dominate over the central equatorial Pacific (Figure 11B). Thus, the SST pattern of the positive phase of REOF1 appears most closely associated with the negative phase of IATL2. This latter agrees with the significant negative correlation between RPC1 and IATL2 (r = −0.64, p < 0.05; Table 1).
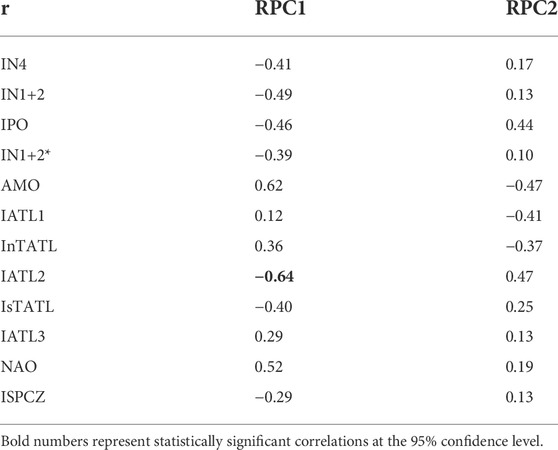
TABLE 1. DJF Pearson correlation coefficients between the first two RPCs of the interdecadal component of the DJF precipitation anomalies over the Central Andes with the Interdecadal Niño 4 (IN4) index, Interdecadal Niño 1 + 2 (IN1+2) index, Interdecadal Pacific Oscillation (IPO), Interdecadal Niño 1 + 2 index with the Niño 3.4 influence removed (IN1+2*), Atlantic Multidecadal Oscillation (AMO), the first three rotated principal component of the interdecadal variability of the SST anomalies over the Atlantic SST (IATL1, IATL2 and IATL3), Interdecadal tropical South Atlantic (ItSATL) index, Interdecadal tropical North Atlantic (ItNATL) index, Interdecadal North Atlantic Oscillation (INAO) index and Interdecadal South Pacific Convergence zone (ISPCZ) index. Values statistically significant at 95% are shown in bold. Analysis based on the 1921–2010 period.
Figure 11A also shows the presence of significant easterly wind anomalies over the central Peruvian Andes at 200 hPa, consistent with the positive precipitation loadings for regions north of 14°S. These 200 hPa easterly wind anomalies result in wet conditions over the central Peruvian Andes during the positive phase of RPC1 (Vuille et al., 2008) and they are consistent with the negative SST anomalies over the central Pacific Ocean (Figure 11B).
The positive phase of RPC2 is associated with anomalous upper-level westerly wind anomalies over the central and northern parts of the Central Andes at 200 hPa, while easterlies prevail over the southern part of the Central Andes (south of 25°S) (Figure 11C). At low-levels, there is significant anomalous 850 hPa southwesterly moisture transport and vertically-integrated humidity transport along the eastern side of the Peruvian Andes, indicative of a weakened SALLJ (Figures 12C,D). Northwesterly anomalies of vertically-integrated moisture transport prevail over the central part of the Central Andes between 16°S and 22°S (Figure 12D). These upper- and low-level circulation anomalies on interdecadal timescales induce the dry summers over the southern Peruvian Andes through the reduction of the easterly moisture flux from the lowlands toward the Andes.
The easterly wind anomalies over the southern Central Andes are part of an anticyclonic circulation anomaly centered at 45°W, 35°S in the upper troposphere (Figure 11C), and over southeastern Brazil centered at 50°W, 22°S (Figure 12C) at low levels. This anomalous anticyclone indicates a southward displacement of the SACZ, consistent with the significant positive SST anomalies over the southern South Atlantic. At the same time an SST dipole over the southwestern Pacific Ocean is indicative of a southward displacement of the SPCZ (Figure 11D).
Comparing the 200 hPa wind and geopotential height fields of the REOF2 and AMO indices, the negative phase of the AMO reproduces the 200 hPa wind and geopotential height fields associated with the positive phase of REOF2, but the anticyclonic circulation located over the southern coast of the South Atlantic is weaker than in IATL1. The visual correspondence of the regression fields is consistent with the positive correlation between REOF2 and AMO; however, the relationship is statistically not significant (Table 1). The weakening of this anticyclonic circulation during the positive phase of the REOF2 is consistent with the significant positive correlation over the eastern equatorial Pacific that strengthens and expands westerly wind anomalies toward the southern part of the Central Andes. These results suggest that the positive phase of REOF2 may be associated with the linear superposition of the negative phase of the AMO and the warm phase of the eastern equatorial Pacific.
To characterize the potential influence of the interdecadal variability of the Pacific and Atlantic Oceans and several interdecadal climate modes on austral summer precipitation over the Central Andes for the 1921–2010 period, we analyzed the time series of the leading rotated EOF’s of the interdecadal component of the DJF precipitation over the Central Andes.
The IPO index, as Dong and Dai (2015) proposed, is significantly positively correlated with the IN4 and IN1+2 indices. The warm SST anomalies over the central part of the equatorial Pacific Ocean are associated with the significant positive SST anomalies over the Indian Ocean.
The warm phase of the IN4, IN1+2 and IPO indices induce significant dry anomalies over much of the Western Central Andes, except the southwestern Peruvian Andes, with the IN4 index showing the strongest impact. Our results reveal that the warm SST anomalies over the central equatorial Pacific have a substantial impact on the DJF precipitation over the Central Andes on interdecadal timescales, with the IN4 index better describing this relationship than the commonly employed IPO. These dry anomalies are induced by upper-level westerly wind anomalies over the Central Andes.
The REOF analysis of interdecadal SST variability in the Atlantic Ocean resulted in three leading modes with different spatial patterns. IATL1 features warm SST anomalies over the North Atlantic, which is related to the AMO warm phase. The positive phase of IATL2 is characterized by cold SST anomalies over most of the North Atlantic and warm SST anomalies over the tropical South Atlantic. IATL3 presents warm SST anomalies over the central North Pacific and the Caribbean Sea and a band of warm SST anomalies that extend from southeastern Australia to the southernmost tip of South America. IATL3 also is negatively correlated with the NAO.
The positive phase of IATL1 provokes significant dry anomalies over the northwestern Argentinean Andes and the southwestern Bolivian Andes, induced by upper-level westerly wind anomalies over the central and southern parts of the Central Andes. The positive phase of IATL2 induces significant dry anomalies over the Chilean/Bolivian Andes through upper-level westerly wind anomalies over the central and northern part of the Central Andes, while upper-level easterly wind anomalies prevail over the southern Central Andes south of 25°S. Moreover, the positive phase of the IATL3 index causes statistically significant dry anomalies over the western Cordillera of southern Peru, induced by upper-level westerly anomalies over the Central Andes (north of 19°S).
The suitability of the GPCC dataset for analyzing low-frequency precipitation variability in the Central Andes has not been analyzed in previous studies, although He et al. (2021) did so on a continental scale. Here we show that the GPCC dataset can serve as a useful dataset to analyze the interdecadal variability of DJF precipitation over the Central Andes in the 1921–2010 period, although caution should be exercised in the interpretation of the results in regions with very low rain-gauge station density, such as the Amazonian slope of the Peruvian Andes, (Figure 8A).
The REOF analysis of interdecadal precipitation variability in the Central Andes resulted in two leading modes with different spatial patterns of DJF precipitation variability. REOF1 presents a dipole mode with positive loadings over the Bolivian Altiplano, northern Chile and northernmost Argentina, while the highest negative loadings occur over the southern Central Andes (south of 23°S). Vuille and Keimig (2004) found this same characteristic pattern when analyzing the interannual variability of DJF precipitation over the Central Andes. REOF2 is characterized by significant negative loadings over the southern Peruvian Andes.
During the positive phase of RPC1, a significant upper-level anticyclonic circulation prevails over the southern Central Andes at 200 hPa, potentially indicative of an easterly upper-level entrainment of low-level moisture from the lowlands toward the Bolivian Altiplano during wet summers on interdecadal timescales. Garreaud et al. (2003) documented this moisture transport mechanism for wet summers over the Central Andes on interannual timescales. Hence, this easterly moisture flux mechanism may be a key ingredient for precipitation on the Bolivian Altiplano on both interannual and interdecadal timescales. At the same time, easterly wind anomalies prevail over Peru during the positive phase of RCP1, thereby contributing to the wet anomalies observed over the central Peruvian Andes, but not for the southern Peruvian Andes. Again, this mechanism is consistent with interannual atmospheric circulation anomalies documented over the central Peruvian Andes during wet summers (Vuille et al., 2008). The dry anomalies over the southern Peruvian Andes are associated with a weakened SALLJ that reduces the moisture flux from the Amazon basin to the southern Peruvian Andes.
The positive phase of RPC2 features significant upper-level westerly wind anomalies over the northern Central Andes at 200 hPa, indicative of a reduced moisture transport from the lowlands toward the southern Peruvian Andes during dry summers in the northern Central Andes on interdecadal timescales.
In this study we provided a first broad assessment of the dynamical mechanisms and teleconnections that relate austral summer precipitation over the Central Andes with multidecadal modes of coupled ocean-atmosphere variability in the Atlantic and Pacific Oceans. While more detailed analyses will be required to further investigate and confirm some of the proposed mechanisms, our results provide a first contribution toward establishing a more robust understanding of this low-frequency oceanic influence on climate variability in the Central Andes. Incorporating this hitherto neglected multidecadal component into such assessments is key when trying to develop a better long-term climate prediction framework for the region (Zhou and Lau, 1998).
The original contributions presented in the study are included in the article/Supplementary Material, further inquiries can be directed to the corresponding author.
Conceptualization, JS; methodology, JS, MV, and BD; analysis, JS, MV, and BD; writing—original draft preparation; JS, MV, and BD; writing—revised version of the draft; JS, MV, and BD.
JS was funded by Peruvian PPR 068 program “Reducción de vulnerabilidad y atención de emergencias por desastres.” MV was partially funded by NSF awards OISE-1743738 and EAR-2103041. This study was performed using computational resources, including the HPC-Linux-Cluster, from the Laboratorio de Dinámica de Fluidos Geofísicos Computacionales at the Instituto Geofísico del Perú (grant 101-2014-FONDECYT).
Finally, the authors are very grateful to two reviewers and Editor AT who provided us with valuable comments, which helped us to advance our results and to improve the manuscript.
The authors declare that the research was conducted in the absence of any commercial or financial relationships that could be construed as a potential conflict of interest.
All claims expressed in this article are solely those of the authors and do not necessarily represent those of their affiliated organizations, or those of the publisher, the editors and the reviewers. Any product that may be evaluated in this article, or claim that may be made by its manufacturer, is not guaranteed or endorsed by the publisher.
The Supplementary Material for this article can be found online at: https://www.frontiersin.org/articles/10.3389/feart.2022.954954/full#supplementary-material
SUPPLEMENTARY FIGURE S1 | Spatial correlation of interdecadal component of the sea level pressure (ISLP) anomalies with the Interdecadal 1179 North Atlantic Oscillation (INAO) index. The analysis is based on austral summer (December-January-February, DJF) 1180 averages for the 1921–2010 period. Hatching represents a statistically significant correlation at the 95% confidence level.
An, X., Wu, B., Zhou, T., and Liu, B. (2021). Atlantic multidecadal oscillation drives interdecadal Pacific variability via tropical atmospheric bridge. J. Clim. 34, 5543–5553. doi:10.1175/JCLI-D-20-0983.1
Andrade, M. F. (2018). Atlas - clima y eventos extremos del Altiplano Central Perú-Boliviano/Climate and extreme events from the Central Altiplano of Peru and Bolivia 1981-2010. Geogr. Bernensia 188. doi:10.4480/GB2018.N01
Aybar, C., Fernandez, C., Huerta, A., Lavado, W., Vega, F., and Felipe-Obando, O. (2020). Construction of a high-resolution gridded rainfall dataset for Peru from 1981 to the present day. Hydrological Sci. J. 65, 770–785. doi:10.1080/02626667.2019.1649411
Barichivich, J., Gloor, E., Peylin, P., Brienen, R. J. W., Schöngart, J., Espinoza, J.-C., et al. (2018). Recent intensification of Amazon flooding extremes driven by strengthened Walker circulation. Sci. Adv. 4, eaat8785. doi:10.1126/sciadv.aat8785
Becker, A., Finger, P., Meyer-Christoffer, A., Rudolf, B., Schamm, K., Schneider, U., et al. (2013). A description of the global land-surface precipitation data products of the Global Precipitation Climatology Centre with sample applications including centennial (trend) analysis from 1901–present. Earth Syst. Sci. Data 5, 71–99. doi:10.5194/essd-5-71-2013
Chen, T.-S., Weng, S.-P., and Schubert, S. (1999). Maintenance of austral summertime upper-tropospheric circulation over tropical South America: The Bolivian High–Nordeste Low system. J. Atmos. Sci. 56, 2081–2100. doi:10.1175/1520-0469(1999)056,2081:MOASUT.2.0.CO;2
Chen, W. Y. (1982). Fluctuations in Northern hemisphere 700 mb height field associated with the Southern Oscillation. Mon. Wea. Rev. 110, 808–823. doi:10.1175/1520-0493(1982)110<0808:FINHMH>2.0.CO;2
Condom, T., Martínez, R., Pabón, J. D., Costa, F., Pineda, L., Nieto, J. J., et al. (2020). Climatological and hydrological observations for the south American Andes: In situ stations, satellite, and reanalysis data sets. Front. Earth Sci. 8, 92. doi:10.3389/feart.2020.00092
Dai, A. (2013). The influence of the inter-decadal Pacific oscillation on US precipitation during 1923–2010. Clim. Dyn. 41, 633–646. doi:10.1007/s00382-012-1446-5
Davis, R. E. (1976). Predictability of sea surface temperature and sea level pressure anomalies over the North Pacific Ocean. J. Phys. Oceanogr. 6, 249–266. doi:10.1175/1520-0485(1976)006<0249:possta>2.0.co;2
Deser, C., Phillips, A. S., and Hurrel, J. (2004). Pacific interdecadal climate variability: Linkages between the tropics and the north pacific during boreal winter since 1990. J. Clim. 17, 3109–3124. doi:10.1175/1520-0442(2004)017<3109:PICVLB>2.0.CO;2
Dong, B., and Dai, A. (2015). The influence of the Interdecadal Pacific Oscillation on temperature and precipitation over the globe. Clim. Dyn. 45, 2667–2681. doi:10.1007/s00382-015-2500-x
Dong, B., Dai, A., Vuille, M., and Timm, O. E. (2018). Asymmetric modulation of ENSO teleconnections by the interdecadal Pacific oscillation. J. Clim. 31, 7337–7361. doi:10.1175/JCLI-D-17-0663.1
Drumond, A. R. M., and Ambrizzi, T. (2008). The Role of the South Indian and Pacific Oceans in South American Monsoon Variability. Theor. Appl. Climatol. 94, 125–137. doi:10.1007/s00704-007-0358-5
Enfield, D. B., Mestas-Nuñez, A. M., and Trimble, P. (2001). The Atlantic Multidecadal Oscillation and its relation to rainfall and river flows in the continental U.S. Geophys. Res. Lett. 28 (10), 2077–2080. doi:10.1029/2000GL012745
Fernández-Palomino, C. A., Hattermann, F. F., Krysanova, V., Lobanova, A., Vega-Jácome, F., Lavado, W., et al. (2021). A novel high-resolution gridded precipitation dataset for Peruvian and Ecuadorian watersheds – development and hydrological evaluation. J. Hydrometeor. 23, 309–336. doi:10.1175/jhm-d-20-0285.1
Figliuolo, G. C., Andreoli, R. V., Kayano, M. T., Da Costa, J. A. C., Rego, W. H. T., and De Moraes, D. S. (2020). The role of the Atlantic Multidecadal Oscillation precondition in the teleconnection of different El Niño-Southern Oscillation types and impacts on the 15°N–15°S South American sector precipitation. Int. J. Climatol. 40, 1943–1964. doi:10.1002/joc.6309
Flantua, S. G. A., Hooghiemstra, H., Vuille, M., Behling, H., Carson, J. F., Gosling, W. D., et al. (2016). Climate variability and human impact in South America during the last 2000 years: Synthesis and perspectives from pollen records. Clim. Past. 12, 483–523. doi:10.5194/cp-12-483-2016
Garreaud, R., Vuille, M., and Clement, A. C. (2003). The climate of the Altiplano: Observed current conditions and mechanisms of past changes. Palaeogeogr. Palaeoclimatol. Palaeoecol. 194, 5–22. doi:10.1016/S0031-0182(03)00269-4
Garreaud, R., Vuille, M., Compagnucci, R., and Marengo, J. (2009). Present-day south American climate. Palaeogeogr. Palaeoclimatol. Palaeoecol. 281, 180–195. doi:10.1016/j.palaeo.2007.10.032
Grimm, A. M. (2011). Interannual climate variability in south America: Impacts on seasonal precipitation, extreme events and possible effects of climate change. Stoch. Environ. Res. Risk Assess. 25 (4), 537–554. doi:10.1007/s00477-010-0420-1
Grimm, A. M., Laureanti, N. C., Rodakoviski, R. B., and Gama, C. B. (2016). Interdecadal variability and extreme precipitation events in South America during the monsoon season. Clim. Res. 68 (2-3), 277–294. doi:10.3354/cr01375
Grimm, A. M., Dominguez, F., Cavalcanti, I. F. A., Cavazos, T., Gan, M. A., Silva Dias, P. L., et al. (2020). “south and north American monsoons: Characteristics, life cycle, variability, modelling and prediction,” in The multi-scale global monsoon system, world scientific series on asia-pacific weather and climate. Editors C. P. Chang, K.-J. Ha, R. H. Johnson, D. Kim, G. N. C. Lau, and B. Wang (Singapore: World Scientific Publishing Company), 11, 49–66. 978-981-121-659-6. Chapter 5.
Grimm, A. M., and Saboia, J. P. J. (2015). Interdecadal variability of the South American precipitation in the Monsoon season. J. Clim. 28, 755–775. doi:10.1175/JCLI-D-14-00046.1
He, Z., Dai, A., and Vuille, M. (2021). The joint impacts of Atlantic and Pacific multidecadal variability on South American precipitation and temperature. J. Clim. 34, 1–55. doi:10.1175/JCLI-D-21-0081.1
Humanes-Fuente, V., Ferrero, M. E., Muñoz, A. A., González-Reyes, Á., Requena-Rojas, E. J., Barichivich, J., et al. (2020). Two centuries of hydroclimatic variability reconstructed from tree-ring records over the Amazonian Andes of Peru. J. Geophys. Res. Atmos. 125 (18), 1–29. doi:10.1029/2020JD032565
Hurrell, J. W., Kushnir, Y., Visbeck, M., and Ottersen, G. (2003). An overview of the north atlantic oscillation the North atlantic oscillation: Climate significance and environmental impact. Geophys Monogr. Amer. Geophys. Union. 134, 1–35. doi:10.1029/GM134
Imfeld, N., Barreto-Schuler, C., Correa-Marrou, K. M., Jacques-Coper, M., Sedlmeier, K., and Gubler, S. (2019). Summertime precipitation deficits in the southern Peruvian highlands since 1964. Int. J. Climatol. 39, 4497–4513. doi:10.1002/joc.6087
Jones, C., and Carvalho, L. M. V. (2018). The influence of the Atlantic multidecadal oscillation on the eastern Andes low-level jet and precipitation in South America. npj Clim. Atmos. Sci. 1 (40). doi:10.1038/s41612-018-0050-8
Jones, P. D., Jónsson, T., and Wheeler, D. (1997). Extension to the North Atlantic Oscillation using early instrumental pre ssure observations from Gibraltar and South-West Iceland. Int. J. Climatol. 17, 1433–1450. doi:10.1002/(SICI)1097-0088(19971115)17:13<1433::AID-JOC203>3.0.CO;2-P
Kayano, M. T., and Capistrano, V. B. (2014). How the Atlantic multidecadal oscillation (AMO) modifies the ENSO influence on the South American rainfall. Int. J. Climatol. 34, 162–178. doi:10.1002/joc.3674
Kodama, Y. (1992). Large-scale common features of subtropical precipitation zones (the Baiu frontal zone, the SPCZ, and the SACZ) Part I: Characteristics of subtropical frontal zones. J. Meteorological Soc. Jpn. 70, 813–836. doi:10.2151/jmsj1965.70.4_813
Lagos, P., Silva, Y., Nickl, E., and Mosquera, K. (2008). El Niño - related precipitation variability in Perú. Adv. Geosci. 14, 231–237. doi:10.5194/adgeo-14-231-2008
Lenters, J. D., and Cook, K. H. (1997). On the origin of the Bolivian high and related circulation features of the south American climate. J. Atm. Sci. 54, 656–678. doi:10.1175/1520-0469(1997)054<0656:OTOOTB>2.0.CO;2
Li, J., Sun, C., and Jin, F. F. (2013). NAO implicated as a predictor of Northern Hemisphere mean temperature multidecadal variability. Geophys. Res. Lett. 40, 5497–5502. doi:10.1002/2013GL057877
Liebmann, B., Kiladis, G. N., Marengo, J. A., Ambrizzi, T., and Glick, J. D. (1999). Submonthly convective variability over South America and the South Atlantic convergence zone. J. Clim. 12 (7), 1877–1891. doi:10.1175/1520-0442(1999)012<1877:SCVOSA>2.0.CO;2
Liu, Z. Y. (2012). Dynamics of interdecadal climate variability: A historical perspective. J. Clim. 25, 1963–1995. doi:10.1175/2011JCLI3980.1
Mantua, N. J., Hare, S. R., Zhang, Y., Wallace, J. M., and Francis, R. C. A. (1997). Pacific interdecadal climate oscillation with impacts on salmon production. Bull. Am. Meteorol. Soc. 78, 1069–1080. doi:10.1175/1520-0477(1997)078<1069:APICOW>2.0.CO;2
Marengo, J. A., Liebmann, B., Grimm, A. M., Misra, V., Silva Dias, P. L., Cavalcanti, I. F. A., et al. (2012). Recent developments on the South American monsoon system. Int. J. Climatol. 32, 1–21. doi:10.1002/joc.2254
Montini, T. L., Jones, C., and Carvalho, L. M. V. (2019). the South American low-level jet: A new climatology, variability, and changes. J. Geophys. Res. Atmos. 124, 1200–1218. doi:10.1029/2018JD029634
Poli, P., Hersbach, H., Dee, D. P., Berrisford, P., Simmons, A. J., Vitart, F., et al. (2016). ERA-20C: An atmospheric reanalysis of the twentieth century. J. Clim. 29, 4083–4097. doi:10.1175/JCLI-D-15-0556.1
Power, S., Folland, C., Colman, A., and Mehta, V. (1999). Inter-decadal modulation of the impact of ENSO on Australia. Clim. Dyn. 15, 319–324. doi:10.1007/s003820050284
Raia, A., and Cavalcanti, I. F. A. (2008). The life cycle of the South American monsoon system. J. Clim. 21, 6227–6246. doi:10.1175/2008JCLI2249.1
Rayner, N. A., Parker, D. E., Horton, E. B., Folland, C. K., Alexander, L. V., Rowell, D. P., et al. (2003). Global analyses of sea surface temperature, sea ice, and night marine air temperature since the late nineteenth century. J. Geophys. Res. 108 (D14), 4407. doi:10.1029/2002JD002670
Salinger, M. J., McGree, S., Beucher, F., Power, S. B., and Delage, F. (2014). A new index for variations in the position of the South Pacific convergence zone 1910/11–2011/2012. Clim. Dyn. 43, 881–892. doi:10.1007/s00382-013-2035-y
Scaife, A., Folland, C. K., Alexander, L. V., Moberg, A., and Knight, J. R. (2008). European climate extremes and the north atlantic oscillation. J. Clim. 21, 72–83. doi:10.1175/2007JCLI1631.1
Schneider, U., Becker, A., Finger, P., Rustemeier, E., and Ziese, M. (2020) GPCC full data monthly product version 2020 at 0.25°: Monthly land-surface precipitation from rain-gauges built on GTS-based and historical data. doi:10.5676/DWD_GPCC/FD_M_V2020_025
Segura, H., Espinoza, J.-C., Junquas, C., and Takahashi, K. (2016). Evidencing decadal and interdecadal hydroclimatic variability over the Central Andes. Environ. Res. Lett. 11, 094016. doi:10.1088/1748-9326/11/9/094016
Segura, H., Espinoza, J.-C., Junquas, C., Lebel, T., Vuille, M., and Garreaud, R. (2020). Recent changes in the precipitation-driving processes over the southern tropical Andes/western Amazon. Clim. Dyn. 54, 2613–2631. doi:10.1007/s00382-020-05132-6
SENAMHI (2019). Caracterización espacio temporal de las sequías en los departamentos altoandinos del Perú (1981-2018). Lima: SENAMHI, 29.
Sulca, J. (2021). Evidence of nonlinear Walker circulation feedbacks on extreme El Niño Pacific diversity: Observations and CMIP5 models. Int. J. Climatol. 41, 2934–2961. doi:10.1002/joc.6998
Sulca, J., Vuille, M., Silva, Y., and Takahashi, K. (2016). Teleconnections between the Peruvian central Andes and Northeast Brazil during extreme rainfall events in austral summer. J. Hydrometeorol. 17, 499–515. doi:10.1175/JHM-D-15-0034.1
Timmerman, A., Okumura, Y., An, S. I., Clement, A., Dong, B., Guilyardi, E., et al. (2007). The influence of a weakening of the Atlantic meridional overturning circulation on ENSO. J. Clim. 20, 4899–4919. doi:10.1175/JCLI4283.1
Vuille, M., Bradley, R. S., and Keimig, F. (2000). Interannual climate variability in the Central Andes and its relation to tropical Pacific and Atlantic forcing. J. Geophys. Res. 105, 12447–12460. doi:10.1029/2000JD900134
Vuille, M., Kaser, G., and Juen, I. (2008). Glacier mass balance variability in the Cordillera Blanca, Peru and its relationship with climate and the large-scale circulation. Glob. Planet. Change 62 (1-2), 14–28. doi:10.1016/j.gloplacha.2007.11.003
Vuille, M., and Keimig, F. (2004). Interannual variability of summertime convective cloudiness and precipitation in the central Andes derived from ISCCP-B3 data. J. Clim. 17, 3334–3348. doi:10.1175/1520-0442(2004)017,3334:IVOSCC.2.0.CO;2
Zhang, Y., Wallace, J. M., and Battisti, D. S. (1997). ENSO-Like interdecadal variability: 1900–93. J. Clim. 10 (5), 1004–1020. doi:10.1175/1520-0442(1997)010<1004:ELIV>2.0.CO;2
Zhao, W., and Khalil, M. A. K. (1993). The relationship between precipitation and temperature over the contiguous United States. J. Clim. 6, 1232–1236. doi:10.1175/1520-0442(1993)006<1232:TRBPAT>2.0.CO;2
Zhou, J., and Lau, K. M. (1998). Does a monsoon climate exist over South America? J. Clim. 11, 1020–1041. doi:10.1175/1520-0442(1998)011,1020:DAMCEO.2.0.CO;2
Keywords: precipitation, Central Andes, Interdecadal Pacific Oscillation (IPO), Atlantic Multidecadal Oscillation (AMO), tropical South Atlantic, El Niño SST indices
Citation: Sulca J, Vuille M and Dong B (2022) Interdecadal variability of the austral summer precipitation over the Central Andes. Front. Earth Sci. 10:954954. doi: 10.3389/feart.2022.954954
Received: 27 May 2022; Accepted: 15 August 2022;
Published: 12 September 2022.
Edited by:
Andrea Taschetto, University of New South Wales, AustraliaReviewed by:
Juan Antonio Rivera, CONICET Argentine Institute of Nivology, Glaciology and Environmental Sciences (IANIGLA), ArgentinaCopyright © 2022 Sulca, Vuille and Dong. This is an open-access article distributed under the terms of the Creative Commons Attribution License (CC BY). The use, distribution or reproduction in other forums is permitted, provided the original author(s) and the copyright owner(s) are credited and that the original publication in this journal is cited, in accordance with accepted academic practice. No use, distribution or reproduction is permitted which does not comply with these terms.
*Correspondence: Juan Sulca, c3VsY2FmNUBnbWFpbC5jb20=
Disclaimer: All claims expressed in this article are solely those of the authors and do not necessarily represent those of their affiliated organizations, or those of the publisher, the editors and the reviewers. Any product that may be evaluated in this article or claim that may be made by its manufacturer is not guaranteed or endorsed by the publisher.
Research integrity at Frontiers
Learn more about the work of our research integrity team to safeguard the quality of each article we publish.