 Jing Peng
 Li Dan1
- 1CAS Key Laboratory of Regional Climate-Environment for Temperate East Asia, Institute of Atmospheric Physics, Chinese Academy of Sciences, Beijing, China
- 2Laboratory of Cloud-Precipitation Physics and Severe Storms (LACS), Institute of Atmospheric Physics, Beijing, China
The radiative forcing of spatially varying carbon dioxide (CO2) concentrations has modified the climate by altering surface energy, the water budget, and carbon cycling. Over the past several decades, due to anthropogenic emissions, atmospheric CO2 concentrations in the whole terrestrial ecosystem have become greater than the global mean. The relationship between climatic variables and net primary production (NPP) can be regulated by the radiative forcing of this spatial variation. The present results show that owing to the radiative forcing of spatially varying CO2 concentrations, NPP has reduced globally by −0.6 Pg C yr−1. Region 2, with increased CO2 and decreased NPP, shows the greatest reductions, by −0.7 Pg C yr−1. Variations of both NPP and CO2 concentrations are distributed asymmetrically. As human activities are mainly located in the Northern Hemisphere, increased CO2 has mainly manifested in these regions. Especially in region 2, with increased CO2 and decreased NPP, increasing downward longwave radiation has heated the ground surface by 2.2 W m−2 and raised surface temperatures by 0.23°C. At the same time, due to the radiative forcing of spatial variations in CO2 concentrations, local dependence of NPP on soil moisture has increased due to enhanced temperature and evapotranspiration coupling, which may improve negative NPP anomalies locally, especially in region 2. With continued increasing CO2 concentrations, its spatial variation due to radiative forcing is likely to amplify warming and have a negative impact on NPP in the terrestrial ecosystem.
Highlights
• Radiative forcing of non-uniform CO2 concentrations after 1956 has decreased terrestrial NPP globally by −0.7 Pg C yr−1
• Enhanced temperature and ET coupling due to radiative forcing of spatial variations in CO2 concentrations have a negative impact on NPP, especially in region 2 with increased CO2 concentrations and decreased NPP
• Enhanced downward longwave radiation is a main contributor to widely increased surface temperatures caused by radiative forcing of spatially varying CO2 concentrations
1 Introduction
As the most important driving force behind current climate change, the radiative forcing of atmospheric carbon dioxide (CO2) concentrations affects the trends, mean, and interannual variations of global carbon fluxes (Friedlingstein et al., 2013; Friedlingstein 2015; Schimel et al., 2015; Sitch et al., 2015; Friedlingstein et al., 2020). In the high latitudes of the Northern Hemisphere, temperatures have risen mainly in response to the increase in the radiative forcing of rising atmospheric CO2 concentrations, which can promote the production of terrestrial ecosystems (Govindasamy and Caldeira, 2000; Peng and Dan, 2015; Etminan et al., 2016; Govindasamy and Caldeira, 2000; Peng and Dan, 2015; Yuan et al., 2019). Conversely, at low latitudes, higher temperatures do not promote vegetation production (Cox et al., 2013; Piao et al., 2020). Radiative forcing by higher CO2 concentrations modifies vegetation production and respiration of the terrestrial ecosystem and ultimately regulates the concentration of CO2 in the atmosphere (Cox et al., 2013; Ballantyne et al., 2017). Therefore, understanding how the radiative forcing of CO2 concentrations affects the terrestrial carbon cycle could be beneficial for predictions regarding climate change (Friedlingstein et al., 2006; Ramaswamy et al., 2019; Friedlingstein et al., 2020).
The influence of atmospheric CO2 concentrations on terrestrial carbon fluxes (i.e., the net primary production, NPP) is mainly expressed in two ways: one is a fertilization effect of CO2 concentrations, and the other is the radiative effect. Increased atmospheric CO2 concentrations affect the global carbon cycle not only through their effect on plant physiology but also through their radiative greenhouse effect. Increasing CO2 concentrations tend to enhance downward longwave radiation, prompting changes in temperature and precipitation and, thus, generating changes in plant photosynthesis rates, carbon allocation, and soil respiration. This driver of climate change is referred to as “CO2 radiative forcing,” which is different from CO2 physiological forcing. Due to the latter effect, increases in CO2 concentration can enhance photosynthesis and, ultimately, NPP (Ainsworth and Long, 2005; Medlyn et al., 2015).
The non-uniformity of the concentration of CO2 refers to its spatial variation. The terrestrial carbon cycle will be modified by the radiative forcing of spatially varying atmospheric CO2 concentrations. For example, previous studies have shown that changes in CO2 radiative forcing lead to changes in the spatial responses of terrestrial carbon flux (Friedlingstein 2015; Canadell et al., 2021), as atmospheric CO2 radiative forcing can be regulated through changes in the average background states (e.g., RNET, atmospheric circulation patterns, surface temperature, and rainfall) (Cao et al., 2010; Peng et al., 2014). The radiative forcing of CO2 is partly regulated by anthropogenic carbon emissions, which can lead to other spatial differences in CO2 concentrations in addition to the effect of vegetation growth. Under climate change, therefore, there is an urgent need to quantitatively assess changes in carbon fluxes caused by the radiative forcing of spatially varying CO2 concentrations.
Currently, there are still large uncertainties in the modeling of the intensity of the radiative forcing effect of CO2 concentrations combined with feedback processes of cloud–aerosol interaction and poleward energy transports through radiative forcing (Myhre et al., 2013; Huang et al., 2017). There also is a lack of research on the influence of the radiative forcing of spatially varying CO2 concentrations on NPP. Although results suggest that there are clear spatial differences in atmospheric CO2 concentrations at regional scales (Nassar et al., 2013; Falahatkar et al., 2017), how and why the associated radiative forcing of spatial variations in CO2 concentrations affects NPP remains unknown (Wang et al., 2019).
In this study, we carried out simulations of different forcing scenarios, including non-uniform and uniform CO2 concentrations, and then studied the changes in the response of terrestrial carbon fluxes. The influence of the radiative forcing of spatially varying CO2 concentrations on terrestrial carbon fluxes can be detected by changes in the climate state, including the surface energy budget, atmospheric circulation, surface temperature, and rainfall. However, there is a limited number of studies on the effects of the radiative forcing of spatially varying CO2 concentrations on carbon fluxes in the terrestrial ecosystem. The overarching goal of this study was to assess the impacts of the radiative forcing of spatially varying CO2 concentration on the NPP of terrestrial ecosystems. Thus, we focused on answering two main scientific questions: 1) How does the radiative forcing of spatially varying CO2 concentrations alter the climate state? 2) What changes have occurred in the response of terrestrial carbon fluxes to the radiative forcing of spatial variations in CO2 concentrations, and what are the reasons behind these changes?
2 Methods and simulations
2.1Methods
We simulated corresponding changes in climatic variables and NPP due to the radiative forcing of spatial variations in CO2 concentrations from 1850 to 2005. We took the mean of the last 50 years to ensure the carbon cycle balance of our model. We explored the contribution of each component in the surface energy budget to temperature, which was regulated by the inhomogeneity of CO2 radiative forcing.
A linear regression approach was used to quantify the sensitivity of the dependent variable (y) to the independent variable (x). This method was applied by Poulter et al. (2014) as follows:
where
According to the Stefan–Boltzmann law, the radiation emitted by the surface land determines the surface temperature. Such surface temperature is regulated by the balance of net shortwave radiation, net longwave radiation, sensible heat, latent heat, and ground heat flux:
where
2.2 Model
We used version 2.0 of the FGOALS–AVIM model at a resolution of 2.81 × 1.66. This version of FGOALS has previously been used to assess the effects of CO2 radiative forcing on the total cloud fraction, temperature, and water vapor under different abruptly quadrupling CO2 concentrations (Chen et al., 2014; Capistrano et al., 2020). Evaluations of the model performance have revealed that FGOALS can quite reasonably reproduce the mean annual GPP (gross primary production) and NPP (Wang et al., 2013), the mean summer evapotranspiration (ET), and mean annual runoff in the Lake Baikal basin (Törnqvist et al., 2014); and the major global-scale biogeochemical fluxes and pool sizes of carbon (Peng and Dan, 2014).
The model used in this study, i.e., FGOALS-s2 (Bao et al., 2013), was one of the models that participated in CMIP5 (phase 5 of the Coupled Model Intercomparison Project) and was also used as an assessment tool in the fifth Assessment Report of the Intergovernmental Panel on Climate Change. It is a fully coupled Earth system model consisting of four independent components that simultaneously simulate Earth’s atmosphere (SAMIL2), ocean (LICOM2), surface (AVIM), and sea ice (CSIM) and includes a central coupler component (CPL6). It has an interactive carbon cycle model in the land component and an ecosystem–biogeochemical module in the ocean component.
Although carbon release resulting from permafrost thawing would potentially impact climate change because large amounts of carbon previously locked in frozen organic matter will decompose into CO2 and methane (Ballantyne et al., 2017), FGOALS–AVIM has only a simple carbon permafrost model at present, and no marine methane release is included. Supplementary Figure S1 shows the spatial distribution of plant functional type (PFT). The land component of the model, i.e., FGOALS–AVIM, only simulates the different responses of fixed PFTs, not PFT dynamics, therefore, we could not simulate the NPP responses to changes in land cover or land use.
2.3 Data and simulations
The time series of atmospheric CO2 concentration was provided by CMIP6 (i.e., fossil fuel combustion, cement manufacturing, and oilfield natural gas combustion) with a monthly resolution from 1850 to 2014. However, because the atmospheric CO2 variations from CMIP6 only consider its latitudinal and not longitudinal spatial variation, to fully reflect the spatial non-uniformity of atmospheric CO2 concentrations and describe the impact of anthropogenic carbon emissions due to their spatial distribution, we adopted the 1 × 1 resolution Open Data Inventory of Anthropogenic Carbon Dioxide (Oda et al., 2018) to establish the quantitative relationship between the emissions of individual grid boxes and latitude-averaged carbon emissions (Eqn. s1 in the supporting information). It was assumed that this quantitative relationship is also applicable to the relationship between the atmospheric CO2 concentration of each pixel and the latitude-averaged CO2 concentration from CMIP6 (Eq. 2 in the supporting information). The CO2 concentration was then generated by fully considering the spatial non-uniformity, which can reflect the variations of anthropogenic carbon emissions, both latitudinally and longitudinally. The CO2 datasets under the historical conditions of 1850–2005 were generated by redividing the 1 × 1 grid into a spatial resolution of 2.81 × 1.66. Based on this method, we then used the CO2 datasets as input data in our simulations.
To quantify the impact of the radiative forcing of spatially varying CO2 concentrations on carbon fluxes, we used FGOALS–AVIM to carry out two different simulation experiments to evaluate NPP. The period covered was from 1850 to 2005 (Table 1). To separate the impacts on NPP of CO2 radiative and fertilization effects due to the spatial variations of CO2 concentrations, we carried out two simulations (simulations U1 and N1) that for the radiative process used uniform CO2 concentrations (in U1) or spatially varying CO2 concentrations (in N1), but for the physiological process CO2 concentrations were fixed at 347 ppm in both simulations. The difference in NPP between simulations N1 and U1 represents the effects of CO2 radiative forcing due to spatial variations of CO2 concentrations. Simulation N1 included components based on an active atmosphere, land, ocean, and sea ice, which used atmospheric CO2 concentrations, including temporal and spatial variations, as forcing data. Simulation U1 fixed the same atmospheric CO2 level in individual grid boxes, that is, CO2 concentrations without spatial variations. The differences between the N1 and U1 simulations represent the impacts of the spatially varying atmospheric CO2 concentrations.
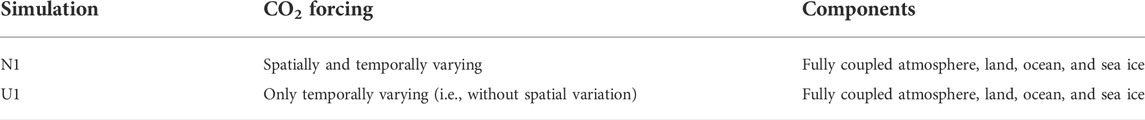
TABLE 1. CO2 forcing data for simulations.
3 Results
3.1 Regional CO2 concentrations and NPP over terrestrial ecosystems
The CO2 concentrations in the Northern and Southern Hemispheres vary widely. Australia, most of Africa, and southern South America have lower CO2 concentrations than globally. In Europe, the eastern United States, and eastern Asia, CO2 is higher than the global level. Simulation N1 used the forcing data of CO2 concentration with non-uniform spatial differences, which ranged from 339 to 351 ppm (Figure 1A). Simulation U1 used the same CO2 data globally, without spatial variations.
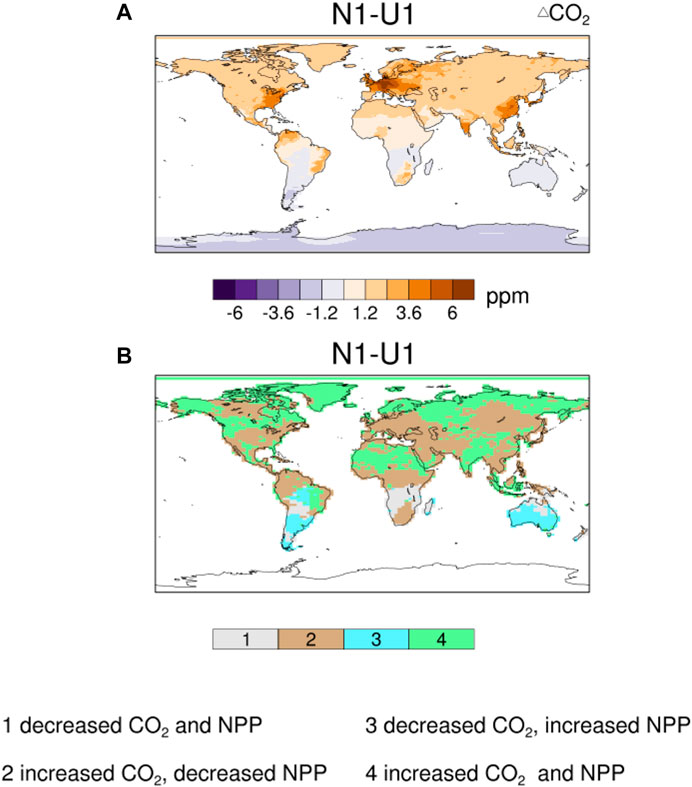
FIGURE 1. (A) Spatial variations of atmospheric CO2 anomalies from simulation N1 minus U1 over the period 1956–2005. (B) Spatial distributions of the relationship between CO2 anomalies and corresponding NPP anomalies caused by radiative forcing of CO2 non-uniformity over the same period.
Anthropogenic emissions can amplify the spatial difference in CO2 concentrations between the Northern and Southern Hemispheres (Figure 1A), which may lead to corresponding changes in annual NPP anomalies (Figure 1B). We divided the land into four regions according to the changes of both CO2 concentrations and NPP in response to the impact of radiative forcing due to spatial variations of CO2 concentrations over the period 1956–2005: region 1, which includes decreased CO2 concentrations and NPP; region 2, which features increased CO2 concentrations and decreased NPP; region 3, which is defined by decreased CO2 concentrations and increased NPP; and region 4, which includes increased CO2 concentrations and increased NPP. Region 2 is mainly located in mid–low latitudes, while region 4 primarily occurs in high latitudes. These two regions contribute the largest fraction of the whole land surface, accounting for 51% and 31%, respectively.
3.2 Estimates of NPP simulated by FGOALS–AVIM
Figure 2 shows the estimation of terrestrial NPP from simulations N1 and U1 under present conditions from 1956 to 2005. The NPP from the TRENDY dataset, consisting of seven process-based terrestrial ecosystem model simulations CLM4C, CLM4CN, LPJ, LPJ-GUESS, OCN, SDGVM, and TRIFFID (Zhang et al., 2016), was selected to compare with our simulations in the same period. An ensemble of experiment S2 from the TRENDY project was used, in which only atmospheric CO2 and climate change were included (land use changes were kept unchanged) (Piao et al., 2013), and the results show good agreement between the global NPP of both simulations (N1 and U1) and that of TRENDY.
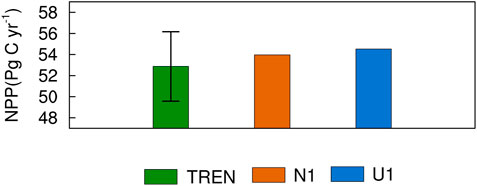
FIGURE 2. Comparison of different estimates of global NPP during the period 1956–2005: estimates based on TRENDY (TREN, green bar), simulation N1 using radiative forcing of spatial variations in CO2 concentrations (N1, orange bar), and simulation U1 using radiative forcing of uniform CO2 concentrations (U1, blue bar).
Comparing the NPP simulated by FGOALS–AVIM with that of TRENDY in spatial terms (Supplementary Figure S2), which has been used previously to assess the carbon budget of the terrestrial ecosystem (Piao et al., 2013; Friedlingstein et al., 2020), the estimated NPP produced with or without spatially varying CO2 concentrations agrees well with the simulations from TRENDY for the period 1956–2005, i.e., for the tropical forest, NPP values are higher than other plant types, and for barren and tundra they are lower. During this period from 1956 to 2005, the U1 experiment simulates smaller NPP values in the high latitudes of the Northern Hemisphere than the mean values of the TRENDY ensemble. However, the NPP simulated by the N1 experiment shows close agreement with TRENDY in these regions. The underestimation of NPP is improved to some extent by the latter experiments considering spatially varying CO2 concentrations.
Obvious negative annual NPP anomalies appear in the northern Amazon, central Africa, most of Europe, eastern Siberia, eastern Asia, and mid-latitude North America (see Figure 3A). The largest values of negative NPP anomalies in these regions reach as high as −50 g C m−2 yr−1 in central Africa and −40 g C m−2 yr−1 in the northwestern Amazon Basin. The maximum values reach −40 g C m−2 yr−1 along the northern coast of the Mediterranean Sea. Positive NPP anomalies occur over northern Eurasia, mid-latitude North America, Alaska, India, and South Asian islands. The magnitudes of positive anomalies are much smaller than those of negative anomalies. The spatial inhomogeneity of anthropogenic emissions could cause spatially varying CO2 concentrations, which in turn would alter the physical climate due to CO2 radiative forcing and thus regulation of NPP. However, the anomalies vary among regions. To examine which regions contribute the most to NPP anomalies resulting from inhomogeneous CO2 radiative forcing the terrestrial ecosystem was divided into four regions. Among these regions, region 2 includes tropical and temperate forests, which are major contributors to the NPP of terrestrial ecosystems (Cox et al., 2013; Poulter et al., 2014; Schimel et al., 2015). As can be seen, they contribute the largest fraction to the decreased NPP at 0.7 Pg C yr−1 (Figure 3B), accounting for ∼57% of the changes in global NPP. The negative contribution of the region to NPP anomalies seems to be proportional to their current contribution. Therefore, the annual anomalies of NPP in region 2, which is located in low–mid latitudes, can dominate the global carbon cycle response to heterogeneous CO2 radiative forcing.
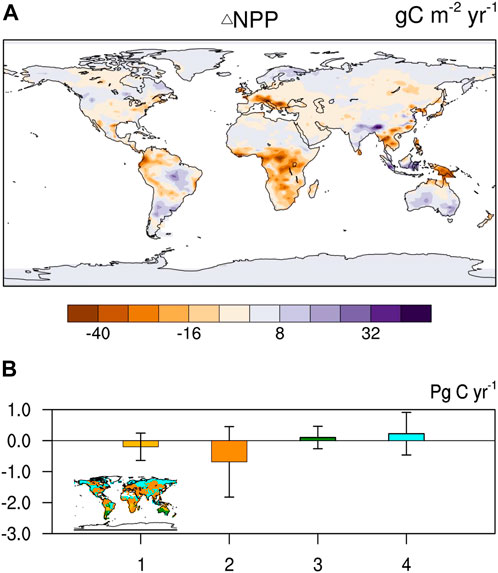
FIGURE 3. (A) Spatial distribution of NPP anomalies due to radiative forcing of spatial variations of CO2 concentrations during 1956–2005. (B) Comparison of NPP anomalies in region 1 (yellow), region 2 (orange), region 3 (green), and region 4 (light blue) during 1956–2005. The vertical black lines represent the differences between the maximum and minimum NPP anomalies for each region over 1956–2005.
CO2 concentrations at the PFT scale vary accordingly among the four seasons between simulations N1 and U1 (Supplementary Figure S3). From 1956 to 2005, larger CO2 concentrations are used in simulation N1 than U1 in spring for all PFTs, especially evergreen needle leaf forest (ENF), tundra, and crop. In contrast, the CO2 concentration in summer decreases from 0.5 ppm for evergreen broadleaf forest (EBF) to 4.2 ppm for ENF in simulation N1, in contrast with simulation U1. In autumn, the CO2 concentration used in simulation N1 increases from 0.5 ppm for EBF to 2.5 ppm for ENF. Greater CO2 concentrations in winter are used by simulation N1 than simulation U1, ranging from 2.1 ppm for EBF to 5.9 ppm for ENF.
At the PFT level, the simulated changes in NPP from 1956 to 2005 in spring, summer, and autumn are similar for DNF (deciduous needleleaf forest), C3 grass, and C4 grass (Supplementary Figure S4). In spring, there are larger decreases in NPP for deciduous broadleaf forest (DBF), but greater increases, by 0.38 Pg C yr−1, in NPP for ENF and tundra in the high latitudes than in other seasons. In summer, greater decreases for ENF and BDF are simulated than for other plant types. For EBF, the simulated decrease in NPP in autumn is similar to that for DBF, C3 grass, and C4 grass. In this season, changes in NPP for ENF and tundra are faint. In winter, excluding C3 grass, the relative differences in the simulated changes in NPP are generally much smaller for other PFTs.
3.4 Responses of NPP to temperature, precipitation, and net surface radiation
Because NPP is greatly affected by the local temperature and rainfall (Schimel et al., 2015; Swann et al., 2016; Kim et al., 2017), the annual anomalies of NPP caused by the radiative forcing of spatially varying CO2 concentrations are therefore mainly due to the contribution of annual anomalies of local temperature or rainfall. How temperature or rainfall changes is a key issue toward understanding the changes in the carbon cycle related to heterogeneous CO2 radiative forcing under the influence of anthropogenic emissions. Figures 4A–F shows the correlation coefficients of NPP anomalies with anomalies of temperature, rainfall, or net surface radiation (RNET) considering the effect of heterogeneous CO2 radiative forcing. In terms of spatial distribution, the annual anomalies of NPP are highly correlated and consistent with the annual anomalies of rainfall. In the low latitudes, the correlation coefficients between the annual anomalies of NPP and temperature are greater, showing significant negative correlations. The correlation coefficients between the annual anomalies of NPP and RNET are weak, displaying most regions as not passing the significance test at the 0.05 level.
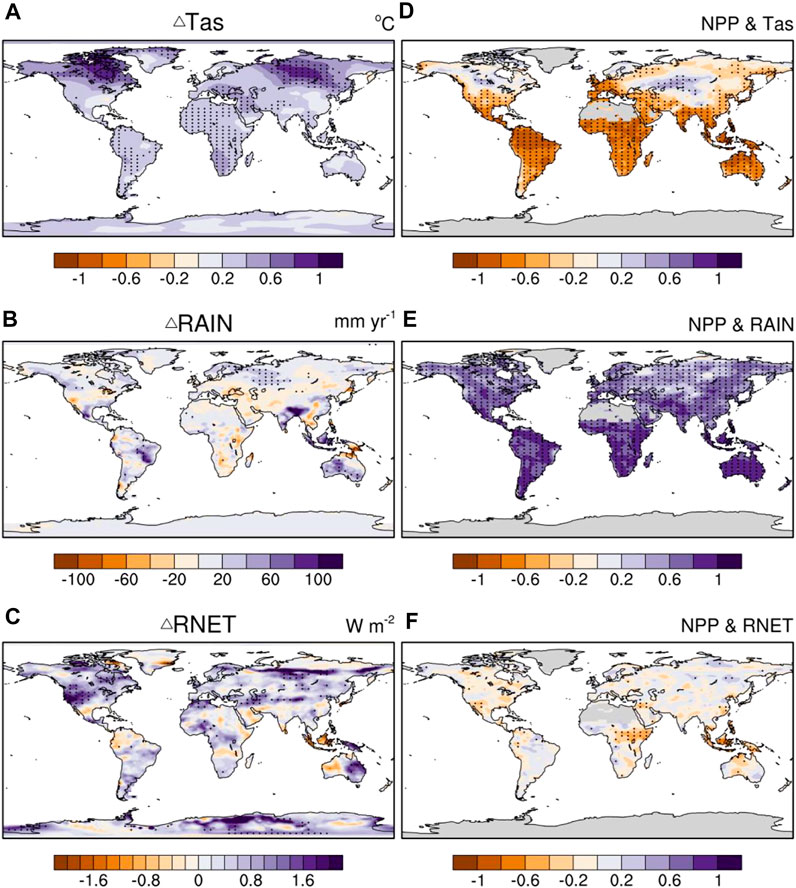
FIGURE 4. (A–C) Spatial distribution of anomalies of surface temperature (Tas), rainfall (RAIN), and surface net radiation (RNET), respectively, caused by radiative forcing of spatial variations of CO2 concentrations over the period 1956–2005. (D–F) Correlation coefficients of NPP and local Tas, RAIN or RNET, respectively. Dotted areas in (A–F) are areas with statistically significant changes at the 5% level using Student’s t-test.
Generally, NPP is an output of the land component. The changes in NPP could be regulated by the physical climate due to the radiative forcing of non-uniform CO2 concentrations. The changes in NPP might be induced by changes in the surface temperature in most land areas, although, of course, changes in NPP could also respond to changes in precipitation over land. However, on the basis of Student’s t-test at the 5% level, changes in precipitation are not statistically significant in most terrestrial ecosystems (Figure 4B). Thus, we hypothesize that the effects of changes in the physical climate on NPP due to radiative forcing of non-uniform CO2 concentrations are mainly expressed in terms of the impact of changes in surface temperature on NPP (Figures 4A,C).
3.5 Radiative forcing drivers of near-surface temperature and precipitation
Figures 5A–D shows that RLDS might dominate the radiative forcing changes. According to Eq. 2, we show the influence of each radiation component on near-surface temperature. The positive temperature anomalies in the mid-latitude and high-latitude regions of the Northern Hemisphere are consistent with the contribution of RLDS and RSS. In temperate and boreal forests of Eurasia, increased RLDS (+0.9 ± 0.9 W m−2) is responsible for most of the warming, followed by increased RNET (+0.24 ± 0.3 W m−2). The warming in the west of North America shows consistent signs of RSS and RLDS. The positive temperature anomalies in central Siberia are caused by the same signs of RLDS (+2.5 ± 2.4 W m−2) and RSS (+0.01 ± 0.1W m−2), which are located in the maximum warming.
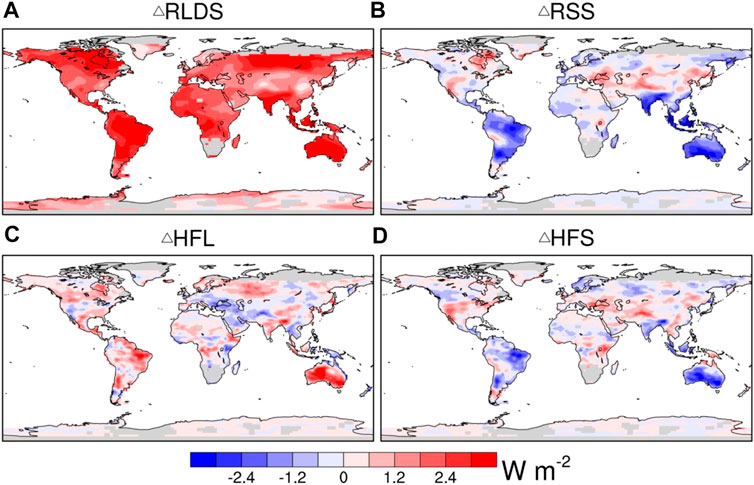
FIGURE 5. Spatial distribution of anomalies of (A) downward longwave radiation (RLDS), (B) shortwave radiation (RSS), (C) latent heat flux (HFL), and (D) sensible heat flux (HFS), caused by radiative forcing of spatial variations of CO2 concentrations over the period 1956–2005.
Annual anomalies of RLDS dominate the temperature anomalies in region 2 (Figure 5A). The positive temperature anomalies in region 2 are mainly driven by increased RLDS (+2.2 ± 1.6 W m−2), which is partly offset by the decrease in RSS (−0.2 ± 0.9 W m−2). The positive temperature anomalies in region 4 are mainly caused by radiation components with opposite signs: RLDS increases (+2.0 ± 1.5 W m−2) and RSS decreases (−0.2 ± 0.9 W m−2). Noticeably, as compared to region 2 or 4, the reduction of RSS in region 1, by −0.3 ± 2.0 W m−2, is greater.
To explore how near-surface temperature anomalies are affected by radiative forcing due to spatial variations of CO2 concentrations, we also analyzed the annual anomalies of temperature in different regions and how clouds drive temperature anomalies (Figure 6). There are obvious differences in the influence of cloud fraction on the near-surface temperature in individual regions. Mid clouds (β = −0.4, p = 0.00) have greater impacts on temperature anomalies than low clouds in region 2. In this region, increases of mid clouds are about four times the changes in low clouds (see Supplementary Figure S5). Increased mid clouds tend to reduce solar radiation reaching the surface. Therefore, in this region, the largest increases in CO2 concentrations do not accompany the largest increases in temperature. In region 4, the relationship between the anomalies of clouds and the temperature is not significant.
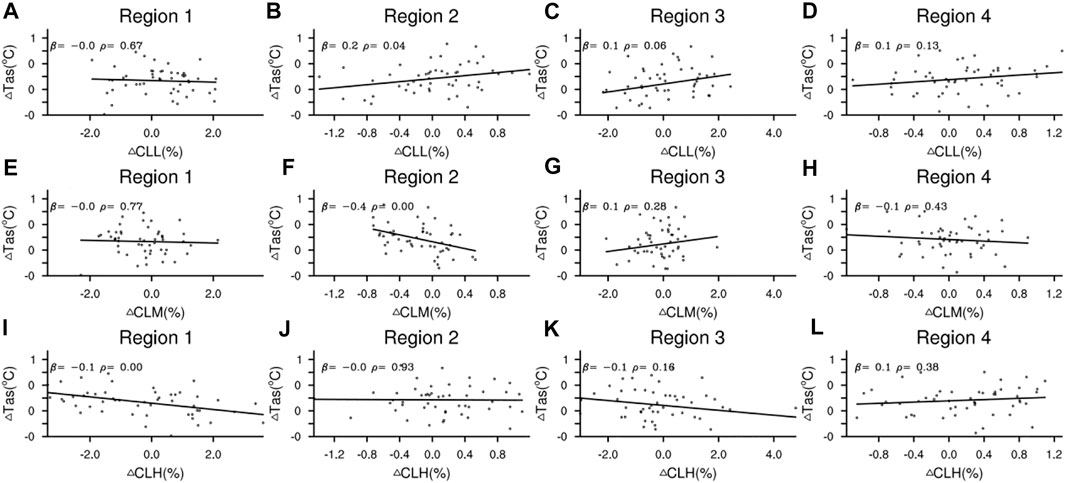
FIGURE 6. Annual anomalies of (A–D) low-cloud fraction (CLL), (E–H) mid-cloud fraction (CLM), and (I–L) high-cloud fraction (CLH) against anomalies of surface temperature (Tas) as estimated by FGOALS–AVIM2 for regions 1, 2, 3, and 4, where β represents the sensitivity of surface temperature to CLL, CLM, or CLH over the period 1956–2005, and ρ denotes the p value.
A previous study showed that anomalies of atmospheric CO2 concentration can modify the energy balance through radiative forcing, which correspondingly affects rainfall (Allen and Ingram, 2002). Results in the present study show that rainfall anomalies are significantly negatively correlated with anomalies of sensible heat flux over 80% of the land area (p < 0.01) (see Figure 7). Previous studies have shown that annual sensible heat flux anomalies play an important role in the occurrence of opposite-sign annual rainfall anomalies (Myhre et al., 2018). In northern North America, northern Europe, and southern China, the obvious negative anomalies of sensible heat flux strengthen the positive anomalies of local rainfall. Conversely, in the low-latitudes of North America, central Africa, and the Mediterranean, negative anomalies of rainfall respond to the obvious positive anomalies of sensible heat flux.
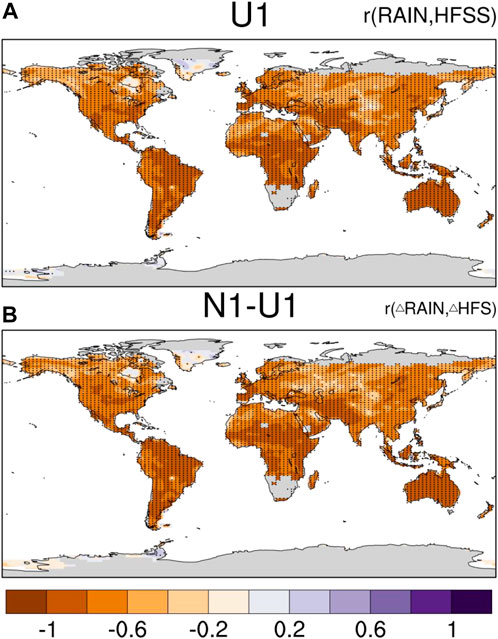
FIGURE 7. Correlation coefficients of annual anomalies of sensible heat flux (HFS) with local anomalies of rainfall estimated by FGOALS–AVIM during 1956–2005 from simulation U1 in A and simulation N1 minus U1 in B. Dotted areas are areas with statistically significant changes at the 5% level using Student’s t-test.
Radiative forcing of spatially varying CO2 concentrations plays an important role in the change in NPP associated with climatic change. On the one hand, radiative forcing of spatially varying CO2 concentrations revises the surface energy budget (Figure 5) and then continues to regulate the surface climate locally. On the other hand, the radiative forcing of heterogeneous CO2 may influence the atmospheric circulation (Figure 8), which further affects the large-scale terrestrial water cycle. Therefore, non-uniform CO2 triggers anomalies of specific humidity in each region and subsequently anomalies of rainfall and thus terrestrial NPP.
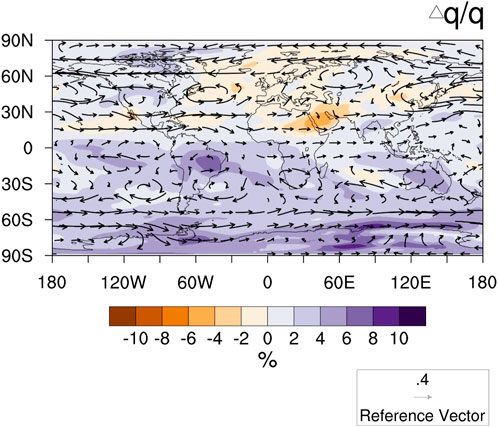
FIGURE 8. Spatial percentage of changes of specific humidity (units: %) relative to simulation U1 integrated between the surface pressure level and 300 hPa, and 850 hPa wind (vectors; units: m s−1), over the period 1956–2005, as estimated using FGOALS–AVIM, due to radiative forcing of spatially varying of CO2 concentrations.
On a global scale, an increase in relative humidity does not necessarily mean an increase in rainfall. In contrast, in Figure 8, based on the results of FGOALS–AVIM, the westerly winds weaken, thereby suppressing humid airflow from the Atlantic Ocean to western Europe, causing negative anomalies of rainfall and a decrease in soil moisture. In addition, dry air is strengthened from the northeastern to the southeastern United States. This type of circulation is not conducive to the transportation of the eastern ocean flow to the eastern continental United States. In eastern China, dry air from inland is also strengthened. Consequently, it will suppress the monsoon from the eastern Pacific Ocean, thereby reducing rainfall and causing a decrease in NPP (Figure 4E).
There is a close relationship among soil moisture, temperature, and ET (Seneviratne et al., 2006; Jung et al., 2010; Seneviratne et al., 2010). Figure 9C shows the correlation between ET and surface temperature, where the coupling of ET and temperature could reflect the evaporative demand of the air (Figure 9A). In tropical regions including the Amazon Basin, Australia, Central Africa, and southern Asia, and low- and mid-latitude regions in Europe–Asia and North America, FGOALS–AVIM presents a strong and negative correlation between ET and surface temperature (Figure 9C). Such negative coupling of ET and surface temperature could imitate the intensity of water limitation due to the high evaporative demand of air under warmer conditions. Such a negative coupling between ET and temperature is heightened due to the radiative forcing of spatial variations in CO2 concentrations (Figure 9D), which is accompanied by an enhanced NPP dependence on soil moisture (Figure 9B).
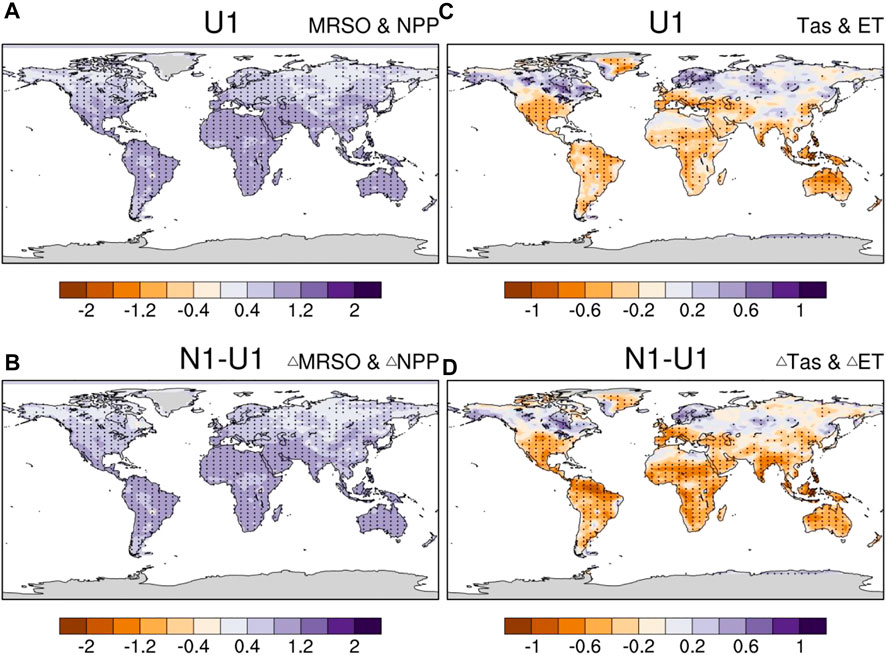
FIGURE 9. Spatial distribution of (A) sensitivity of NPP to soil moisture (MRSO; units: gC yr−1 kg−1) from simulation U1 and (B) anomalies of MRSO resulting from the effect of radiative forcing of spatially varying CO2 concentrations. Correlation coefficients of (C) surface temperature and soil evaporation from simulation U1 and (D) anomalies of surface temperature and soil evaporation due to the radiative forcing of spatial variations of CO2 concentrations. Dotted areas in (C,D) are areas with statistically significant changes at the 5% level using Student’s t-test.
4 Discussion
In regions 2 and 4, positive anomalies of surface temperature and changes in rainfall have comprehensively affected the level of soil moisture depletion on land and reduced NPP. In the high latitudes of region 4, positive anomalies of surface temperature have had the opposite influence. As a result, such responses of terrestrial ecosystems indicate that the radiative forcing of spatially varying CO2 concentrations might modify vegetation production substantially. Consequently, the responses will eventually adjust the atmospheric CO2 concentration. Therefore, understanding the relationship between the radiative forcing of spatially varying CO2 concentrations and the terrestrial carbon cycle might provide an excellent way to predict changes in the global carbon cycle.
Positive anomalies of atmospheric CO2 account for more than two-thirds of the global land area. The maximum positive anomalies are mainly located in region 2. Our results show that the higher radiative forcing of CO2 non-uniformity can induce warming in these regions. Circulation might promote the transport of warmer air from these regions to higher latitudes. Warmer air flows from the eastern United States, western Europe, and eastern Asia to the higher latitudes of the Northern Hemisphere (Figure 8), causing more positive anomalies of surface temperature to the north of 50°N (Figure 4A). Such a change at high latitudes is conducive to an increase in surface temperature and enhanced NPP in boreal forests and tundra.
The atmospheric CO2 concentration significantly modifies the surface energy budget through radiative forcing, especially the RLDS of the atmosphere, which in turn affects the surface temperature (Vargas Zeppetello et al., 2019) and greatly influences the interannual changes in NPP. According to the simulation of FGOLS–AVIM, the global specific humidity increases, which reflects the increase in atmospheric water vapor. These increases may amend the surface energy balance and surface temperature, mainly through the RLDS, which our results show possesses a good positive specific humidity sensitivity (β = 8.8 W m−2/(g kg−1); p value < 0.01) (Figure 10). Therefore, to a certain extent, the changes in specific humidity reliably describe the changes in RLDS (Stanhill 2011; Liu et al., 2019). Increased specific humidity and water vapor would help prevent longwave radiation from moving from the surface into space, and also cause increases in downward longwave radiation (Figure 5). Consequently, in part, this will result in increased RLDS to heat the atmosphere and surface [see Eq. 2]. In addition, in regions without water limitation, especially in the ocean, warmer surfaces might increase evaporation, resulting in higher water content in the atmosphere, which would cause more RLDS. Therefore, the radiative forcing of increased specific humidity may lead to positive anomalies of surface temperature in low-latitudes and Southern Hemisphere regions, although CO2 in most of these regions has not increased.
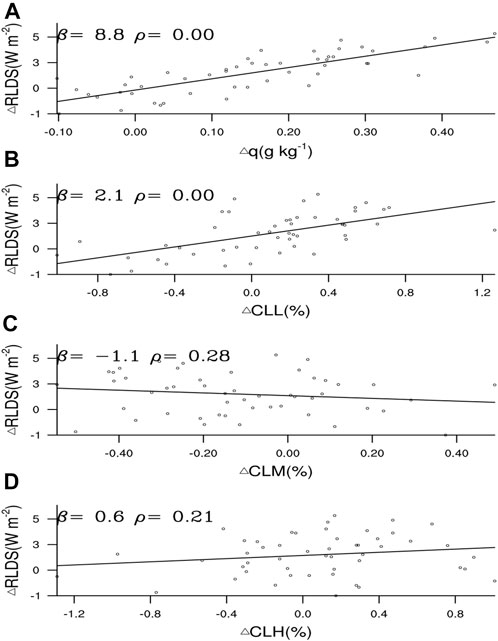
FIGURE 10. Annual anomalies of (A) specific humidity (q), (B) low-cloud fraction (CLL), (C) mid-cloud fraction (CLM), and (D) high-cloud fraction (CLH), against anomalies of downward longwave radiation (RLDS), as estimated by FGOALS–AVIM2, for the globe, where β represents the sensitivity of RLDS to CLL, CLM, and CLH over the period 1956–2005, and ρ denotes the p-value.
To explore how each radiative component is modified by spatially varying CO2 concentrations, we present their spatial distribution patterns (Figure 5) and analyze how their drivers respond (Figures 10A–D). The results suggest that, in the Amazon Basin, Australia, Central Africa, and Southeast Asia, significant asymmetrical RLDS associated with the non-uniformity of CO2 concentrations might be caused by another factor. The enhanced low-cloud fraction in these regions (Supplementary Figure S5B) might prevent longwave radiation from being emitted from the surface into space (Figure 10B). This can also lead to asymmetrical temperature anomalies associated with increased RLDS. For example, in these regions, the increases of RLDS at low latitudes and in the Southern Hemisphere are associated with positive anomalies in water vapor and low clouds (p < 0.01) (Figure 10).
The linear relationships between changes in global soil moisture and NPP and changes in the sea surface temperature (SST) are shown in Supplementary Figure S6. Changes in SST could regulate the local hydrological conditions of soil moisture and thus NPP (Kim et al., 2016; Schine et al., 2016; Frederiksen et al., 2018). Particularly, the changes in global mean soil moisture show a significant negative relation with SST in the eastern tropical Pacific Ocean. In contrast, in the northwestern Pacific around Japan, southwestern Pacific around Oceania, and North Atlantic Ocean, positive changes in soil moisture respond to positive changes in SST. In spatial distribution terms, the responses of the simulated changes in NPP from 1956 to 2005 due to the radiative forcing of the non-uniform CO2 concentrations to SST are similar to the soil moisture. However, a greater negative relationship between the changes in global NPP and SST is shown in the eastern tropical Pacific Ocean, compared with the relationship between global mean soil moisture and SST. This is likely because the tropics are the main contributor to global NPP, which might be related to El Niño–Southern Oscillation (ENSO) (Kim et al., 2017; Park et al., 2020; Kim et al., 2021). Correspondingly, how ENSO, the Pacific Decadal Oscillation, and the Arctic Oscillation influence NPP through ocean–atmosphere teleconnections should be further investigated.
Spatially varying CO2 concentrations could increase the coupling between temperature and ET in terrestrial ecosystems. Accordingly, due to the warmer conditions (Figure 4A) transpiration might be reduced in the northwest Amazon Basin, central and southern Africa, eastern Asia, and northern Mediterranean (Supplementary Figure S7). When the temperature increases (Figure 4A), an enhanced negative relation between surface temperature and ET decreases could result in reduced leaf stomata conductance, which would limit the absorption of CO2 at the canopy level (Oren et al., 1999; Wever et al., 2002; Yuan et al., 2016). Such inhibition could lead to a reduction in canopy development, thereby reducing NPP (Figure 3). Therefore, the enhanced negative ET–temperature coupling can characterize the increased moisture deficit (Yuan et al., 2016; Yuan et al., 2019). In other words, due to the enhancement in the negative coupling of ET and temperature, the limitation strength of local water availability for plants due to the radiative forcing of spatially varying CO2 concentrations could cause local enhanced sensitivity of NPP to soil moisture (Yuan et al., 2016).
In addition, climate forcing caused by spatial variations in CO2 concentration can also alter atmospheric circulation, which in turn affects precipitation. The combination of these changes will cause changes in NPP. However, a more detailed understanding of the physical processes and reasons behind the NPP response to CO2 radiative forcing would be needed. The results are mainly based on the correlation between climate variables and NPP, which makes it difficult to recognize the cause/effect because each climate variable is interrelated. Some physical explanations may need to be included to really identify the cause/consequence. In future work, sensitivity runs are necessary to detect causes/consequences, as suggested by Liu et al. (2019).
We used FGOALS–AVIM to estimate the impacts of changes in climate state due to the radiative forcing of non-uniform CO2 concentrations. It should be noted that these simulations based solely on FGOALS–AVIM are not ensembles. Thus, uncertainty in the simulations might result from the internal variability of this model, meaning the addition of more models for the non-uniform CO2 concentration-driven runs are needed in the future. Finally, it is well known that stronger spatially varying anthropogenic carbon emissions in the future will lead to greater spatially varying CO2 concentrations. Changes in the radiative forcing of non-uniform CO2 concentrations under future conditions were not included in our simulations. Elucidating the future impact on NPP of such greater spatial variations would help towards better understanding its impact in the real world. This too requires further investigation.
5 Conclusion
Fossil fuel-based anthropogenic emissions could induce the spatial variation in atmospheric CO2 concentrations. This study shows that the CO2 radiative forcing of spatial variations in CO2 concentrations has resulted in an additional decrease in NPP in region 2 by 0.7 Pg C yr−1, or a 57% additional decrease in NPP for the whole terrestrial ecosystem, over the period 1956–2005. Such reductions in NPP mainly relate to increases in surface temperature, by 0.4°C. Jointly driven by the strengthened coupling between evaporation and temperature, the dependence of NPP on soil moisture in region 2 has decreased. Consequently, reduced soil moisture under warmer conditions due to the radiative forcing of spatial variations in CO2 concentrations has significantly decreased NPP. In addition, the increase in downward longwave radiation can be attributed to such an increase in surface temperature. To a certain extent, this increase in downward longwave radiation results from low-level cloud. We argue that regional changes in NPP due to the radiative forcing of spatial variations in CO2 concentrations should be an integral part of future studies on the responses of carbon fluxes to climate change.
Data availability statement
The raw data supporting the conclusion of this article will be made available by the authors, without undue reservation.
Author contributions
JP wrote the manuscript. LD, XT, and FY led data analysis with a considerable comment, contribution, and interpretation from all authors.
Acknowledgments
The authors thank the National Natural Science Foundation of China (Grant Nos. 42141017, 41975112, 42175142, and 42175013) and the National Key Research and Development Program of China (Grant No. 2016YFA0602501) for supporting this study. They thank Prof. Yongkang Xue from the University of California, Los Angeles (UCLA), CA, United States, for the great suggestions.
Conflict of interest
The authors declare that the research was conducted in the absence of any commercial or financial relationships that could be construed as a potential conflict of interest.
Publisher’s note
All claims expressed in this article are solely those of the authors and do not necessarily represent those of their affiliated organizations, or those of the publisher, the editors, and the reviewers. Any product that may be evaluated in this article, or claim that may be made by its manufacturer, is not guaranteed or endorsed by the publisher.
Supplementary material
The Supplementary Material for this article can be found online at: https://www.frontiersin.org/articles/10.3389/feart.2022.953605/full#supplementary-material
References
Ainsworth, E. A., and Long, S. P. (2005). What have we learned from 15 years of free-air CO2 enrichment (face)? A meta-analytic review of the responses of photosynthesis, canopy properties and plant production to rising CO2. New Phytol. 165, 351–372. doi:10.1111/j.1469-8137.2004.01224.x
Allen, M. R., and Ingram, W. J. (2002). Constraints on future changes in climate and the hydrologic cycle. Nature 419, 228–232. doi:10.1038/nature01092
Ballantyne, A., Smith, W., Anderegg, W., Kauppi, P., Sarmiento, J., Tans, P., et al. (2017). Accelerating net terrestrial carbon uptake during the warming hiatus due to reduced respiration. Nat. Clim. Chang. 7, 148–152. doi:10.1038/nclimate3204
Bao, Q., Lin, P., Zhou, T., Liu, Y., Yu, Y., Wu, G., et al. (2013). The flexible global ocean-atmosphere-land system model, spectral version 2: FGOALS-s2. Adv. Atmos. Sci. 30, 561–576. doi:10.1007/s00376-012-2113-9
Canadell, J. G., Monteiro, P. M. S, Costa, M. H., Cotrim da Cunha, L., Cox, P. M., Eliseev, A. V., et al. (2021). “Global Carbon and other Biogeochemical Cycles and Feedbacks,” in Climate Change 2021: The Physical Science Basis. Contribution of Working Group I to the Sixth Assessment Report of the Intergovernmental Panel on Climate Change. Editors V. Masson-Delmotte, P. Zhai, A. Pirani, S. L. Connors, C. Péan, S. Bergeret al. (Cambridge, United Kingdom and New York, NY: Cambridge University Press), 673–816. doi:10.1017/9781009157896.007
Cao, L., Bala, G., Caldeira, K., Nemani, R., and Ban-Weiss, G. (2010). Importance of carbon dioxide physiological forcing to future climate change. Proc. Natl. Acad. Sci. U. S. A. 107, 9513–9518. doi:10.1073/pnas.0913000107
Capistrano, V. B., Nobre, P., Veiga, S. F., Tedeschi, R., Silva, J., Bottino, M., et al. (2020). Assessing the performance of climate change simulation results from BESM-OA2.5 compared with a CMIP5 model ensemble. Geosci. Model Dev. 13, 2277–2296. doi:10.5194/gmd-13-2277-2020
Chen, X., Zhou, T., and Guo, Z. (2014). Climate sensitivities of two versions of FGOALS model to idealized radiative forcing. Sci. China Earth Sci. 57, 1363–1373. doi:10.1007/s11430-013-4692-4
Cox, P., Pearson, D., Booth, B., Friedlingstein, P., Huntingford, C., Jones, C., et al. (2013). Sensitivity of tropical carbon to climate change constrained by carbon dioxide variability. Nature 494, 341–344. doi:10.1038/nature11882
Etminan, M., Myhre, G., Highwood, E. J., and Shine, K. P. (2016). Radiative forcing of carbon dioxide, methane, and nitrous oxide: A significant revision of the methane radiative forcing. Geophys. Res. Lett. 43 (12), 614–612. doi:10.1002/2016gl071930
Falahatkar, S., Mousavi, S. M., and Farajzadeh, M. (2017). Spatial and temporal distribution of carbon dioxide gas using GOSAT data over Iran. Environ. Monit. Assess. 189, 627. doi:10.1007/s10661-017-6285-8
Frederiksen, C. S., Ying, K., Grainger, S., and Zheng, X. (2018). Modes of interannual variability in northern hemisphere winter atmospheric circulation in CMIP5 models: Evaluation, projection and role of external forcing. Clim. Dyn. 50, 2845–2865. doi:10.1007/s00382-017-3776-9
Friedlingstein, P. (2015). Carbon cycle feedbacks and future climate change. Phil. Trans. R. Soc. A 373, 20140421. doi:10.1098/rsta.2014.0421
Friedlingstein, P., Cox, P., Betts, R., Bopp, L., von Bloh, W., Brovkin, V., et al. (2006). Climate–carbon cycle feedback analysis: Results from the C4MIP model Intercomparison. J. Clim. 19, 3337–3353. doi:10.1175/jcli3800.1
Friedlingstein, P., Meinshausen, M., Arora, V. K., Jones, C. D., Anav, A., Liddicoat, S. K., et al. (2013). Uncertainties in CMIP5 climate projections due to carbon cycle feedbacks. J. Clim. 27, 511–526. doi:10.1175/jcli-d-12-00579.1
Friedlingstein, P., O'Sullivan, M., Jones, M. W., Andrew, R. M., Hauck, J., and Olsen, A. (2020). Global carbon budget 2020. Earth Syst. Sci. Data 12, 3269–3340.
Govindasamy, B., and Caldeira, K. (2000). Geoengineering Earth's radiation balance to mitigate CO2-induced climate change. Geophys. Res. Lett. 27, 2141–2144. doi:10.1029/1999gl006086
Huang, Y., Xia, Y., and Tan, X. (2017). On the pattern of CO2 radiative forcing and poleward energy transport. J. Geophys. Res. Atmos. 122, 10578–10593. doi:10.1002/2017jd027221
Jung, M., Reichstein, M., Ciais, P., Seneviratne, S. I., Sheffield, J., Goulden, M. L., et al. (2010). Recent decline in the global land evapotranspiration trend due to limited moisture supply. Nature 467, 951–954. doi:10.1038/nature09396
Kim, I.-W., Stuecker, M. F., Timmermann, A., Zeller, E., Kug, J.-S., Park, S.-W., et al. (2021). Tropical Indo-Pacific SST influences on vegetation variability in eastern Africa. Sci. Rep. 11, 10462. doi:10.1038/s41598-021-89824-x
Kim, J.-S., Kug, J.-S., and Jeong, S.-J. (2017). Intensification of terrestrial carbon cycle related to El Niño–Southern Oscillation under greenhouse warming. Nat. Commun. 8, 1674. doi:10.1038/s41467-017-01831-7
Kim, J.-S., Kug, J.-S., Yoon, J.-H., and Jeong, S.-J. (2016). Increased atmospheric CO2 growth rate during El Niño driven by reduced terrestrial productivity in the CMIP5 ESMs. J. Clim. 29, 8783–8805. doi:10.1175/jcli-d-14-00672.1
Liu, Y., Xue, Y., MacDonald, G., Cox, P., and Zhang, Z. (2019). Global vegetation variability and its response to elevated CO<sub>2</sub>, global warming, and climate variability – A study using the offline SSiB4/TRIFFID model and satellite data. Earth Syst. Dynam. 10, 9–29. doi:10.5194/esd-10-9-2019
Medlyn, B. E., Zaehle, S., De Kauwe, M. G., Walker, A. P., Dietze, M. C., Hanson, P. J., et al. (2015). Using ecosystem experiments to improve vegetation models. Nat. Clim. Chang. 5, 528–534. doi:10.1038/nclimate2621
Muller, C. J., and O’Gorman, P. A. (2011). An energetic perspective on the regional response of precipitation to climate change. Nat. Clim. Chang. 1, 266–271. doi:10.1038/nclimate1169
Myhre, G., Samset, B. H., Hodnebrog, O., Andrews, T., Boucher, O., Faluvegi, G., et al. (2018). Sensible heat has significantly affected the global hydrological cycle over the historical period. Nat. Commun. 9, 1922. doi:10.1038/s41467-018-04307-4
Myhre, G., Samset, B. H., Schulz, M., Balkanski, Y., Bauer, S., Berntsen, T. K., et al. (2013). Radiative forcing of the direct aerosol effect from AeroCom Phase II simulations. Atmos. Chem. Phys. 13, 1853–1877. doi:10.5194/acp-13-1853-2013
Nassar, R., Napier-Linton, L., Gurney, K. R., Andres, R. J., Oda, T., Vogel, F. R., et al. (2013). Improving the temporal and spatial distribution of CO2 emissions from global fossil fuel emission data sets. J. Geophys. Res. Atmos. 118, 917–933. doi:10.1029/2012jd018196
Oda, T., Maksyutov, S., and Andres, R. J. (2018). The open-source data inventory for anthropogenic CO<sub>2</sub>, version 2016 (ODIAC2016): A global monthly fossil fuel CO<sub>2</sub> gridded emissions data product for tracer transport simulations and surface flux inversions. Earth Syst. Sci. Data 10, 87–107. doi:10.5194/essd-10-87-2018
Oren, R., Sperry, J. S., Katul, G. G., Pataki, D. E., Ewers, B. E., Phillips, N., et al. (1999). Survey and synthesis of intra- and interspecific variation in stomatal sensitivity to vapour pressure deficit. Plant Cell Environ. 22, 1515–1526. doi:10.1046/j.1365-3040.1999.00513.x
Park, S.-W., Kim, J.-S., Kug, J.-S., Stuecker, M. F., Kim, I.-W., and Williams, M. (2020). Two aspects of decadal ENSO variability modulating the long-term global carbon cycle. Geophys. Res. Lett. 47, e2019GL086390. doi:10.1029/2019gl086390
Peng, J., Dan, L., and Dong, W. (2014). Are there interactive effects of physiological and radiative forcing produced by increased CO2 concentration on changes of land hydrological cycle? Glob. Planet. Change 112, 64–78. doi:10.1016/j.gloplacha.2013.11.007
Peng, J., and Dan, L. (2015). Impacts of CO2 concentration and climate change on the terrestrial carbon flux using six global climate-carbon coupled models. Ecol. Modell. 304, 69–83. doi:10.1016/j.ecolmodel.2015.02.016
Peng, J., and Dan, L. (2014). “The response of the terrestrial carbon cycle simulated by FGOALS-AVIM to rising CO 2,” in Flexible global ocean-atmosphere-land system model (Berlin, Germany: Springer), 393–403.
Piao, S., Sitch, S., Ciais, P., Friedlingstein, P., Peylin, P., Wang, X., et al. (2013). Evaluation of terrestrial carbon cycle models for their response to climate variability and to CO2 trends. Glob. Chang. Biol. 19, 2117–2132. doi:10.1111/gcb.12187
Piao, S., Wang, X., Park, T., Chen, C., Lian, X., He, Y., et al. (2020). Characteristics, drivers and feedbacks of global greening. Nat. Rev. Earth Environ. 1, 14–27. doi:10.1038/s43017-019-0001-x
Poulter, B., Frank, D., Ciais, P., Myneni, R. B., Andela, N., Bi, J., et al. (2014). Contribution of semi-arid ecosystems to interannual variability of the global carbon cycle. Nature 509, 600–603. doi:10.1038/nature13376
Ramaswamy, V., Collins, W., Haywood, J., Lean, J., Mahowald, N., Myhre, G., et al. (2019). Radiative forcing of climate: The historical evolution of the radiative forcing concept, the forcing agents and their quantification, and applications. Meteorol. Monogr. 59, 14.1–14.101. doi:10.1175/amsmonographs-d-19-0001.1
Schimel, D., Stephens, B. B., and Fisher, J. B. (2015). Effect of increasing CO2 on the terrestrial carbon cycle. Proc. Natl. Acad. Sci. U. S. A. 112, 436–441. doi:10.1073/pnas.1407302112
Schine, C. M. S., van Dijken, G., and Arrigo, K. R. (2016). Spatial analysis of trends in primary production and relationship with large-scale climate variability in the Ross Sea, Antarctica (1997–2013). J. Geophys. Res. Oceans 121, 368–386. doi:10.1002/2015jc011014
Seneviratne, S. I., Corti, T., Davin, E. L., Hirschi, M., Jaeger, E. B., Lehner, I., et al. (2010). Investigating soil moisture–climate interactions in a changing climate: A review. Earth. Sci. Rev. 99, 125–161. doi:10.1016/j.earscirev.2010.02.004
Seneviratne, S. I., Lüthi, D., Litschi, M., and Schär, C. (2006). Land–atmosphere coupling and climate change in Europe. Nature 443, 205–209. doi:10.1038/nature05095
Sitch, S., Friedlingstein, P., Gruber, N., Jones, S. D., Murray-Tortarolo, G., Ahlstrom, A., et al. (2015). Recent trends and drivers of regional sources and sinks of carbon dioxide. Biogeosciences 12, 653–679. doi:10.5194/bg-12-653-2015
Stanhill, G. (2011). The role of water vapor and solar radiation in determining temperature changes and trends measured at Armagh, 1881–2000. J. Geophys. Res. 116, D03105. doi:10.1029/2010jd014044
Swann, A. L. S., Hoffman, F. M., Koven, C. D., and Randerson, J. T. (2016). Plant responses to increasing CO2 reduce estimates of climate impacts on drought severity. Proc. Natl. Acad. Sci. U. S. A. 113, 10019–10024. doi:10.1073/pnas.1604581113
Törnqvist, R., Jarsjö, J., Pietroń, J., Bring, A., Rogberg, P., Asokan, S. M., et al. (2014). Evolution of the hydro-climate system in the Lake Baikal basin. J. Hydrology 519, 1953–1962. doi:10.1016/j.jhydrol.2014.09.074
Vargas Zeppetello, L. R., Donohoe, A., and Battisti, D. S. (2019). Does surface temperature respond to or determine downwelling longwave radiation? Geophys. Res. Lett. 46, 2781–2789. doi:10.1029/2019gl082220
Wang, J., Bao, Q., Zeng, N., Liu, Y., Wu, G., and Ji, D. J. A. i. A. S. (2013). Earth System Model FGOALS-s2: Coupling a dynamic global vegetation and terrestrial carbon model with the physical climate system model. Adv. Atmos. Sci. 30, 1549–1559. doi:10.1007/s00376-013-2169-1
Wang, Y., Feng, J., Dan, L., Lin, S., and Tian, J. (2019). The impact of uniform and nonuniform CO2 concentrations on global climatic change. Theor. Appl. Climatol. 139, 45–55. doi:10.1007/s00704-019-02924-7
Wever, L. A., Flanagan, L. B., and Carlson, P. J. (2002). Seasonal and interannual variation in evapotranspiration, energy balance and surface conductance in a northern temperate grassland. Agric. For. Meteorology 112, 31–49. doi:10.1016/s0168-1923(02)00041-2
Yuan, W., Cai, W., Chen, Y., Liu, S., Dong, W., Zhang, H., et al. (2016). Severe summer heatwave and drought strongly reduced carbon uptake in Southern China. Sci. Rep. 6, 18813. doi:10.1038/srep18813
Yuan, W., Zheng, Y., Piao, S., Ciais, P., Lombardozzi, D., Wang, Y., et al. (2019). Increased atmospheric vapor pressure deficit reduces global vegetation growth. Sci. Adv. 5, eaax1396. doi:10.1126/sciadv.aax1396
Keywords: spatial variations of CO2 concentrations, temperature, downward longwave radiation, net primary production (NPP), radiative forcing of CO2
Citation: Peng J, Dan L, Tang X and Yang F (2022) Impact of radiative forcing of spatially varying CO2 concentrations on net primary production. Front. Earth Sci. 10:953605. doi: 10.3389/feart.2022.953605
Received: 26 May 2022; Accepted: 17 August 2022;
Published: 23 September 2022.
Edited by:
Claudio Fabian Szlafsztein, Federal University of Pará, BrazilReviewed by:
Luigi Aldieri, University of Salerno, ItalyJian Tao, Shandong Institute of Business and Technology, China
Copyright © 2022 Peng, Dan, Tang and Yang. This is an open-access article distributed under the terms of the Creative Commons Attribution License (CC BY). The use, distribution or reproduction in other forums is permitted, provided the original author(s) and the copyright owner(s) are credited and that the original publication in this journal is cited, in accordance with accepted academic practice. No use, distribution or reproduction is permitted which does not comply with these terms.
*Correspondence: Jing Peng, cGVuZ2ppbmdAdGVhLmFjLmNu