 J. Lin
 C. Smerzini
- Department of Civil and Environmental Engineering, Politecnico di Milano, Milan, Italy
An accurate characterization of earthquake ground motion and its variability is crucial for seismic hazard and risk analysis of spatially distributed portfolios in urban areas. In this work, a 3D physics-based numerical approach, based on the high-performance spectral element code SPEED (http://speed.mox.polimi.it/), is adopted to generate ground shaking scenarios for strong earthquakes (moment magnitude MW=6.5–7) in the Thessaloniki area (Northern Greece). These simulations account for kinematic finite-fault rupture scenarios and a 3D seismic velocity including the two main geological structures present in the area (Thessaloniki and Mygdonia basins). The numerical model is successfully validated by comparing simulated motions, on the one hand, with the recordings of a real small-magnitude (MW4.4) earthquake and, on the other, with empirical Ground Motion Models for the historical MW6.5 1978 earthquake. The sensitivity of results to the velocity model, anelastic attenuation, and non-linear soil effects is evaluated. The variability of the ground motion intensity measures in Thessaloniki as a function of the finite-fault rupture realizations (causative fault, magnitude, hypocenter location) is explored to gain insight into its potential impact on seismic risk assessment in urban areas.
1 Introduction
The characterization of earthquake ground motion and of its spatial variability is a key component of seismic risk modeling, especially for spatially distributed structures or infrastructure systems, such as bridge networks and building portfolios in large urban areas.
Empirical Ground Motion Models (GMMs) and ShakeMaps (Worden et al., 2020; Wald et al., 2021) represent the reference approach for earthquake ground motion prediction because of their consolidated utilization in the frame of probabilistic seismic hazard and risk analyses. Empirical GMMs are derived from the statistical processing of recordings of past earthquakes to provide the probability distribution of prescribed ground motion Intensity Measures (IM) as a function of essential explanatory variables, such as earthquake magnitude, source-to-site distance, and soil conditions (Douglas and Edwards, 2016). Driven by the increasing availability of recordings, state-of-the-art GMMs are calibrated on comprehensive datasets by using robust mixed-effect regressions techniques (Stafford 2014) and by relaxing the assumption of ergodicity, i.e., the variability at a single site from a specific source is assumed identical to that derived from multiple sites over large regions (Villani and Abrahamson 2015; Kotha et al., 2020; Sgobba et al., 2021a; Caramenti et al., 2022). By providing region- and site-specific adjustments of the model parameters, non-ergodic models proved to offer significant improvements in terms of median shaking accuracy and reduction of GMM variability (i.e., standard deviation), especially in the far-field.
Despite these advancements, the main issue is that the paucity of ground motion recordings in the proximity of the earthquake source persists, implying that empirical GMMs are poorly constrained in the near-source region, and they are subject to high uncertainty. Recently, Paolucci et al. (2022) showed that the predictive performance of recent GMMs is still poor when assessed on the NEar-Source Strong-Motion recorded dataset NESS2.0 (Sgobba et al., 2021b), because of the still insufficient sampling of the GMM calibration datasets in the near-field. Furthermore, because of the limited within-event spatial sampling of the calibration datasets, in empirical GMMs the spatial correlation of ground motion is reproduced through simplified approaches based on the stochastic simulation of spatially correlated random fields under the hypotheses of ergodicity, isotropy, and stationarity (see review in Schiappapietra and Douglas 2020). However, such assumptions are hardly found in near-source conditions and may not be suitable to reproduce scenario- and region-specific features of ground motion spatial correlation and cross-correlation (see Chen and Baker 2019; Schiappapietra and Smerzini 2021). This may negatively impact on seismic risk assessments of regional-scale infrastructures or urban areas, where ground motion scenarios preserving a realistic spatial correlation structure are needed (Schiappapietra et al., 2022).
Due to the ever-growing increase of computational resources, physics-based numerical simulations (PBS) of source-to-site seismic wave propagation have been gradually playing a promising role in responding to the existing knowledge gaps in earthquake ground motion prediction (Bradley et al., 2017; McCallen et al., 2021a; 2021b; Paolucci et al., 2021; Touhami et al., 2022). Based on the numerical solution of the elastodynamics equation, PBS provides ground motion time histories reflecting the physics of the seismic wave propagation problem, from the fault rupture to the propagation path and complex site effects in shallow geology. PBS motions can be used: 1) to complement recordings, especially in those conditions where data are still sparse, such as in the near-source region of strong earthquakes, 2) to calibrate region-specific spatial correlation models, 3) to constrain site amplification studies in complex geological configurations (e.g. alluvial basins), 4) to gain insight into the physics of the complex interactions between the source process and the ground shaking, up to the coupling with the structural response, 5) to provide site-specific waveforms for structural analysis, also at spatially dense locations, as well as scenarios for region-specific hazard and risk assessments.
With this background, the goal of this work is to construct and validate a set of earthquake ground shaking scenarios from 3D PBS for the area of Thessaloniki (Northern Greece), given their future use in region-specific seismic risk assessments. The case study of Thessaloniki is considered because of the detailed knowledge on the geological and seismotectonic context, and vulnerability and exposure data (Crowley et al., 2020; Riga et al., 2021), which are critical ingredients for seismic risk evaluations. Starting from previous works (Smerzini et al., 2017; Smerzini and Pitilakis 2018), an updated version of the 3D numerical model of the broader Thessaloniki area is built in this work by bringing improvements to the geological and geophysical model.
PBS are carried out by the open-source computer code SPEED—Spectral Element in Elastodynamics with Discontinuous (Mazzieri et al., 2013, http://speed.mox.polimi.it/), developed at Politecnico di Milano. In the recent past, SPEED has been extensively used for the validation of PBS addressed to real earthquakes in Italy and worldwide (e.g. Paolucci et al., 2015; Evangelista et al., 2017; Infantino et al., 2020), for region-specific seismic hazard and risk evaluations (Smerzini and Pitilakis 2018; Stupazzini et al., 2021), and the construction of a dataset of broadband near-source simulated ground motions for earthquake engineering applications (Paolucci et al., 2021).
The paper is organized as follows. After providing in Section 2 an overview of the study area, the 3D numerical model is presented in Section 3, emphasizing the main changes introduced in this work with respect to the previously published version of the model for the same region. In Section 4 the numerical model is validated on the recordings of a real earthquake with moment magnitude MW4.4, which occurred on 12th September 2005 in the Mygdonia graben. A set of sensitivity tests is shown for the calibration of model parameters. After the small magnitude event’s validation, the MW6.5 1978 earthquake simulation is addressed in Section 5 by comparing simulated ground motion intensity measures with empirical GMMs and by assessing the spatial correlation of spectral accelerations across different vibration periods. Finally, Section 6 illustrates the set of 60 physics-based earthquake scenarios rupturing two different active fault systems around Thessaloniki, namely the Gerakarou-Langadhas and the Anthemountas faults, with MW in the range between 6.5 and 7.0.
2 Study area
The city of Thessaloniki is the second largest and the most relevant financial center in the territory of Greece, with more than one million inhabitants. Located in Central Macedonia and the inner part of the Thermaikos Gulf (see Figure 1), the city has an extensive industrial zone encompassing strategic infrastructures and a major international port functioning as a major gateway for the Balkan hinterland (Raucoules et al., 2008). The port of Thessaloniki is one of the most important harbors in Southeast Europe. It serves the needs of 15 million inhabitants of its international mainland and handles approximate trading of 16,000,000 tons of cargo annually.
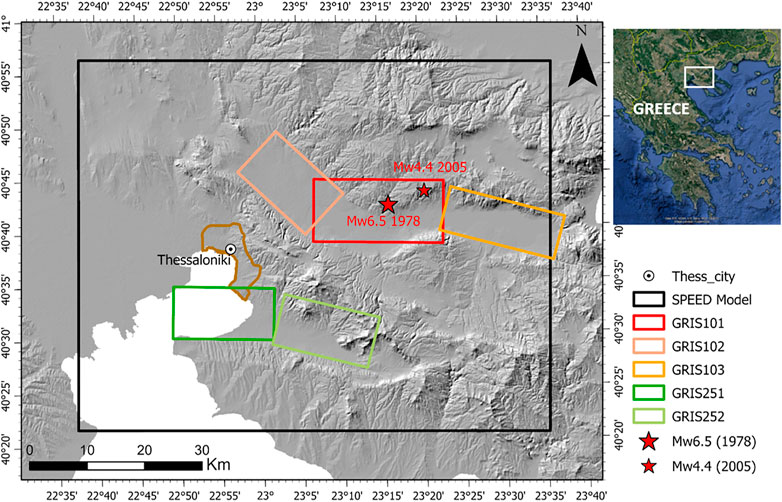
FIGURE 1. Overview of the study area with indication of the main seismogenic faults (according to the GreDaSS database) and the Thessaloniki urban area (superimposed brown contour). The extent of the SPEED model as well as the epicenters of the real MW4.4 and MW6.5 earthquakes considered in this work for validation purposes are shown.
The broader Thessaloniki area sits in Central Macedonia, a high-seismicity region characterized by an extensional tectonic regime associated with complex NW–SE, NE–SW, E–W, and NNE–SSW trending faults (Tranos et al., 2003; Paradisopoulou et al., 2006). The outcropping rocks forming the pre-alpine and alpine basement belong to the NNW–SSE-trending alpine Circum Rhodope Belt Thrust System (CRBTS), characterized by several NE-dipping asymmetric anticlinoria and synclinoria and repeated SW-directed thrust sheets (Tranos et al., 1999). Above this basement, NW–SE- and E–W-trending basins and grabens of tectonic origin, filled with Neogene and Quaternary sediments, are present. These basins were formed by an extensive extensional deformation associated with high-angle normal faults (Pavlides and Kilias, 1987; Tranos et al., 1999). Among these basins, the E–W-trending Mygdonia graben is within the study area, located around 25 km northeast of Thessaloniki.
The seismicity of the city of Thessaloniki is mainly associated with the activity of the Mygdonia and the Anthemountas fault systems (see Figure 1, according to the Greek Database of Seismogenic Sources-GreDaSS: http://gredass.unife.it/; Caputo et al., 2012), which were responsible for severe earthquakes with magnitudes up to MW7.0 (Papazachos and Papazachou 1997). The Mygdonia source represents a large fault zone bordering the southern margin of the Mygdonia basin. It consists of three major fault segments: from west to east, 1) the NW-SE trending Langadhas Fault (GRIS102), 2) the EW trending Gerakarou Fault (GRIS101), which was reactivated during the Mw6.5 20 June 1978 earthquake, and 3) the Apollonia Fault (GRIS103), with a WNW-ESE strike and steeper dipping angles with respect to the previous fault segments. The Anthemountas source is a 40 km-long fault zone bounding the narrow E-W-striking Anthemountas basin to the south of Thessaloniki. It is separated into two segments: from west to east, 1) the Angelochori Fault (GRIS251) and 2) the Souroti Fault (GRIS252).
Destructive events, such as those occurring in the VIII century (677, MW=6.4 and 700, MW=6.5), the Assiros (5 July 1902, MW=6.5) and Thessaloniki (20 June 1978, MW=6.5) earthquakes, were generated by the seismic rupture of the Mygdonia seismogenic source. Instead, the Vasilika (1,677, MW=6.2) and the Thessaloniki (22 June 1759, MW=6.5) earthquakes are associated with the Anthemountas fault system.
In Figure 1, the superimposed black box indicates the size of the SPEED model, described in detail in the following Section.
3 An updated 3D numerical model of the Thessaloniki area
A 3D physics-based numerical approach, through the spectral element code SPEED (Mazzieri et al., 2013, http://speed.mox.polimi.it/), is used to simulate the seismic wave propagation during both real and scenario earthquakes occurring around the city of Thessaloniki. Smerzini et al. (2017) constructed the first 3D spectral-element model of the area and validated it on the available instrumental (one accelerometric recording in the city center) and macroseismic observations. In this work, an update of this 3D model is proposed concerning: 1) the inclusion of the Mygdonia basin in the 3D numerical model, which was neglected in Smerzini et al. (2017), 2) modification to the seismic velocity profile of the outcropping bedrock layer of the crustal model to provide more realistic velocities at shallow depths following Cotton et al. (2006); 3) new mesh of the model to provide adequate discretization of the low-velocity sediments of Mygdonia basin. Further details about model updates will be provided below.
The final 3D model extends over a volume of 82 × 64 × 31 km3 and it is discretized using an unstructured hexahedral mesh capable of propagating frequencies up to 1.5 Hz, with a third-order spectral degree, leading to a total of 100 million degrees of freedom, see computational information from Figure 2E. Numerical simulations were carried out on the Galileo100 and Marconi100 Cluster at CINECA, the largest high-performance computing center in Italy (www.cineca.it).
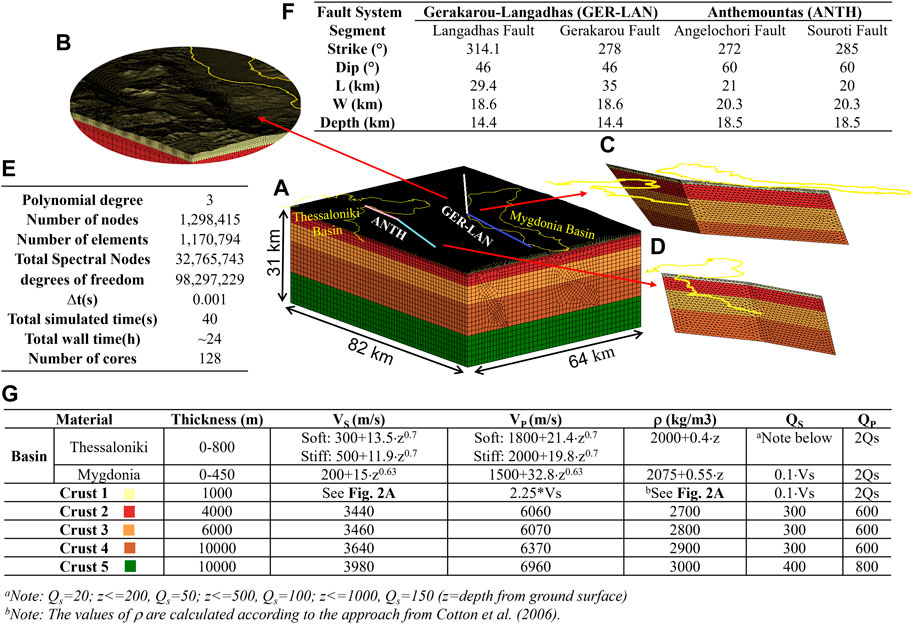
FIGURE 2. (A) Overview of the 3D numerical model and details on (B) mesh discretization in shallow layers and on the seismic faults, namely (C) GER-LAN fault and (D) ANTH fault. (E) Computational features. (F) Geometry of the seismic faults included in the numerical model. (G) 3D wave propagation model adopted for the sedimentary basins and for crustal rock layers (Shear-wave velocity: VS; compressional wave velocity: VP; soil density: ρ; quality factors: QS and QP).
As shown in Figure 2, the model includes:
• 3D geological model for both Thessaloniki and Mygdonia;
• crustal model for rock materials, as in Smerzini et al. (2017), apart from the modification of the velocity of the first layer, as explained below;
• the Gerakarou-Langhadas (GRIS101-GRIS102) Faults, referred to as GER-LAN hereafter, and the Anthemountas (GRIS251-GRIS252) Faults, referred to as ANTH. The location and geometry of these faults were retrieved and adapted from the GreDaSS database (http://gredass.unife.it/) and are summarized in Figure 2F;
• ground topography.
Efforts were devoted to constructing a large-scale 3D geological model including, in the same computational domain, both the Thessaloniki basin and the Mygdonia basin. While the Thessaloniki basin model (3D shape and geophysical model) was taken from Smerzini et al. (2017), the 3D shape of the Mygdonia basin is taken from Maufroy et al. (2016). The velocity model of the soft soil deposits inside the Mygdonia basin was calibrated based on previous studies (Maufroy et al., 2016) and available recorded profiles. Specifically, a parabolic profile was defined for both S and P wave velocity as a function of the depth from the topographic surface (z), while for soil density a linear profile was assumed, as follows:
For S wave velocity, VS = 200+15⋅z0.63
For P wave velocity, VP = 1500+32.8⋅z0.63
For soil density, ρ = 2,075+0.55⋅z
Besides, a frequency-proportional quality factor QS = Q0⋅f/f0 is assumed, with f0 = 1 Hz (see sensitivity tests in Section 4) and Q0=VS/10, which is a rule-of-thumb for estimating Q based on the VS profile often used in the literature (see Laurendeau et al., 2018).
The 3D shape of both the Thessaloniki basin and the Mygdonia basin is shown in Figure 3B: the maximum sediment thickness reaches about 800 m and 500 m in the Thessaloniki and Mygdonia basin, respectively. Figure 3C shows a representative cross-section of the VS model across the Mygdonia (A-A’ in yellow line in Figure 3A).
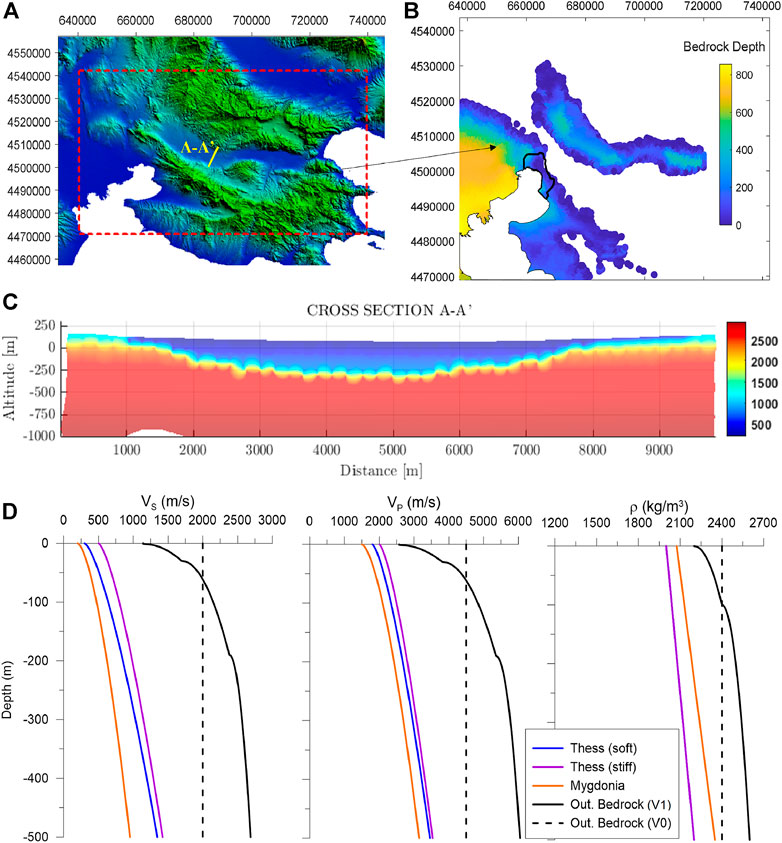
FIGURE 3. (A) Digital Elevation Model of the study area. (B) Depth of geologic bedrock in Thessaloniki and Mygdonia basins. (C) Velocity cross-section (A-A′) across the Mygdonia basin as indicated in Figure 3A. (D) VS, VP and ρ profiles within the Thessaloniki basin, Mygdonia basin and outcropping bedrock (V0 refers to the previous version in Smerzini et al., 2017; V1 refers to the model adopted in this work). Depth is measured with respect to the topographic surface.
Concerning the crustal model, the velocity of the uppermost layer was modified to provide a more realistic velocity profile of the outcropping bedrock in the area under study. Compared to Smerzini et al. (2017), where the outcropping bedrock layer consists of very hard rock with constant shear wave velocity VS = 2,000 m/s, the updated crustal model features the first layer (see Crust 1 in Figure 2G) with a gradient of VS from a minimum value of 1,150 m/s up to a value of 3,440 m/s at 1,000 m depth from the topographical surface, see continuous black line in Figure 3D. The gradient of this velocity profile was calibrated based on the studies conducted by Cotton et al. (2006) on rock velocity profiles. In Figure 3D, the VS, VP and ρ profiles for the sediments within both Thessaloniki and Mygdonia basins and the outcropping bedrock layer are shown.
4 Validation and sensitivity tests
This Section presents the validation and sensitivity tests performed on the 3D numerical model of the study area. Table 1 lists the PBS performed as propaedeutic analyses to check the performance of the numerical model especially in relation to the updates of the numerical model (see Section 3):
- Type of source. Two real earthquakes were considered for validation, the MW4.4 12 September 2005 event and the MW6.5 20 June 1978 earthquake. Provided the considerably different magnitude of the validation events, a point-source and a finite-fault kinematic source model is adopted for the medium and large magnitude earthquake, respectively. While Smerzini et al. (2017) focused on validating the model against the MW6.5 1978 event, in this work emphasis is placed on the MW4.4 event, which allows for a verification of the accuracy of the updated velocity model, neglecting the high uncertainties typically associated with the finite-fault modelling. For the 1978 event, the same kinematic source model (slip distribution and source time function) as in Smerzini et al. (2017) is adopted.
- Basin models. Numerical results with/without the Mygdonia basin and with the Thessaloniki basin are compared for the same source model, to check the influence of the added basin in the simulated ground motions in the city of Thessaloniki. While the influence of the basin is evident for the soft sites in the Mygdonia graben itself, the evaluation of the impact on sites at more considerable distances, such as in Thessaloniki at around 25 km from the basin, deserves some considerations.
- Outcropping bedrock. The effect of the new velocity profile for the outcropping bedrock is analyzed by comparing, for the same source model, results obtained with hard rock (VS = 2,000 m/s) and with softer rock profile (see profiles in Figure 3) at shallow depths.
- Linear Vs. non-linear elastic soil constitutive law. While for the MW4.4 event, a linear visco-elastic model is assumed as a reasonable assumption because of the low seismic excitation, for the MW6.5 event, a non-linear elastic constitutive model is adopted using the shear modulus and damping curves adopted in Smerzini et al. (2017). For the non-linear elastic modelling approach, we refer to Stupazzini et al. (2009).
- Anelastic attenuation model. Sensitivity tests are performed for the anelastic attenuation properties. This work assumes a frequency-proportional quality factor for all soil layers, QS = Q0⋅f/f0, with Q0 values given in Figure 2G and reference frequency f0 varying between 0.67 and 1 Hz.
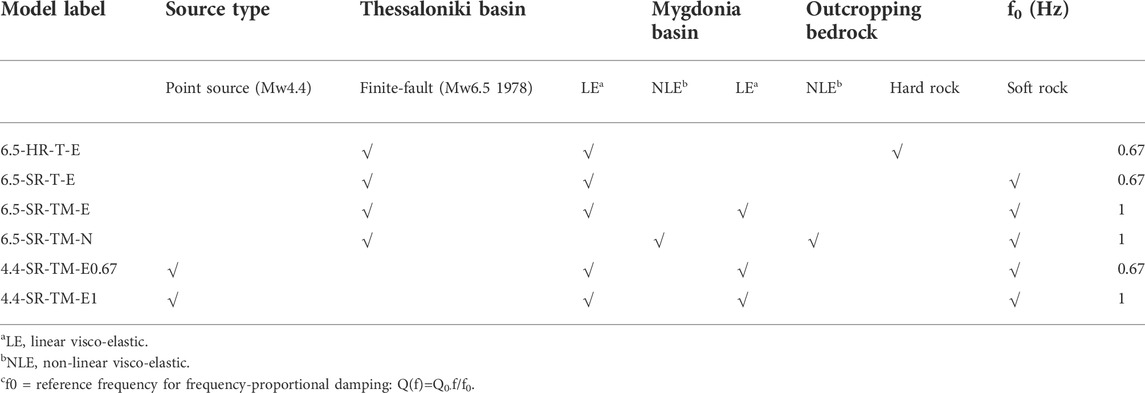
TABLE 1. Numerical simulations performed in this study for validation and sensitivity purposes.
4.1 Validation on the Mw4.4 12 september 2005 earthquake
The numerical model was applied to simulate a real MW4.4 earthquake event (strike: 281°, dip: 52°, rake: −98°) which occurred on 12 September 2005 near the Mygdonia basin with hypocenter at (40.7255°N, 23.3408°E) with a focal depth of 10 km. Owing to the small magnitude, the finiteness of the fault rupture area is neglected, and a point-source model is considered. Because the accuracy of simulations is controlled by uncertainties in the source properties, propagation path, and shallow layer structure, selecting a point-like and relatively deep event (>8 km) allows one to focus on the validation of the propagation path and local site response.
The earthquake was recorded by a total of nine stations of the EUROSEISTEST strong motion network (http://euroseisdb.civil.auth.gr/) which are considered herein for comparison between simulated and recorded ground motions. The location of the stations is shown in the map of Figure 4A.
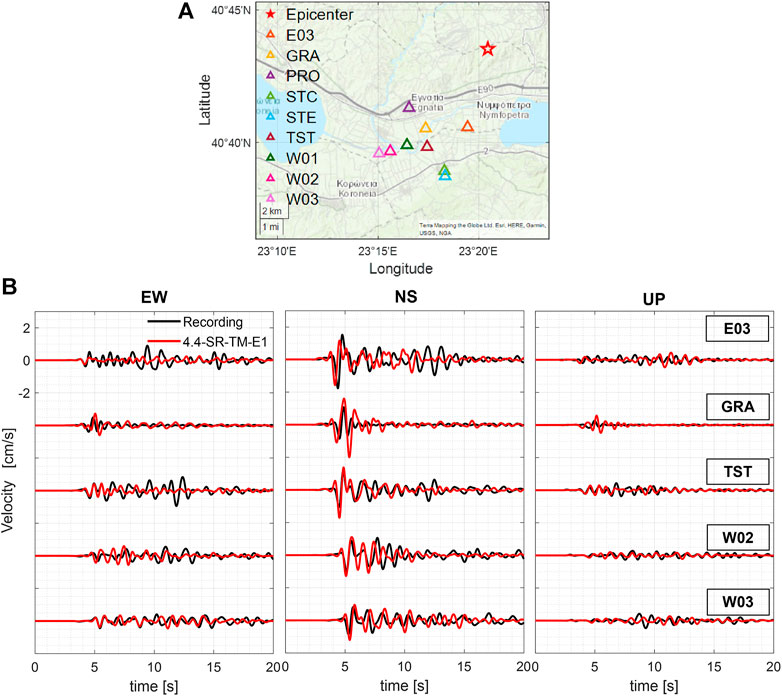
FIGURE 4. (A) Location of recording stations. (B) Comparison between recorded (black) and simulated (red, model: 4.4-SR-TM-E1) velocity time histories for EW, NS, UP components at the stations: E03 (Repi=5.4 km), GRA (Repi=6.9 km), TST (Repi=7.9 km), W02 (Repi=9.8 km) and W03 (Repi=10.4 km).
Figure 4B shows the comparison between the recorded (black) and simulated (red, model: 4.4-SR-TM-E1 of Table 1) velocity waveforms at five representative stations, namely E03, GRA, TST, W02, and W03. For the comparison, horizontal (EW and NS) and vertical (UD) components are considered and a low-pass filter at 1.5 Hz is applied. A comprehensive comparison in both time and frequency domain is available in Supplementary Image, where the recorded and simulated velocity time series and corresponding Fourier Amplitude Spectra (FAS) are shown for all nine stations which recorded the earthquake. In Supplementary Table S1, the complete list of station metadata is also provided.
The qualitative comparison of Figure 4 indicates that a satisfactory agreement is found between simulated and recorded waveforms, in terms of timing of first arrivals, amplitudes and duration. Horizontal components, especially on the NS, show a better agreement than the vertical ones. For the E03 station located at basin center, the direct arrivals on all components are well captured by the simulations but the numerical model lacks some complexity in late arrivals associated with reverberations in the basin. At GRA station, simulations overpredict the recorded peak velocity values, especially on NS and UD components, most likely because of the assumptions in the focal mechanism.
To provide a quantitative evaluation of the performance of the PBS, the Goodness-Of-Fit (GoF) criteria by Anderson (2004) were evaluated, considering six different ground motion intensity measures representative of both peak and integral parameters: Peak Ground Velocity (PGV), Peak Ground Displacement (PGD), Cumulative Absolute Velocity (CAV), Arias Intensity (AI), SA (1s), SA (2s). The scores, shown in Figure 5B, were computed on both the geometric mean of horizontal components (GMH) and the UD component. For all stations, except E03, GRA and STC, horizontal GoF scores are fair-to-excellent. In particular, on the same component, for stations TST, PRO, W01, W02, and W03, good-to-excellent scores are found for all ground motion intensity measures. UD scores are slightly worse than the ones for the horizontal components, but they remain in the fair-to-excellent range for a majority of stations and ground motion parameters. In the same figure (Figure 5A) the maps of PGV (GMH and UD components) are also shown, to appreciate the spatial distribution of the ground shaking, with clear evidence of site amplification effects, especially on horizontal ground motion, in the Mygdonia basin.
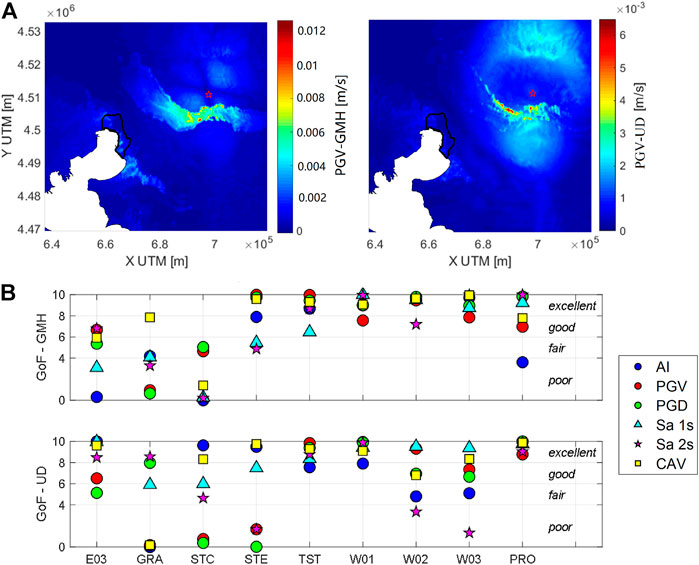
FIGURE 5. (A) Map of simulated peak ground velocity (PGV) for GMH and UD components. (B) Goodness-of-Fit according to Anderson (2004) evaluated on AI, PGV, PGD, SA (1s), SA (2s) and CAV for both GMH and UD components.
4.2 Sensitivity analyses
4.2.1 Sensitivity to the velocity model
In this section, with reference to the simulation of the Mw6.5 1978 earthquake, the impact of the 3D velocity model adopted in the simulation is investigated, by comparing the results obtained from models 6.5-HR-T-E (hard outcropping bedrock, with Thessaloniki basin only), 6.5-SR-T-E (softer outcropping bedrock, with Thessaloniki basin only) and 6.5-SR-TM-E (softer outcropping bedrock, with both Thessaloniki and Mygdonia basins). For all three simulations, a linear visco-elastic model is assumed.
Figure 6 shows the comparisons of NS velocity time histories and corresponding FAS (up to 1.5 Hz) obtained from the three PBS at two selected receivers close to the city of Thessaloniki, namely receiver A located on soft sediments in the vicinity of Thessaloniki shoreline and receiver B sited on outcropping bedrock, as indicated in Figure 6A. Results suggest that, at both receivers, softening of the mechanical rock properties produces a moderate-to-significant increase in the ground motions (peak velocities increase by a factor between 40% and 80% for rock and basin receivers, respectively). Enhancement of high frequency components is associated mainly with the site amplification features related to the softer rock layer, particularly evident at receiver B (Figure 6C). In contrast, the enrichment of lower frequencies is most likely related to the coupling of rupture propagation with softer layers. This effect is observable at both stations, confirming its correlation with the seismic source. Furthermore, the updated outcropping bedrock profile implies a more considerable impedance contrast between the sedimentary soil layers and the underlying bedrock at depths larger than 100 m (see Figure 3D), yielding significant amplification effects at low frequency at about 0.4–0.6 Hz. As expected, the presence of the Mygdonia basin has a limited impact on the ground motions at the Thessaloniki sites because of the large distances involved. However, the signals are further enriched in the higher frequency range because of the higher complexity of the source-to-site propagation path traveling across the Mygdonia soft sediments.
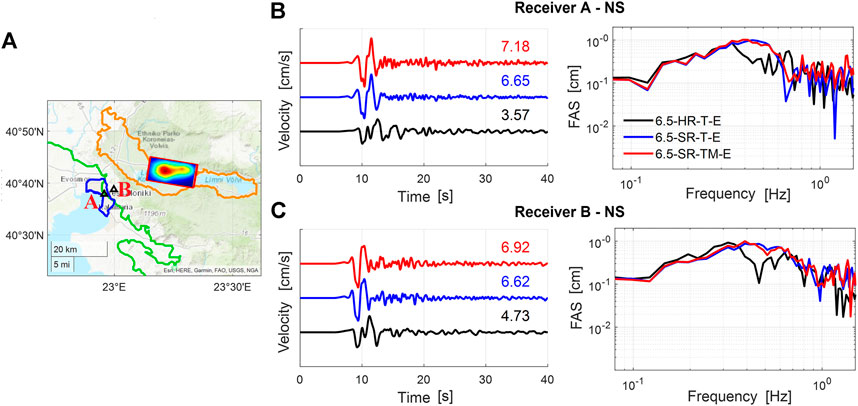
FIGURE 6. Sensitivity of results to the velocity models: 6.5-HR-T-E (black), 6.5-SR-T-E (blue) and 6.5-SR-TM-E (red). (A) Map indicating the location of receivers A and B and the slip distribution of the 1978 earthquake. (B–C) Comparison of velocity time histories and FAS computed at receiver A and B from the three models under consideration.
4.2.2 Sensitivity to anelastic attenuation
As indicated previously, a frequency-proportional quality factor has been assumed in this work and different values of the reference frequency f0 were tested. The target event is the MW4.4 earthquake and the results of the simulations 4.4-SR-TM-E0.67 and 4.4-SR-TM-E1 at E03 station are analyzed and compared. Note that the simulations consider softer outcropping bedrock, with both Thessaloniki and Mygdonia basins, linear viscoelastic model, and differ only for the reference frequency f0 which is changed from 0.67 to 1 Hz.
In Figure 7, the recorded NS velocity waveform and corresponding FAS are compared with those simulated using the two models with f0=0.67 Hz (blue) and f0=1 Hz (red, same as in Figure 4). The PBS with a lower reference frequency implies excessive reverberations in the coda of the signal because of lower damping values in the low-frequency range below around 1 Hz.
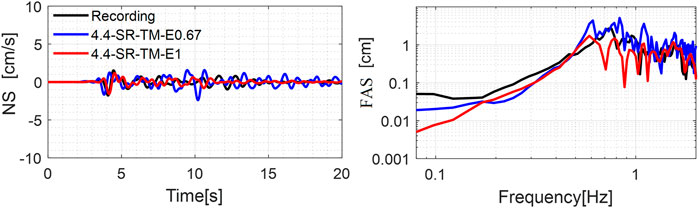
FIGURE 7. Comparison of velocity time histories and corresponding FAS (NS component) with respect to anelastic attenuation model (f0) for MW4.4 event.
4.2.3 Effect of non-linear visco-elastic soil behavior
To simulate the seismic wave propagation more realistically for moderate-to-large magnitude events, the effect of non-linear visco-elastic soil behavior is investigated, referring to the 1978 event. Non-linear soil behavior is implemented in SPEED by introducing and generalizing to the 3D case the shear modulus (G/Gmax-γ) reduction and damping (D-γ) curves adopted routinely in 1D equivalent-linear approaches. Following Smerzini et al. (2017), a single set of G/Gmax-γ and D-γ curves (see average curve in Figure 8A—black line) was employed for the shallowest 100 m thick soil deposits within both the Thessaloniki and Mygdonia basins.
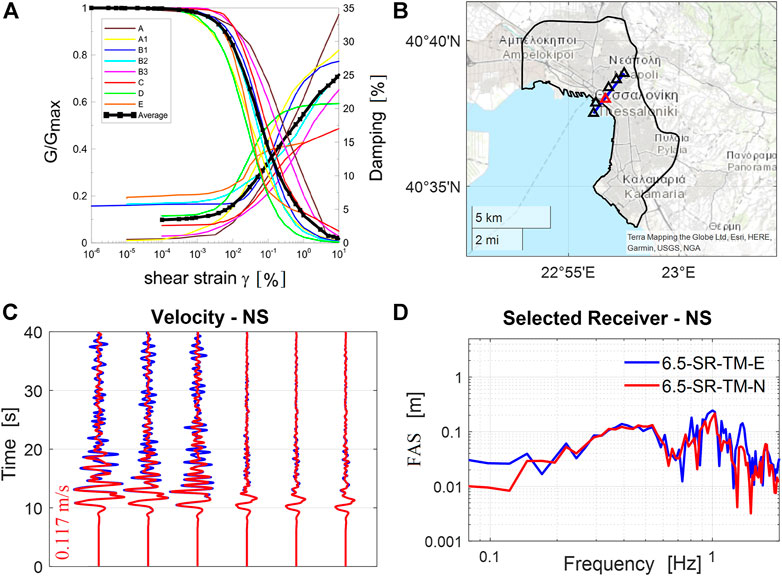
FIGURE 8. (A) G/Gmax-γ and D-γ curves (from Smerzini et al., 2017). (B) A set of receivers (triangles) along a representative cross-section across Thessaloniki. (C) Comparison of velocity time histories (NS component) computed using a linear and non-linear elastic soil model for the set of receivers in (B). (D) FAS of velocity waveform for a selected receiver (red triangle in Figure 8B).
In Figure 8C the horizontal (NS) velocity time histories computed under the assumption of linear (simulation 6.5-SR-TM-E, in blue) and non-linear (simulation 6.5-SR-TM-N, in red) soil behavior are shown for a set of receivers along a representative cross-section, passing through the city center (as indicated in Figure 8B). Note that not all receivers along the considered cross-section are on soft soils. Instead, the three receivers on the NE portion of the cross-section are located on outcropping bedrock.
Non-linearity features in ground shaking are found at the soft soil sites but such effects are limited and predominantly affect the coda of the signals due to the moderate level of ground shaking and the relatively narrow range of frequencies propagated by the model (<1.5 Hz). In Figure 8D, the FAS of the velocity motions simulated by the linear and non-linear model at a selected receiver (red triangle in the map of Figure 8B) is also shown. The analysis of the FAS of the two models confirms that, at this receiver and for this earthquake, non-linear effects slightly decrease the amplitude of frequencies above 0.7 Hz.
5 Earthquake ground motion for the MW6.5 1978 earthquake
This section provides a general overview of the ground shaking simulated for the MW6.5 1978 earthquake, emphasizing the comparison with empirical GMMs and the spatial correlation structure of ground motion. Note that the issues related to the validation of the PBS of this earthquake were already investigated by Smerzini et al. (2017), with particular reference to the finite-fault source model, which is recognized to play a major role in determining the ground motion in the epicentral area of a strong earthquake, as well as to the site response model in the Thessaloniki urban area. For the source model, a single rupture event was assumed as a reasonable simplification, although according to Papazachos et al. (1980) and Soufleris and Stewart (1981) it was a double event.
Low-frequency PBS are then enriched in the high-frequency range using the ANN2BB approach proposed by Paolucci et al. (2018; 2021). Essentially, broadband ground motions are generated by combining the results of long-period PBSs with predictions of an Artificial Neural Network (ANN) trained on a set of strong motion records (in our case SIMBAD v6.0, Smerzini et al., 2014). Compared to standard hybrid approaches, one of the main advantages of the ANN2BB procedure is the capability to establish a correlation between short and long periods and, hence, to preserve a physically consistent spatial correlation structure also at high frequencies. Hereafter broadband ground motions will be considered.
5.1 Comparison with empirical ground motion models
Figure 9A shows the ground shaking map of PGV (GMH) obtained from the 3D PBS of the 1978 earthquake (model 6.5-SR-TM-N in Table 1). Maximum PGV-GMH values of 1.2 m/s are found inside the Mygdonia graben because of the coupling between the seismic source rupture with basin amplification effects. Within the urban area, PGV values between 0.025–0.25 m/s are found. Notably at the location corresponding to the station THE, a peak velocity amplitude of 6 cm/s is simulated, in fair agreement with the recorded one (equal to about 8 cm/s).
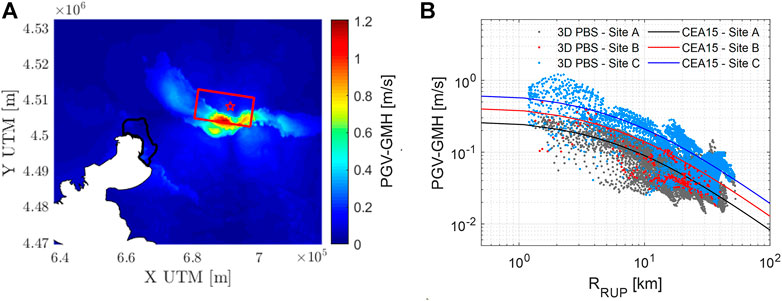
FIGURE 9. (A) Map of PGV (GMH), model 6.5-SR-TM-N. (B) Comparison of PGV (GMH) as a function of Rrup between 3D PBS and Cauzzi et al. (2015)-CEA15.
To check the overall consistency of the simulation, in Figure 9B the rate of attenuation of simulated PGV-GMH with the rupture distance (Rrup) is shown and compared with the one from the empirical GMM by Cauzzi et al. (2015), referred to as CEA15. Comparison is shown for three site categories (Site A, B, C) involved by the model according to EC8 (CEN-European Committee for Standardization, 2004) site classification. A satisfactory agreement is found between simulations and empirical predictions, especially in terms of site A (rock site) and site C (soft site), which are the predominant site classes in the model.
5.2 Spatial correlation of spectral accelerations
As indicated in the introduction, the 3D PBS presented in this work will represent the basis for conducting physics-based seismic risk evaluations in the Thessaloniki urban area. It is well-known that accounting for a realistic spatial correlation structure of ground motion intensity measures is relevant for risk assessment of spatially extended urban systems. To evaluate the spatial correlation, the procedure proposed by Infantino et al. (2021) is applied to the 3D PBS simulation of the 1978 Volvi earthquake. Specifically, under the hypotheses of stationarity and isotropy, the semivariogram γ is computed as a function of inter-station distance h on the within-event residuals of simulated spectral accelerations SA(T) with respect to the median trend using standard geostatistical tools. Referring the reader to Infantino et al. (2021) for the geostatistical approach, we limit herein to focus on the results of the semivariogram analysis for the 1978 earthquake. In Figure 10A, the sample semivariogram (grey dots) and the least-squares best-fitting exponential model (black line) are shown for PGA, SA (0.5 s), and SA (2.0 s), for the GMH component. In Figure 10B, the range, i.e., the distance above which the ground motion is assumed to be uncorrelated, and sill, i.e., the variance, are shown as a function of vibration period. As expected, range and sill are positively correlated. The range shows an increasing trend as a function of the period up to around 1 s. A maximum range of approximately 64 km is found, consistently with previous knowledge on this subject (e.g., Zerva and Zervas, 2002; Infantino et al., 2021), and, beyond this period, the range drops to values of about 20 km.
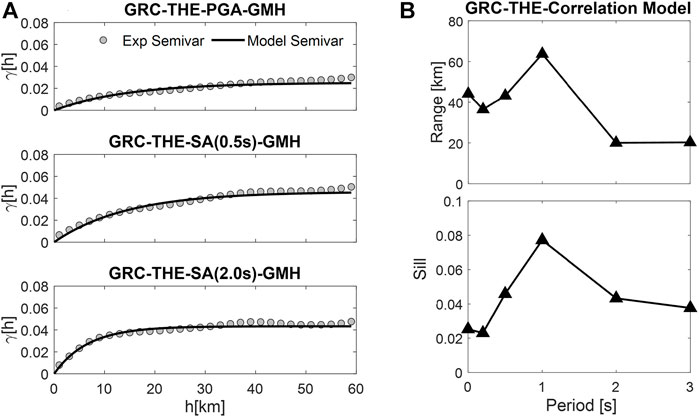
FIGURE 10. (A) Semivariogram for PGA, SA (0.5 s), and SA (2.0 s) for GMH component. (B) Range and sill of the best-fitting exponential model as a function of period.
6 Variability of ground motions as a function of seismic rupture realizations
After the successful validations and sanity checks discussed in previous sections, PBS were carried out to simulate 60 different normal-type seismic rupture realizations with MW in the range from 6.5 to 7.0 along the GER-LAN and ANTH fault systems. For all simulations, the reference model is “M”-SR-TM-N (see Table 1), where “M” (variable) is the magnitude of the scenario earthquake. As indicated in Figures 11A,B, for each fault, three magnitude levels (GER-LAN: MW=6.5/6.7/6.9; ANTH: MW=6.5/6.7/7.0) were simulated and, for each magnitude, a suite of 10 rupture realizations is generated. Globally, four magnitude levels from MW=6.5 to 7.0 were considered. An example of rupture realization along the GER-LAN fault with MW=6.5 is given in Figure 11C, in terms of the spatial distribution of co-seismic slip, rise time, and rupture time. Rupture realizations are generated within the SPEED engine assuming the kinematic source model proposed by Herrero and Bernard (1994) and applying some spatially correlated random perturbations to the rise time and rake angle following Smerzini and Villani (2012). Random perturbations of rupture times are disregarded to avoid potential super-shear issues.
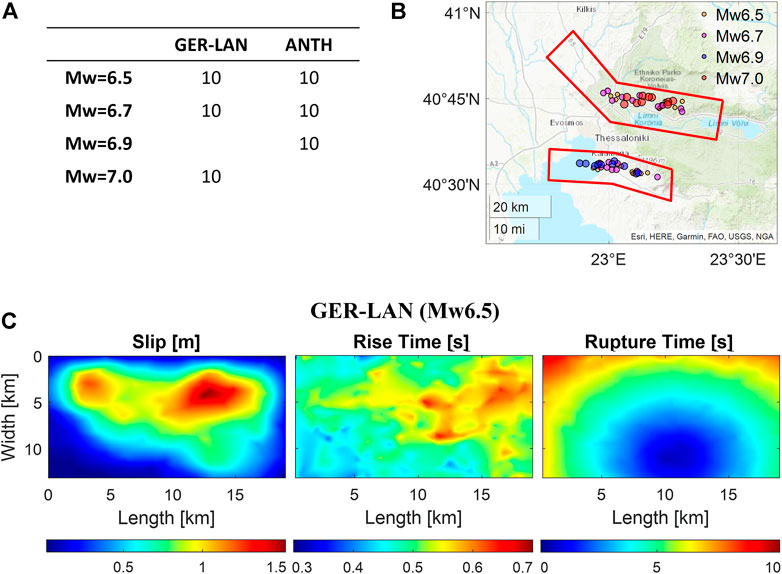
FIGURE 11. (A) List of earthquake scenarios rupturing from the GER-LAN and ANTH faults. (B) Epicenter distribution of the simulated earthquake scenarios. (C) Example of rupture realizations (MW6.5 on GER-LAN fault) in terms of co-seismic slip, rise time and rupture time.
Figure 12 shows an overview of the broadband simulated ground motions for the set of 10 MW7.0 earthquake scenarios along the GER-LAN fault. Figure 12A shows the map of median horizontal (GMH) PGA, SA (0.3 s), and SA (0.5 s), assuming a lognormal statistical distribution of ground motion at each site [i.e., median = exp (μln) where μln is the average of natural logarithmic values]. Superimposed on the maps, the epicenters (colored stars) and corresponding effective fault areas (according to the definition by Mai and Beroza (2000) and Thingbaijam and Mai (2016)) of the 10 scenarios are displayed. In Figure 12B, for each intensity measure [PGA, SA (0.3 s), SA (0.5 s)], the entire set of 10 simulated spectral accelerations on both rock-stiff and soft sites (VS30< 360 m/s) is shown as a function of Joyner-Boore distance (RJB) in comparison with the GMM by Kotha et al. (2020), referred to as K20, for shallow crustal events (blue: rock, with VS30=1,400 m/s; red: soft soil, with VS30 =300 m/s), in its ergodic formulation. VS30 values of empirical predictions are selected to match the average VS30 values implemented in the numerical model. For K20, median and corresponding dispersion bands (±σ) are shown. Short-period SA is selected herein because the Thessaloniki building stock is characterized by fundamental vibration periods approximately in this range (Riga et al., 2021). A satisfactory agreement is found between PBS and empirical predictions for all considered spectral accelerations both in terms of median values and variability.
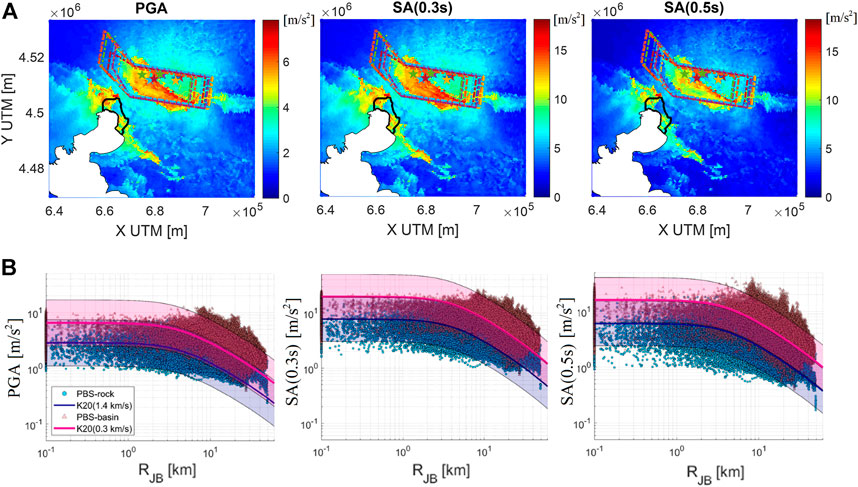
FIGURE 12. (A) Broadband simulated maps of median horizontal PGA, SA (0.3 s) and SA (0.5 s) for the 10 MW7 GER-LAN scenarios. (B) Simulated spectral accelerations as a function of distance (RJB) in comparison with the empirical GMM by Kotha et al., 2020 (K20) at both rock (blue) and basin (magenta) sites.
In Figure 13, the comparison between PBS and K20 is extended to all simulated scenarios, for horizontal SA (1 s). Specifically, each graph of Figure 13 shows the decay with RJB distance of horizontal SA (1 s) obtained from the entire set of 3D PBS, in comparison with K20 (median ±σ), for each target earthquake scenario. The latter is identified by the causative fault and magnitude. As commented previously, a general consistency is found between PBS and empirical predictions, although for lower magnitudes (M6.5) simulations tend to be lower, on average, than empirical GMM.
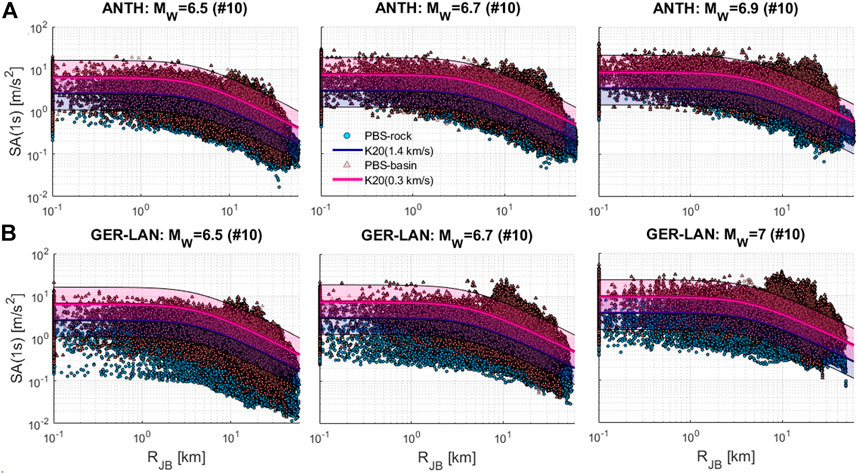
FIGURE 13. Comparison of simulated SA (1 s) as a function of distance (RJB) with K20 at both rock (blue) and basin (magenta) sites for all earthquake scenarios considered in this work: (A) ANTH with MW=6.5 (left), 6.7 (center), 6.9 (right) and (B) GER-LAN fault with MW=6.5 (left), 6.7 (center), 7.0 (right).
Finally, we analyzed the statistical distribution of simulated ground motions at selected sites within the urban area of Thessaloniki. To this end, Figure 14 shows the histograms of the frequency distribution of PGV-GMH values simulated at 69 soft sites within the Thessaloniki city center (at similar source-to-site distances and soil conditions), along with the best-fitting lognormal probability density function. The first statistical moments of the lognormal fit are reported in the figure legend. For a given target magnitude, the first statistical moments (median values and standard deviation) associated with GER-LAN (Figure 14A) scenarios tend to be systematically higher (or at least equal) than the ones for ANTH (Figure 14B) scenarios. This means that, for the city of Thessaloniki, earthquake scenarios from Mygdonia graben are more hazardous than those from the Anthemountas. This may be explained as a consequence of the relative location between the city of Thessaloniki and the causative faults, combined with the radiation pattern features. The geometry and focal mechanism (normal) of both fault systems is such that directivity effects are mainly in the up-dip direction, i.e., along the path pointing to the South with respect to the hypocenter. For the ANTH case, significant ground motion amplification effects are found southward, in the opposite direction with respect to the city of Thessaloniki.
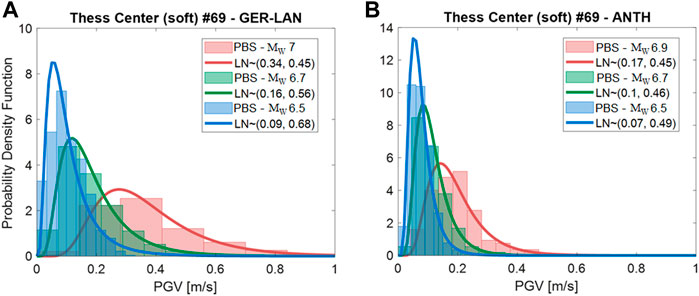
FIGURE 14. Frequency histograms and best-fitting lognormal distribution of PGV-GMH at Thessaloniki city center from the GER-LAN (A,B) ANTH earthquake scenarios with varying magnitude.
Standard deviation values (σln) range between 0.45 and 0.7, with a central value of about 0.5, which is lower than the one associated with ergodic empirical GMMs. This is reasonable as the standard deviation from PBS simulations should be compared with non-ergodic σln (e.g., according to Atik et al. (2010), it is about 0.4 for PGV).
7 Conclusions
In this research, a 3D spectral-element numerical model of the broader Thessaloniki region is constructed by including new features with respect to the previously published model. Specifically, the 3D seismic wave propagation model was updated by including, in addition to the Thessaloniki basin, the Mygdonia basin and by modifying the velocity of the outcropping bedrock of the crustal model. For model calibration, different sensitivity tests were performed to analyze the role played by the velocity model updates, the Q factors assumed in the simulation and the non-linear visco-elastic soil behavior. To validate the model, the PBS of two real earthquakes, a small MW4.4 event and the destructive MW6.5 1978 earthquake, both originating from the fault system bordering the Mygodnia basin, has been carried out. The validation is conducted at two levels, first by comparing the simulated velocity waveforms with the available recordings (for the Mw4.4 event) and with empirical GMMs (for the M6.5 event) and second, by computing the spatial correlation structure of spectral accelerations. These comparisons successfully validate the 3D model, making it suitable for calculating realistic ground motion scenarios in seismic risk studies.
After the validation of the numerical model, PBS were performed to simulate a broad set of earthquake scenarios with MW from 6.5 to 7.0 rupturing the two fault systems (GER-LAN and ANTH), which are the most relevant for seismic hazard in the city of Thessaloniki. These scenarios will be used as input ground shaking scenarios for seismic risk analyses of the building portfolio in Thessaloniki in a future work. 10 different rupture realizations were considered to capture the aleatory variability associated with the source for each target magnitude level and causative fault. The variability of the simulated ground motions is analyzed with the twofold aim of 1) verifying that the median and scatter values of predicted response spectral accelerations are realistic, in comparison with the trends obtained from GMMs calibrated on recordings, and 2) quantifying the effect of source variability on the statistical distribution of ground motion parameters at the site. A satisfactory agreement is found between PBS and empirical GMMs for the different vibration periods, including the short periods predicted by the ANN-based technique, and for the different earthquake scenarios under consideration, both in terms of median values and standard deviation. The resulting ground motion variability at selected sites is comparable to the standard deviation values associated with non-ergodic GMMs. The analysis of the statistical distribution of PGV at sites located in the central area of Thessaloniki highlights the critical role played, for a given magnitude and similar source-to-site distances, by the relative position between the receiver and the causative fault as well as by the features of the fault rupture realization (source directivity, radiation pattern). It is found, in particular, that for the city of Thessaloniki, rupture scenarios originating from the GER-LAN fault tend to be more hazardous than those from the ANTH fault system because of the relative position with respect to the fault and the focal mechanism. The set of validated 3D PBS produced in this work may represent the basis for further studies focused on seismic risk assessment in Thessaloniki, such as 1) to develop non-ergodic hybrid (i.e., from recordings and simulations) GMMs for generating region- and site-specific seismic shaking scenarios; 2) to calibrate region-specific, anisotropic and non-stationary spatial correlation models; 3) to provide ground motion time series for constraining numerical seismic fragility studies especially at high levels of ground shaking intensity, for which recordings are still too sparse.
Data availability statement
The raw data supporting the conclusion of this article will be made available by the authors, without undue reservation.
Author contributions
JL: Modeling, Simulation, Formal Analysis, Investigation, Data curation, Writing—original draft, Writing—review and editing. CS: Conceptualization, Methodology, Supervision, Writing—Review and editing. All authors have read and agreed to the published version of the manuscript.
Funding
This work has been funded by the URBASIS Project “New challenges for Urban Engineering Seismology,” H2020-MSCA-ITN-2018, Grant Agreement No. 813137.
Acknowledgments
The authors wish to thank Manuela Vanini, Sri Sangaraju, Ilario Mazzieri and Chiara Amendola for their support in the development and processing of the physics-based simulations. The authors thank also Fabrice Hollander for providing the 3D model of the Mygdonia basin. Authors are grateful to Alessandro Vuan and Basil Margaris for their constructive comments that helped improve the quality of the paper.
Conflict of interest
The authors declare that the research was conducted in the absence of any commercial or financial relationships that could be construed as a potential conflict of interest.
Publisher’s note
All claims expressed in this article are solely those of the authors and do not necessarily represent those of their affiliated organizations, or those of the publisher, the editors and the reviewers. Any product that may be evaluated in this article, or claim that may be made by its manufacturer, is not guaranteed or endorsed by the publisher.
Supplementary material
The Supplementary Material for this article can be found online at: https://www.frontiersin.org/articles/10.3389/feart.2022.951781/full#supplementary-material
References
Anderson, J. G. (2004). “Quantitative measure of the goodness-of-fit of synthetic seismograms,” in Proceedings of the 13th World Conference on Earthquake Engineering, Vancouver, B.C., Canada, 1-6 August 2004 (Earthquake Engineering Research Institute). Paper 243.
Atik, L. A., Abrahamson, N., Bommer, J. J., Scherbaum, F., Cotton, F., Kuehn, N., et al. (2010). The variability of ground-motion prediction models and its Components. Seismol. Res. Lett. 81 (5), 794–801. doi:10.1785/gssrl.81.5.794
Bradley, B. A., Pettinga, D., Baker, J. W., and Fraser, J. (2017). Guidance on the utilization of earthquake-induced ground motion simulations in engineering practice. Earthq. Spectra 33 (3), 809–835. doi:10.1193/120216eqs219ep
Caputo, R., Chatzipetros, A., and Pavlides, S. (2012). The Greek database of seismogenic sources (GreDaSS): State-of-the-art for northern Greece. Ann. Geophys. 55 (5), 859–894. doi:10.4401/ag-5168
Caramenti, L., Menafoglio, A., Sgobba, S., and Lanzano, G. (2022). Multi-source geographically weighted regression for regionalized ground-motion models. Spat. Stat. 47, 100610. doi:10.1016/j.spasta.2022.100610
Cauzzi, C., Faccioli, E., Vanini, M., and Bianchini, A. (2015). Updated predictive equations for broadband (0.01–10s) horizontal response spectra and peak ground motions, based on a global dataset of digital acceleration records. Bull. Earthq. Eng. 13, 1587–1612. doi:10.1007/s10518-014-9685-y
CEN - European Committee for Standardization (2004). Eurocode 8 Design of structures for earthquake resistance -Part 1: General rules, seismic actions and rules for buildings, EN 1998-1. London: British Standards Institution.
Chen, Y., and Baker, J. W. (2019). Spatial correlations in CyberShake physics-based ground-motion simulations. Bull. Seismol. Soc. Am. 109 (6), 2447–2458. doi:10.1785/0120190065
Cotton, F., Scherbaum, F., Bommer, J., and Bungum, H. (2006). Criteria for selecting and adjusting ground-motion models for specific target regions: Application to central europe and rock sites. J. Seismol. 10, 137–156. doi:10.1007/s10950-005-9006-7
Crowley, H., Rodrigues, D., Silva, V., Toma-Danila, D., Despotaki, V., Riga, E., et al. (2020). Exposure model for European seismic risk assessment. Earthq. Spectra 36 (1), 252–273. doi:10.1177/8755293020919429
Douglas, J., and Edwards, B. (2016). Recent and future developments in earthquake ground motion estimation. Earth-Science Rev. 160, 203–219. doi:10.1016/j.earscirev.2016.07.005
Evangelista, L., Gaudio, S. D., Smerzini, C., D’Onofrio, A., Festa, G., Iervolino, I., et al. (2017). Physics-based seismic input for engineering applications: A case study in the aterno river valley, central Italy. Bull. Earthq. Eng. 15, 2645–2671. doi:10.1007/s10518-017-00897
Herrero, A., and Bernard, P. (1994). A kinematic self-similar rupture process for earthquakes. Bull. Seismol. Soc. Am. 84 (4), 1216–1228. doi:10.1785/BSSA0840041216
Infantino, M., Mazzieri, I., Özcebe, A. G., Paolucci, R., and Stupazzini, M. (2020). 3D physics‐based numerical simulations of ground motion in istanbul from earthquakes along the marmara segment of the north anatolian fault. Bull. Seismol. Soc. Am. 110 (5), 2559–2576. doi:10.1785/0120190235
Infantino, M., Smeizini, C., and Lin, J. (2021). Spatial correlation of broadband ground motions from physics-based numerical simulations. Earthq. Eng. Struct. Dyn. 50 (10), 2575–2594. doi:10.1002/eqe.3461
Kotha, S. R., Weatherill, G., Bindi, D., and Cotton, F. (2020). A regionally-adaptable ground-motion model for shallow crustal earthquakes in Europe. Bull. Earthq. Eng. 18, 4091–4125. doi:10.1007/s10518-020-00869-1
Laurendeau, A., Bard, P. Y., Hollender, F., Perron, V., Foundotos, L., Ktenidou, O. J., et al. (2018). Derivation of consistent hard rock (1000 < VS < 3000 m/s) GMPEs from surface and down-hole recordings: Analysis of KiK-net data. Bull. Earthq. Eng. 16, 2253–2284. doi:10.1007/s10518-017-0142-6
Mai, P., and Beroza, G. (2000). Source scaling properties from finite-fault-rupture models. Bull. Seismol. Soc. Am. 90 (3), 604–615. doi:10.1785/0119990126
Maufroy, E., Kristek, J., Moczo, P., Chaljub, E., Hollender, F., Bard, P., et al. (2016). 3D numerical simulation and ground motion prediction: Verification, validation and beyond – lessons from the E2VP project. Soil Dyn. Earthq. Eng. 91, 53–71. doi:10.1016/j.soildyn.2016.09.047
Mazzieri, I., Stupazzini, M., Guidotti, R., and Smerzini, C. (2013). Speed: Spectral elements in elastodynamics with discontinuous galerkin: A non-conforming approach for 3D multi-scale problems. Int. J. Numer. Methods Eng. 95 (12), 991–1010. doi:10.1002/nme.4532
McCallen, D., Petrone, F., Miah, M., Pitarka, A., Rodgers, A., Abrahamson, N., et al. (2021b). EQSIM - a multidisciplinary framework for fault-to-structure earthquake simulations on exascale computers, part II: Regional simulations of building response. Earthq. Spectra 37 (2), 736–761. doi:10.1177/8755293020970980
McCallen, D., Petersson, A., Rodgers, A., Pitarka, A., Miah, M., Petrone, F., et al. (2021a). EQSIM - a multidisciplinary framework for fault-to-structure earthquake simulations on exascale computers part I: Computational models and workflow. Earthq. Spectra 37 (2), 707–735. doi:10.1177/8755293020970982
Paolucci, R., Mazzieri, I., and Smerzini, C. (2015). Anatomy of strong ground motion: Near-source records and three-dimensional physics-based numerical simulations of the Mw 6.0 2012 may 29 Po plain earthquake, Italy. Geophys. J. Int. 203 (3), 2001–2020. doi:10.1093/gji/ggv405
Paolucci, R., Gatti, F., Infantino, M., Smerzini, C., Özcebe, A. G., Stupazzini, M., et al. (2018). Broadband ground motions from 3D physics‐based numerical simulations using artificial neural networks. Bull. Seismol. Soc. Am. 108 (3), 1272–1286. doi:10.1785/0120170293
Paolucci, R., Aimar, M., Ciancimino, A., Dotti, M., Foti, S., Lanzano, G., et al. (2021). Checking the site categorization criteria and amplification factors of the 2021 draft of Eurocode 8 Part 1–1. Bull. Earthq. Eng. 19, 4199–4234. doi:10.1007/s10518-021-01118-9
Paolucci, R., Chiecchio, A., and Vanini, M. (2022). The older the better? The strange case of empirical ground motion models in the near-source of moderate-to-large magnitude earthquakes. Bull. Earthq. Eng. 20, 1325–1342. doi:10.1007/s10518-021-01304-9
Papazachos, B., Mountrakis, D., Psilovikos, A., and Leventakis, G. (1980). Focal properties of the 1978 earthquakes in the Thessaloniki area. Bulg. Geophys 6 (1), 72–80.
Paradisopoulou, P. M., Karakostas, V. G., Papadimitriou, E. E., Tranos, M. D., Papazachos, C. B., Karakaisis, G. F., et al. (2006). Microearthquake study of the broader Thessaloniki area (Northern Greece). Ann. Geophys. 49 (4-5), 1081–1093. doi:10.4401/ag-3112
Pavlides, S., and Kilias, A. (1987). Neotectonic and active faults along the serbomacedonian zone (SE chalkidiki, northern Greece). Ann. Tect. 1 (2), 97–104.
Raucoules, D., Parcharidis, I., Feurer, D., Novalli, F., Ferretti, A., Carnec, C., et al. (2008). Ground deformation detection of the greater area of Thessaloniki (Northern Greece) using radar interferometry techniques. Nat. Hazards Earth Syst. Sci. 8 (4), 779–788. doi:10.5194/nhess-8-779-2008
Riga, E., Karatzetzou, A., Apostolaki, S., Crowley, H., and Pitilakis, K. (2021). Verification of seismic risk models using observed damages from past earthquake events. Bull. Earthq. Eng. 19, 1–32. doi:10.1007/s10518-020-01017-5
Schiappapietra, E., and Douglas, J. (2020). Modelling the spatial correlation of earthquake ground motion: Insights from the literature, data from the 2016–2017 central Italy earthquake sequence and ground-motion simulations. Earth-Science Rev. 203, 103139. doi:10.1016/j.earscirev.2020.103139
Schiappapietra, E., and Smerzini, C. (2021). Spatial correlation of broadband earthquake ground motion in Norcia (Central Italy) from physics-based simulations. Bull. Earthq. Eng. 19, 4693–4717. doi:10.1007/s10518-021-01160-7
Schiappapietra, E., Stripajová, S., Pažák, P., Douglas, J., and Trendafiloski, G. (2022). Exploring the impact of spatial correlations of earthquake ground motions in the catastrophe modelling process: A case study for Italy. Bull. Earthq. Eng. doi:10.1007/s10518-022-01413-z
Sgobba, S., Felicetta, C., Lanzano, G., Ramadan, F., D’Amico, M., Pacor, F., et al. (2021a). NESS2.0: An updated version of the worldwide dataset for calibrating and adjusting ground‐motion models in near source. Bull. Seismol. Soc. Am. 111 (5), 2358–2378. doi:10.1785/0120210080
Sgobba, S., Lanzano, G., and Pacor, F. (2021b). Empirical nonergodic shaking scenarios based on spatial correlation models: An application to central Italy. Earthq. Eng. Struct. Dyn. 50, 60–80. doi:10.1002/eqe.3362
Smerzini, C., and Pitilakis, K. (2018). Seismic risk assessment at urban scale from 3D physics-based numerical modeling: The case of Thessaloniki. Bull. Earthq. Eng. 16 (7), 2609–2631. doi:10.1007/s10518-017-0287-3
Smerzini, C., and Villani, M. (2012). Broadband numerical simulations in complex near-field geological configurations: The case of the 2009 Mw 6.3 L’aquila earthquake. Bull. Seismol. Soc. Am. 102 (6), 2436–2451. doi:10.1785/0120120002
Smerzini, C., Galasso, C., Iervolino, I., and Paolucci, R. (2014). Ground motion record selection based on broadband spectral compatibility. Earthq. Spectra 30 (4), 1427. doi:10.1193/052312EQS197M
Smerzini, C., Pitilakis, K., and Hashemi, K. (2017). Evaluation of earthquake ground motion and site effects in the Thessaloniki urban area by 3D finite-fault numerical simulations. Bull. Earthq. Eng. 15, 787–812. doi:10.1007/s10518-016-9977-5
Soufleris, C., and Stewart, G. (1981). A source study of the Thessaloniki (northern Greece) 1978 earthquake sequence. Geophys. J. Int. 67 (2), 343–358. doi:10.1111/j.1365-246X.1981.tb02754.x
Stafford, P. J. (2014). Crossed and nested mixed-effects approaches for enhanced model development and removal of the ergodic assumption in empirical ground-motion models. Bull. Seismol. Soc. Am. 104 (2), 702–719. doi:10.1785/0120130145
Stupazzini, M., Paolucci, R., and Igel, H. (2009). Near-fault earthquake ground-motion simulation in the Grenoble valley by a high-performance spectral element code. Bull. Seismol. Soc. Am. 99 (1), 286–301. doi:10.1785/0120080274
Stupazzini, M., Infantino, M., Allmann, A., and Paolucci, R. (2021). Physics-based probabilistic seismic hazard and loss assessment in large urban areas: A simplified application to istanbul. Earthq. Eng. Struct. Dyn. 50, 99–115. doi:10.1002/eqe.3365
Thingbaijam, K., and Mai, P. (2016). Evidence for truncated exponential probability distribution of earthquake slip. Bull. Seismol. Soc. Am. 106 (4), 1802–1816. doi:10.1785/0120150291
Touhami, S., Gatti, F., Lopez-Caballero, F., Cottereau, R., Corrêa, L., Aubry, L., et al. (2022). SEM3D: A 3D high-fidelity numerical earthquake simulator for broadband (0–10 Hz) seismic response prediction at a regional scale. Geosciences 12 (3), 112. doi:10.3390/geosciences12030112
Tranos, M., Kilias, A., and Mountrakis, D. M. (1999). Geometry and kinematics of the tertiary post-metamorphic Circum Rhodope Belt thrust system (CRBTS), northern Greece. Bull. Geol. Soc. Greece 33, 5–16.
Tranos, M., Papadimitrioub, E., and Kiliasa, A. (2003). Thessaloniki–Gerakarou Fault zone (TGFZ): The Western extension of the 1978 Thessaloniki earthquake fault (northern Greece) and seismic hazard assessment. J. Struct. Geol. 25 (2003), 2109–2123. doi:10.1016/S0191-8141(03)00071-3
Villani, M., and Abrahamson, N. (2015). Repeatable site and path effects on the ground-motion sigma based on empirical data from southern California and simulated waveforms from the CyberShake platform. Bull. Seismol. Soc. Am. 105 (5), 2681–2695. doi:10.1785/0120140359
Wald, D. J., Worden, C. B., Thompson, E. M., and Hearne, M. (2021). ShakeMap operations, policies, and procedures. Earthq. Spectra 38 (1), 756–777. doi:10.1177/87552930211030298
Worden, C. B., Thompson, E. M., Hearne, M., and Wald, D. J. (2020). ShakeMap manual online: Technical manual, user’s guide, and software guide. United States: U.S. Geological Survey. doi:10.5066/F7D21VPQ
Keywords: earthquake ground motion, 3D physics-based numerical simulation, finite-fault rupture scenarios, spatial correlation, seismic risk
Citation: Lin J and Smerzini C (2022) Variability of physics-based simulated ground motions in Thessaloniki urban area and its implications for seismic risk assessment. Front. Earth Sci. 10:951781. doi: 10.3389/feart.2022.951781
Received: 24 May 2022; Accepted: 14 July 2022;
Published: 24 August 2022.
Edited by:
Aybige Akinci, Istituto Nazionale di Geofisica e Vulcanologia (INGV), ItalyReviewed by:
Alessandro Vuan, Istituto Nazionale di Oceanografia e di Geofisica Sperimentale, ItalyBasil Margaris, Institute of Engineering Seismology and Earthquake Engineering (ITSAK), Greece
Copyright © 2022 Lin and Smerzini. This is an open-access article distributed under the terms of the Creative Commons Attribution License (CC BY). The use, distribution or reproduction in other forums is permitted, provided the original author(s) and the copyright owner(s) are credited and that the original publication in this journal is cited, in accordance with accepted academic practice. No use, distribution or reproduction is permitted which does not comply with these terms.
*Correspondence: J. Lin, amlheXVlLmxpbkBwb2xpbWkuaXQ=