 Kaifang Shi
 Tiejian Li
 Jie Zhao
 Yang Su
 Jian Gao
 Jiaye Li
94% of researchers rate our articles as excellent or good
Learn more about the work of our research integrity team to safeguard the quality of each article we publish.
Find out more
ORIGINAL RESEARCH article
Front. Earth Sci., 29 September 2022
Sec. Hydrosphere
Volume 10 - 2022 | https://doi.org/10.3389/feart.2022.950299
This article is part of the Research TopicHydrological Processes in Agricultural LandsView all 8 articles
Precipitation recycling, defined as that precipitation in a region is partially contributed by evapotranspiration from the same region, is the interaction between terrestrial hydrology and atmospheric processes, and plays a crucial role in forming water resources. For agricultural lands, the evapotranspiration of irrigation water alters local climate by reprecipitation in surrounding regions, which can also be analyzed from the viewpoint of precipitation recycling. As the largest endorheic basin in China, the Tarim Basin has strong precipitation recycling contributed by the surrounding mountains, as well as large irrigation areas producing high-quality cotton, which makes it an appropriate study case for the recycling of irrigation water. In this paper, we calculate the water vapor sources of precipitation (WSoP) and the reprecipitation of evapotranspiration (RPoET) in the Tarim Basin by using the Water Accounting Model—Two Layers, analyze their spatial distributions, and find the moisture recycling ratio of the basin as 15.4%. We set up comparative scenarios of evapotranspiration increase by irrigation areas in different locations of the Tarim Basin, and study their difference in reprecipitation and moisture recycling. Results show that the evapotranspiration increase in different locations has a marginal reprecipitation ratio ranging from 8% to 24%, and further boosts the whole basin’s moisture recycling ratio by 0.11%–0.29%. Significant difference among the scenarios proves that the location of irrigation areas affects the reprecipitation of its evapotranspiration, and the optimized moisture recycling can benefit water resource and ecosystem conditions inside the basin. In summary, this work would be useful to provide a practical basis for irrigation planning by considering the land-atmosphere interaction.
Regional moisture recycling, which refers to the evapotranspiration of a region returning to the same region as the form of precipitation, is a crucial part of the hydrological cycle (Brubaker et al., 1993). The reprecipitation of local evapotranspiration has been recognized as an important source of precipitation for a long time, and the spatial and temporal characteristics and scale effect in moisture recycling have been studied (Starr and Peixoto, 1958; Rasmusson, 1967; Rasmusson, 1968). Studying the spatial and temporal characteristics of regional moisture recycling is useful to get better understanding of the interactions in the land-atmosphere hydrological cycle (van der Ent et al., 2010; van der Ent et al., 2013), and then to improve the efficient exploitation of regional water resources. At river basin scale, for example, Tuinenburg et al. (2012) studied the characteristics of reprecipitation in the Ganges Basin in India and found the recycling ratio as 4.5%.
Irrigation is the most consumptive use of water resources, about two-thirds of the global freshwater extracted from the surface and sub-surface is used for agricultural irrigation, mostly in irrigation areas (Shiklomanov, 2000). The increase of evapotranspiration in irrigation areas generally affects the spatial distribution of reprecipitation and is likely to influence local and regional climate through the surface energy balance (Pielke and Zeng, 1984; Chase et al., 1999). Many studies related to the spatial and temporal characteristics of moisture recycling in irrigation areas have been conducted (Boucher et al., 2004; Wei et al., 2013; Valmassoi et al., 2020; Liu et al., 2021). For example, Wei et al. (2013) studied four intensively irrigated regions across the world and discovered that local evapotranspiration has the greatest effect on their local precipitation than other reasons, and the reprecipitation is greater in wet areas than that in arid areas with the same increase in evapotranspiration.
The Tarim Basin, located in southern Xinjiang, China, is a large endorheic inter-mountain basin with irrigation areas for agricultural production, including large-amount and high-quality cotton productions. Hai and Guihua (2013) studied the moisture recycling in the Tarim Basin and found that the multi-year mean reprecipitation ratio is about 14%. Yao et al. (2020) used the conventional box model to study the characteristics of the regional moisture recycling in the whole Xinjiang Province and found that the reprecipitation ratio is around 6%–8%, whose changes were dominated by the moisture variables; they also found a rapid warming and moistening trend in Xinjiang over the last two decades.
Irrigation areas consume a large amount of water, hence the impact of evapotranspiration and reprecipitation on regional climate, water resources, and ecological conditions cannot be ignored. Existing studies have shown that anthropogenic changes in the spatial and temporal distribution of water resources can affect the regional moisture recycling process (Yao et al., 2020). However, most of the current planning of irrigation areas mainly focuses on surface water, ground water, and water diversion projects, very few studies take the full advantage of regional moisture recycling in optimizing the allocation of water resources, and the impact of the irrigation area’s location on reprecipitation benefits has not been revealed, especially in arid and water-scarce irrigation areas. Therefore, the effect of evapotranspiration from irrigation areas on local climate should be considered in terms of how to plan new irrigation areas more rationally, and the assessment of reprecipitation and its water resource and ecological benefits can be done as the first step.
In this paper, we choose the Tarim Basin as the research region and use the Water Accounting Model—Two Layers (WAM-2Layers) to study the spatial and temporal characteristics of the land-atmosphere coupled moisture recycling and to simulate the influence of the spatial layout of irrigation areas on moisture recycling, with comparative scenarios. The study area, method, data, results, discussion, and conclusions are presented as follows.
The endorheic Tarim Basin is located among the Tianshan Mountains, Kunlun Mountains, and Altun Mountains, with the only low-relief Lop Nor Lake on the eastern border. It covers an area of about 530,000 km2, with the Taklamakan Desert, the largest desert in China, at the center. Its altitude ranges between 800 and 1,300 m above the mean sea level, with relatively high land in the west and low part in the east. The annual mean precipitation is less than 100 mm/yr, with a dry climate and high potential evaporation (Li et al., 2012). Most oases in the Tarim Basin are purely irrigated agricultural land producing cotton and grains, making Xinjiang the famous high-quality cotton-producing region across the world. The study area in this paper is the whole Tarim Basin, including the surrounding mountain ranges and the inner basin (see Figure 1).
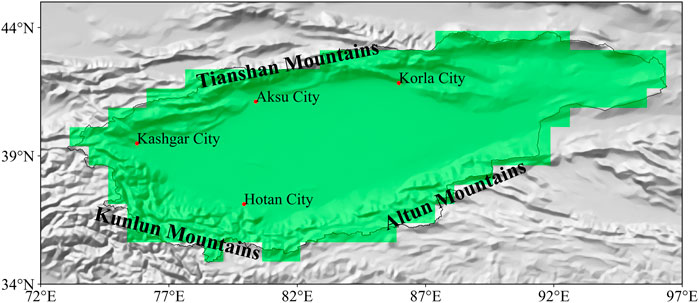
FIGURE 1. Study area as the Tarim Basin.
The Water Accounting Model (WAM) uses an area mark in a given atmospheric Euler field to track or backtrack moisture movement and then calculate RPoET or WSoP (van der Ent et al., 2010; van der Ent and Savenije, 2013). The equation of water mass conservation in the atmosphere is
where
For an area marked as
When tracking RPoET, evapotranspiration from area
Assuming that the moisture
where Eqs 4, 5 are used to track RPoET and to backtrack WSoP, respectively.
To reduce the error caused by vertical wind shear, the WAM model has been improved to the WAM-2Layers (van der Ent and Savenije, 2013; van der Ent et al., 2014). In the improved model, the atmospheric moisture of different stratified pressure layers above the surface is divided into two layers, i.e., the upper and lower layers, respectively, and then the moisture transport can be calculated separately. In the calculation, the moisture evaporated from the ground only affects the lower layer directly, and the exchange between the two layers is calculated by the vertical wind. This paper uses WAM-2Layers model to carry out the following analysis, and the source code is downloaded from its Github page.
When moisture evapotranspiration, transportation, and precipitation are calculated in discrete numeric fields, it is possible to mark the area
When tracking RPoET, the distribution of reprecipitation can be denoted as the spatial field
where
When backtracking WSoP, the spatial field of evapotranspiration
where
For the whole area
where
We can notice that, for a certain region,
However, RPoET tracking and WSoP backtracking are always carried out respectively using the WAM-2Layers model, then the values of
To ensure the consistency among different variables, the ERA-5 reanalysis data (https://www.ecmwf.int/en/forecasts/datasets/reanalysis-datasets/era5) from the European Centre for Medium-Range Weather Forecasts (ECMWF) are used in this paper for all the variables including atmospheric moisture, wind speed, precipitation, and evapotranspiration. The ERA-5 data has been widely used in climatology and climate change studies, and its reliability in temperature, precipitation, water vapor, and cloud properties has been verified in different regions in China (e.g., Xue et al., 2019; Zhao et al., 2021).
We choose the ERA-5 data with a horizontal resolution of 0.75°, and the atmospheric fields, i.e., moisture and wind speed, with 17 stratified pressure layers, i.e., 35/66/80/87/94/99/105/111/113/119/126/128/130/132/134/136/137. The two layers of the WAM-2Layers model is divided at the ERA-5 layer 113, which is 835 hPa over sea surface and automatically adapts to surface topography. The temporal resolution of this ERA-5 data is 1 h for precipitation and evapotranspiration, and 6 h for the atmospheric fields. The time range of this study is from 1980 to 2018, with a total length of 39 years; the calculation step used in the WAM-2Layers is 0.25 h, and the input data are interpolated in the temporal dimension.
The spatial resolution of the calculation follows that of the reanalysis data, i.e., 0.75°×0.75°. Though the studied Tarim Basin takes up only 220 grid cells, to fully track RPoET and to backtrack WSoP, the spatial range for calculation remains the same as the WAM-2Layers code, which is the whole globe except for the polar regions exceeding 80°N or 80°S.
The spatial distribution of the WSoP of the Tarim Basin is shown in Figure 2, where Figure 2A is WSoP in mm/yr and Figure 2B is the ratio of WSoP over local evapotranspiration in percentage. It can be observed that the Tarim’s WSoP is mainly distributed in the western mountainous and mountain front regions, i.e., the Tianshan Mountains in the northwest and the Kunlun Mountains in the southwest, as well as the Pamirs and nearby low lands to its west and southwest; but the inner desert and low mountains in the east contribute quite little WSoP.
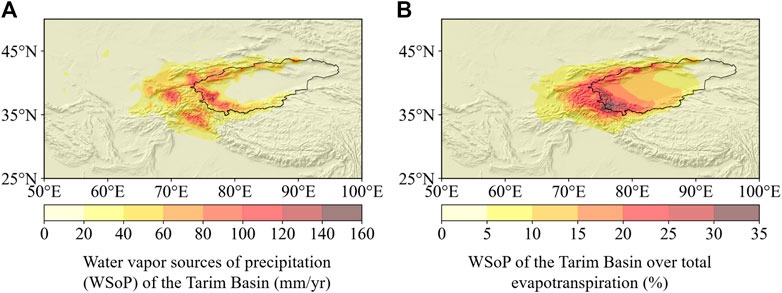
FIGURE 2. Multi-year (1980–2018) mean spatial distribution of precipitation sources of the Tarim Basin: (A) water vapor sources of precipitation; (B) contribution ratio of evapotranspiration.
Figure 2A shows that the high-altitude mountaintops contribute relatively less WSoP in mm/yr. In those cold regions, the Earth’s surface is either arid or covered by snow and glaciers, and the temperature keeps under 0°C for a longer time, leading to less evapotranspiration. Therefore, WSoP contribution from those high altitude regions is basically evapotranspiration–limited rather than atmospheric circulation controlled.
In contrast, in the mountainside and mountain front regions in the west part, the WSoP contributions can be higher than 100 mm/yr. Especially in the southwest corner of the basin, the Yerqiang River, the source of the Tarim River, which originates from the mountains and feeds one of the largest oases in the Tarim Basin, supports the maximum WSoP up to 160 mm/yr. Outside the basin, the nearby mountainside and mountain front regions to the west, i.e., the headwaters of the Aral Sea and the Indus River, have WSoP for the Tarim Basin of more than 80 mm/yr.
As for the percentage contribution of local evapotranspiration to the WSoP of the Tarim Basin shown in Figure 2, its spatial distribution becomes more smooth, which mainly represents the effect of atmospheric circulation. The WSoP ratio decreases from as high as 30% in the southwest to less than 5% in the northeast.
The spatial distribution of the RPoET of the Tarim Basin is shown in Figure 3, where Figure 3A is in mm/yr and Figure 3B is the RPoET ratio over local precipitation in percentage. It can be observed from Figure 3A that reprecipitation mainly occurs in the surrounding high-altitude areas inside the basin or in the vicinity of basin divide except for the eastern boundary. The relative high reprecipitation is mainly concentrated in the interior of the Tarim Basin, forming an obvious belt along the Tianshan Mountains and the Kunlun Mountains with more than 80 mm/yr reprecipitation, and supplying abundant runoff recharge to the oases in the mountain front. Therefore, it can be concluded that some of the basin evapotranspiration is intercepted by the surrounding high mountains and then the basin has a strong ability to hold back evapotranspiration. However, the lower elevation of the tail-end lake Lop Nor forms a notable outflow route for atmospheric water vapor, some of which is then intercepted by the Qilian Mountains to the southeast of the Tarim Basin, as the only high-value region outside the basin.
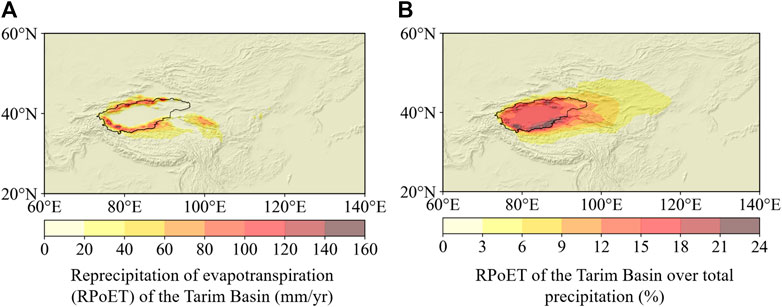
FIGURE 3. Multi-year (1980–2018) mean spatial distribution of RPoET of the Tarim Basin: (A) reprecipitation of evapotranspiration, (B) contribution ratio of precipitation.
From the percentage of RPoET over total precipitation shown in Figure 3B, we can see that the influence of reprecipitation within the basin cannot be ignored. In the southern mountainous regions, reprecipitation can take more than 20% of total precipitation; and in most basin areas, the ratio is higher than 15%. Therefore, the reprecipitation formed in the Tarim Basin by evapotranspiration from its own plays a considerable role in water resource and ecological effect in the arid endorheic basin.
The series of annual moisture recycling ratio of the Tarim Basin is shown in Figure 4, where two lines are from the WSoP backtracking (i.e., precipitation recycling ratio) and RPoET tracking (i.e., evapotranspiration recycling ratio), respectively, and the other line stands for their average. We can see that though the results from WSoP backtracking is always lower than RPoET tracking, their temporal fluctuations are highly synchronous.
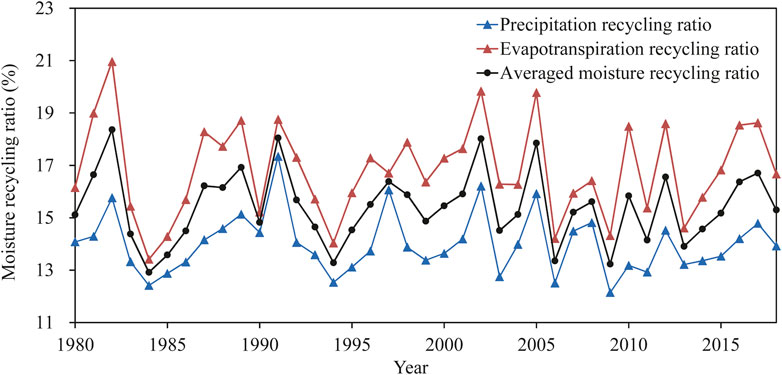
FIGURE 4. Annual moisture recycling ratio of the Tarim Basin.
The multi-year (1980–2018) mean of the moisture recycling ratio is 14.0 and 16.8% from WSoP backtracking and RPoET tracking, respectively. Nevertheless, the average of the two results, i.e., 15.4% can stand for the overall moisture recycling ratio in the Tarim Basin. This implies that 15.4% of the precipitation in the Tarim Basin is supplied by evapotranspiration inside the basin, and the remaining 84.6% is supplied outside the basin.
We can see some fluctuations in the basin’s moisture recycling ratios during the study period from 1980 to 2018, but the Mann-Kendall trend test did not show any statistical significance. Therefore, we can conclude that the moisture recycling ratio in the Tarim Basin remains stable within an interval of 12–21% during the past 39 years. If we use the averaged moisture recycling ratio only, the fluctuation interval further shrinks to 12.9%–18.4%.
Agricultural irrigation is the largest water use sector in the Tarim Basin, then it is of great significance to investigate the recycling of irrigated water resource, which would vary with the location of irrigation areas because of the uneven spatial distribution of moisture recycling. To do this, we use the scenario comparison method to observe the reprecipitation increase resulted from the increase of evapotranspiration in different sites. First, we choose different irrigation areas for different scenarios, considering the following factors:
1 To conduct a comparison, the supposed irrigation areas should be located at regions with different moisture recycling ratios, namely the proportion of evapotranspiration contributing to basin precipitation (see Figure 2B). In the Tarim Basin, the southwest has the highest value about 30%, and the east part has lower values.
2 The topography, land use and vegetation coverage, which affects the possibility of building a future irrigation area, have been taken into consideration in scenario setting. The areas with relatively low vegetation coverage (not existing agricultural land), low elevation, and flat terrain (easy for water diversion and land leveling) are suitable for scenario simulation.
3 In order to keep the supposed evapotranspiration in different scenarios comparable, all the irrigation regions have a same area of two cells in the simulation grid.
According to the above principles, three regions have been selected for scenario comparison in the Tarim Basin (see Figure 5).
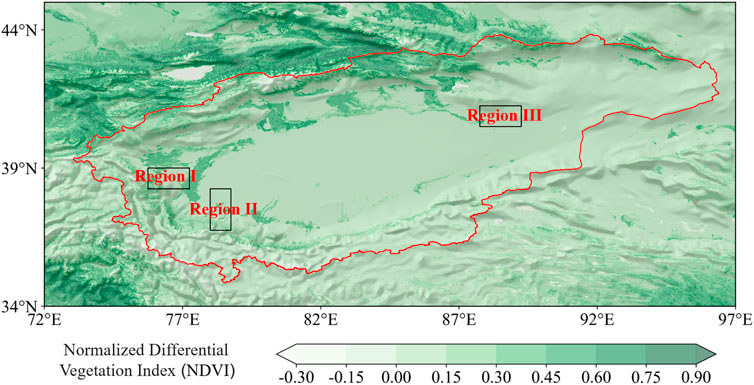
FIGURE 5. Supposed irrigation regions with two grid cells for scenario comparison in the Tarim Basin with growing season normalized differential vegetation index (1980–2018 mean) and terrain.
Second, we set supposed evapotranspiration data for the comparison scenarios. We refer to the original WAM-2Layers simulation as the baseline scenario, and for the scenarios with supposed evapotranspiration increase as Scenario I to III (see Table 1). The baseline value of multi-year mean evapotranspiration in the two grid cells in different scenarios is shown in Table 1. To set the supposed evapotranspiration in a reasonable range of 450–500 mm/yr, which is common for nearby agricultural lands, and to make the calculation simpler, we doubled (Region I) or tripled (Region II and III) evapotranspiration in those two cells for each time step in the ERA-5 data, respectively for the three scenarios. The baseline and increased mean evapotranspiration in the scenario regions is shown in Table 1, while all the other variables and grid cells keep unchanged.
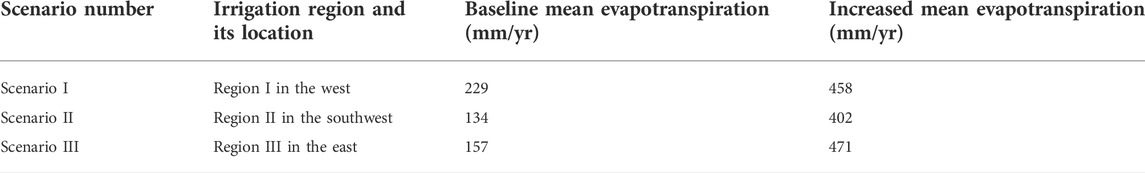
TABLE 1. Scenario setting of different irrigation areas.
Third, The WAM-2Layers model is used to calculate the spatial distribution of reprecipitation under different scenarios, with 0.25 h time step for the total 39 years (same as the baseline simulation) and one run for each scenario, then the scenarios’ change in reprecipitation from the baseline will be the key results for analysis.
For each scenario, its difference from the baseline is used to analyze the destination of increased evapotranspiration from irrigation, and to compare the influence of the location of irrigation region.
Figure 6 shows the spatial distribution of the RPoET in the Tarim Basin, where Figure 6A is the baseline, Figure 6B is Scenario I, and Figure 6C is the difference between the two, i.e., Figure 6C = Figure 6B—Figure 6A. From Figures 6A,6B, there is no obvious difference between Scenario I and the baseline can be observed in the whole spatial layout, since the area with evapotranspiration increase is relatively small for the whole basin (2 cells in 220). As shown in Figure 6C, the reprecipitation increment from the increased evapotranspiration mainly locates in the western and northwestern parts of the Tarim Basin, with high values >5 mm/yr in mountainous regions. Moreover, the remote Qilian Mountains to the basin’s southeast also have relative high values.
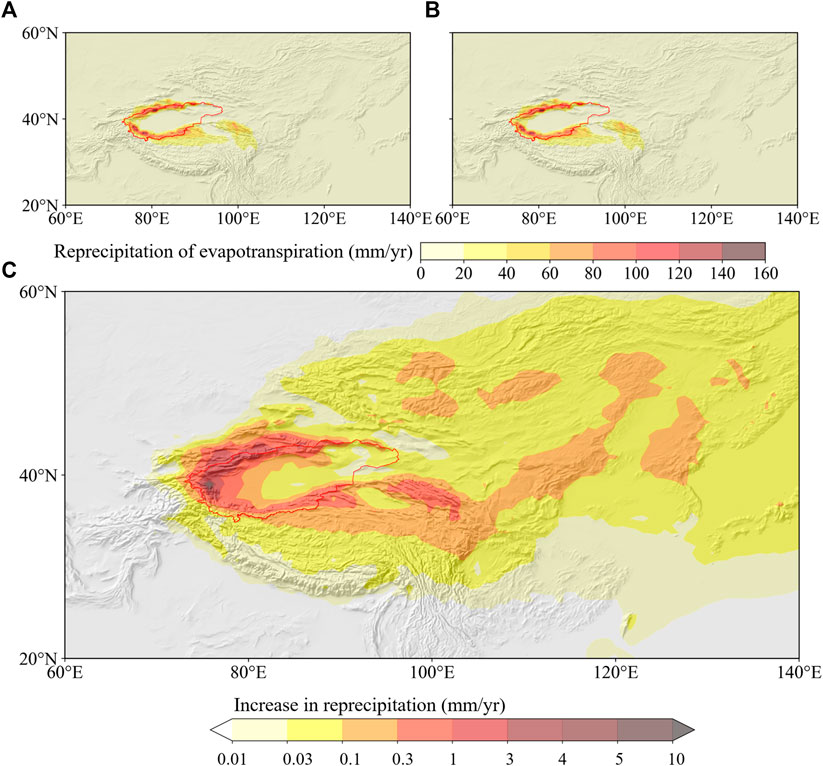
FIGURE 6. Spatial distribution of reprecipitation in the Tarim Basin of (A) the baseline scenario and (B) Scenario I, and (C) the difference between Scenario I and the baseline scenario.
We summarize the change in moisture recycling under different scenarios in Table 2. For Scenario I, the evapotranspiration increase in Region I is 2.48×10⁹ m3/yr, of which 0.525×10⁹ m3/yr precipitates inside the basin. Therefore, the marginal evapotranspiration recycling ratio of Scenario I can be obtained as 21%, which is basically consistent with the existing value shown in Figure 2B. This means that 21% of the supposed evapotranspiration increment in Region I will convert to precipitation inside the Tarim Basin. To quantify the contribution of irrigation growth to moisture recycling of the whole basin, we find that the multi-year (1980–2018) mean evapotranspiration recycling ratio of the Tarim Basin under Scenario I is 17.05%, which is 0.22% higher than the baseline (16.83%). Namely, the reprecipitation of evapotranspiration increase in Region I has a positive effect on the moisture recycling of the Tarim Basin.
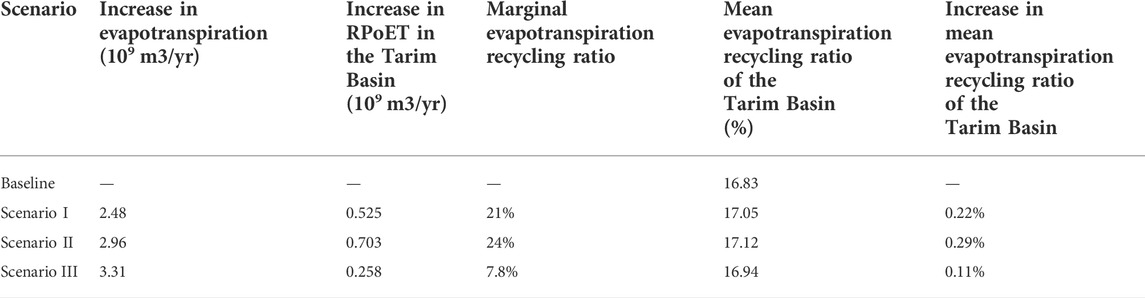
TABLE 2. Change in moisture recycling under different scenarios.
Figure 7 is the same as Figure 6 but for Scenario II. From the differential plot of Figure 7C, it is obvious that under Scenario II, the reprecipitation from the increased evapotranspiration forms a high-value region in the southwestern part and northwestern mountains in the Tarim Basin with high values >5 mm/yr, as well as the southern border and the remote Qilian Mountains. The marginal evapotranspiration recycling ratio of Scenario II is 24% as shown in Table 2, which is higher than Scenario I and consistent with Figure 2B. The evapotranspiration recycling ratio of the whole Tarim Basin also increased to 17.12% in Scenario II, 0.29% higher than the baseline.

FIGURE 7. Spatial distribution of reprecipitation in the Tarim Basin of (A) the baseline scenario and (B) Scenario II, and (C) the difference between Scenario II and the baseline scenario.
Figure 8 is the same as Figures 6, 7 but for Scenario III. From the differential plot of Figure 8C, it is obvious that in Scenario III, the reprecipitation from the increased evapotranspiration in Region III forms a high-value region locally in the northeastern part of the Tarim Basin, and relative high regions remotely in the Qilian Mountains and farther eastern mountains. It can be seen that both the extent and intensity of reprecipitation inside the Tarim Basin is largely shrunk in Scenario III compared with the previous two scenarios, which is consistent with the low recycling ratio of Region III shown in Figure 2B. The absence of high mountains in the east border of the Tarim Basin leads to farther and dispersed transport of the increased evapotranspiration in Region III. Then the marginal evapotranspiration recycling ratio of Scenario III is only 7.8% as shown in Table 2, which is much lower than Scenario I and II. The evapotranspiration recycling ratio of the whole Tarim Basin in Scenario III is 16.94%, only 0.11% higher than the baseline.
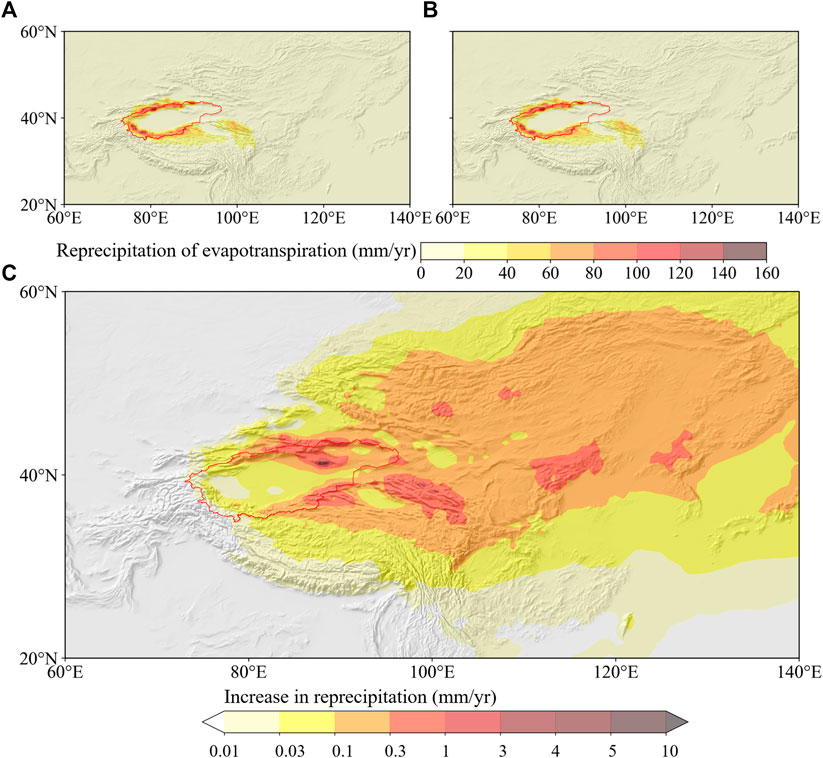
FIGURE 8. Spatial distribution of reprecipitation in the Tarim Basin of (A) the baseline scenario and (B) Scenario III, and (C) the difference between Scenario III and the baseline scenario.
We further plot the series of yearly evapotranspiration recycling ratios in the Tarim Basin from 1980 to 2018 for different scenarios, as shown in Figure 9. We can see that the evapotranspiration recycling ratio can be increased by increasing evapotranspiration in the basin, and the selection of different regions has different magnitudes of impact. We also get the result that for all the scenarios and all years, the supposed increase of evapotranspiration always has a positive effect on the recycling ratio; but for years with higher baseline value and in Scenario II, the increase in recycling ratio is more notable.

FIGURE 9. Yearly moisture recycling ratio in the Tarim Basin under different scenarios.
From the scenario simulation and comparison, we can conclude that: the effect of Scenario II on raising the moisture recycling ratio in the Tarim Basin is higher than that of the other scenarios; while Scenario III has the weakest effect on the growth of the recycling ratio due to the combined effect of its location, the local atmospheric circulation, and the basin’s surrounding terrain, which will be discussed later. We also find that within the change range of the scenarios, the marginal moisture recycling effect in different locations is consistent with the proportion of WSoP over local evapotranspiration shown in Figure 2B. Namely, for locations where currently contribute more to basin precipitation, there will be a higher effect of increasing reprecipitation inside the basin, as well as the moisture recycling ratio of the whole basin. This reminds us that for the selection of new water consumption regions, especially for irrigation and afforestation, the significant difference on moisture recycling that brings secondary water resource effect worthy a thorough consideration, which will be also discussed later.
We conducted moisture recycling ratio calculation using both the WSoP backtracking and RPoET tracking methods, and we noticed that there are some difference between the two results. Here we discuss where the difference comes from according to Eqs 8,9. We examine the denominator of the equations first, and find that evapotranspiration and precipitation generally equal to each other in this endorheic basin. In average, evapotranspiration is 6.9% less than precipitation in the Tarim Basin for the studied 39 years; for annual values, the ratio of evapotranspiration over precipitation in the basin fluctuates in the range from 0.82 to 1.09. This means that the terrestrial water storage in the Tarim basin would be increasing, which is inconsistent with the fact that the glaciers on its surrounding mountains are melting for the global warming and ground water storage in the basin are decreasing from specialized research (e.g., Zhao and Li, 2017; Zuo et al., 2021). Due to the limited precision of ERA-5 data used in this paper, we will not further discuss the water balance problem. Nevertheless, the difference between evapotranspiration and precipitation in this endorheic basin is not the main cause of the systematic bias between the two moisture recycling ratios.
For the numerator of the equations, it is found that
We should also notice that the moisture recycling ratio of a basin is scale-sensitive and even shape-sensitive (van der Ent et al., 2010), i.e., a larger basin will naturally have a greater recycling ratio, which makes its comparison among different basins less worthwhile. Nevertheless, for the endorheic Tarim Basin, despite its dry weather, the surrounding mountains would benefit its moisture recycling, and different studies for the same basin using different methods and data can be cross-compared.
In this paper, the multi-year mean moisture recycling ratio of the Tarim Basin is found to be 15.4%. This conclusion is quite similar to that of Hai and Guihua (2013), who used the conventional box method and different data and found the moisture recycling ratio in the Tarim Basin as 14%. We should notice that, the box method in Hai and Guihua (2013) used local evaporation as the key variable to calculate the recycling ratio. This method assumes that precipitation is contributed equally from atmospheric water vapor originated (evaporated) from different regions, then calculates the recycling ratio as the ratio of local evaporation over water vapor inflow plus local evaporation. This is in fact a backtracking point of view. If we use the WSoP backtracking only, the results in this paper and Hai and Guihua (2013) even coincide at 14%. Here we may conclude that the overall moisture recycling for a basin in this scale is not hard to reach a convincible result.
Here we further investigate the spatial characteristics and structure of moisture recycling, which is important for basin management, especially for those measures altering the distribution of evapotranspiration, including irrigation, forestation, and inter-basin water diversion.
The WSoP backtracking is the backward view to understand the origin of precipitation, as well as water resources. For the spatial distribution of moisture source, we have Figure 2A showing the WSoP quantity in mm per year, and Figure 2B for the relative proportion of evapotranspiration that contributes RPoET, which are determined by both the atmospheric circulation and evapotranspiration supply. It is found that there are apparent structural features in the spatial distribution of WSoP inside the basin, i.e., the moisture source is significantly concentrated in the southwest part than other regions. Though the high mountains with longer frozen period near the basin divide of the Tarim leads to low absolute value of evapotranspiration, the southwestern mountain region still has the highest proportion (>30%) of evapotranspiration’s contribution to basin precipitation.
If we turn to RPoET tracking, the forward view of evapotranspiration’s destination, we have Figure 3A for RPoET in mm per year and Figure 3B for the relative proportion of precipitation that comes from basin evapotranspiration. We can see that nearly all the RPoET in the Tarim Basin is concentrated in the surrounding mountains, and the highest relative proportion (>20%) locates in the southern part. We should notice that Hai and Guihua (2013) also gave a conclusion about the spatial distribution of moisture recycling ratio, which is equivalent to the concept discussed here, i.e., the relative proportion of precipitation from the basin inside. Their results showed that the recycling ratio is relatively high in the northern area of the Tarim Basin, especially in the northwest, which is different from the results in this paper. Because the box method and calculation treatment used in the former research are less accurate than the WAM-2Layers, we have more confidence about the results in this paper, which can be further explained by the atmospheric circulation characteristics as follows.
The Tarim Basin is located in the westerly wind belt of the northern hemisphere, and the atmospheric circulation at high altitude cannot be obviously influenced by the topography of the underlying surface. With prevailing westerlies, the wind field at high altitude (500 hPa) in all the seasons is from west to east (the right column in Figure 10). However, the prevailing westerly winds are blocked by the western slope of the Pamir Plateau, and they are partly forced to lift and to “attract” the bottom atmosphere. As a result, updrafts are formed in the western half of the Tarim Basin (Huang et al., 2015). Meanwhile, the eastern border also has an obstructing effect on the westerlies and leads to the formation of downdrafts in the east. Therefore, in the lower layer (800 hPa, the left column in Figure 10), the airflow rises in the western part and falls in the eastern part, and the planar view of the wind field has a clockwise circulation. Moreover, in summer, the moisture transport from the northwest joins the circulation and affects its shape. Nevertheless, this local atmospheric circulation within the Tarim Basin generally leads to the updraft of evapotranspiration in the eastern part, the horizontal transport of the uplifted moisture in the clockwise direction at low altitude and from the west to the east at high altitude, and finally the reprecipitation in the southeastern mountainous regions where the clockwise circulation is obstructed. This atmospheric circulation pattern determines the dominant spatial structure of moisture recycling, especially in summer, that is: evapotranspiration from the southwest reprecipitates in the south. To further reveal this structure, the Lagrangian methods (e.g., Sodemann et al., 2008) could be considered for displaying the water vapor trajectories of precipitation.
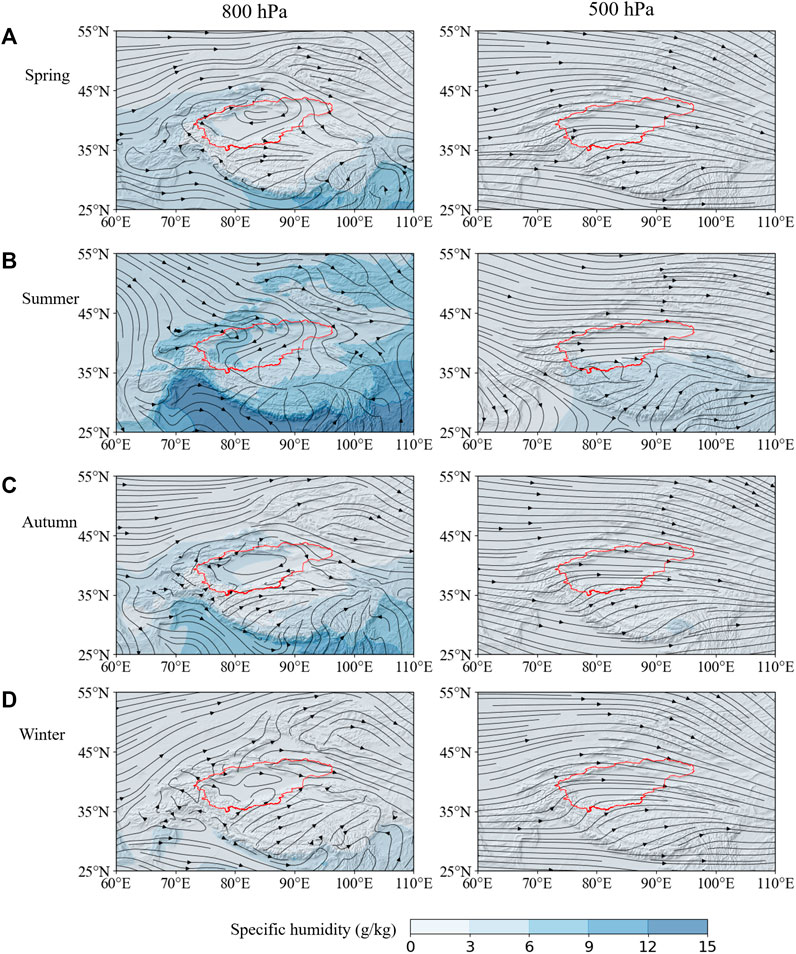
FIGURE 10. Wind fields with specific humidity at two pressure levels in different seasons (A) Spring, (B) Summer, (C) Autumn, (D) Winter in the Tarim Basin.
Reprecipitation brings evapotranspiration back to the same basin, then it is a secondary effect of water use, especially for irrigation. The overall moisture recycling ratio suggests that this effect is in the magnitude of 15% in the Tarim Basin. Although only a small portion of reprecipitation converts to conventional water resource, but the remained also benefits the arid and fragile ecosystem. To this point, we should pay more attention to the spatial link between the source (evapotranspiration) and the destination of reprecipitation. For the source, new irrigation land and forestation will reallocate or contribute new evapotranspiration, which is related in irrigation site or forestation planning. For the destination, more reprecipitation inside the arid endorheic basin is of course more favorable.
From the spatial characteristics of moisture recycling in the Tarim Basin, it can be found that the areas with higher proportion of evapotranspiration that contributes RPoET in the basin are located in the southwestern part. Furthermore, irrigation scenario simulation and comparison are conducted in this paper to reveal the reprecipitation effect of different irrigation locations. The results show that, with other conditions equal, it is better to set up new irrigation areas in the southwest of the basin than in other regions.
Irrigation areas were generally formed in history with their advantage in the adjacency with rivers and availability of proper land space, while their challenge in the future is the long-term economic and environmental sustainability (Angelakιs et al., 2020). There have been numerous advances in technology and management to improve the sustainability of irrigation areas. However, most of them focused on the irrigation area itself, and seldom extended the point of view to the atmospheric-land surface coupled water resource recycling. From the perspective of irrigation water’s reprecipitation, the consideration of water resource recycling would promote the optimization of new irrigation area planning and the recognition of existing agricultural lands’ values.
This work studied the spatial and temporal characteristics of the WSoP and the RPoET of the Tarim Basin. We obtained the moisture recycling ratio of the Tarim Basin over the past 39 years, and compared the impact of irrigation expansion in different locations on moisture recycling by scenario analysis. The conclusion can be obtained as below:
(1) For the WSoP of the Tarim Basin, high-value areas are mainly distributed in the southwest part of the basin, as well as the headwaters of the Aral Sea and the Indus River to its west; moisture recycling ratio of the Tarim Basin using the WSoP backtracking method is found to be 14.0%.
(2) For the RPoET of the Tarim Basin, high-value areas are mainly concentrated in the mountainous region in the southern part and the remote Qilian Mountains to the southeast; moisture recycling ratio of the Tarim Basin using the RPoET tracking method is found to be 16.8%.
(3) The supposed irrigation areas in different locations of the Tarim Basin have significant difference in reprecipitation and moisture recycling. The evapotranspiration increase in different locations has a marginal reprecipitation ratio ranges from 8% to 24%, and further boosts the whole basin’s moisture recycling ratio by 0.11%–0.29%.
If we extend the viewpoint of land use planning to the atmospheric-land surface coupled water resource recycling, the consideration of irrigation water’s reprecipitation, or say water resource recycling, would promote the optimization of new irrigation area planning and the recognition of existing agricultural lands’ values. For the Tarim Basin, it is obviously better to set more irrigation areas in the southwest area rather than in the east.
In this paper, in order to ensure the self-consistency of data, the ERA-5 reanalysis data was used. However, the ERA-5 data overestimates precipitation and evapotranspiration in the Tarim Basin, which reduces the reliability of the absolute quantity results of this study. Nevertheless, the moisture recycling ratio and spatial-temporal characteristics found in this paper should be reliable and of great importance. To overcome the single source and low regional precision problem of research data, more data source or uncertainty analysis should be used in further studies.
It also should be noticed that the WAM-2Layers model used in this paper is an Eulerian method, which shows the distribution of WSoP and RPoET without the transport path of moisture, from WSoP to precipitation or from evapotranspiration to RPoET. In the future, it can be considered to add Lagrangian trajectory method to moisture recycling analysis.
The original contributions presented in the study are included in the article/Supplementary Material, further inquiries can be directed to the corresponding author.
KS is in charge of calculation, analysis and writing. TL is in charge of research design and final writing. Others contribute for analysis and result discussions.
This work was supported by the Major Scientific and Technological Project of XPCC of China (2017AA002), the Second Tibetan Plateau Scientific Expedition and Research Program (STEP, 2019QZKK0208), the Scientific Research Project of the State Key Laboratory of Hydroscience and Engineering (2017-KY-4), and the Major Science and Technology Project of Qinghai Province (2021-SF-A6).
The authors declare that the research was conducted in the absence of any commercial or financial relationships that could be construed as a potential conflict of interest.
All claims expressed in this article are solely those of the authors and do not necessarily represent those of their affiliated organizations, or those of the publisher, the editors and the reviewers. Any product that may be evaluated in this article, or claim that may be made by its manufacturer, is not guaranteed or endorsed by the publisher.
Angelakιs, A. N., Zaccaria, D., Krasilnikoff, J., Salgot, M., Bazza, M., Roccaro, P., et al. (2020). Irrigation of world agricultural lands: Evolution through the millennia. Water 12 (5), 1285.
Boucher, O., Myhre, G., and Myhre, A. (2004). Direct human influence of irrigation on atmospheric water vapour and climate. Clim. Dyn. 22 (6), 597–603. doi:10.1007/s00382-004-0402-4
Brubaker, K. L., Entekhabi, D., and Eagleson, P. (1993). Estimation of continental precipitation recycling. J. Clim. 6 (6), 1077–1089. doi:10.1175/1520-0442(1993)006<1077:eocpr>2.0.co;2
Chase, T. N., Pielke, R. A., Kittel, T. G., Baron, J. S., and Stohlgren, T. J. (1999). Potential impacts on Colorado Rocky Mountain weather due to land use changes on the adjacent Great Plains. J. Geophys. Res. 104 (D14), 16673–16690. doi:10.1029/1999jd900118
Hai, H., and Guihua, L. (2013). Precipitation recycling in Tarim river basin. J. Hydrol. Eng. 18 (11), 1549–1556. doi:10.1061/(asce)he.1943-5584.0000503
Huang, W., Feng, S., Chen, J., and Chen, F. (2015). Physical mechanisms of summer precipitation variations in the Tarim Basin in northwestern China. J. Clim. 28 (9), 3579–3591. doi:10.1175/jcli-d-14-00395.1
Li, H., Mao, W., and Zhao, Y. (2012). Trends and abrupt changes in surface vapor content over Tarim Basin during the last 50 years. J. Arid land 4 (3), 260–270. doi:10.3724/sp.j.1227.2012.00260
Liu, J., Jin, J., and Niu, G. Y. (2021). Effects of irrigation on seasonal and annual temperature and precipitation over China simulated by the WRF model. J. Geophys. Res. Atmos. 126 (10), e2020JD034222. doi:10.1029/2020jd034222
Pielke, R., and Zeng, X. (1984). Influence on severe storm development of irrigated land. Convergence 6, 3–0.
Pisso, I., Sollum, E., Grythe, H., Kristiansen, N. I., Cassiani, M., Eckhardt, S., et al. (2019). The Lagrangian particle dispersion model FLEXPART version 10.4. Geosci. Model Dev. 12 (12), 4955–4997. doi:10.5194/gmd-12-4955-2019
Rasmusson, E. M. (1967). Atmospheric water vapor transport and the water balance of north America: Part I. Characteristics of the water vapor flux field. Mon. Weather Rev. 95 (7), 403–426. doi:10.1175/1520-0493(1967)095<0403:awvtat>2.3.co;2
Rasmusson, M., E. (1968). Atmospheric water vapor transport and the water balance of North America: Part II. Large-Scale water blance investigations. Mon. Weather Rev. 95 (10), 720–734. doi:10.1175/1520-0493(1968)096<0720:awvtat>2.0.co;2
Shiklomanov, I. A. (2000). Appraisal and assessment of world water resources. Water Int. 25 (1), 11–32. doi:10.1080/02508060008686794
Sodemann, H., Schwierz, C., and Wernli, H. (2008). Interannual variability of Greenland winter precipitation sources: Lagrangian moisture diagnostic and north atlantic oscillation influence. J. Geophys. Res. Atmos. 113 (D3). doi:10.1029/2007jd008503
Sprenger, M., and Wernli, H. (2015). The LAGRANTO Lagrangian analysis tool–version 2.0. Geosci. Model Dev. 8 (8), 2569–2586. doi:10.5194/gmd-8-2569-2015
Starr, V., and Peixoto, J. (1958). On the global balance of water vapor and the hydrology of deserts. Tellus 10 (2), 188–194. doi:10.3402/tellusa.v10i2.9237
Tuinenburg, O., Hutjes, R., and Kabat, P. (2012). The fate of evaporated water from the Ganges basin. J. Geophys. Res. :Atmos. 117 (D17)
Valmassoi, A., Dudhia, J., Di Sabatino, S., and Pilla, F. (2020). Irrigation impact on precipitation during a heatwave event using WRF-ARW: The summer 2015 Po Valley case. Atmos. Res. 241, 104951. doi:10.1016/j.atmosres.2020.104951
Van der Ent, R. J., and Savenije, H. H. (2013). Oceanic sources of continental precipitation and the correlation with sea surface temperature. Water Resour. Res. 49 (7), 3993–4004. doi:10.1002/wrcr.20296
Van der Ent, R. J., Savenije, H. H., Schaefli, B., and Steele‐Dunne, S. C. (2010). Origin and fate of atmospheric moisture over continents. Water Resour. Res. 46 (9). doi:10.1029/2010wr009127
Van der Ent, R., Tuinenburg, O., Knoche, H.-R., Kunstmann, H., and Savenije, H. (2013). Should we use a simple or complex model for moisture recycling and atmospheric moisture tracking? Hydrology Earth Syst. Sci. 17 (12), 4869–4884. doi:10.5194/hess-17-4869-2013
Van der Ent, R., Wang-Erlandsson, L., Keys, P. W., and Savenije, H. (2014). Contrasting roles of interception and transpiration in the hydrological cycle–Part 2: Moisture recycling. Earth Syst. Dyn. 5 (2), 471–489. doi:10.5194/esd-5-471-2014
Wei, J., Dirmeyer, P. A., Wisser, D., Bosilovich, M. G., and Mocko, D. M. (2013). Where does the irrigation water go? An estimate of the contribution of irrigation to precipitation using MERRA. J. Hydrometeorol. 14 (1), 275–289. doi:10.1175/jhm-d-12-079.1
Xue, C., Wu, H., and Jiang, X. (2019). 'Temporal and spatial change monitoring of drought grade based on ERA5 analysis data and BFAST method in the belt and road area during 1989–2017. Adv. Meteorology 2019.
Yao, J., Chen, Y., Zhao, Y., Guan, X., Mao, W., and Yang, L. (2020). Climatic and associated atmospheric water cycle changes over the Xinjiang, China. J. Hydrology 585, 124823. doi:10.1016/j.jhydrol.2020.124823
Zhao, J., Li, T., Shi, K., Qiao, Z., and Xia, Z. (2021). Evaluation of ERA-5 precipitable water vapor data in plateau areas: A case study of the northern qinghai-tibet plateau. Atmosphere 12 (10), 1367. doi:10.3390/atmos12101367
Zhao, K., and Li, X. (2017). Estimating terrestrial water storage changes in the Tarim River Basin using GRACE data. Geophys. J. Int. 211 (3), 1449–1460. doi:10.1093/gji/ggx378
Keywords: irrigation water, precipitation recycling, reprecipitation, Tarim Basin, Water Accounting Model
Citation: Shi K, Li T, Zhao J, Su Y, Gao J and Li J (2022) Atmospheric recycling of agricultural evapotranspiration in the Tarim Basin. Front. Earth Sci. 10:950299. doi: 10.3389/feart.2022.950299
Received: 22 May 2022; Accepted: 08 September 2022;
Published: 29 September 2022.
Edited by:
Jun Niu, China Agricultural University, ChinaReviewed by:
Haibo Yang, Zhengzhou University, ChinaCopyright © 2022 Shi, Li, Zhao, Su, Gao and Li. This is an open-access article distributed under the terms of the Creative Commons Attribution License (CC BY). The use, distribution or reproduction in other forums is permitted, provided the original author(s) and the copyright owner(s) are credited and that the original publication in this journal is cited, in accordance with accepted academic practice. No use, distribution or reproduction is permitted which does not comply with these terms.
*Correspondence: Tiejian Li, bGl0aWVqaWFuQHRzaW5naHVhLmVkdS5jbg==
Disclaimer: All claims expressed in this article are solely those of the authors and do not necessarily represent those of their affiliated organizations, or those of the publisher, the editors and the reviewers. Any product that may be evaluated in this article or claim that may be made by its manufacturer is not guaranteed or endorsed by the publisher.
Research integrity at Frontiers
Learn more about the work of our research integrity team to safeguard the quality of each article we publish.