
94% of researchers rate our articles as excellent or good
Learn more about the work of our research integrity team to safeguard the quality of each article we publish.
Find out more
ORIGINAL RESEARCH article
Front. Earth Sci., 12 August 2022
Sec. Cryospheric Sciences
Volume 10 - 2022 | https://doi.org/10.3389/feart.2022.949735
 Sunil N. Oulkar1,2*
 Meloth Thamban1
 Parmanand Sharma1
 Bhanu Pratap1
 Ajit T. Singh1
 Lavkush Kumar Patel1
 Ankit Pramanik1M. Ravichandran1,3
Various regional climatic factors influence glacier mass balance and thus control the water budget of the Himalayan rivers. However, the scarcity of observational data hinders a detailed understanding of the processes governing glacier mass balances in the Himalaya. Here we analyze the mass balance of the Sutri Dhaka Glacier, a debris-free glacier in the Chandra basin (western Himalaya) combining field observations and a physically based model to understand the drivers of mass balance variability. The modeled energy flux showed that net shortwave radiation contributed 56% to the total surface energy fluxes, followed by net longwave radiation (27%), sensible heat (8%), latent heat (5%), and ground heat flux (4%). However, over the ablation zone, inward fluxes account for most of the total heat flux, resulting in strong summertime melting. The model estimated glacier mass balance was −1.09 ± 0.31 and −0.62 ± 0.19 m w.e. during 2015/16 and 2016/17, which matches well with the in situ glaciological mass balance of −1.16 ± 0.33 and −0.67 ± 0.33 m w.e., respectively. A sensitivity analysis demonstrates that the mass balance of the glacier is affected by both air temperature (−0.21 m w.e. a−1 °C−1) and precipitation (0.19 m w.e. a−1 (10%)−1) changes. Our study suggests that, the mass balance of the Sutri Dhaka Glacier is less sensitive to changes in the partitioning of precipitation into snow and rain because the majority of precipitation falls as snow during the winter when the temperature is well below 0°C.
The glaciers in the Hindu Kush Himalayan region are the largest reservoir of snow and ice mass outside the polar regions and play a crucial role in supplying meltwater to the major rivers of southwest Asia, which sustain the livelihoods of nearly 1.9 billion people in the downstream region (Dyurgerov and Meier, 2005; Immerzeel et al., 2010; Bolch et al., 2012). Meltwater from the Himalayan glaciers is an important source of water to major rivers, such as Indus, Ganges, and Brahmaputra, especially during the summer months. However, the magnitude of runoff from the Himalayan glaciers is expected to vary in a changing climate, affecting downstream water supply, especially for dry seasons or years (Pritchard, 2019). Among the major basins, the Indus basin in the western Himalaya is the most dependent on snow and glacier melt, with nearly 62% of the total annual discharge contributed by snow and glacier melt, whereas this fraction is significantly less in the Ganges (20%) and Brahmaputra (25%) basins in the central and eastern Himalaya, respectively (Lutz et al., 2014). Thus, glaciers will have a dominant role in the water budget of the Indus River under future climate change scenarios.
Several studies have demonstrated the substantial loss of glacier ice mass, resulting in the rapid retreat of the Himalayan glaciers in the recent decades (Kulkarni et al., 2007; Bolch et al., 2012; Brun et al., 2017; Kumar et al., 2019; Shean et al., 2020). On a regional scale (western, central, and eastern Himalaya), the glaciers have shown enhanced thinning during the past decade except for the Karakoram and adjacent regions (Kääb et al., 2012; Gardelle et al., 2013; Farinotti et al., 2020). However, due to the remoteness and high-altitude terrain of Himalayan glaciers, in situ hydrometeorological measurements are limited to very few glaciers (Pratap et al., 2016; Azam et al., 2018; Kumar et al., 2018; Azam et al., 2019; WGMS, 2019). Thus, the relationship between atmospheric forcing and glacier mass change in the Himalaya is poorly understood. Therefore, it is essential to understand the response of glaciers to atmospheric forcing using hydrometeorological observations and numerical models. Although an empirical temperature index model (Hock, 2003) is convenient for modeling glacier mass balance using air temperature (
Within the Himalaya, the Western Disturbance (WD) and the Indian Summer Monsoon (ISM) are the dominant sources of precipitation and significantly affect the mass balance of the glaciers (Shekhar et al., 2010; Azam et al., 2014a). While WD plays a dominant role in determining glacier behavior in the western Himalaya, the ISM plays more important role in the central and eastern Himalaya. The WDs mainly contributes to the winter precipitation events in the upper Indus Basin, which are driven by the approaching extra-tropical, synoptic-scale disturbances (Dimri et al., 2015; Jean-Philippe et al., 2021). One of the major sub-basins of the upper Indus basin is the Chandra basin, which lies in the transition zone of WD and ISM (Bookhagen and Burbank, 2006). Since the Chandra River is passing through a semi-arid zone, its water budget is highly sensitive to the melting of snow and glaciers. With the recent increases in extreme events of precipitation and increasing temperature, the Chandra basin provides an ideal testbed to understand the status and climate sensitivity of glaciers from western Himalaya.
To understand the spatio-temporal variability in surface energy and mass balance, it is important to undertake integrated studies using in situ measurements and by employing energy balance models that can simulate the distributed mass balance. Towards this, we examine the Sutri Dhaka Glacier from the upper Chandra basin, a relatively large (∼20 km2) and debris-free glacier, during two contrasting meteorological years using field data and a well-constrained physically based COupled Snowpack and Ice surface energy and MAss balance model (COSIMA) (Huintjes et al., 2015). The model is forced with meteorological data obtained from an on-glacier Automatic Weather Station (AWS). We calibrate the model with meteorological and glaciological data from point locations and then use the model to simulate the mass balance for the entire glacier. This study allows us to assess the mass balance sensitivity of the Sutri Dhaka Glacier to different atmospheric variables and investigate the importance of snow-to-rain conversion during warmer years in amplifying the temperature sensitivity of the mass balance.
The Chandra basin has 201 glaciers, covering an area of 703.6 km2, having large differences in size, surface characteristics, and orientation/aspect (Sangewar and Shukla, 2009). Many glaciers of the upper Chandra basin have different aspect/orientation and may experience differences in the energy budget, especially the net shortwave radiation (Patel et al., 2021). The Sutri Dhaka Glacier is the third largest glacier of the upper Chandra basin (Figure 1). It covers an area of ∼20 km2, with a length of ∼10.7 km along a north-east orientation. It is a debris-free glacier with only 5% of the ablation area covered with thin debris (Sharma et al., 2016). The glacier elevation ranges from 4,500 m a.s.l. at the snout to 6,000 m a.s.l. at the bergschrunds with an average slope of ∼10° (Pratap et al., 2019). This glacier is a part of the long-term monitoring project by the National Centre for Polar and Ocean Research (NCPOR) since 2013, and meteorological observations started in 2015.
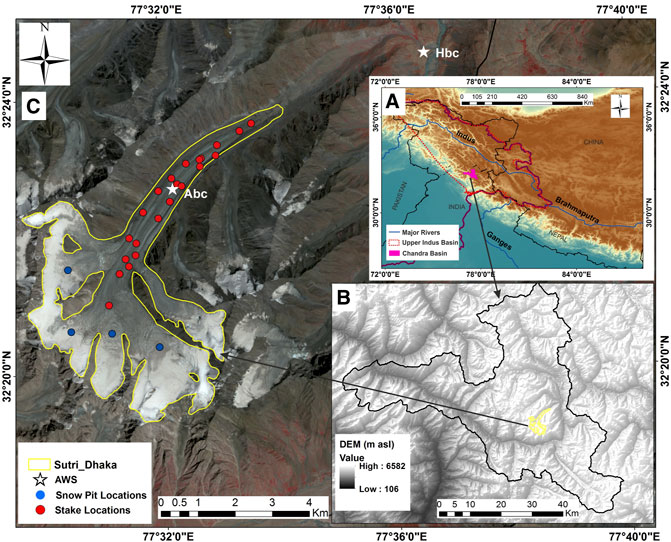
FIGURE 1. Location map (A) of the study region in the western Himalaya, (B) the Chandra basin, and (C) the Sutri Dhaka Glacier (yellow outline) with the location of two AWS (white stars) located at Abc (4,864 m a.s.l.) and Hbc (4,052 m a.s.l.). The red dots represent the ablation stakes installed, and the blue dots are accumulation pit locations.
The study region lies in the ISM-WD transition zone and the climate is dominated by relatively long winters (November–March). The glacier is located in the northern limit of the ISM and also experiences a leeward effect, therefore less amount of annual precipitation occurs during the ISM (June–September), while a significant amount of precipitation occurs in the form of snowfall during the winter as a result of active WDs (Singh et al., 2019). Furthermore, the balance year on the Sutri Dhaka Glacier is defined as 1st October to 30th September, following the approach at nearby Chhota Shigri Glacier (Wagnon et al., 2007).
Two AWS systems (Campbell Scientific) have been operating at the Sutri Dhaka Glacier catchment since October 2015 (Figure 1C). One AWS is situated on the glacier surface in the upper ablation zone at Advance base camp (Abc, 4,864 m a.s.l.), while the other is located on the open ground in the same catchment at the HIMANSH base camp (Hbc, 4,052 m a.s.l.) (Figure 1C, Figures 2A,B). The distance between Abc and Hbc is 8 km, with an altitudinal difference of 812 m. The details of the AWS sensors are listed in Table 1 including their accuracy and measurement range. The data are stored by the dataloggers at every 10-min interval.
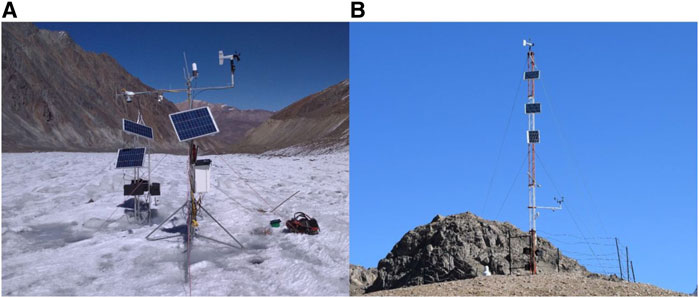
FIGURE 2. Field photos of the AWSs (A) fixed on the glacier surface at Abc (4,864 m a.s.l.) and (B) installed on the open ground at Hbc (4,052 m a.s.l.). Locations of these AWSs are marked in Figure 1.
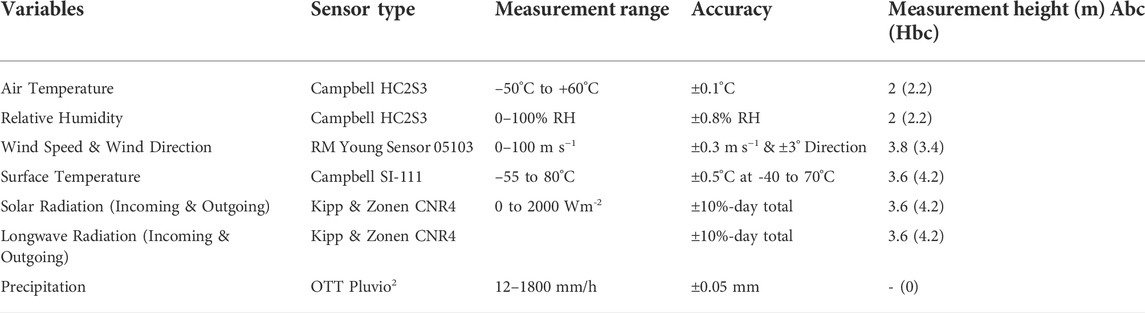
TABLE 1. List of hydrometeorological variables measured at the AWSs used in the study.
There was a data gap during the 2017 summer, as the AWS at Abc stopped functioning from 25th to 30th June owing to a power cut. The data gap in
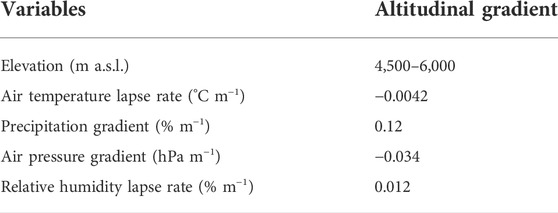
TABLE 2. The mean annual altitudinal gradient/lapse rates calculated from Abc, Hbc and ERA5 for extrapolation of data.

FIGURE 3. Observed daily mean values of (A) air temperature (
The mean annual lapse rates were calculated with the observed meteorological data obtained from Abc, Hbc, and ERA5 data (Table 2). The monthly
A digital elevation model (DEM) with a spatial resolution of 30 m obtained from the ASTER GDEM V2 from Earth Remote Sensing Data Analysis Centre (ERSDAC) (Tachikawa, 2011) was resampled bilinearly to a 45 m grid resolution. Based on the gradient (precipitation and air pressure) and lapse rate (
The surface mass balance of the Sutri Dhaka Glacier was measured using the in situ glaciological method following established methodologies (Østrem and Brugman, 1991; Cogley et al., 2011). The annual ablation and accumulation measurements were performed at the end of the ablation season (i.e., end of September). Ablation was measured using a network of stakes, and accumulation was measured through excavating snow pits or snow coring (Kovacs Mark II) at various locations on the glacier (Figure 1C). A network of 30–35 ablation stakes was drilled into the ice over the glacier surface along with different altitudinal zones for both study years (Figure 1C). These stakes were measured throughout the summer season for ablation estimation using exposed stake heights. Ice density for the ablation zone was considered to be 870 kg m−3 (±25 kg m−3, n = 10), and the snow density of 490 kg m−3 (±30 kg m−3, n = 8), which was measured in the field at the end of ablation season (Pratap et al., 2019). The accumulation zone of the glacier for glaciological measurement was accessible up to ∼5,700 m a.s.l. To estimate the total accumulation, snow density, snow water equivalent, and depth measurements were extrapolated for the entire accumulation area. Mass balance was calculated using the sum of accumulation and ablation, and integrated over the entire glacier surface area. The glacier-wide average annual mass balance is calculated using:
where
The potential annual mass balance uncertainties in the in situ observations are related to: 1) the uncertainties in ablation estimates related to stake height measurements and ice density; 2) the uncertainties in accumulation observations of snow depth and snow density; and 3) the uncertainty related to the extrapolation of point measurements of corresponding altitudinal bands and the entire glacier (Thibert et al., 2008). The uncertainties in stake height measurements could be due to the mean height difference. Although we chose a representative surface in its vicinity to install the stakes, the variability associated with the surface morphological changes (e.g., meltwater channels, boulders, and avalanches) cannot be evaluated. Rather we exclude those stakes with such uncertainties from the final calculation. Therefore, the propagated uncertainty associated with extrapolation of the ablation was ±0.19 m w.e. a−1. Furthermore, we calculated the uncertainty in accumulation measurements following the approach by Kenzhebaev et al. (2017): 1) the uncertainties in snow density were estimated as ±30 kg m−3 for calculation of the accumulation; 2) we used 0.22 m w.e. (100 m)−1 as the accumulation gradient measured at the Chhota Shigri Glacier (Azam et al., 2016) to approximate a linear increase in accumulation; and 3) for the two uppermost altitude bins, an inverse gradient is adopted. The uncertainty in accumulation measurements (±0.28 m w.e. a−1) was calculated using the mean of standard deviations obtained using the methods described above. Taking all of the errors into account, an overall uncertainty in observed mass balance at the Sutri Dhaka Glacier was calculated as ±0.33 m w.e. a−1. This is well within the estimated uncertainties of the glaciological methods ranging from ±0.27 to ±0.53 m w.e. for various Himalayan glaciers (Azam et al., 2012; Wagnon et al., 2013; Sunako et al., 2019; Mandal et al., 2020; Soheb et al., 2020).
To simulate the distributed surface energy and mass balance, we used the COSIMA model, which is an open source physically based energy balance model for high mountain glaciers. COSIMA 1D model is a point energy and mass balance model for one-dimensional use at a single location. Meanwhile, COSIMA 2D model is a two-dimensional model for spatially distributed surface energy and mass balance studies. The parameterization of subsurface energy and mass fluxes within COSIMA is directly coupled to the surface processes, as in other widely used surface energy and mass balance studies (Klok and Oerlemans, 2002; Hock and Holmgren, 2005; Pellicciotti et al., 2009). The COSIMA model includes several modules that solve the heat equation and calculate surface temperature and energy balance, meltwater percolation, refreezing, and densification (Huintjes et al., 2015). It explicitly calculates the percolation of meltwater and the refreezing process within the snowpack, taking into account the latent heat flux release and resulting subsurface melt, as well as the effects on subsurface temperature, snow density, and the ground heat flux. Furthermore, COSIMA can effectively estimate the mass balance by explicitly calculating the effects of radiation, aging, and albedo changes on the snow surface, vertical heat transport in the snow, densification of snow with depth, and liquid water retention (Huintjes et al., 2015). In addition to the full energy balance on the surface, adding snowpack to the multi-layer vertical dimension of the model enables an explicit simulation of vertical heat diffusion, percolation of liquid water from melting and rain, the refreezing of liquid water and internal accumulation, and a realistic representation of firn densification due to overloading and refreezing (Huintjes et al., 2015; Singh et al., 2018).
The model is forced by meteorological data, including
where
We separately calculated the
The parameterization of surface albedo (α) follows the scheme of Oerlemans and Knap (1998), where α is determined as a function of snowfall frequency and snow depth:
The free parameters of the surface albedo scheme are determined according to Mölg and Scherer (2012) and measurements at Abc between 2015 and 2017. The values are: fresh snow albedo (
The COSIMA subsurface model uses a vertical layer structure that consists of layers with an equal thickness of 0.2 m. The temperature, density, and depth are characterized by each subsurface ice layer. The initial temperature profile was interpolated linearly between
To assess climate sensitivity in this study, we perturbed the meteorological variables according to climatic factors and associated simulations (Yang et al., 2011; Yang et al., 2013; Sun et al., 2018; Zhu et al., 2018; Li et al., 2019). We performed sensitivity experiments for mass balance by changing the assumed value for one input parameter at a time, leaving all other parameters unchanged. The ranges of he perturbation were ±1°C for
Estimating uncertainty in complex models based on analytical solutions is extremely difficult when the set of uncertain variables is large and nonlinear effects exist. Therefore, the model uncertainty was estimated using the Monte Carlo simulations (Van Der Veen, 2002). The model uncertainty was estimated based on repeated modeling of the mass balance at all observed point locations on the Sutri Dhaka Glacier. A model run was repeated 100 times in the Monte Carlo simulation, in which the normally distributed model parameters and threshold were varied by 10% and the input variables were randomly varied within their uncertainty ranges to estimate the final uncertainty (Machguth et al., 2008). The mass balance uncertainty of 100 simulations was evaluated using standard deviation. We found that the difference between the observed and the modeled mass balance is within the range of uncertainty of 100 simulations (Supplementary Figure S2). The overall uncertainty of modeled mass balance was ±25%.
The meteorological data for the two balance years (2015/16 and 2016/17) obtained from the on-glacier site Abc are shown in Figure 3. Over the study period, daily
The COSIMA 1D model was used to assess the efficiency at several sites where calculations were done for one grid point, providing a quick and efficient technique to test the model performance. Initially, a set of observed hourly meteorological data were used as input data to run the COSIMA 1D model at the Abc site (Figure 1C) for the period from 4th October 2015 to 15th September 2017. Furthermore, the 1D model results were evaluated against the observed surface temperature,
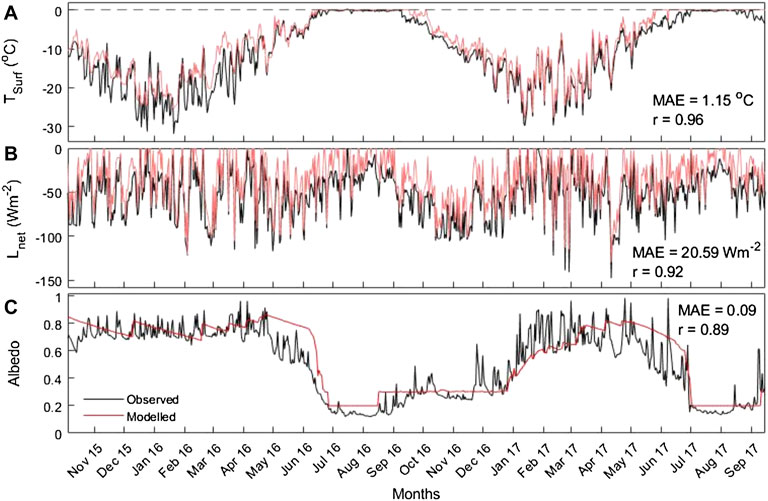
FIGURE 4. Observed (black) and modeled (red) daily mean values of (A) surface temperature (
The observed mass balance for the nearest ablation stake (∼5 m from Abc site, 4,863 m a.s.l.) was −4.30 ± 0.33 and −3.59 ± 0.33 m w.e. and the calibrated modeled surface mass balance at Abc site was −3.98 ± 0.99 and −3.34 ± 0.84 m w.e. for the balance year 2015/16 and 2016/17, respectively. Furthermore, we plotted the observed annual balances (point-wise) with the modeled annual balance at the corresponding grid location (Figure 5). The coefficient of determination (R2) between the simulation and the measurement for the surface mass balance was 0.97 (RMSE=0.38 m w.e.) for 2015/16 and 0.98 (RMSE=0.58 m w.e.) for 2016/17, respectively (Figure 5). The modeled (observed) annual mass balance gradient between 4,500 and 5,500 m a.s.l. was 0.8 (0.87) m w.e. (100 m)−1 and 0.79 (0.9) m w.e. (100 m)−1 for the balance year 2015/16 and 2016/17, respectively. Overall, the model has an excellent ability to simulate the mass balance processes of the Sutri Dhaka Glacier and performed well for the study period from 4th October 2015 to 15th September 2017.
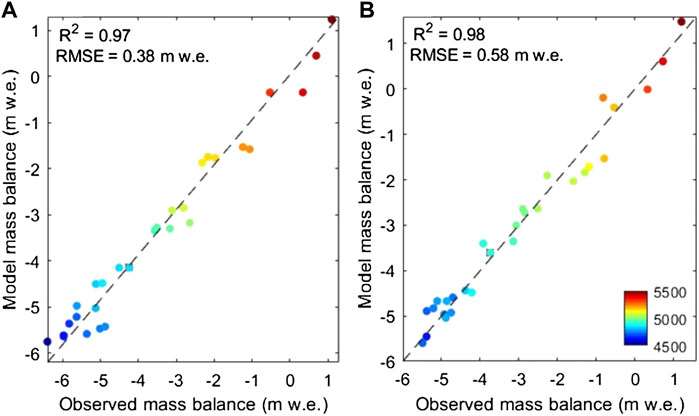
FIGURE 5. Comparison of observed and modeled mass balance (m w.e.) at the Sutri Dhaka Glacier for two contrasting meteorological years: (A) 2015/16 and (B) 2016/17.
The simulated spatial variability of
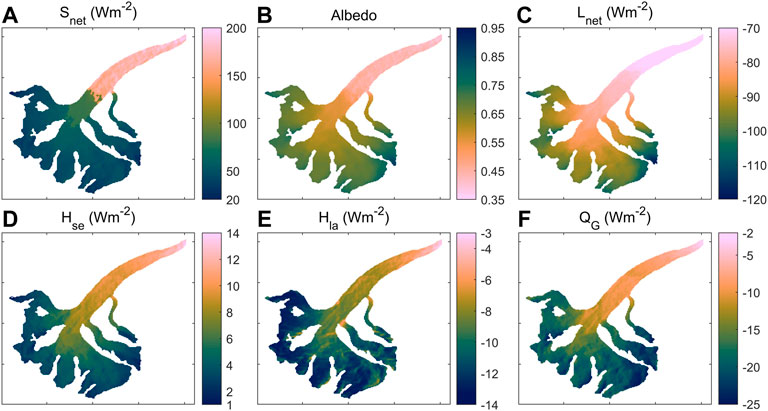
FIGURE 6. Spatial distribution of modeled mean surface energy fluxes for the Sutri Dhaka Glacier over two balance years 2015/16 to 2016/17. (A) Net shortwave (
We demarcated the accumulation and ablation area of the glacier based on the observed mean equilibrium line altitude (ELA) (5,300 m a.s.l.). The contribution of the energy fluxes was separately estimated for accumulation, ablation, and glacier-wide zone based on the simulation (Figure 7: Supplementary Figure S3). In the accumulation and ablation zones, surface energy exchanges happen due to distinct climatic characteristics (Wu et al., 2016).
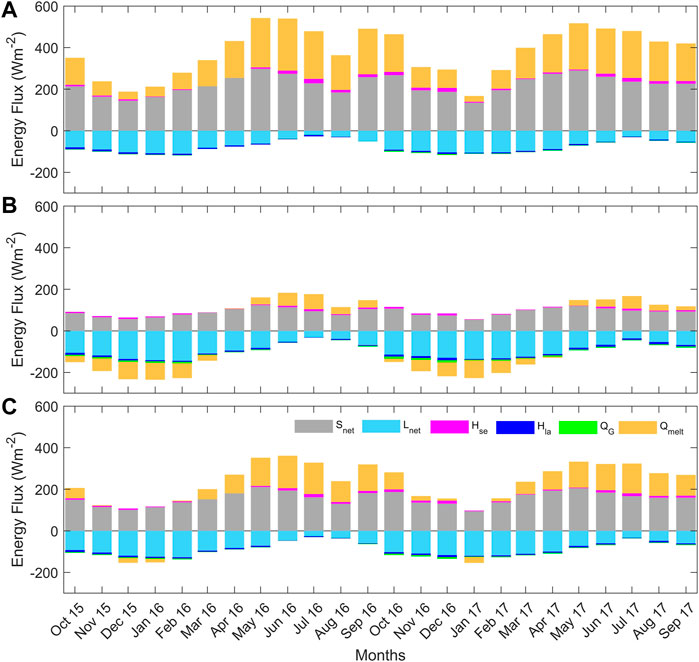
FIGURE 7. The monthly mean surface energy fluxes for the (A) ablation zone (below 5,300 m a.s.l.), (B) accumulation zone (above 5,300 m a.s.l.), and (C) glacier-wide region of the Sutri Dhaka Glacier.
In the accumulation zone, the mean energy fluxes during the winter (2015/16 and 2016/17) were predominantly governed by outward
The glacier-wide mean annual energy flux showed that
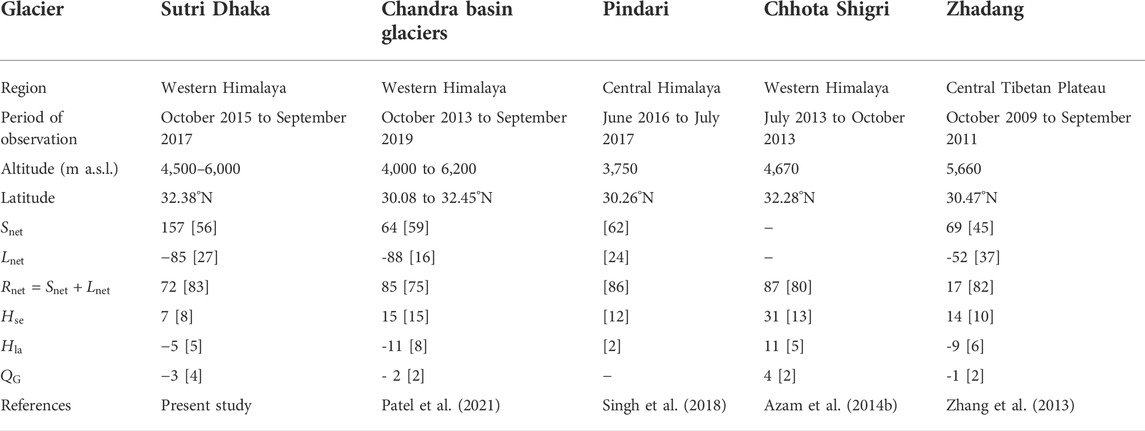
TABLE 3. Comparison of the characteristics and mean annual surface energy fluxes (Wm−2) for various Himalayan glaciers. Values in square brackets are the % contribution of each energy fluxes.
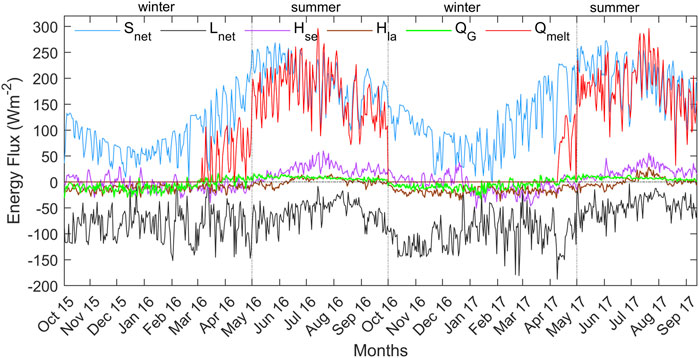
FIGURE 8. Modeled daily mean values of surface energy fluxes at the Sutri Dhaka Glacier from October 2015 to September 2017.
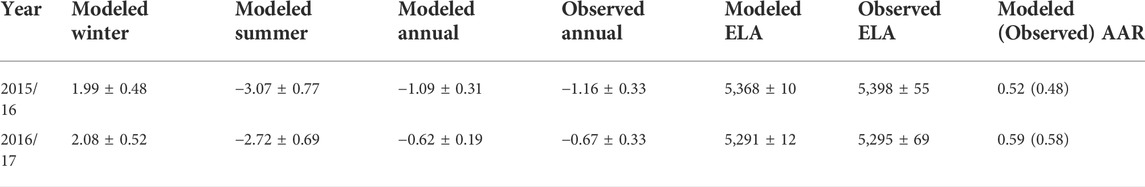
TABLE 4. The modeled seasonal and annual mass balance (m w.e.), as well as the observed annual mass balance (m w.e.), modeled (observed) equilibrium line altitude (ELA; m a.s.l.), and accumulation area ratio (AAR) of the Sutri Dhaka Glacier.
A comparison of surface energy balance of the Sutri Dhaka Glacier depicting similarities (and important differences) with other Himalayan glaciers is shown in Table 3. As previously observed for Himalayan glaciers (Yang et al., 2011; Zhang et al., 2013; Azam et al., 2014b; Singh et al., 2018; Patel et al., 2021), the current study also revealed that
The modeled distributed surface mass balance values of the Sutri Dhaka Glacier revealed significant seasonal and interannual variability, with high positive values during the winter and stronger snow/ice mass loss during the summer (Table 4). The modeled glacier-wide annual balances were -1.09 ± 0.31 and -0.62 ± 0.19 m w.e. during 2015/16 and 2016/17, respectively (Figure 9 and Table 4). The values matched well with the observed values of −1.16 ± 0.33 and −0.67 ± 0.33 m w.e. during 2015/16 and 2016/17, respectively (Table 4). The ice loss was higher in the lower ablation zone and decreased with an increase in altitude. The modeled mean annual mass balance for two balance years was −0.86 ± 0.21 m w.e. a−1, which was similar to the mass balance reported by Sharma et al. (2020) based on the field results (−0.82 ± 0.17 m w.e. a−1 for 2013–2017). Our findings are also consistent with the study of Patel et al. (2021), who estimated an annual mass balance of −0.74 ± 0.1 m w.e. a−1 for the Sutri Dhaka Glacier during 2013–2019. However, our estimated mass balance is more negative than the Chhota Shigri Glacier that has a value of −0.46 ± 0.40 m w.e. a−1 for the period 2002–2019 (Mandal et al., 2020). The estimated geodetic mass balance for the Chandra basin is −0.68 ± 0.15 and −0.65 ± 0.43 m w.e. a−1 for the periods 1999–2011 and 2000–2012, respectively (Gardelle et al., 2013; Vijay and Braun, 2016), which is close to our estimate.
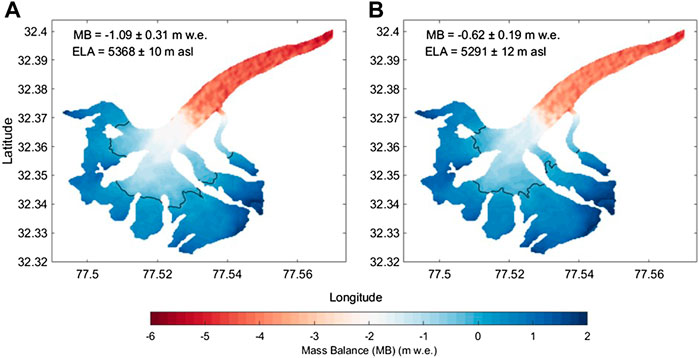
FIGURE 9. Spatial distribution of modeled annual mass balance at the Sutri Dhaka Glacier for the balance years (A) 2015/16 and (B) 2016/17. The black line indicates the equilibrium line altitude (ELA).
The modeled (observed) ELA was 5,368 ± 10 (5,398 ± 55) m a.s.l. and 5,291 ± 12 (5,295 ± 69) m a.s.l. during the year 2015/16 and 2016/17, respectively (Figure 9 and Table 4). The observed and model ELA of the Sutri Dhaka Glacier was higher than the observed ELA of Chhota Shigri Glacier (i.e., 5,047 ± 104 m a.s.l.) (Mandal et al., 2020).
Among the climate variables, summer
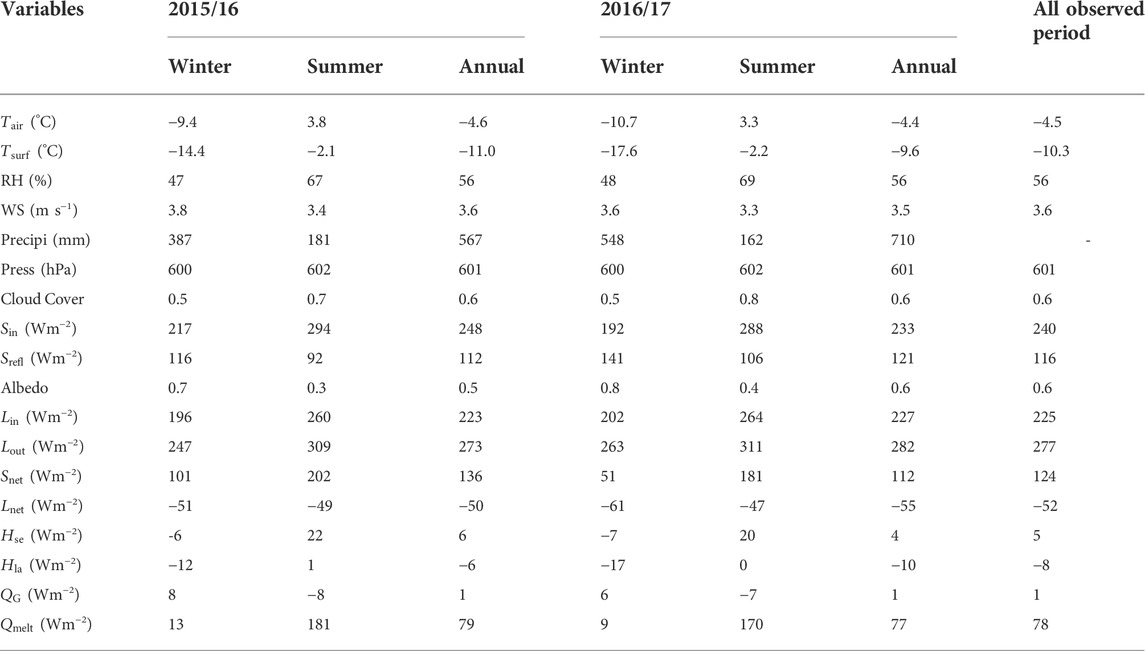
TABLE 5. Mean seasonal and annual meteorological variables and energy fluxes over the Sutri Dhaka Glacier, for study period from October 2015 to September 2017.
To explore the impact of seasonality and type of precipitation in controlling the annual mass balance of the Sutri Dhaka Glacier, we examined the precipitation rates and partition for the balance years 2015/16 and 2016/17. The modeled daily mean precipitation rates were 13.19 and 17.91 mm w.e. d−1 during 2015/16 and 2016/17, respectively. During the winter, the mean daily rates of snowfall (rainfall) were 16.01 (0.00) and 23.76 (0.00) mm w.e. d−1 for 2015/16 and 2016/17, respectively. In comparison, during the summer, the mean daily rates of snowfall (rainfall) were 3.31 (2.73) and 4.06 (2.26) mm w.e. d−1 for 2015/16 and 2016/17, respectively. Therefore, the nearly 33% increase in winter snowfall, slightly enhanced summer snowfall and slightly reduced rainfall during 2016/17 led to reduced glacier melt compared to 2015/16.
The climatic sensitivity of mass balance for the Sutri Dhaka Glacier was estimated using climatic variables and related simulations (Table 6). The model results suggest a decrease of mean annual mass balance of −0.25 m w.e. (29%) over an increase of 1°C in the
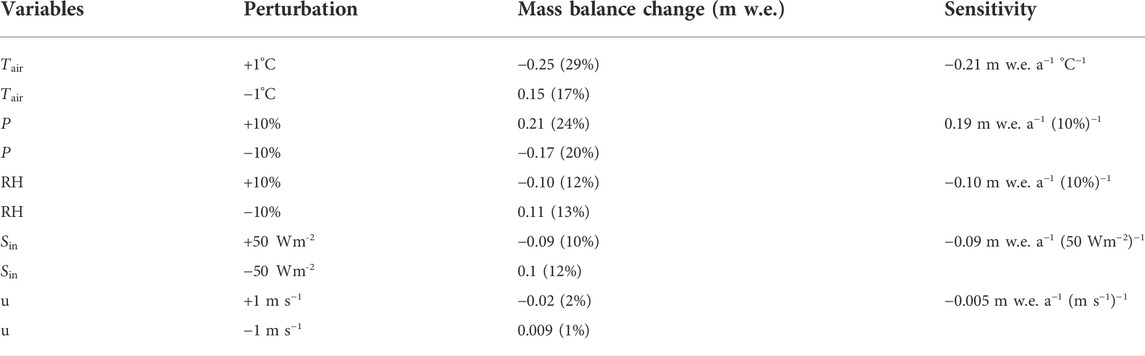
TABLE 6. Sensitivities of Sutri Dhaka Glacier mass balance to air temperature (
A comparison with other glaciers in the region indicated that the mass balance sensitivity to
The temperature variability not only controls that of the melt but also influences the partitioning of the precipitation into snow or rain. The latter process has a potentially strong impact on the energy balance due to an associated albedo feedback. Following Cullen and Conway (2015), we investigated the role of the snow-to-rain partitioning on the mass balance of the Sutri Dhaka Glacier by considering the frequency distribution of daily mean
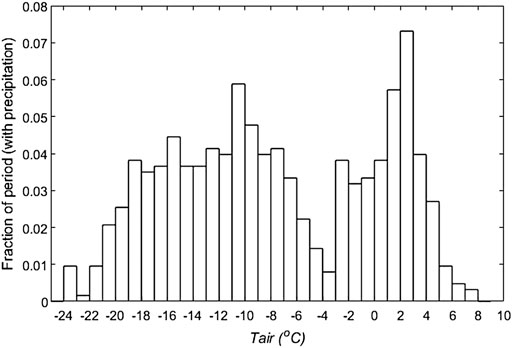
FIGURE 10. Distribution of air temperature (
The current approach employing a well-constrained energy balance model demonstrates its ability to realistically simulate the distributed surface energy and mass balance of the Sutri Dhaka Glacier in the western Himalaya. Given that the model output corresponded well with the field measurements for two contrasting meteorological years, it supports the robustness of the model for its extended application for other Himalayan glaciers. Recent studies showed that most of the glaciers in the Hindu Kush Himalaya region are losing volume and mass due to increasing temperature caused by climate change (Immerzeel et al., 2010; Kraaijenbrink et al., 2017; Hock et al., 2019). Our study revealed that the glaciers in the Chandra basin of western Himalaya are highly sensitive to variations in precipitation and
The present study is limited in extent, and therefore has some limitations. The differences in observed and modeled mass balance in the lower ablation area could be attributed to local factors such as the deposition of more dust at the beginning of the melt season, the presence of cryoconite holes, and debris cover. Due to these local factors, the lower ablation area may experience lower albedo and enhance the absorption of shortwave radiation, leading to higher melting than predicted. Observations of surface characteristics are required to impact the albedo parameterization of these processes in glacier models to minimize uncertainty in simulations (Collier et al., 2015; Soncini et al., 2017; Buri and Pellicciotti, 2018). The uncertainty of distributed meteorological variables is difficult to describe for glaciers due to local factors and micro-meteorological impacts (Shaw et al., 2021). Furthermore, other warm-air processes, such as the nonlinear effect of katabatic winds, impact of debris, and valley heating, may affect the lower ablation area of glaciers (Shea and Moore, 2010; Ayala et al., 2015; Shaw et al., 2021). Due to the variability of these effects, the melt rate is diverse and complex over the lower ablation area. Long-term datasets are required to examine the variability and implications of meteorological forcing during highly varying climatic conditions across different glaciers. Such long-term observations, integrated with climate model output, will be necessary for developing and validating glaciological and meteorological models for the Himalayan region. This would allow researchers to investigate the impact of ongoing and future climate variability on glaciers and hydrology.
We derived the distributed surface energy and mass balance of the Sutri Dhaka Glacier in the western Himalaya using a physically based model (COSIMA) in response to atmospheric forcing, and compared the results with glaciological mass balance observations during two contrasting meteorological years. First, we simulated surface energy and mass balance at the observed point location and calibrated it with the stakes-based glaciological mass balance data. The simulated surface albedo, incoming longwave radiation, and surface temperature using the model corresponded well with the observed values. Comparison of model output with the in situ observations suggests that the model performed well, and is therefore reliable for simulating distributed surface energy and mass balance. Seasonal variations in energy fluxes were dominated by changes in
The raw data supporting the conclusions of this article will be made available by the authors, without undue reservation.
SNO, PS, and MT defined the objectives and designed the study. SNO, PS, BP, AS, and LKP collected the field data. SNO and BP performed the calculations. SNO, BP, MT, MR, AS, and AP interpreted the results. All authors contributed to the interpretation and discussion of the manuscript.
We thank the Ministry of Earth Sciences for financial support through the project “PACER—Cryosphere and Climate”.
We are thankful to the Director, National Centre for Polar and Ocean Research (NCPOR) for supporting the research at NCPOR. We acknowledge Argha Banerjee from the Indian Institute of Science Education and Research (IISER), Pune, for his critical suggestions and a careful review of this manuscript. The first author would like to thank Rahul Dey, Mohammad Nuruzzama and Vikram Goel for their valuable comments. We are grateful to ECMWF-ERA5 and SRTM teams for providing the data through their websites. We are also thankful to our field support team who were involved in our field trips. We thank scientific editor Nozomu Takeuchi and reviewers (Shin Sugiyama and Qiang Liu) for their helpful comments. This is NCPOR contribution no. J-28/2022-23..
The authors declare that the research was conducted in the absence of any commercial or financial relationships that could be construed as a potential conflict of interest.
All claims expressed in this article are solely those of the authors and do not necessarily represent those of their affiliated organizations, or those of the publisher, the editors and the reviewers. Any product that may be evaluated in this article, or claim that may be made by its manufacturer, is not guaranteed or endorsed by the publisher.
The Supplementary Material for this article can be found online at: https://www.frontiersin.org/articles/10.3389/feart.2022.949735/full#supplementary-material
Arndt, A., Scherer, D., and Schneider, C. (2021). Atmosphere driven mass-balance sensitivity of halji glacier, himalayas. Atmosphere 12, 426. doi:10.3390/atmos12040426
Ayala, A., Pellicciotti, F., and Shea, J. M. (2015). Modeling 2m air temperatures over mountain glaciers: exploring the influence of katabatic cooling and external warming. J. Geophys. Res. Atmos. 120, 3139–3157. doi:10.1002/2015jd023137
Azam, M. F., Kargel, J. S., Shea, J. M., Nepal, S., Haritashya, U. K., Srivastava, S., et al. (2021). Glaciohydrology of the himalaya-karakoram. Science 373, eabf3668. doi:10.1126/science.abf3668
Azam, M. F., Ramanathan, A., Wagnon, P., Vincent, C., Linda, A., Berthier, E., et al. (2016). Meteorological conditions, seasonal and annual mass balances of chhota shigri glacier, western himalaya, India. Ann. Glaciol. 57, 328–338. doi:10.3189/2016AoG71A570
Azam, M. F., Wagnon, P., Ramanathan, A., Vinicent, C., Sharma, P., Arnaud, Y., et al. (2012). From balance to imbalance: a shift in the dynamic behaviour of chhota shigri glacier, western himalaya, India. J. Glaciol. 58, 315–324. doi:10.3189/2012JoG11J123
Azam, M. F., Wagnon, P., Vincent, C., Ramanathan, A., Favier, V., Mandal, A., et al. (2014b). Processes governing the mass balance of chhota shigri glacier (Western Himalaya, India) assessed by point-scale surface energy balance measurements. Cryosphere 8, 2195–2217. doi:10.5194/tc-8-2195-2014
Azam, M. F., Wagnon, P., Vincent, C., Ramanathan, A., Linda, A., Singh, V. B., et al. (2014a). Reconstruction of the annual mass balance of chhota shigri glacier, western Himalaya, India, since 1969. Ann. Glaciol. 55, 69–80. doi:10.3189/2014AoG66A104
Azam, M. F., Wagnon, P., Vincent, C., Ramanathan, A. L., Kumar, N., Srivastava, S., et al. (2019). Snow and ice melt contributions in a highly glacierized catchment of chhota shigri glacier (India) over the last five decades. J. Hydrology 574, 760–773. doi:10.1016/j.jhydrol.2019.04.075
Azam, M., Wagnon, P., Berthier, E., Vincent, C., Fujita, K., Js, K., et al. (2018). Review of the status and mass changes of himalayan-karakoram glaciers. J. Glaciol. 64, 61–74. doi:10.1017/jog.2017.86
Bolch, T., Kulkarni, A., Kääb, A., Huggel, C., Paul, F., Cogley, J. G., et al. (2012). The state and fate of himalayan glaciers. Science 336, 310–314. doi:10.1126/science.1215828
Bookhagen, B., and Burbank, D. W. (2006). Correction to “Topography, relief, and TRMM-derived rainfall variations along the Himalaya”. Geophys. Res. Lett. 33, L13402. doi:10.1029/2006gl026944
Bookhagen, B., and Burbank, D. W. (2010). Toward a complete Himalayan hydrological budget: spatiotemporal distribution of snowmelt and rainfall and their impact on river discharge. J. Geophys. Res. 115, F03019. doi:10.1029/2009jf001426
Brock, B. W., Willis, I. C., and Shaw, M. J. (2006). Measurement and parameterization of aerodynamic roughness length variations at haut glacier d'Arolla, switzerland. J. Glaciol. 52, 281–297. doi:10.3189/172756506781828746
Brun, F., Berthier, E., Wagnon, P., Kääb, A., and Treichler, D. (2017). A spatially resolved estimate of high mountain asia glacier mass balances from 2000 to 2016. Nat. Geosci. 10, 668-+, 673, doi:10.1038/ngeo2999
Buri, P., and Pellicciotti, F. (2018). Aspect controls the survival of ice cliffs on debris-covered glaciers. Proc. Natl. Acad. Sci. U. S. A. 115, 4369–4374. doi:10.1073/pnas.1713892115
Che, Y. J., Zhang, M. J., Li, Z. Q., Wei, Y. Q., Nan, Z. T., Li, H. L., et al. (2019). Energy balance model of mass balance and its sensitivity to meteorological variability on urumqi river glacier No.1 in the chinese tien shan. Sci. Rep. 9, 13958. doi:10.1038/s41598-019-50398-4
Cogley, J. G., Hock, R., Rasmussen, L. A., Arendt, A. A., Bauder, A., Braithwaite, R. J., et al. (2011). Glossary of glacier mass balance and related terms.” in IHP IHP-VII technical documents in hydrology No. 86, IACS contribution No. 2. ParisParis, France: UNESCOUNESCO-IHP.
Collier, E., Maussion, F., Nicholson, L. I., Mölg, T., Immerzeel, W. W., Bush, A. B. G., et al. (2015). Impact of debris cover on glacier ablation and atmosphere-glacier feedbacks in the karakoram. Cryosphere 9, 1617–1632. doi:10.5194/tc-9-1617-2015
Cullen, N. J., and Conway, J. P. (2015). A 22 month record of surface meteorology and energy balance from the ablation zone of brewster glacier, new zealand. J. Glaciol. 61, 931–946. doi:10.3189/2015JoG15J004
Cullen, N. J., Mölg, T., Kaser, G., Steffen, K., and Hardy, D. R. (2007). Energy-balance model validation on the top of kilimanjaro, tanzania, using eddy covariance data. Ann. Glaciol. 46, 227–233. doi:10.3189/172756407782871224
De Woul, M., and Hock, R. (2005). “Static mass-balance sensitivity of Arctic glaciers and ice caps using a degree-day approach,”. Editors J. Dowdeswell, and I. C. Willis, Vol. 42, 2005217–2005224.Ann. Glaciol.
Dimri, A. P., Niyogi, D., Barros, A. P., Ridley, J., Mohanty, U. C., Yasunari, T., et al. (2015). Western disturbances: a review. Rev. Geophys. 53, 225–246. doi:10.1002/2014rg000460
Dyurgerov, M. B., and Meier, M. F. (2005). ColoradoBoulder.” in Glaciers and the changing earth system: A 2004 snapshot, 58: Institute of Arctic and Alpine Research, University of Colorado, Occasional Paper, 117.
Farinotti, D., Immerzeel, W. W., De Kok, R. J., Quincey, D. J., and Dehecq, A. (2020). Manifestations and mechanisms of the Karakoram glacier anomaly. Nat. Geosci. 13,8, doi:10.1038/s41561-019-0513-5
Fujita, K. (2008). Effect of precipitation seasonality on climatic sensitivity of glacier mass balance. Earth Planet. Sci. Lett. 276, 14–19. doi:10.1016/j.epsl.2008.08.028
Gardelle, J., Berthier, E., Arnaud, Y., and Kääb, A. (2013). Corrigendum to “Region-wide glacier mass balances over the Pamir-karakoram-himalaya during 1999–2011”published in the Cryosphere, 7, 1263–1286, 2013. Cryosphere 7, 1885–1886. doi:10.5194/tc-7-1885-2013
Giesen, R. H., Andreassen, L. M., Van Den Broeke, M. R., and Oerlemans, J. (2009). Comparison of the meteorology and surface energy balance at storbreen and midtdalsbreen, two glaciers in southern Norway. Cryosphere 3, 57–74. doi:10.5194/tc-3-57-2009
Gromke, C., Manes, C., Walter, B., Lehning, M., and Guala, M. (2011). Aerodynamic roughness length of fresh snow. Bound. Layer. Meteorol. 141, 21–34. doi:10.1007/s10546-011-9623-3
Hock, R., and Holmgren, B. (2005). A distributed surface energy-balance model for complex topography and its application to Storglaciaren, Sweden. J. Glaciol. 51, 25–36. doi:10.3189/172756505781829566
Hock, R. (2003). Temperature index melt modelling in mountain areas. J. Hydrology 282, 104–115. doi:10.1016/s0022-1694(03)00257-9
Hock, R., Rasul, G., Adler, C., Cáceres, B., Gruber, S., Hirabayashi, Y., et al. (2019). “IPCC ocean and cryosphere in a changing climate, Chap 2,” in High mountain areas.
Huintjes, E., Sauter, T., Schroter, B., Maussion, F., Yang, W., Kropacek, J., et al. (2015). Evaluation of a coupled snow and energy balance model for zhadang glacier, tibetan plateau, using glaciological measurements and time-lapse photography. Arct. Antarct. Alp. Res. 47, 573–590. doi:10.1657/aaar0014-073
Immerzeel, W. W., Van Beek, L. P. H., and Bierkens, M. F. P. (2010). Climate change will affect the asian water towers. Science 328, 1382–1385. doi:10.1126/science.1183188
Jean-Philippe, B., Michael, H., and Petrie, C. A. (2021). Synoptic processes of winter precipitation in the upper indus basin. Weather Clim. Dynam. 2, 1187–1207. doi:10.5194/wcd-2-1187-2021
Kääb, A., Berthier, E., Nuth, C., Gardelle, J., and Arnaud, Y. (2012). Contrasting patterns of early twenty-first-century glacier mass change in the himalayas. Nature 488, 495–498. doi:10.1038/nature11324
Kayastha, R. B., Ohata, T., and Ageta, Y. (1999). Application of a mass-balance model to a himalayan glacier. J. Glaciol. 45, 559–567. doi:10.3189/s002214300000143x
Kenzhebaev, R., Barandun, M., Kronenberg, M., Chen, Y. N., Usubaliev, R., Hoelzle, M., et al. (2017). Mass balance observations and reconstruction for batysh sook glacier, tien Shan, from 2004 to 2016. Cold Regions Sci. Technol. 135, 76–89. doi:10.1016/j.coldregions.2016.12.007
Klok, E. J., and Oerlemans, J. (2002). Model study of the spatial distribution of the energy and mass balance of morteratschgletscher, switzerland. J. Glaciol. 48, 505–518. doi:10.3189/172756502781831133
Kraaijenbrink, P. D. A., Bierkens, M. F. P., Lutz, A. F., and Immerzeel, W. W. (2017). Impact of a global temperature rise of 1.5 degrees Celsius on Asia's glaciers. Nature 549, 257-+, 260, doi:10.1038/nature23878
Krishnan, R., Shrestha, A. B., Ren, G., Rajbhandari, R., Saeed, S., Sanjay, S., et al. (2019). “Unravelling climate change in the hindu kush himalaya: rapid warming in the mountains and increasing extremes,” in The Hindu Kush Himalaya assessment—mountains, climate change, sustainability and people. Editors P. Wester, A. Mishra, A. Mukherji, and A. B. Shrestha (Cham: Springer), 57–97.
Kulkarni, A. V., Bahuguna, I. M., Rathore, B. P., Singh, S. K., Randhawa, S. S., Sood, R. K., et al. (2007). Glacial retreat in Himalaya using Indian Remote Sensing satellite data. Curr. Sci. 92, 69–74.
Kumar, A., Verma, A., Gokhale, A. A., Bhambri, R., Misra, A., Sundriyal, S., et al. (2018). Hydrometeorological assessments and suspended sediment delivery from a central Himalayan glacier in the upper Ganga basin. Int. J. Sediment Res. 33, 493–509. doi:10.1016/j.ijsrc.2018.03.004
Kumar, L., Skidmore, A. K., and Knowles, E. (1997). Modelling topographic variation in solar radiation in a GIS environment. Int. J. Geogr. Inf. Sci. 11, 475–497. doi:10.1080/136588197242266
Kumar, P., Saharwardi, M. S., Banerjee, A., Azam, M. F. A., Dubey, A. K., Murtugudde, R., et al. (2019). Snowfall variability dictates glacier mass balance variability in himalaya-karakoram. Sci. Rep. 9, 18192. doi:10.1038/s41598-019-54553-9
Li, S. H., Yao, T. D., Yu, W. S., Yang, W., and Zhu, M. L. (2019). Energy and mass balance characteristics of the guliya ice cap in the west kunlun mountains, tibetan plateau. Cold Regions Sci. Technol. 159, 71–85. doi:10.1016/j.coldregions.2018.12.001
Lutz, A. F., Immerzeel, W. W., Shrestha, A. B., and Bierkens, M. F. P. (2014). Consistent increase in high asia's runoff due to increasing glacier melt and precipitation. Nat. Clim. Chang. 4, 587–592. doi:10.1038/nclimate2237
Machguth, H., Purves, R. S., Oerlemans, J., Hoelzle, M., and Paul, F. (2008). Exploring uncertainty in glacier mass balance modelling with monte carlo simulation. Cryosphere 2, 191–204. doi:10.5194/tc-2-191-2008
Mandal, A., Ramanathan, A., Azam, M. F., Angchuk, T., Soheb, M., Kumar, N., et al. (2020). Understanding the interrelationships among mass balance, meteorology, discharge and surface velocity on chhota shigri glacier over 2002-2019 using in situ measurements. J. Glaciol. 66, 727–741. doi:10.1017/jog.2020.42
Mölg, T., Cullen, N. J., Hardy, D. R., Winkler, M., and Kaser, G. (2009). Quantifying climate change in the tropical midtroposphere over east africa from glacier shrinkage on kilimanjaro. J. Clim. 22, 4162–4181. doi:10.1175/2009jcli2954.1
Mölg, T., and Scherer, D. (2012). Retrieving important mass-balance model parameters from AWS measurements and high-resolution mesoscale atmospheric modeling. J. Glaciol. 58, 625–628. doi:10.3189/2012JoG11J258
Oerlemans, J. (2000). Analysis of a 3 year meteorological record from the ablation zone of morteratschgletscher, switzerland: energy and mass balance. J. Glaciol. 46, 571–579. doi:10.3189/172756500781832657
Oerlemans, J., and Knap, W. H. (1998). A 1 year record of global radiation and albedo in the ablation zone of morteratschgletscher, switzerland. J. Glaciol. 44, 231–238. doi:10.3189/s0022143000002574
Oerlemans, J., and Reichert, B. K. (2000). Relating glacier mass balance to meteorological data by using a seasonal sensitivity characteristic. J. Glaciol. 46, 1–6. doi:10.3189/172756500781833269
Østrem, G., and Brugman, M. (1991). Glacier mass-balance measurements.” in A manual for field and office work. (NHRI Science Report 4. Environment CanadaSaskatoon, Sask: National Hydrology Research Institute.
Panday, P. K., Thibeault, J., and Frey, K. E. (2015). Changing temperature and precipitation extremes in the hindu kush-himalayan region: an analysis of CMIP3 and CMIP5 simulations and projections. Int. J. Climatol. 35, 3058–3077. doi:10.1002/joc.4192
Patel, A., Goswami, A., Dharpure, J. K., Thamban, M., Sharma, P., Kulkarni, A. V., et al. (2021). Estimation of mass and energy balance of glaciers using a distributed energy balance model over the Chandra river basin (Western Himalaya). Hydrol. Process., 35, doi:10.1002/hyp.14058
Pellicciotti, F., Carenzo, M., Helbing, J., Rimkus, S., and Burlando, P. (2009). On the role of subsurface heat conduction in glacier energy-balance modelling. Ann. Glaciol. 50, 16–24. doi:10.3189/172756409787769555
Pratap, B., Dobhal, D. P., Bhambri, R., Mehta, M., and Tewari, V. C. (2016). Four decades of glacier mass balance observations in the Indian Himalaya. Reg. Environ. Change 16, 643–658. doi:10.1007/s10113-015-0791-4
Pratap, B., Sharma, P., Patel, L. K., Singh, A. T., Gaddam, V. K., Oulkar, S., et al. (2019). Reconciling high glacier surface melting in summer with air temperature in the semi-arid zone of western Himalaya. Water 11, 1561. doi:10.3390/w11081561
Pritchard, H. D. (2019). Asia's shrinking glaciers protect large populations from drought stress. Nature 569, 649-+, 654, doi:10.1038/s41586-019-1240-1
Sabin, T. P., Krishnan, R., Vellore, R., Priya, P., Borgaonkar, H. P., Singh, B. B., et al. (2020). “Climate change over the himalayas,” in Assessment of climate change over the Indian region. Editors R. Krishnan, J. Sanjay, C. Gnanaseelan, M. Mujumdar, A. Kulkarni, and S. Chakraborty (Springerr, Singapore). doi:10.1007/978-981-15-4327-2_11
Sangewar, C. V., and Shukla, S. P. (2009). Inventory of theHimalayan glaciers: A contribution to the internationalhydrological programme, 34. Spec. Publ. No.GeologicalSurvey of India.
Sanjay, J., Krishnan, R., Shrestha, A. B., Rajbhandari, R., and Ren, G. Y. (2017). Downscaled climate change projections for the hindu kush himalayan region using CORDEX south asia regional climate models. Adv. Clim. Change Res. 8, 185–198. doi:10.1016/j.accre.2017.08.003
Sharma, P., Patel, L. K., Ravindra, R., Singh, A., Mahalinganathan, K., Thamban, M., et al. (2016). Role of debris cover to control specific ablation of adjoining batal and sutri dhaka glaciers in chandra basin (Himachal Pradesh) during peak ablation season. J. Earth Syst. Sci. 125, 459–473. doi:10.1007/s12040-016-0681-2
Sharma, P., Patel, L. K., Singh, A. T., Meloth, T., and Ravindra, R. (2020). “Glacier response to climate in arctic and himalaya during last seventeen years: a case study of svalbard, arctic and Chandra basin, Himalaya,” in Climate change and the white world. Editors P. S. Goel, R. Ravindra, and S. Chattopadhyay (Springer), 139–156.
Shaw, T. E., Yang, W., Ayala, A., Bravo, C., Zhao, C. X., Pellicciotti, F., et al. (2021). Distributed summer air temperatures across mountain glaciers in the south-east Tibetan plateau: temperature sensitivity and comparison with existing glacier datasets. Cryosphere 15, 595–614. doi:10.5194/tc-15-595-2021
Shea, J. M., and Moore, R. D. (2010). Prediction of spatially distributed regional-scale fields of air temperature and vapor pressure over mountain glaciers. J. Geophys. Res. 115, D23107. doi:10.1029/2010jd014351
Shean, D. E., Bhushan, S., Montesano, P., Rounce, D. R., Arendt, A., Osmanoglu, B., et al. (2020). A systematic, regional assessment of high mountain Asia glacier mass balance. Front. Earth Sci. (Lausanne). 7. doi:10.3389/feart.2019.00363
Shekhar, M. S., Chand, H., Kumar, S., Srinivasan, K., and Ganju, A. (2010). Climate-change studies in the Western Himalaya. Ann. Glaciol. 51, 105–112. doi:10.3189/172756410791386508
Singh, A. T., Rahaman, W., Sharma, P., Laluraj, C. M., Patel, L. K., Pratap, B., et al. (2019). Moisture sources for precipitation and hydrograph components of the Sutri Dhaka glacier basin, western himalayas. Water 11, 2242. doi:10.3390/w11112242
Singh, N., Singhal, M., Chhikara, S., Karakoti, I., Chauhan, P., Dobhal, D. P., et al. (2018). Radiation and energy balance dynamics over a rapidly receding glacier in the central Himalaya. Int. J. Climatol. 21, 400–420. doi:10.1002/joc.6218
Soheb, M., Ramanathan, A., Angchuk, T., Mandal, A., Kumar, N., Lotus, S., et al. (2020). Mass-balance observation, reconstruction and sensitivity of Stok glacier, Ladakh region, India, between 1978 and 2019. J. Glaciol. 66, 627–642. doi:10.1017/jog.2020.34
Soncini, A., Bocchiola, D., Azzoni, R. S., and Diolaiuti, G. (2017). A methodology for monitoring and modeling of high altitude Alpine catchments. Prog. Phys. Geogr. Earth Environ. 41, 393–420. doi:10.1177/0309133317710832
Sun, W. J., Qin, X., Wang, Y. T., Chen, J. Z., Du, W. T., Zhang, T., et al. (2018). The response of surface mass and energy balance of a continental glacier to climate variability, western qilian mountains, china. Clim. Dyn. 50, 3557–3570. doi:10.1007/s00382-017-3823-6
Sunako, S., Fujita, K., Sakai, A., and Kayastha, R. B. (2019). Mass balance of trambau glacier, rolwaling region, nepal Himalaya: in-situ observations, long-term reconstruction and mass-balance sensitivity. J. Glaciol. 65, 605–616. doi:10.1017/jog.2019.37
Tachikawa, T. (2011). Characteristics of ASTER GDEM version 2 international geoscience and remote sensing symposium (IGARSS).
Tawde, S. A., Kulkarni, A. V., and Bala, G. (2019). An assessment of climate change impacts on glacier mass balance and geometry in the chandra Basin, western himalaya for the 21st century. Environ. Res. Commun. 1, 041003. doi:10.1088/2515-7620/ab1d6d
Thibert, E., Blanc, R., Vincent, C., and Eckert, N. (2008). Glaciological and volumetric mass-balance measurements: error analysis over 51 years for glacier de sarennes, french alps. J. Glaciol. 54, 522–532. doi:10.3189/002214308785837093
Van Den Broeke, M., Reijmer, C., Van As, D., and Boot, W. (2006). Daily cycle of the surface energy balance in antarctica and the influence of clouds. Int. J. Climatol. 26, 1587–1605. doi:10.1002/joc.1323
Van Der Veen, C. J. (2002). Polar ice sheets and global sea level: How well can we predict the future? Glob. Planet. Change 32, 165–194. doi:10.1016/s0921-8181(01)00140-0
Vijay, S., and Braun, M. (2016). Elevation Change Rates of Glaciers in the Lahaul-Spiti (Western Himalaya, India) during 2000-2012 and 2012-2013, 8. doi:10.3390/rs8121038Remote Sens.
Wagnon, P., Linda, A., Arnaud, Y., Kumar, R., Sharma, P., Vincent, C., et al. (2007). Four years of mass balance on chhota Shigri Glacier, Himachal Pradesh, India, a new benchmark glacier in the Western Himalaya. J. Glaciol. 53, 603–611. doi:10.3189/002214307784409306
Wagnon, P., Vincent, C., Arnaud, Y., Berthier, E., Vuillermoz, E., Gruber, S., et al. (2013). Seasonal and annual mass balances of Mera and Pokalde glaciers (Nepal Himalaya) since 2007. Cryosphere 7, 1769–1786. doi:10.5194/tc-7-1769-2013
WGMS (2019). Fluctuations of glaciers database. Zurich, Switzerland: World Glacier Monitoring Service. doi:10.5904/wgms-fog-2019-12
Wu, X. J., He, J. Q., Jiang, X., and Wang, N. L. (2016). Analysis of surface energy and mass balance in the accumulation zone of Qiyi glacier, tibetan plateau in an ablation season. Environ. Earth Sci. 75, 785. doi:10.1007/s12665-016-5591-8
Yang, W., Guo, X. F., Yao, T. D., Yang, K., Zhao, L., Li, S. H., et al. (2011). Summertime surface energy budget and ablation modeling in the ablation zone of a maritime tibetan glacier. J. Geophys. Res. 116, D14116. doi:10.1029/2010jd015183
Yang, W., Yao, T. D., Guo, X. F., Zhu, M. L., Li, S. H., Kattel, D. B., et al. (2013). Mass balance of a maritime glacier on the southeast tibetan plateau and its climatic sensitivity. J. Geophys. Res. Atmos. 118, 9579–9594. doi:10.1002/jgrd.50760
Zhang, G. S., Kang, S. C., Fujita, K., Huintjes, E., Xu, J. Q., Yamazaki, T., et al. (2013). Energy and mass balance of zhadang glacier surface, central tibetan plateau. J. Glaciol. 59, 137–148. doi:10.3189/2013JoG12J152
Keywords: energy balance modeling, mass balance, climate sensitivity, Chandra basin, western Himalaya
Citation: Oulkar SN, Thamban M, Sharma P, Pratap B, Singh AT, Patel LK, Pramanik A and Ravichandran M (2022) Energy fluxes, mass balance, and climate sensitivity of the Sutri Dhaka Glacier in the western Himalaya. Front. Earth Sci. 10:949735. doi: 10.3389/feart.2022.949735
Received: 21 May 2022; Accepted: 01 July 2022;
Published: 12 August 2022.
Edited by:
Nozomu Takeuchi, Chiba University, JapanCopyright © 2022 Oulkar, Thamban, Sharma, Pratap, Singh, Patel, Pramanik and Ravichandran. This is an open-access article distributed under the terms of the Creative Commons Attribution License (CC BY). The use, distribution or reproduction in other forums is permitted, provided the original author(s) and the copyright owner(s) are credited and that the original publication in this journal is cited, in accordance with accepted academic practice. No use, distribution or reproduction is permitted which does not comply with these terms.
*Correspondence: Sunil N. Oulkar, c3VuaWxAbmNwb3IucmVzLmlu
Disclaimer: All claims expressed in this article are solely those of the authors and do not necessarily represent those of their affiliated organizations, or those of the publisher, the editors and the reviewers. Any product that may be evaluated in this article or claim that may be made by its manufacturer is not guaranteed or endorsed by the publisher.
Research integrity at Frontiers
Learn more about the work of our research integrity team to safeguard the quality of each article we publish.