 Lukas M. Keller
- Institute of Computational Physics (ICP), School of Engineering, University of Applied Sciences, Winterthur, Switzerland
The role of surface roughness of fractures in Opalinus Clay and in rocks in general is relevant in understanding the hydromechanical behavior of fractures. Two different fracture surfaces of shear fractures in the Opalinus Clay were investigated. The fracture surfaces were characterized based on their roughness power spectrum. It was found that slickensides fracture surfaces are near fractal-like up to the longest scale with a fractal dimension Df ∼ 2.1 and in the absence of a roll-off region at long wavelengths. In contrast, the glassy fracture surfaces show a roll-off region, which is characteristic of a flat surface with rather small and local topographic height variations. The glassy fracture surface is near fractal like with Df ∼ 2.0. The measured roughness power spectra were used to create fracture models to study the behavior of different fracture closure mechanism: 1) increasing congruence (matedness), 2) closure by compression and 3) closure by swelling. It turned out that the relationship between permeability and mean aperture depends on the fracture closure mechanism. Concerning closure by compression, the root mean square (rms) value of the aperture (aper) distribution aperrms influences the contact formation behavior, which in turn controls the hydromechanical properties. The lower aperrms is, the lower the fracture compliance. Apart from aperrms, the simulations show that in clay rocks, plastic deformation plays an important role in the closure of fractures by compression. In agreement with the experiments, the simulations predict that the permeability falls below 10% of the initial value at a compressive stress of 5 MPa. The simulations predict that fracture closure by swelling is rather ineffective for confining pressures exceeding ∼1 MPa.
1 Introduction
In connection with the storage of hazardous materials in rock units, the presence of fractures is of special interest because they can fundamentally change the transport properties of the rock (Evans and Rasmussen, 1991; Braester, 1999). In the project of radioactive waste storage in clay rocks (Nagra, 2002), fracture zones are formed due to the construction activity; however, it is also possible that during the long storage, shear zones are formed, which modify the transport properties locally. It is therefore fundamental to understand the material transport in fractures formed in clay rocks.
Transport along fractures is mostly studied for either single fractures or fracture networks. Thereby, one difficulty is how to take into account the complex geometrical properties of real fractures in mathematical transport models and transport simulations (e.g. Ge, 1997; Oron and Berkowitz, 1998; Wang et al., 2015). A simplification is the so-called cubic law (e.g. Zimmerman and Bodvarsson, 1996), which is often used for geological applications. The cubic law states that the flow rate in single fractures is proportional to the square of the aperture and is valid for fractures with smooth and parallel interfaces separated by a local aperture. Deviations from this simplification to real conditions were and are the subject of discussions (e.g. Witherspoon et al., 1980; Raven and Gale, 1985; Oron and Berkowitz, 1998; Wang et al., 2015; Lee and Babadagli, 2021). Attempts to contribute to this discussion require models for realistic fractures to study how transport is affected by fracture roughness, which ultimately determines the complex aperture distribution. Previous studies used natural fractures, mechanically induced fractures in rock samples (Witherspoon et al., 1980; Raven and Gale, 1985), casts of fractures (Develi and Babadagli, 2015; Li et al., 2018), and combinations of these methods. Apart from laboratory-based experimental work computer generated fractures were produced by the SynFrac method (Ogilvie et al., 2006; Briggs et al., 2017) and other methods (Oron and Berkowitz, 1998) and were then used for parameter studies to quantify the influence of the different variables characterizing the fractures (e.g. fractal dimension, root mean square height etc.) on the transport properties (e.g. Briggs et al., 2017). Results of these efforts result in, for example, modified formulations of the cubic law (Wang et al., 2015), which must first be confirmed in their applicability, since they also contain quantities that cannot be easily extracted from given natural fractures. According to the comprehensive review of Lee and Babadagli (2021), the most studied rock types are granites, sandstones and dolomites.
This study investigates the wall roughness of natural shear fractures formed in Opalinus Clay, which is a Jurassic shale designated as host rock for radioactive waste in Switzerland. Because clay rocks have not often been studied in this respect this study increases the variability of examined lithologies. It also addresses the question of whether fracture surfaces have similar fractal properties that are independent of the type of fracture generation and mineralogy as suggested by Berkowitz (2002). For this reason, two different types of fracture surfaces are examined here. These are a slickenside fracture surface with striations and a glassy naturally polished fracture surface. The height distribution of the fracture surfaces was measured optically and characteristic quantities such as the root mean square height and fractal dimension were determined from the roughness power spectrum. The measured roughness power spectra were then used as input for the generation of artificial fracture models, which in turn were used for virtual compression experiments and numerical flow simulations to predict hydromechanical properties in single fractures of Opalinus Clay. In the past the interrelation between contact formation during compression and permeability were controversially discussed (Brown and Scholz, 1986; Unger and Mase, 1993; Oron and Berkowitz, 1998; Pyrak-Nolte and Morris, 2000). That is why we are looking into this question and trying to shed light on it, at least in the case of Opalinus Clay.
2 Surface roughness measurements and roughness properties
Samples containing visible shear planes were taken from the Opalinus Clay Unit at the Mont Terri Rock Laboratory in Switzerland (Bossart and Thury, 2008). In this study, single fractures were analyzed but it cannot be simply assumed that below the fracture surface of the samples taken, the material is intact or whether it has also been affected by the deformation. Therefore, the material below the fracture surface was examined with a dual beam instrument. A cross-section was prepared with the focus ion beam, which was then imaged with the scanning electron microscope integrated in the instrument (Holzer et al., 2004). Figure 1 shows scanning electron images of the two fracture surfaces where the different topographies are clearly visible. Slickensides (Figure 1A) clearly show the grooving while the glassy surface (Figure 1B) appears rather smooth. The cross sections show that the rock below the fracture surface is intact (Figures 1C,D). Deformation has therefore occurred locally along these shear fractures and increased transport is controlled by the fracture geometry and not by a diffuse zone where deformation has led to increased porosity.
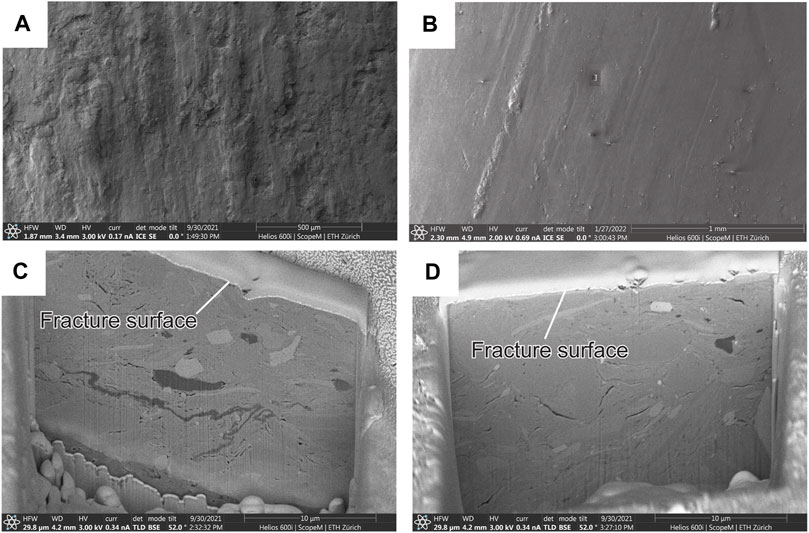
FIGURE 1. Focused Ion Beam investigations on Opalinus Clay samples. (A) Secondary electron image (SEM) image showing the surface of the slickensides fracture surface. (B) Same as (A) but for the glassy fracture surface. (C) Back scatter electron (BSE) image sowing a cross-section perpendicular to the slickenside fracture surface. (D) Same as (C) but for the glassy fracture surface.
In order to obtain a better resolution of the microstructure just below the shear surface, two additional cross-sections were prepared at the specimen edge. The material at this location may have been somewhat affected by the mechanical sample processing but based on visual inspection in the SEM the condition of the shear surface does not differ from that inside the sample (Figure 2). The orientation of the platy clay minerals with respect to the shear surface varies, ranging from parallel to nearly vertical. Some minerals were sheared off, indicating that the present microstructure was already present before deformation. The short-wavelength roughness elements with wavelengths in the range of 100 nm are similar for both surfaces. The differences in the longer wavelength roughness elements, however, can already be seen on the length scale of the cross section examined.
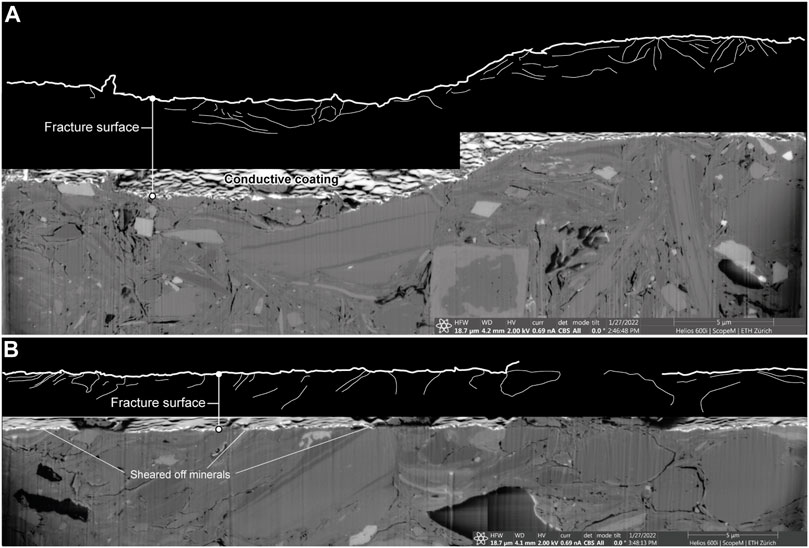
FIGURE 2. Focused Ion Beam investigations on Opalinus Clay samples. (A) Back scatter electron (BSE) image sowing a cross-section perpendicular to the slickenside fracture surface. (B) Same as (A) but for the glassy fracture surface. In the upper black part of the figure, one can see the drawn height profile of the shear plane with the traces of the visible grain boundaries in the area of the shear plane.
An Alicona InfiniteFocus optical microscope was used in this study, which operates according to the principles of focus variation (Helmli, 2011). This instrument was used to measure the topography h (x,y) of the fracture surfaces (Figure 3). The topography was measured at two different magnifications to account for structures with different scales. For example, it is assumed that the striations of the slickensides are a larger scale structures, which loses its significance at higher magnifications. Measurements were made with an objective magnification of ×2.5 and 20x which corresponds to a vertical resolution of approximately 2,300 nm and 50 nm. The elevations of the striation at low magnification are in the range of 200–300 μm and are elongated but not continuous in the direction of movement. At higher resolutions the analyzed area decreases, which reduces the captured roughness spectrum and roughness anisotropy. On the length scale studied, the glassy surface is flat with small-scale asperities.
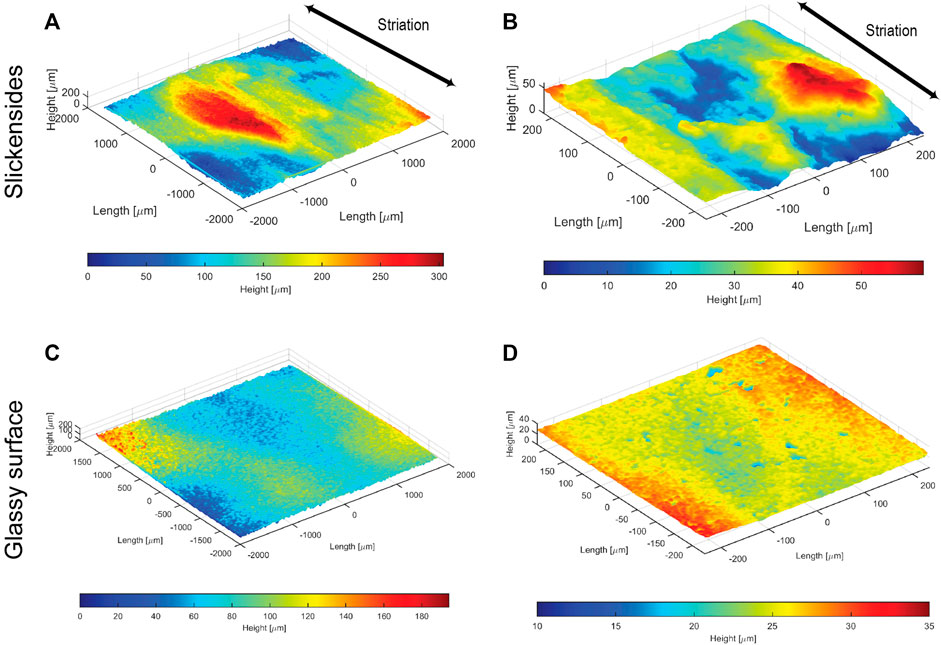
FIGURE 3. Measured topography of the fracture surfaces at different magnifications. (A) Slickenside topography measured with an optical lens at ×2.5 magnification. (B) Slickenside topography measured with an optical lens at ×20 magnification. (C) Same as (A) but for the glassy fracture surface. (D) Same as (B) but for the glassy fracture surface.
In addition to visual inspection, the properties of the surface topography were quantified by means of power spectral density function (PSD) of the surfaces (Nayak, 1971; Jacobs et al., 2019; Persson et al., 2005). The 2D surface roughness power spectrum C2D was calculated with the Matlab code provided by M. Kanafi (Kanafi et al., 2015; Kanafi and Tuononen, 2017), which is based on the following definition
where qx and qy are the wavevectors, Δx × Δy defines the pixel size and m × n are the number of pixels of the topography image h (x,y). FFT2D stands for the fast Fourier transform of the surface topography h (x,y). The parameters presented in the following part were all calculated based on C2D related to the measured surface topographies. These parameters include the root mean square height hrms that was calculated based on the following relationship
where
It can be seen in Figures 4A,B that for q <∼0.2e+5 m−1, C2D(q) related to slickensides is not radially symmetric with respect to the origin qx=qy=0, indicating that surface roughness elements with the longest wavelength (small wavevector q) are anisotropic. However, most of the wavelengths and related roughness elements related to slickensides are isotropic and the corresponding part of C2D is radially symmetric. At least for the size of the investigated areas, C2D(q) related to the glassy fracture surface appear to be radially symmetric which indicates that the surface roughness elements are isotropic (Figures 4C,D). Therefore, a radially averaged C was calculated from C2D with respect to the origin for both fracture types (Figure 4E). This procedure allows the calculation of the Hurst exponent H from the C and the related fractal dimension Df (Figure 4E). The Hurst exponent H can be calculated from the slope of log10C-log10q relation of the radially averaged power spectrum (Figure 4E). Since the slope is dominated by the short wavelengths of the isotropic topographic components, the long wavelength anisotropic components are not expected to have a substantial effect on the result in case of the slickensides. However, the calculated fractal properties may not be valid on a larger length scale. In addition, Figure 4E shows that the log10C-log10q relation is not perfectly linear, which shows that the fracture surfaces cannot be described exactly as self-affine fractals. The average slopes of the curves indicate a fractal dimension Df ∼ 2.1 in the case of the slickensides and Df ∼ 2.0 in the case of the glassy fracture surface. It is interesting to note that in the case of the glassy surface the log10C-log10q relation tends to become approximately constant below a roll-off wavevector region qr. In such a case the Hurst exponent H is calculated from the slope defined by the wavevectors > qr. Depending on the magnification, the roll-off wavevector qr varies between ∼104.4 and ∼104.9 (m−1). Regarding slickensides, the lack of a roll-off area has the consequence that the value of hrms depends on the size of the measured area (Persson et al., 2005, Table 1). Last but not least in this chapter, Table 1 summarizes the determined characteristic quantities of the two fracture surfaces.
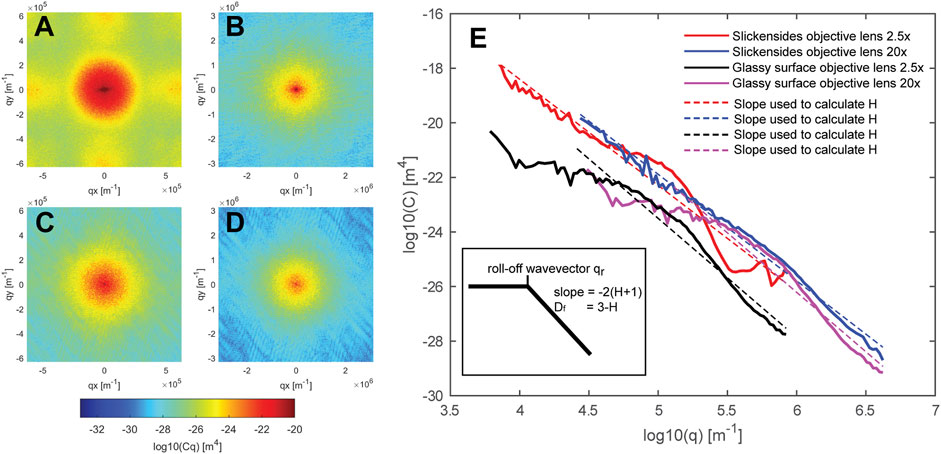
FIGURE 4. Power spectral densities C2D related to the measured surface topographies depicted in Figure 3. (A), (B), (C), and (D) have the same meanings as in Figure 3. (E) Radially averaged 2D power spectral densities related to the C2Ds depicted in Figure 3. The sketch shows the important quantities that can be determined from the curves.
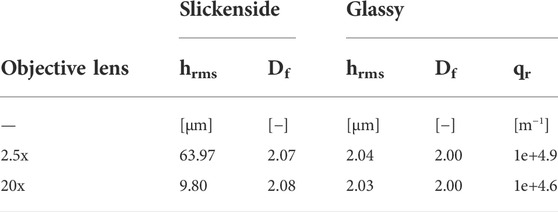
TABLE 1. Parameters which characterize the roughness of the fracture surfaces.
3 Artificial fracture generation and fracture characterization
In the following, C2D that were determined based on real fracture surfaces will be used as input for artificial fracture formation. These in turn will be used to investigate the influence of fracture surface roughness on the hydromechanical behavior of different fracture types. A fundamental problem is the definition of the aperture of fractures based on the measured surface roughness when the two coexisting surfaces were separated. The degree of geometric congruence of the two fracture surfaces determines the aperture distribution along a fracture. In the case of complete correspondence, the open fracture volume approaches zero and no through transport path exists. The geometric relationship between two fracture surfaces in this study is the same as suggested in previous studies. On a larger scale they are well mated, but on a smaller, local scale they are poorly mated (Oron and Berkowitz, 1998 and references therein). Since the degree of local, small-scale geometric correspondence is difficult to estimate, this parameter was varied.
In the following it is outlined how the artificial fractures were generated. Four slickensides and four glassy fracture models were constructed with the models differing in their congruence. The procedure is illustrated in Figure 5 for two slickenside models with different congruence, but the same applies to the glassy models. In a first step, a synthetic slickenside and glassy fracture surface (Figure 5B) was generated from the C2D (Figure 5A), which determined from the measured topography of fracture surfaces (Figure 3). These two surfaces are equal in all slickensides and glassy models and were combined surfaces generated from the part of C2D corresponding to the roughness elements with shorter wavelengths. This objective was achieved with the introduction of a roll-off wave vector qr, which removed the long wavelength components (Figure 5C). The effect of this introduction is documented in Figure 5D.
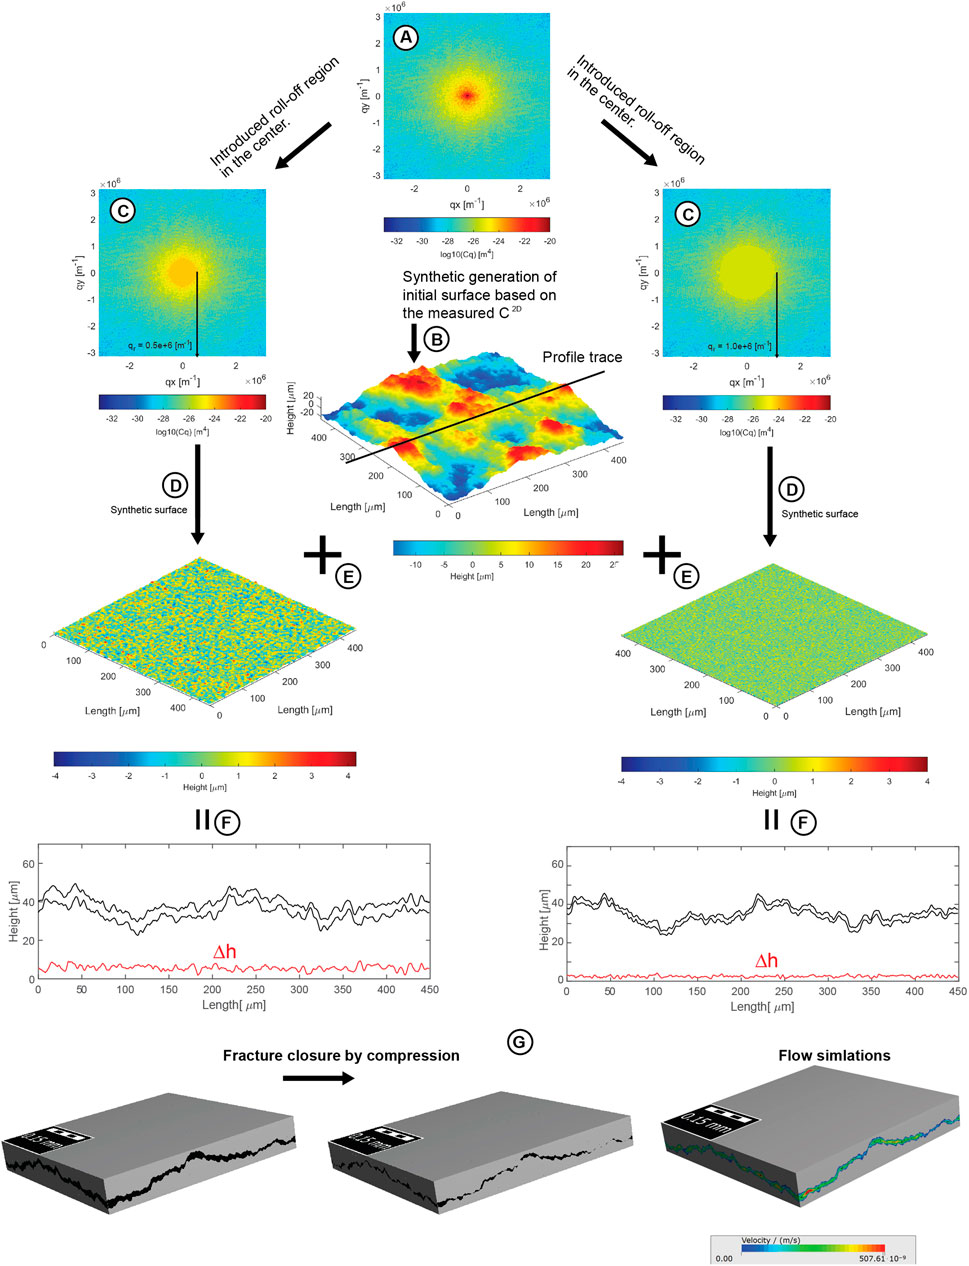
FIGURE 5. Procedure of artificial fracture generation by taking the slickensides fracture type as example. The initial surfaces were generated (B) using the measured C2D (A) (see also Figures 3, 4). For all fracture models, the lower and upper fracture surfaces consist of these initial surfaces. The short wavelength roughness elements in the initial surfaces (A) were modified so that the misfit between the two fracture surfaces is defined by different short wavelength roughness elements in the lower and upper fracture surfaces. Thereby, the initial fracture surface was combined (E) with random surfaces (D) which were generated from the measured but modified C2D (C), where a roll-off region was introduced. The congruence between the two fracture surfaces is controlled by different values of roll-off wave vectors qr (C,D). After generating the lower and upper fracture surfaces, these were brought into contact. (F) Shows profiles through the resulting fractures along with the related aperture Δh which documents the influence of the procedure on the congruence. (G) In order to simulate fracture closure mechanism and transport, the fracture models were discretized.
The initially produced fracture surfaces (Figure 5B) were combined with two different modified (i.e. with roll-off wave vector) surface realizations (Figure 5E), resulting in two surfaces that complement each other well on a longer scale, but are slightly worse on a shorter scale. The heights of one of these surfaces were then shifted so that its minimum value was zero. Then the other surface was shifted onto the first surface until they touched (see Oron and Berkowitz, 1998). The procedure has been performed for four different roll-off wave vectors qr (= 1e+6 m−1, 0.5e+6 m−1, 0.25e+6 m−1, 0.1e+6 m−1) resulting in different fracture models with variable congruence of the fracture surfaces. Regarding slickensides models, Figure 5F shows cross-sections through two slickenside models with different congruence between the upper and lower fracture surface. In order to use the fracture models as input for simulations, the height values have been discretized (Figure 5G). The resulting fracture models have voxel size of 500 nm.
The root mean square value aperrms of the aperture distribution
4 Results
4.1 The influence of fracture congruence (matedness) on transport properties
To determine the influence of the degree of congruence between the two fracture surfaces on the transport properties, the mean aperture D50 (50% of the fracture volume has smaller apertures than D50 and 50 vol% has a larger aperture) was calculated for each fracture model. This procedure was also chosen to compare the results with the parallel plate fracture model. The GeoDict software was used to calculate transport properties (Wiegmann et al., 2010). For this purpose, this software uses 3D structures in voxel representation and uses them as input to solve partial differential equations. GeoDict calculates the flow velocity in each voxel of the domain (i.e. fracture and solid in Figure 5) and computes an average flow velocity, which is then used to determine the permeability of the whole domain via the Darcy law (Versteeg and Malalasekera, 2007). In this case we are interested in the permeability of a single fracture. Therefore, the averaged velocity in the volume (black volume in Figure 5) of the fracture was used to calculate the permeability of the fracture. The permeabilities were calculated in x and y directions to account for a potential anisotropy. Figure 6 summarizes the results of these calculations. The statement is that for the same mean aperture, the type of shear surfaces has only a marginally effect on permeability.
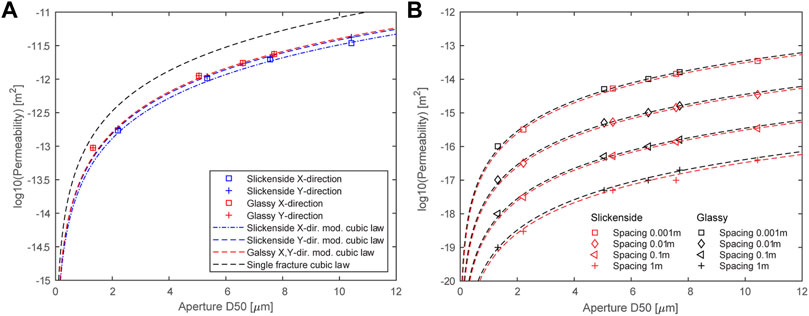
FIGURE 6. (A) Single fracture permeability as a function of mean fracture opening D50 for the two fracture types and with a comparison to single fracture permeability calculated based on the cubic law. (B) The single fracture permeabilities were converted to a bulk permeability depending on the mean spacing between the fractures.
The calculated permeabilities were compared with those based on the cubic law
Permeability anisotropy in slickensides is not very pronounced, but permeability parallel to the striations (Y direction) is slightly higher than perpendicular to it. The structural anisotropy of the slickensides nevertheless has a pronounced influence on the flow velocity field. Along the grooves, flow channeling occurs where the flow velocity is enhanced along the channels. In shear direction, the transport in fractures with slickensides is therefore enhanced when compared to transport perpendicular to shear direction.
For geological applications, knowledge of single fracture permeability is only of secondary interest. Based on the flow velocity field, the permeability was converted to a permeability for multiple parallel fractures where the fractures are separated by a regular spacing (Figure 6B). A permeability model was fitted to the calculated permeabilities. Based on the parallel plate model, the permeability for parallel multi fractures is given as
4.2 Contact behavior during fracture closure by compression
When fractures are closed by compression (see section 4.3), the contact behavior plays a major role in regard of the hydromechanical behavior as the two fracture surfaces approach each other. This behavior can be estimated by analyzing the aperture distribution Δh (x,y) between fracture surfaces. For this purpose, the cumulated area fraction corresponding to an increasing aperture range was calculated. This range can also be considered as displacement during compression and thus Figure 7 shows the expected evolution of the contact area fraction and the evolution of the number of contact regions with increasing closure of the fracture. The curves in Figure 7A were calculated from the aperture distribution Δh (x,y), which has the properties of an image with an aperture Δh assigned to each pixel. Then, for a given aperture Δhgiven the number of pixels N with apertures smaller than Δhgiven was determined. From N the contact area was calculated that is formed when the two fracture surfaces approach each other by a distance = Δhgiven. This calculation was done for all unique values of Δh, which yielded the curves. The area corresponds to the projected area that is perpendicular to the compression direction and thus largely controls closure by compression. In addition, for all unique values of Δh, the connected contact regions were determined using bwlable function of Matlab in combination with the given contact pattern. This resulted in the number of contact regions with increasing convergence Δh of the two fracture surfaces (Figure 7B). Figure 7 shows that for slickensides and glassy fracture surfaces with different initial congruence between the fracture surfaces, the contact behavior does not depend on the roughness of the individual fracture surface, but on aperrms. This is obvious since the order of the curves in Figure 7A does not depend on the roughness of the respective fracture surface. Contact area formation is controlled by aperrms and the smaller aperrms, the larger is the formed contact area for a given displacement. Because fracture stiffness depends on the total contact area, fractures with a comparatively small aperrms are expected to be stiffer. The evolution of the number of contact regions also depends on aperrms. At the beginning of fracture closure, the rate of contact area formation and the total number of contacts formed is higher for fractures with comparable low aperrms (Figure 7B). At a certain point, a coalescence of contacts occurs, and the number of contacts decreases with increasing fracture closure (Figure 7B).
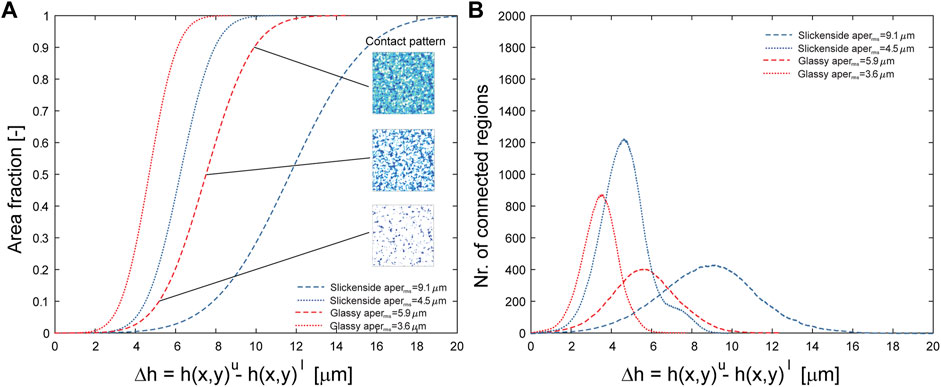
FIGURE 7. (A) Area fraction as a function of the aperture Δh between the upper and lower fracture surfaces for slickenside and glassy fracture types with different congruence aperrms. The area fraction corresponds approximately to the area formed by successive fracture closure where the aperture corresponds to the displacement. The inserted images correspond to the expected contact pattern at different stages during fracture closure. (B) Number of contact regions as a function of aperture Δh between the upper and lower fracture surface for slickenside and glassy fracture types with different congruency aperrms.
4.3 Fracture closure by compression and related transport behavior
The FeelMath-LD module of the GeoDict software simulates non-linear large deformation (Moulinec and Suquet, 1998; Kabel et al., 2015). It allows the set-up of a compression experiment in arbitrary direction. Here it was used to compress the generated fracture models (Figure 5) and the simulation tool can detect new material contacts when the fracture surfaces increasingly touch each other as the compression increases. The fractures were compressed in steps normal to the fracture surface. After each step, the deformed structure was used as input for the next deformation step. The respective strain per step was 2% and a total of 5 steps were calculated. An isotropic behavior is assumed and for this case the Young Modulus and Poisson’s ratio of clay rock matrix was set to 6 GPa and 0.27 respectively (Bock, 2001). Experimental data for normal stress/fracture closure curves show the influence of plastic deformation on fracture closure (Zhang, 2011). In order to address the influence of plastic deformation, the calculations were performed for 1) pure elastic deformation and for 2) elastic-plastic deformation. The experimentally determined compressive strength of Opalinus Clay depends on various parameters, such as the confining pressure, water content, specimen orientation, and also specimen size. The macroscopic uniaxial strength ranges up to 40 MPa, while for the microscopic strength of the porous clay matrix higher values of >100 MPa where obtained (Giger and Marschall, 2014; Keller et al., 2017). To account for the variation in the available strength data the yield stress related to elastic-plastic deformation was set to 40 and 100 MPa in two different calculations. If these values are exceeded locally at a specific contact between the fracture surfaces, the deformation proceeds purely plastically during ongoing closure. The simulations were performed for a slickenside model with aperrms = 9.1 μm and glassy model with aperrms = 5.9 μm. For these two fracture models the contact behavior was also analyzed (Figure 7).
At the beginning of the compression experiment both fracture types have a similar contact area and number of contact regions, but slickensides with aperrms = 9.1 μm are more compliant than glassy fractures with aperrms = 5.9 μm and therefore the aperture in the slickenside model decreases more with increasing load (Figure 8A). For the present case, this behavior is largely controlled by the rate of contact area formation and rate of contact region formation during fracture closure, which in turn are controlled by aperrms.
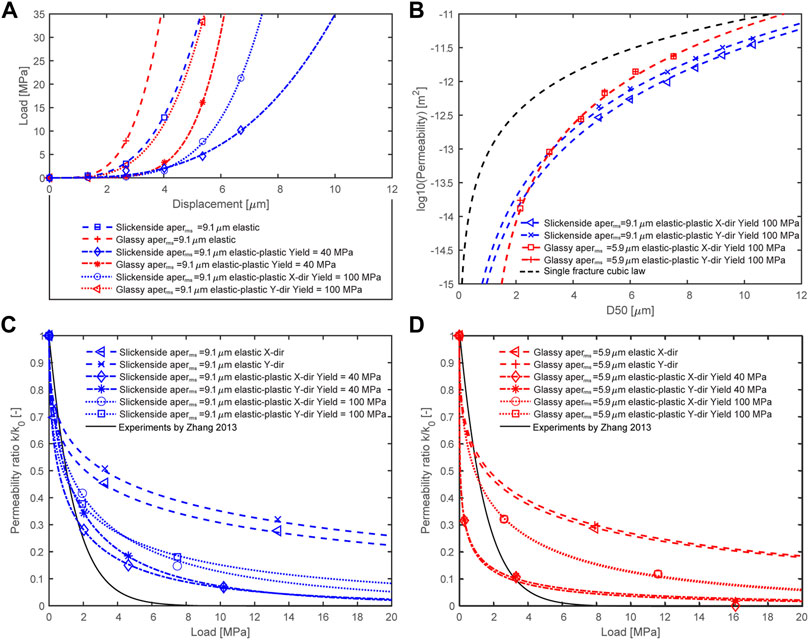
FIGURE 8. (A) Relationship between vertical load and vertical displacement during the virtual compression experiment in the case of a slickenside or glassy fracture surface. (B) Permeability in relation to the mean aperture D50 related to fracture closure by compression and for elastic-plastic deformation. (C) Ratio between reduced and initial permeability as a function of applied normal load for slickensides under elastic and elastic-plastic deformation. (D) Same as (C) but for glassy fractures.
Figures 8C,D shows that with increasing normal load, the permeability of the glassy model decreases more than that of the slickenside fracture model particularly at low yield strengths. At a normal load of about 5 MPa and at the used material laws, the permeability is reduced by ∼60% in case of elastic deformation and by ∼85–95% in case of elastic-plastic deformation at yield strength of 40 MPa. Figures 8C,D also shows the experimental data of Zhang (2013), which are related to fractures in drill cores of Opalinus Clay that were closed by compression. The data imply that the permeability during the first load increment of 5 MPa decreases below a value of 10% of the initial value. In this respect, the glassy fracture model behaves similarly in case the yield-strength is set to 40 MPa. What the comparison between experiments and simulation shows, however, is the importance of plastic deformation and also of the characteristics of the aperture distribution aperrms both controlling fracture closure by compression (see also Zhang, 2013).
In case congruence controls the aperture and also in the case of the parallel plates fracture model, permeability is proportional to the second power of the aperture (see section 4.1). Under compression, permeability deviates for this relation and the behavior of the glassy fracture and slickensides is different, the permeability-mean aperture relationship of the two fracture models differing not only by a different proportionality factor (Figure 8B). Figure 9 (upper two rows) shows the flow fields along the y-direction for the two fracture models at three different normal loads. With increasing normal load, both the number of contact regions and their area increase. This gradually divides the fluid flow into a series of channels which increases the tortuosity. This, along with the decreasing aperture, is the reason for the decreasing flow with increasing normal load. The shape of the contact points varies. In slickensides they are elongated and tend to be arranged in rows. In glassy fractures, no directional dependence is apparent. This results in a permeability anisotropy for slickensides and a permeability isotropy for glassy fractures.
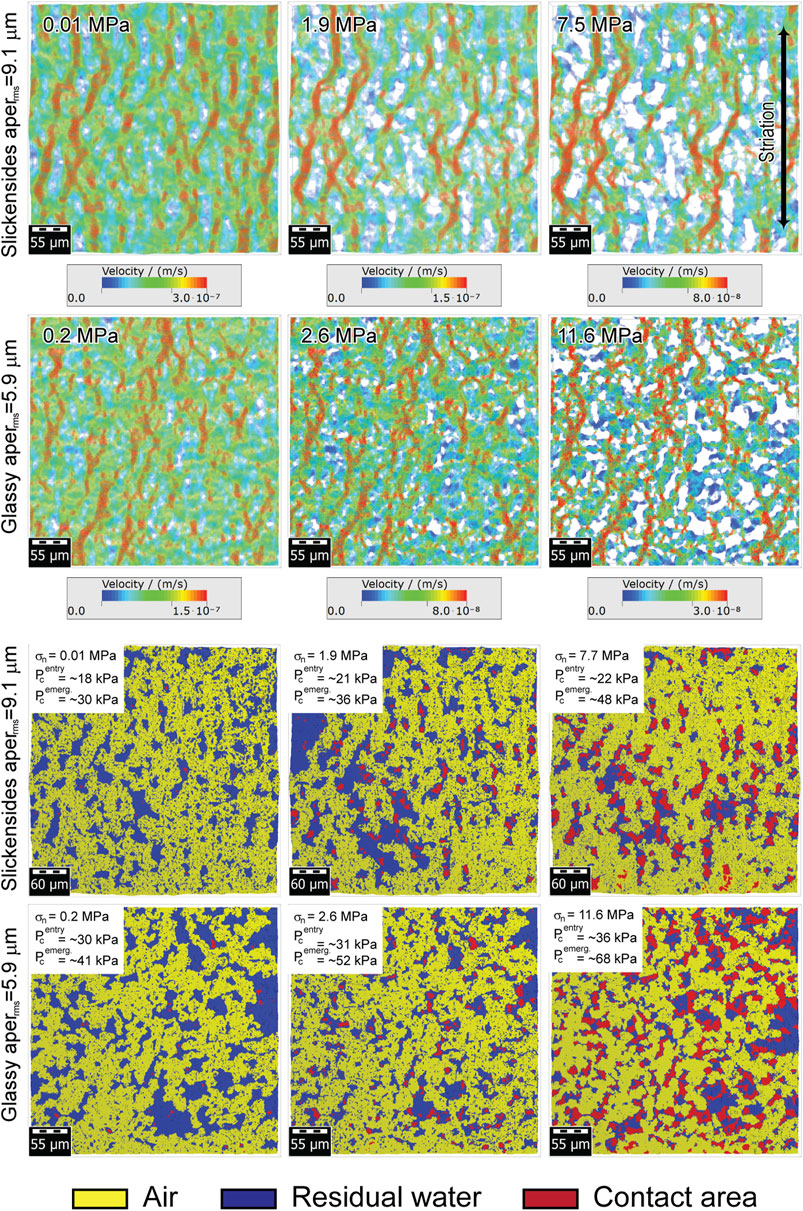
FIGURE 9. Upper two rows of images: flow velocity distribution for the flow in y-direction in slickensides of a glassy fracture type. Lower two rows of images: top view into the fracture interior shows the influence of compression and different types of fractures on the formation of contact areas (red) and the residual water (blue) during the drainage of water from the fracture. The vertical load increases from left to right.
We also simulated (SatuDict module of GeoDict) the draining of water from the fracture at different stages of compression to study effects of contact area formation on the presence of residual water. Figure 9 (lower two rows) shows the phase distribution at a capillary pressure when most of the mobile water has been drained and in case air pressure is applied in the y-direction. Figure 9 also shows the contact areas between the fracture surfaces in red. The residual water is bound to the constrictions which are in the vicinity of contact regions or future contact regions. Larger connected water bodies form where the distance between the contact regions is small, i.e., where many contacts form in a certain displacement increment. If draining occurs simultaneously with compression, the residual water will be displaced into regions with larger apertures, but then the air pressure must be further increased to drain this water as the aperture further decreases. As expected, the gas entry pressure
4.4 Fracture closure by swelling
Fracture closure by swelling is considered effective in clay rocks. Swelling is controlled on the nano to micro scale and is related to the incorporation of water in the crystal lattice, adsorption of water on mineral surfaces and osmotic processes. Depending on how the rock is restricted in its expansion, swelling manifests itself in the form of swelling pressure or volumetric expansion, the latter being important in the closure of fractures. In a recent study analyzing published data on experimentally determined swelling volume, it was found that confining pressure is the dominant parameter (Lyu et al., 2015). Clay content and initial water content have a lesser influence, but of course cannot be neglected. Furthermore, it was found that water penetrates clayey material only in the immediate vicinity of the fracture surface (Davy et al., 2007) and thus swelling is most likely limited to the fracture zone (Davy et al., 2007). Since swelling volume is affected by confining pressure, this study investigates possible effects of local stress variations along the fracture surfaces, which is controlled by roughness, on fracture closure by swelling. Swelling depends strongly on the confining pressure and at pressures >1 MPa, according to the data of Lyu et al. (2015), the effectiveness of swelling to close fractures in clay rock is limited. This is especially true when the rock is already saturated with water (Figure 10). This is supported by the experiments of Zhang et al. (2010) where the swelling strain under confined conditions is less than 0.1%. To investigate how the fracture models are closed by swelling, the mean pressure distribution was calculated for a vertical strain of 1% and by variating the pore pressure, which results in different confining pressures (Figure 10). These pressure distributions were then used together with swelling data from Lyu et al. (2015). Thereby, clay content was set to 83 vol% (according to Figure 2) and the water saturation to 10%. The swelling volume was then calculated for each voxel. Then the total volume change in each voxel column below and above the fracture was calculated. This volume change is then considered as the volume that contributes to the closure of the fracture (Figure 10B). Figure 11A shows the influence of swelling on permeability. Swelling is more effective for fractures with comparatively low aperrms such as glassy fractures. However, the effectiveness depends strongly on the hydrostatic pressure. For the selected parameters, an increase in hydrostatic pressure of about 0.5 MPa substantially reduces the swelling effect. In addition, Figure 11A shows that the contact area fraction between the fracture surfaces increases non-linearly with decreasing hydrostatic pressure and that at a contact area fraction of 30–40% the fractures become impermeable. It should be noted that the closure efficiency depends on the relative volume fraction of the rock that is penetrated by water. For the fracture models, this is between 85–90 vol%. As under compression, for fracture closure by swelling, permeability is not proportional to the second power of the mean aperture (Figure 11B).
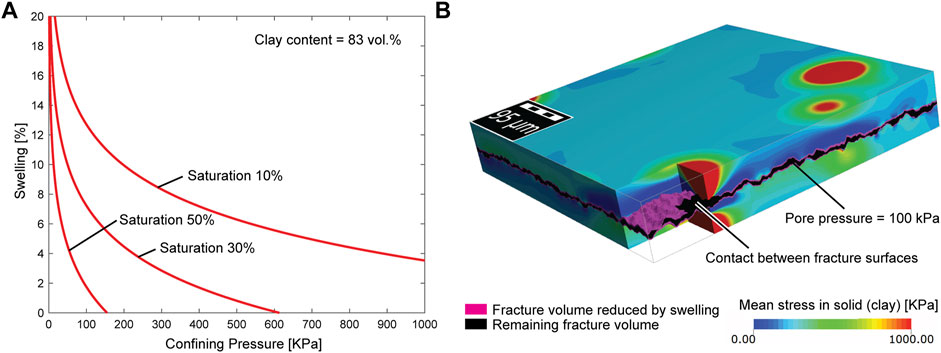
FIGURE 10. (A) Swelling as a function of confining pressure at a clay content of 83 vol% and at different water saturations according to Lyu et al. (2015). (B) Example of a mean pressure distribution. Also visualized is the volume in pink by which the fracture has been reduced. Note that no swelling occurs in the vicinity of the contact region due to the high pressure.
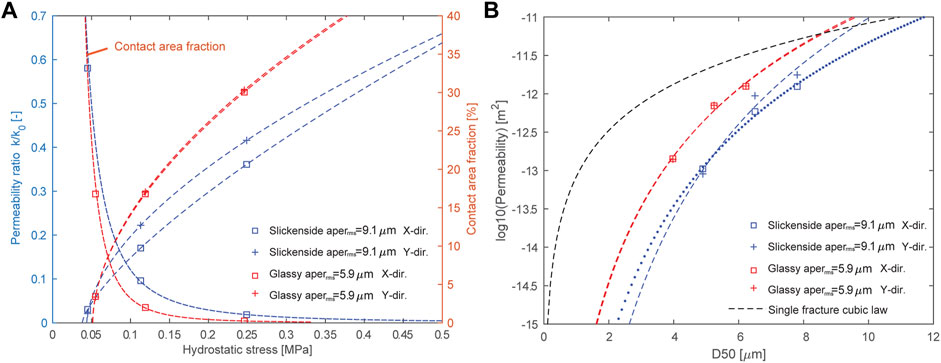
FIGURE 11. (A) Ratio between permeability reduced by swelling and initial permeability as a function of hydrostatic pressure. Also plotted is the contact area fraction as a function of hydrostatic pressure. (B) Permeability in relation to the mean aperture D50 related to fracture closure by swelling.
5 Discussion
Of course, if single fractures in delicate clay rocks are analyzed with the aim of studying the transport properties, this only really makes sense if it can be ensured that the surrounding rock matrix is not affected by deformation. In the present case, it was demonstrated that the deformation occurred at the fracture surfaces and thus the increased transport capacity of fractured rocks is due to the presence of the fracture and not due to a diffuse zone consisting of a fracture and a rock matrix with enhanced porosity. It has been postulated that rock fracture surfaces have a fractal dimension of ∼2.2 and this independent of rock type (Berkowitz, 2002 and references therein). At least in case of Opalinus Clay, this generalization does not seem to be confirmed here (see section 2).
It turned out that the surface roughness power spectrum is a powerful tool to analyze the roughness differences of rock fracture surfaces. The striation of slickensides are related to the small q (i.e. long wavelength) surface roughness elements, which for this fracture type are anisotropic. On the other hand, the glassy fracture surface exhibits a roll-off region and thus the roughness elements with small q surface roughness elements are largely absent. Therefore, if the congruence between the fracture surfaces determines the transport properties, it is the long wavelength structural elements that account for the small difference in permeability between the two fracture types because the short wavelength structural elements are nearly the same in both fracture types. In other words, the long wavelength structural elements control the geometric tortuosity, which in the case of equal short wavelength roughness elements is the critical factor. To support this, the geodesic tortuosity was calculated, which in the case of slickensides is 1.05 parallel to the striation and perpendicular to it is 1.08. For the glassy surfaces it is isotropic and in the range of 1.01. The short wavelength structural elements influence the flow velocity locally in a way that leads to a reduction of permeability. Furthermore, if the permeability is controlled by the congruence of the two fracture surfaces, the simulations predict that the permeability
According to the presented simulations, the picture changes when the fractures are compressed. How new contacts are formed between the fracture surfaces during compression depends strongly on the on the root mean square value aperrms of the aperture Δh of the fracture and in particular on the wavelength range of the roughness elements in which the two fracture surfaces differ (Figure 7). In other words, the behavior depends strongly on the geometric congruence of the two fracture surfaces. The simulations predict, the lower the aperrms the lower the fracture compliance or the higher the fracture stiffness.
The contact behavior during compression controls both the fracture compliance/stiffness and the geometry of the transport paths and thus is the link between the mechanical properties and transport properties of fractures in Opalinus Clay (Figures 7–9 see also Pyrak-Nolte and Morris, 2000). Under compression, permeability is no longer proportional to
It is questionable whether the contact mechanics algorithm of the simulations correctly represents reality in clay rocks. However, the simulations show that in clay rocks plastic deformation plays a significant role during fracture closure by compression. In agreement with experiments, simulations predict that permeability drops below 10% of the initial value at a compressive stress of 5 MPa. This behavior depends on aperrms as well as on the yield strength, and the comparison between experiment and simulation suggests that the “correct” value of the yield strength tends to be somewhat lower than 40 MPa. Moreover, it is not only the description of the contact mechanics that is important if the predictions are to be compared with the experiments in which artificially fractured rock cores are closed under compression (e.g. Zhang, 2016). At this scale, the root mean square height is expected to be larger for fracture types without a roll-off region than at the scale studied here. This would likely result in a higher fracture compliance on the dm scale than indicated here. It can also be assumed that on the dm scale the contact areas could locally become so large that there are no more continuous percolating paths, even though the fracture is still open over large areas. This is particularly true, when the two fracture surfaces are significantly offset.
Another point to be discussed here is the influence of swelling on the closure of fractures in clay rocks. Laboratory tests in which artificially fractured specimens with initial apertures in the millimeter range were hydrated have shown the following (Zhang, 2011; Voltoloni and Ajo-Franklin, 2020). Near the fracture surface, hydration leads to decomposition of the material along mostly fracture-parallel cracks. This process further enhances the swelling of the material, which then leads to closure of the crack which can be further enhanced by additional mechanical confinement. At this point, it must be noted that the application of artificial fractures in clay rocks seems to be a rather severe mechanical intervention, as evidenced by the high initial aperture and the associated poor congruence of the fracture halves. The latter is quite desirable in these studies to produce increased initial permeability. Thus, the fracture halves were also rotated 180° to each other to increase permeability. Parallel cracking at the fracture surface caused by hydration indicates an increased accessibility of water and the presence of sufficient void space, which can be explained by a damage zone induced during artificial fracture formation or by the formation of drying cracks before the experiment. This type of experiment explores the healing of fractures that form in the region of the excavation zone of a repository and is therefore not directly relevant to the conclusions of this study, although swelling may also be conceivable in natural shear fractures. However, it is questionable whether a swelling process as described in the above experiments has taken place in the present shear fractures, because in such a case the deformation structures such as striations and the polished surface would have been overprinted. This conclusion is supported by the fact that clay minerals have been sheared off at the shear plane, indicating that the microstructure has been modified only in close proximity to the shear plane. Apart from a narrow zone along the fracture surface, the microstructure is indistinguishable from the undisturbed microstructure of Opalinus Clay as reported by Keller et al. (2011) at a distance exceeding 10 μm from the fracture surface. It is concluded that the present shear fractures have not or not yet been closed by swelling. However, since post deformation closure of shear fractures by swelling is a possible scenario the influence of surface roughness on aperture reduction and related permeability was discussed in section 4.4.
6 Conclusion
The study of natural fracture surfaces with different roughness characteristics gives an insight into how different roughness components control the hydromechanical properties of fractures. The higher root mean square value of the aperture aperrms the higher is the fracture compliance, which is related to the contact formation behavior. Comparatively smaller values of aperrms increase the rate of contact area and contact region formation during fracture closure, which results in a higher fracture stiffness and reduced permeability when compared to fractures with a higher aperrms. In addition, contact formation affects the distribution of the residual water during the drainage of water from fractures. In clay rocks the relationships between mean aperture and permeability depend on the fracture closure mechanism.
Data availability statement
The raw data supporting the conclusions of this article will be made available by the authors, without undue reservation.
Author contributions
LK is responsible for the concept of the paper as well as for the simulations and the laboratory investigations. He also wrote the article.
Funding
This work was funded by the Swiss National Cooperative for the Disposal of Nuclear Waste (NAGRA) and by the European Joint Program on Radioactive Waste Management (EURAD). Open access funding provided by Zurich University of Applied Sciences (ZHAW), Winterthur, Switzerland.
Acknowledgments
Paul Marschall has commented on an early version of this work resulting in a qualitative improvement of the work. Christian Zaubitzer from ScopeM (ETH, Zurich, Switzerland) helped with the FIB/SEM investigations.
Conflict of interest
The authors declare that the research was conducted in the absence of any commercial or financial relationships that could be construed as a potential conflict of interest.
Publisher’s note
All claims expressed in this article are solely those of the authors and do not necessarily represent those of their affiliated organizations, or those of the publisher, the editors and the reviewers. Any product that may be evaluated in this article, or claim that may be made by its manufacturer, is not guaranteed or endorsed by the publisher.
References
Berkowitz, B. (2002). Characterizing flow and transport in fractured geological media: A review. Adv. Water Resour. 25, 861–884. doi:10.1016/s0309-1708(02)00042-8
Bock, H. (2001). RA experiment. Rock mechanics analysis and synthesis: Data report on rock mechanics. Technical Report 2000-02. St-Ursanne, Switzerland: Mont Terri Project.
Bossart, P., and Thury, M. (2008). Mont Terri rock laboratory: Project, programme 1996–2007 and results. Wabern: Reports of the Swiss Geological Survey. No. 3.
Braester, C. (1999). in Radioactive waste repositories in fractured rocks formations: Hydrodynamic aspects. Energy and the environment. Editors A. Bejan, P. Vadasz, and D. G. Kröger (Netherlands: Springer), 15, 229–238. doi:10.1007/978-94-011-4593-0_20
Briggs, S., Karney, B., and Sleep, B. (2017). Numerical modeling of the effects of roughness on flow and eddy formation in fractures. J. Rock Mech. Geotechnical Eng. 9, 105–115. doi:10.1016/j.jrmge.2016.08.004
Brown, S. R., and Scholz, C. H. (1986). Closure of rock joints. J. Geophys. Res. 91, 4939. doi:10.1029/jb091ib05p04939
Davy, C. A., Skoczylas, F., Barnichon, J.-D., and Lebon, P. (2007). Permeability of macro-cracked argillite under confinement: Gas and water testing. Phys. Chem. Earth Parts A/B/C 32, 667–680. doi:10.1016/j.pce.2006.02.055
Develi, K., and Babadagli, T. (2015). Experimental and visual analysis of single-phase flow through rough fracture replicas. Int. J. Rock Mech. Min. Sci. (1997) 73, 139–155. doi:10.1016/j.ijrmms.2014.11.002
Evans, D., and Rasmussen, T. (1991). Unsaturated flow and transport through fractured rock related to high-level waste repositories. Final report, phase 3. Nuclear Regulatory Commission, Washington, DC (United States). Tucson, AZ (United States): Div. Of Engineering; Arizona Univ. Dept. of Hydrology and Water Resources. doi:10.2172/137966
Ge, S. (1997). A governing equation for fluid flow in rough fractures. Water Resour. Res. 33, 53–61. doi:10.1029/96wr02588
Giger, S., and Marschall, P. (2014). Geomechanical properties, rock models and in-situ stress conditions for Opalinus Clay in Northern Switzerland. Nagra Wettingen, Switzerland: Arbeitsbericht NAB 14-01.
Helmli, F. (2011). “Focus variation instruments,” in Optical measurement of surface topography. Editor R. Leach (Berlin: Springer), 131–166.
Holzer, L., Indutnyi, F., Gasser, Ph., Münch, B., and Wegmann, M. (2004). Three-dimensional analysis of porous BaTiO3 ceramics using FIB nanotomography. J. Microsc. 216, 84–95. doi:10.1111/j.0022-2720.2004.01397.x
Kabel, M., Merkert, D., and Schneider, M. (2015). Use of composite voxels in FFT-based homogenization. Comput. Methods Appl. Mech. Eng. 294, 168–188. doi:10.1016/j.cma.2015.06.003
Kanafi, M. M., Kuosmanen, A., Pellinen, T. K., and Tuononen, A. J. (2015). Macro- and micro-texture evolution of road pavements and correlation with friction. Int. J. Pavement Eng. 16, 168–179. doi:10.1080/10298436.2014.937715
Kanafi, M. M., and Tuononen, A. J. (2017). Top topography surface roughness power spectrum for pavement friction evalution. Tribol. Int. 107, 240–249. doi:10.1016/j.triboint.2016.11.038
Keller, L. M., Holzer, L., Wepf, R., and Gasser, P. (2011). 3D geometry and topology of pore pathways in Opalinus clay: Implications for mass transport. Appl. Clay Sci. 52, 85–95. doi:10.1016/j.clay.2011.02.003
Keller, L. M., Schwiedrzik, J. J., Gasser, P., and Michler, J. (2017). Understanding anisotropic mechanical properties of shales at different length scales: In situ micropillar compression combined with finite element calculations. J. Geophys. Res. Solid Earth 122, 5945–5955. doi:10.1002/2017JB014240
Lee, J., and Babadagli, T. (2021). Effect of roughness on fluid flow and solute transport in a single fracture: A review of recent developments, current trends, and future research. J. Nat. Gas. Sci. Eng. 91, 103971. doi:10.1016/j.jngse.2021.103971
Li, B., Zhou, F., Li, H., Tian, Y., Yang, X., Zhang, Y., et al. (2018). “Experimental investigation on the fracture conductivity of ultra-deep tight gas reservoirs: Especially focus on the unpropped fractures,” in 52nd U.S. Rock mechanics/geomechanics symposium (Seattle, Washington: American Rock Mechanics Association ARMA, 17–20. ARMA-2018-1273.
Lyu, Q., Ranjith, P. G., Long, X., Kang, Y., and Huang, M. (2015). A review of shale swelling by water adsorption. J. Nat. Gas. Sci. Eng. 27, 1421–1431. doi:10.1016/j.jngse.2015.10.004
Moulinec, H., and Suquet, P. (1998). A numerical method for computing the overall response of nonlinear composites with complex microstructure. Comput. Methods Appl. Mech. Eng. 157, 69–94. doi:10.1016/s0045-7825(97)00218-1
Nagra (2002). Projekt Opalinuston-Synthese der geowissenschafftlichen Untersuchungsergebnisse. Entsorgungsnachweis für abgebrannte Brennelemente, verglaste hochaktive sowie langlebige mittelaktive Abfälle. Wettingen, Switzerland: Nagra Technical Report. NTB 02–03.
Nayak, P. R. (1971). Random process model of rough surfaces. J. Lubr. Technol. 93, 398–407. doi:10.1115/1.3451608
Ogilvie, S., Isakov, E., and Glover, P. (2006). Fluid flow through rough fractures in rocks. II: A new matching model for rough rock fractures. Earth Planet. Sci. Lett. 241, 454–465. doi:10.1016/j.epsl.2005.11.041
Oron, A. P., and Berkowitz, B. (1998). Flow in rock fractures: The local cubic law assumption reexamined. Water Resour. Res. 34, 2811–2825. doi:10.1029/98WR02285
Persson, B. N. J., Albohr, O., Tartaglino, U., Volokitin, A. I., and Tosatti, E. (2005). On the nature of surface roughness with application to contact mechanics, sealing, rubber friction and adhesion. J. Phys. Condens. Matter 17, R1–R62. doi:10.1088/0953-8984/17/1/r01
Pyrak-Nolte, L. J., and Morris, J. P. (2000). Single fracture under normal stress: The relation between fracture stiffness and fluid flow. Int. J. Rock Mech. Min. Sci. 37, 245–262. doi:10.1016/S1365-1609(99)00104-5
Raven, K., and Gale, J. (1985). Water flow in a natural rock fracture as a function of stress and sample size. Int. J. Rock Mech. Min. Sci. Geomechanics Abstr. 22, 251–261. doi:10.1016/0148-9062(85)92952-3
Unger, A. J. A., and Mase, C. W. (1993). Numerical study of the hydromechanical behavior of two rough fracture surfaces in contact. Water Resour. Res. 29, 2101–2114. doi:10.1029/93wr00516
Versteeg, H. K., and Malalasekera, W. (2007). An introduction to computational fluid dynamics: The finite volume method. 2nd Edition. Pearson: Prentice-Hall.
Voltoloni, M., and Ajo-Franklin, J. B. (2020). The sealing mechanisms of a fracture in Opalinus clay as revealed by in situ synchrotron X-ray micro-tomography. Front. Earth Sci. 8, 207. doi:10.3389/feart.2020.00207
Wang, L., Cardenas, M., Slottke, D., Ketcham, R., and Sharp, J. M. (2015). Modification of the local cubic law of fracture flow for weak inertia, tortuosity, and roughness. Water Resour. Res. 51, 2064–2080. doi:10.1002/2014wr015815
Wiegmann, A., Iliev, O., and Schindelin, A. (2010). “Computer aided engineering of filter materials and pleated filters,” in Global guide of the filtration and separation industry. Editor E. von der Luehe (Roedermark, Germany: VDL Verlag), 191–198.
Witherspoon, P., Wang, J., Iwai, K., and Gale, J. E. (1980). Validity of cubic law for fluid flow in a deformable rock fracture. Water Resour. Res. 16, 1016–1024. doi:10.1029/WR016i006p01016
Zhang, C.-L. (2011). Experimental evidence for self-sealing of fractures in claystone. Phys. Chem. Earth Parts A/B/C 36, 1972–1980. doi:10.1016/j.pce.2011.07.030
Zhang, C.-L. (2013). Sealing of fractures in claystone. J. Rock Mech. Geotechnical Eng. 5, 214–220. doi:10.1016/j.jrmge.2013.04.001
Zhang, C.-L. (2016). The stress–strain–permeability behaviour of clay rock during damage and recompaction. J. Rock Mech. Geotechnical Eng. 8, 16–26. doi:10.1016/j.jrmge.2015.10.001
Zhang, C.-L., Wieczorek, K., and Xie, M. L. (2010). Swelling experiments on mudstones. J. Rock Mech. Geotech. Eng. 2, 44–51. doi:10.3724/SP.J.1235.2010.00044
Keywords: opalinus clay, nuclear waste, surface roughness, fracture closure, permeability
Citation: Keller LM (2022) The hydromechanical behavior of opalinus clay fractures: Combining roughness measurements with computer simulations. Front. Earth Sci. 10:945377. doi: 10.3389/feart.2022.945377
Received: 16 May 2022; Accepted: 28 July 2022;
Published: 25 August 2022.
Edited by:
Nicola Tisato, University of Texas at Austin, United StatesReviewed by:
Qi Zhao, Hong Kong Polytechnic University, Hong Kong SAR, ChinaBryan Tatone, University of Toronto, Canada
Copyright © 2022 Keller. This is an open-access article distributed under the terms of the Creative Commons Attribution License (CC BY). The use, distribution or reproduction in other forums is permitted, provided the original author(s) and the copyright owner(s) are credited and that the original publication in this journal is cited, in accordance with accepted academic practice. No use, distribution or reproduction is permitted which does not comply with these terms.
*Correspondence: Lukas M. Keller, a2VsdUB6aGF3LmNo