 Ting Mao
 Yupeng Liu
 Wei-Qiang Chen
 Nan Li1,2,3
 Yao Shi
94% of researchers rate our articles as excellent or good
Learn more about the work of our research integrity team to safeguard the quality of each article we publish.
Find out more
ORIGINAL RESEARCH article
Front. Earth Sci., 10 August 2022
Sec. Geoscience and Society
Volume 10 - 2022 | https://doi.org/10.3389/feart.2022.944865
This article is part of the Research TopicLand use/cover changes and ecosystems: coupling human and nature systems for sustainabilityView all 7 articles
Understanding building metabolism is critical for guiding urban resource management and addressing challenges in urban sustainable development. Key attributes of buildings, including geolocation, footprint, height, and vintage, are crucial to characterizing spatiotemporal patterns of building metabolism. However, these attributes are usually challenging to obtain broadly and automatically, which obscures a comprehensive understanding and accurate assessment of urban metabolism. Moreover, the lack of a finer spatial pattern of these attributes shadows a spatially explicit characterization of material stock and flow in cities. In this study, we took Shenzhen—whose urbanization over the past three decades has been unprecedented in China and even around the world— has been taken as an example to develop a city-level building dataset based on a random-forest model and quantify the spatiotemporal patterns of material metabolism at relatively high spatial resolution (in 500 m × 500 m grids) by combing material flow analysis (MFA) with geographic information system (GIS). The results show that Shenzhen grew from a small town with 281.02 × 10⁶ m3 of buildings in the 1990s to a mega-city with 3585.5 × 106 m3 of buildings in 2018 and expanded both outward and upward from downtown to suburban areas. The urban “weight” (material stock) increased from 92.69 Mt in the 1990s to 1667.8 Mt in 2018 and tended to be saturated, with an average growth rate of 9.5% per year. Spatially, the south-central areas were the largest container of material stocks and generated the most demolition waste. The spatially explicit maps of building three-dimensional (3-D) form and vintage provide detailed information for architectural conservation and could support the decision-making for urban renewal planning. The spatiotemporal patterns of in-use material stocks and potential generation of construction and demolition waste (CDW) provide a benchmark of environmental risk assessment and potential secondary resources to reduce “original” material consumption, which could help alter urban renewal to an environmental-friendly and sustainable trajectory.
Urbanization usually leads to a three-dimensional growth of the buildings both horizontal and vertical directions, accompanied by large amounts of construction material consumption and demolition. Globally, the consumption of construction materials has increased 34-fold from 1900 to 2005 (Krausmann et al., 2009). What amount of material has been consumed for cities? What scales of materials were stored in cities? What amount of material is to demolish and emit into the environment? All these issues would undoubtedly affect urban sustainability (Müller, 2006; Cui et al., 2019; Liu et al., 2020b).
Characterizing urban 3-D growth and related material metabolism is critical to understanding above questions. In past years, many previous studies endeavored to answer these questions from national (Huo et al., 2019) to urban scales (Fu et al., 2019). These studies usually used in-use building stocks (stock-driven model) or newly built volume (flow-driven model) in statistics to estimate temporal changes of building metabolism for a long period based on material flow analysis (Augiseau and Barles., 2017), and even could generate scenarios of metabolism in the future based on lifestyle changes (Müller, 2006). In recent years, remote sensing images and geographic data are beginning to be applied in urban metabolism research. These studies can further analyze the spatial patterns of building metabolism with a spatially explicit method (Peled and Fishman., 2021; Huang et al., 2017). For example, Gontia et al. (2020) used GIS to quantify the spatial and temporal characteristics of various residential areas and help estimate material stock and flow. Marcellus-Zamora et al. (2016) developed a spatial material flow analysis (MFA) based on detailed land-use types, which could help describe the inventory of construction materials and improve the accuracy of material metabolism quantification. These spatial analyses require detailed and finer attributes on buildings, which are usually difficult to obtain easily and quickly and obscure related assessments on a broader scale (e.g., regional or continental levels).
Key attributes of buildings usually include geolocation, footprint, height, and year of construction or vintage, which are essential for helping understand urban 3-D growth and related material metabolism (Tanikawa and Hashimoto, 2009; Tanikawa et al., 2015; Mao et al., 2020). Traditionally, these attributes could be gathered through housing surveys and cadastral data. Still, this approach is challenging to scale up across a wide region because it is time-consuming and labor-intensive (Haberl et al., 2021). Therefore, finding a method that can collect and estimate these attributes quickly and accurately is important. A popular pathway in recent years leverages big data height analytics in retrieving geolocation (Yousefiyan et al., 2019), building footprint (Firozjaei et al., 2019; Li et al., 2021), and height data (Cai et al., 2020; Sun et al., 2020) by decoding the spectral information from remote sensing images or open-source dataset (e.g., Open street map). For vintage estimation within a city or even larger region, a few studies have used the machine learning method to estimate it within a city or even larger region (Aksoezen, 2015; Zirak et al., 2020). For example, the vintage of residential buildings in Vancouver, Canada, was estimated by the random forest (RF) model. The results showed that the uncertainty was ∼15.8 year (Tooke et al., 2014). When Rosser et al. (2019) used the same model applied for Nottingham, the UK, the accuracy rate further increased to 77% (Rosser et al., 2019). The relatively high accuracy of these studies proved that building morphology contributed a lot to estimating the vintage but could be even further refined, for example, by considering neighborhood-level features (Aksoezen et al., 2015; Rosser et al., 2019; Tooke et al., 2014).
In summary, the difficulty in obtaining key building information broadly and automatically has resulted in a lack of spatially detailed data on buildings. The spatially explicit analysis on characterizing spatiotemporal patterns of urban buildings and material stocks and flows remains rare. In this paper, we will address the above issues by 1) developing a city-level building dataset, especially estimating building vintage based on an RF model by using both individual and neighborhood-level morphological and geospatial features; and 2) characterizing material metabolism based on a GIS-based MFA model and mapping spatiotemporal patterns of material stocks and flows in 500m × 500 m grids.
Shenzhen is one of the fastest-growing cities and the youngest mega-city in China (Figure 1). It was a small valley in the 1980s, but it had more than 900 km2 of built-up area within its 2,020 km2 administrative region, inhabited by nearly 20 million people until 2018 (SSB 2019). During this period, its population increased 37-fold, the built-up area expanded 243-fold, and GDP grew 935-fold (SSB 2019). However, its rapid growth has brought various resources and environmental problems and toward an unsustainable trajectory of development. Specifically, the rapid urbanization of Shenzhen has led to severe overconsumption of land and resulted in severe contradiction with a booming population, limited available and natural space, scant resources, and a deteriorating environment, which limits its further development. The limited open space in Shenzhen asks for urban renewal and renovation, which would cause large-scale construction activities and vast amounts of associated material consumption and demolition. Thus, it is necessary to understand the spatiotemporal patterns of urban buildings and their material metabolism to support related urban renewal planning and policy-making in Shenzhen.
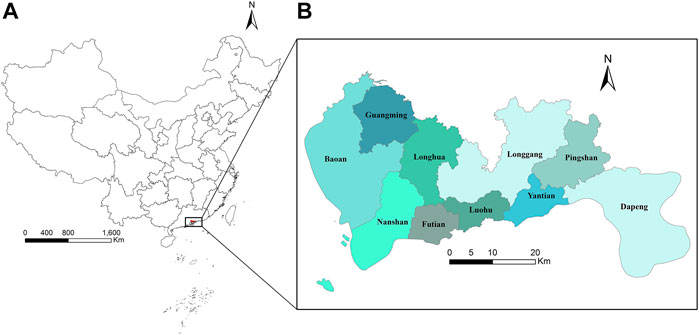
FIGURE 1. The location of Shenzhen in China (A) and its county subdivision (B).
We proposed an updated framework by combining the RF model and GIS-based MFA to develop a city-level building dataset and quantify spatiotemporal dynamics of urban building and related material metabolism in Shenzhen (Figure 2). We first obtained the geolocation, footprint, and height of buildings as the “geo-foundation”, then estimated the vintage based on the RF model and added it to the building dataset (Figure 2A). Next, we quantified material stocks and flows based on the GIS-based MFA model (Liu et al., 2022a) (Figure 2B). Finally, we mapped spatiotemporal patterns of buildings and materials from 1990 to 2018 at the 500*500 m of spatial resolution (Figure 2C).
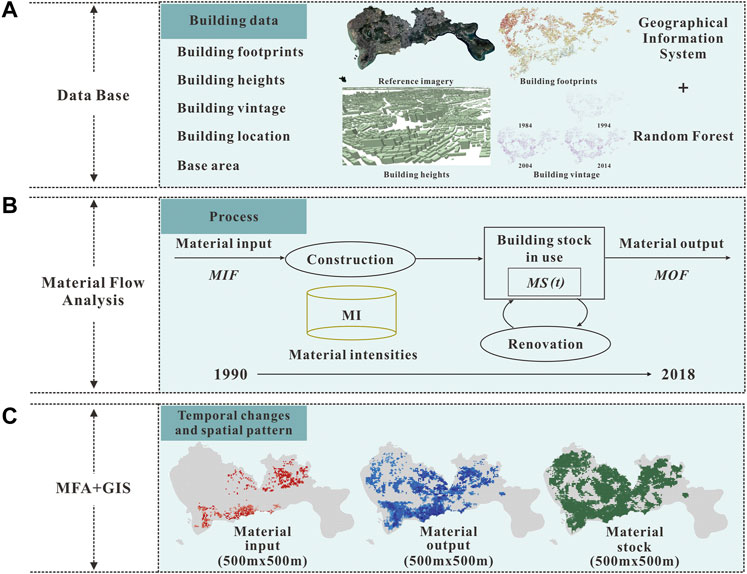
FIGURE 2. A framework for building data collection and estimation, material stock and flow quantification, and mapping in Shenzhen, China. Panel (A) shows the dataset of this study. Panel (B) shows the process of material flow analysis for the time changes. Panel (C) shows the combination of MFA and GIS for the spatial pattern.
The collection process of the geolocation, footprint, and height of buildings was in Shenzhen based on the digital maps generated by Beijing CityDNA Technology Company. An RF model was applied to estimate the vintage. The RF model is a statistical learning method that uses the bootstrap resampling method to draw multiple samples from the original sample, then creates the model decision trees for each bootstrap sample, and finally combines the predictions of multiple decision trees to arrive at the final decision prediction by voting (Breiman., 2001). Detailed processes for creating an RF were shown as follows:
1) Samples were randomly drawn from the original training samples by boot-strap, assuming that there were N samples in the initial training sample set, and each sample had M features. N samples were drawn from them each time with a return. This part of the sample was called out of bag (OOB) data and can be used to estimate the error called out of bag (OOB) error.
2) N samples were trained to obtain a decision tree, randomly selected m (m<M) features at each node of the decision tree, and Mean Decrease Accuracy importance were used to choose features for node splitting.
3) Steps (1) and (2) were repeated to obtain k decision trees by k times of sample extraction and sample training.
4) Finally, the integrated learning theory was used to linearly combine the k decision trees, where each decision tree accounted for equal weights. When a sample is classified as input, the result of each decision tree decides the classification result by majority voting.
Fourteen variables were selected (referred to Liu et al., 2020a) to estimate building vintage based on the RF model, including 1) longitude, 2) latitude, 3) footprint area, 4) height, 5) volume, 6) footprint perimeter, 7) number of neighboring buildings within a 50 m buffer, 8) fractal dimension (Angel et al., 2010), 9) compactness index, 10) Tyson polygon area, 11) average building height within a 50 m buffer, 12) maximum building height within a 50 m buffer, 13) minimum building height within a 50 m buffer, 14) the aerial distance to the nearest building as the crow flies (Table 1).

TABLE 1. Potential variables to estimate building vintage based on the RF model.
We collected 26,435 in-situ values of building vintage for training (80% of data) and validation (20% of data) for the RF model, representing 6.3% of the total building stock in Shenzhen. The vintage histogram of training samples was shown in Figure 3A zoom-in map of the Longcheng Community (located in the Longgang district of Shenzhen) as an example of the building dataset was shown in Figure 3B. The area under the curve (AUC) and the 1:1 line between the predicted and in-situ data were used to evaluate the model performance and accuracy (Hanley and McNeil., 1982).
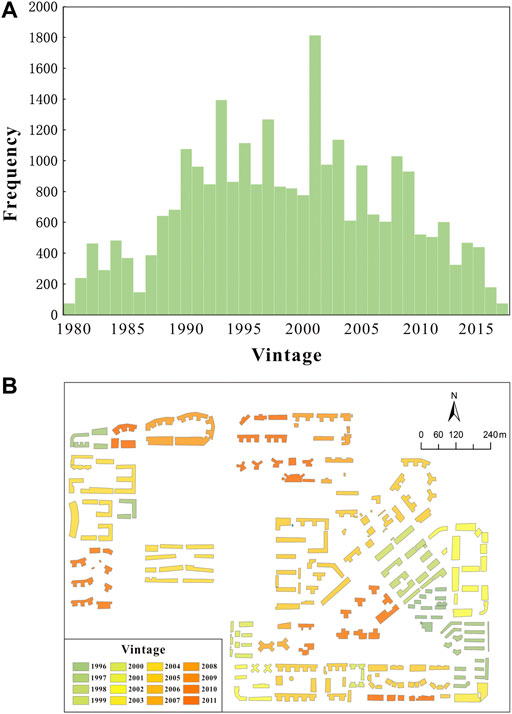
FIGURE 3. Samples and data distribution. (A) shows a vintage histogram for training samples in Shenzhen. (B) shows a few building footprints and vintage in the Longcheng community in Shenzhen as an example.
Total material stocks are estimated by multiplying the total floor area of the building by material intensity:
where MS represents the total stock of material m at year t, Q is the total floor area (footprint × level) of building i with structure s and vintage n, while MI, refers to the intensity of material m with structure s and vintage n (Table 2).
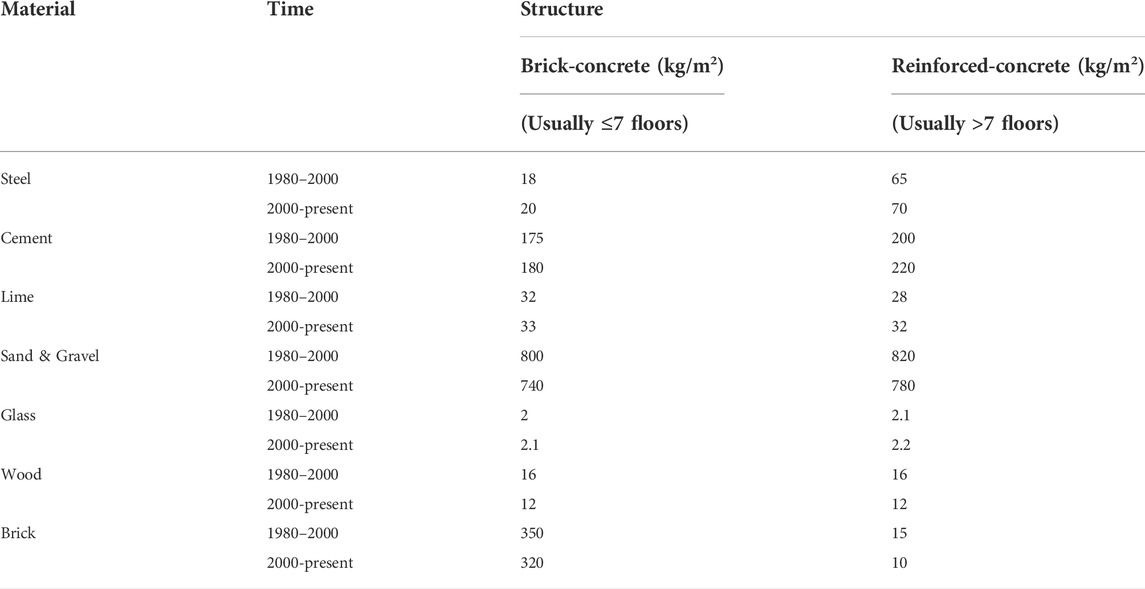
TABLE 2. Material intensity (MI) for building in Shenzhen, China.
The difference between material stocks in two time periods is equal to the difference between total input and output (netflow):
where MIF refers to the total input of material m from year t to t+1; MOF represents the total output of material m from year t to t+1. Material inputs and outputs are generated by complementary construction activities, including construction, demolition, renewal, and renovation. Thus, the total material input (or output) equals the sum of these sub-inputs (or sub-outputs):
where s1 and s2 represent construction activities, respectively.
Building construction requires material input and generates output, thus:
where MIFs1 refers to material input t for the construction of new buildings i, which are converted to material stocks (MS) in the next period t+1. Meantime, new building construction activity would generate construction waste (MOFs1) and its value is ∼50 kg/m2 (Hu et al., 2010; Chen et al., 2006; Wang et al., 2014). The demolition of in-use buildings (e.g., in order to increase green space or open space within a city) only generates output flow (MOFs1), which equals the material stock (MS) in the demolished building i.
The renewal and renovation of buildings generate both material input and output. Here, we estimate the magnitude of material output by a demolition rate (Tanikawa and Hashimoto, 2009; Reyna and Chester, 2014). We assume that buildings would use new types of components instead of broken ones, thus replacing materials at the end of life with new ones. Therefore:
where MSn represents the material stock of building i at the year of construction n, and Di,t is the demolition rate of building i at the year t. The values are related to the average lifespan (Mean) and standard deviation (SD) of building i. The average lifespan of building i is given by surveys (Yang and Kohler, 2008; Han and Xiang, 2013; Hu et al., 2010; Huang et al., 2017).
The AUC value of the vintage estimation reached 0.93 (Supplementary Figure S1), and the OOB error was stable at about 9.5% (Supplementary Figure S2B). Figure 4A shows the spatial pattern of the building vintage estimated by the model the comparison between the predicted and in-situ values of vintage in Figure 4B indicated that our model performed well. The average error of vintage for each building was ∼1.7 years and the uncertainty assessment showed that the error was smaller than 5 years for ∼92% of buildings (Supplementary Figure S2B).
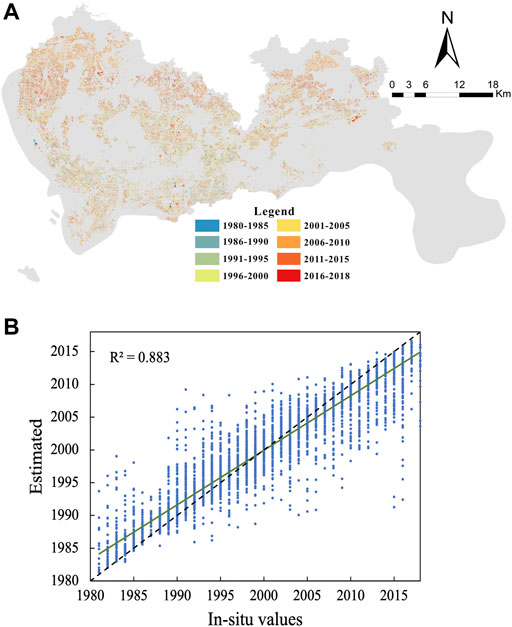
FIGURE 4. Comparison of predicted and in-situ values of vintage estimation. (A) shows the spatial pattern of building vintage in Shenzhen. (B) shows estimated and in-situ values of building vintage.
Based on the vintage information of buildings, we could retrieve the urban expansion in Shenzhen (Figure 5). From 1990 to 2018, the total (footprint) area of buildings in Shenzhen increased from 15.82 to 199.83 km2 with an average rate of 6.57 km2/a (Table 3). Specifically even before 1990, a few buildings (∼16 km2) were located in the southern region (Table 3), which was the origin of the Shenzhen Special Economic Zone (Figure 5). From 1990 to 2000, the total building area increased to ∼66 km2, which was four-fold increment of the value from 1990 (Table 3). Most of these new buildings were built in the Luohu District and Futian District, which led to the mergeing of building clusters and formed the downtown area of Shenzhen today (Figure 5). Meanwhile, many buildings expanded northward, which was shown as the “outlying” pattern (Figure 5). During 2000–2010, Shenzhen further doubled its total building area (Table 3) with both “spontaneous” and infilling expansions in the middle and eastern regions (Figure 5). Until 2018, the total building area reached ∼200 km2 (Table 3). In space, the “spontaneous” growth only occurred in the western districts (e.g., Baoan district), while other areas showed the infilling growth (Figure 5).
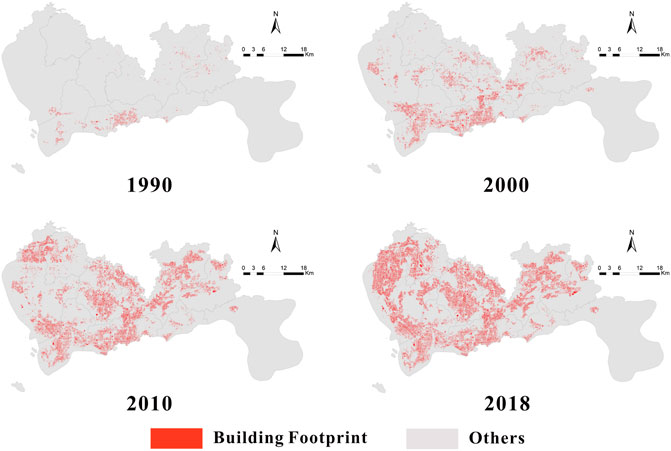
FIGURE 5. Building 2-D expansion in Shenzhen from 1990 to 2018.
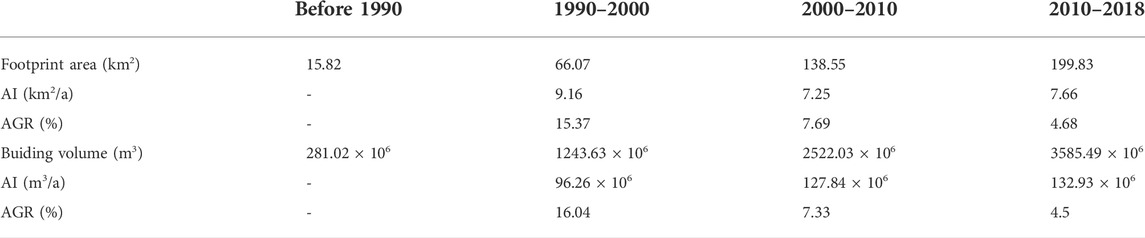
TABLE 3. Growth speed and morphological characteristics of Shenzhen during 1990–2018. AI, Annual increase; AGR, normalized annual growth rate (%).
From 1990 to 2018, the building volume in Shenzhen increased ten-fold, i.e., increased from 0.28 × 10⁹ to 3.58 × 10⁹ m3 (Table 3). In 1990, the downtown area of Shenzhen, including the Futian District and Luohu District, was dominated by low-rise buildings of 3–15 m in height (Figure 6). By 2000, many medium-height (∼40 m) buildings occurred in Shenzhen (Figure 6) leading to the average growth rate of building volume reaching 16.04% during 1990–2000 (Table 3). From 2000 to 2010, the building volume in Shenzhen continued to grow, but the growth rate decreased to ∼9.46% (Table 3). After 2010, the average building height in Shenzhen kept growing especially in the downtown area, including the Nanshan District, Futian District, and Luohu District (Figure 6). Meanwhile, urban renewal occurred in these areas and resulted in medium- and high-rise buildings instead of lower ones (Figure 6). In contrast, new buildings built in the Bao’an and Guangming districts were still mainly low-rise (Figure 6).
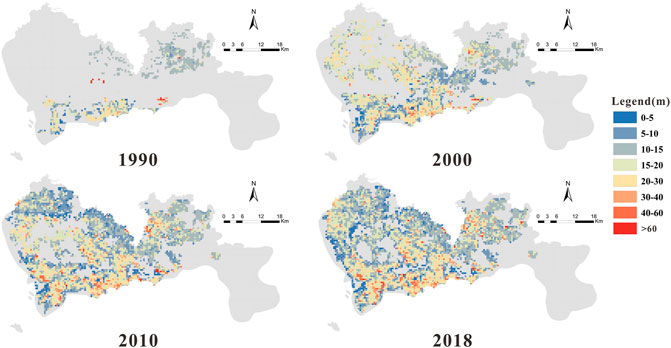
FIGURE 6. The average building height in Shenzhen from 1990 to 2018 (in 500 m × 500 m grids).
The total in-use stock of construction materials in Shenzhen exhibited a logistic growth and increased from 92.69 Mt in 1990 to 1667.9 Mt in 2018, with a steady growth rate of 9.5% per year (Figure 7A). During this period, material stocks experienced steady increment in the 1990s and reached ∼200 Mt at the beginning of the new century. After 2000, the in-use stock of construction materials increased rapidly and finally peaked at ∼1667 Mt during 2017–2018 (Figure 7A). Among them, there were ∼950 Mt of sand and gravel (∼57% of the total), bricks and cement were next with 392.77 Mt and 233.48 Mt, respectively 24 and 14%, whereas lime, steel, wood, and glass accounted for 5% of the total (Figure 7A). The per capita in-use stock of construction materials has shown a slow-growth trend and reached 128 t in 2018 from 55 t in 1990 (Figure 7B). The material input for building construction in Shenzhen showed a general growth tendency but with fluctuation (Figure 7C). Prior to before 2000, Shenzhen needed ∼370 Mt materials every year and this increased to ∼570 Mt after the beginning of century (Figure 7C). The material demands generated from new construction activities dominated input flows for most of the years, but the demands from renewal and renovation activities have increased rapidly since 2016 (Figure 7E). Material outputs kept growing since the 1990s and hit ∼170 Mt until 2018 (Figure 7D). Before 2000, most of the construction and demolition waste (CDW) was generated from the by-products of new construction activities (Figure 7F). After the beginning of century, urban renewal and building renovation generated more CDW and exceeded ∼50% of output flows, even hitting ∼98% in 2018 (Figure 7F).
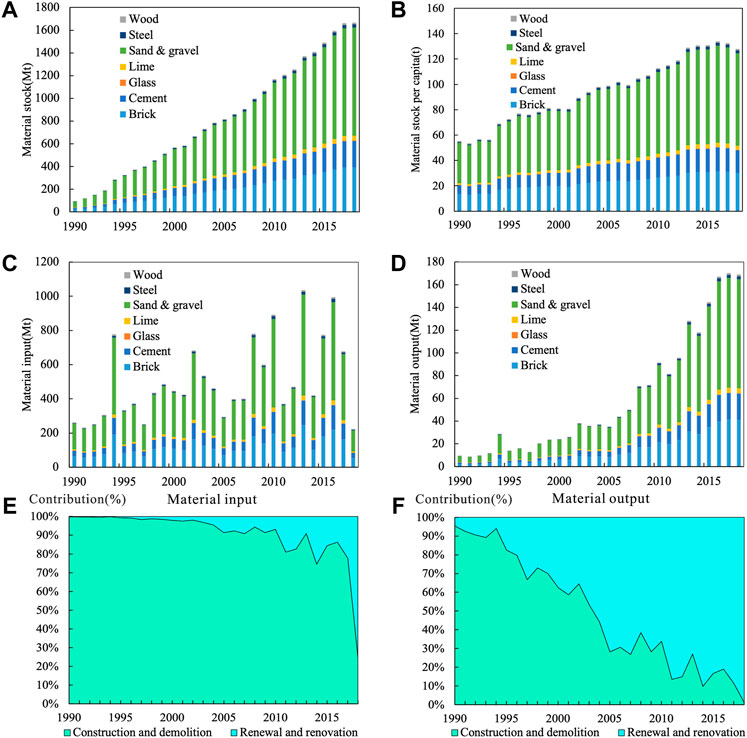
FIGURE 7. Material metabolism of buildings in Shenzhen, China (1990–2018). (A) shows the total material stock in Shenzhen from 1990 to 2018; (B) shows the material stock per capita in Shenzhen from 1990 to 2018; (C,D) show the material inflow and outflow in Shenzhen from 1990 to 2018, respectively; (E,F) offer the proportion of inflow and outflow generated from urban construction and renewal activities during 1990–2018, respectively.
In space, material stocks kept increasing in both extent and density in Shenzhen (Figure 8). The spatial hotpots of material inputs occurred in the downtown area (Futian district) in the 1990s, moved northward during 1990–2010 due to the rapid urbanization and industrialization, and returned back to the downtown area due to the urban renewal and renovation during 2010–2018 (Figure 8). The spatial hotspot of CDW generation (material output) occurred in the downtown area first and then expanded outward following the pace of urbanization (Figure 8).
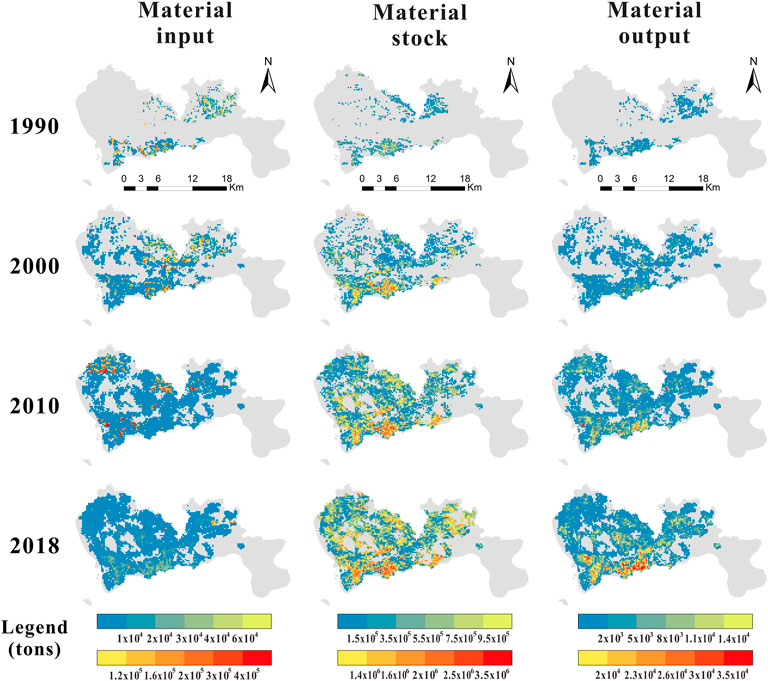
FIGURE 8. Spatial patterns of material metabolism in buildings of Shenzhen, China (1990–2018).
Many theoretical and empirical studies have demonstrated that the RF model has high prediction accuracy, good tolerance to outliers and noise, and is not prone to overfitting (Gromping, 2009). These advantages make random forests have been widely used in various classification, prediction, feature selection, and outlier detection problems (Heldt et al., 2021; Ostmann and Martinez Arbizu., 2018). In this study, we used the RF model to retrieve building vintage, which is a key factor in indicating the year of building construction and service time, by combining it with other key attributes of buildings, including geolocation, footprint, and height. Therefore, it is possible to characterize spatiotemporal patterns of urban building growth and related material metabolism. In our study, the geolocation of buildings played a key role andcontributed with ∼45% to the vintage estimation, which indicated that urban expansion in Shenzhen is characterized by significant directionality (Supplementary Figure S3). Figure 5 proved that the northward expansion of buildings occurred during 1990–2000, infilling expansions in the middle and eastern regions during 2000–2010 and “spontaneous” growth in the western regions during 2010–2018. Besides, the three-dimensional (3-D) form of buildings—the height/volume and shape information—is also important in estimating building vintage (Supplementary Figure S3). Before the new century, most of the buildings in Shenzhen were built with a brick-concrete structures and with less than 7 floors. After 2000, more reinforced-concrete-based and high-rise architectures were built with the development of construction technology (Ali and Moon., 2007), which led to an increase in the skyline (Figure 6) and “weight” of Shenzhen (Figure 7). Meanwhile, limited space in Shenzhen caused demands for land renewal and renovation, which has led to an increase in material input contribution from building renewal and renovation since 2005 (Figure 7).
Compared with past studies, this study innovatively added geometric and neighborhood characteristics of buildings in order to significantly improve the performance of the RF model on vintage estimation. In addition, it indicated that the importance of geographic characteristics, including topography, hydrology, and socio-economic conditions, to contribute and help form urban and building’s morphology. For example, coastal cities tend to develop first in coastal areas (as evidenced by Shenzhen in this study) and the inland cities crossed by rivers usually develop along their shorelines (e.g., Lanzhou, China), both of which indicate that geography and topology affect the directionality of urban expansion. Other important features are also important in predicting building vintage, as shown in many previous studies. For example, in Rotterdam and the Dutch Kadaster, the duration of construction activities played an important role in retrieving building vintage (Biljecki and Sindram., 2017). In Nottingham, United Kingdom, the average height of the roof had the highest contribution (Rosser et al., 2019). Various main urban construction and development drivers may cause these differences, indicating the importance of model parameterization, training, and validation locally. Besides, this study has shown an acceptable accuracy (test accuracy of 88%) on vintage prediction, which makes this data-driven approach an important complement to traditional data sources, like statistics and surveys.
The spatiotemporal dynamics of urban material metabolism were characterized in this study based on a GIS-based MFA method, which would help capture the dynamics of urban development and renewal and promote a refined strategy for urban renewal in Shenzhen. Shenzhen, China’s youngest megacity, is facing a conflict between rapid urbanization and limited available space (Qian et al., 2015). The government has proposed a series of policies to support urban refurbishment and renewal, especially for in-use buildings and spaces. The high-resolution building stocks and flows maps can support associated renewal planning and risk assessment. On the one hand, these maps can provide detailed information on in-use materials, which indicates the potential magnitude and spatial hotspots of CDW generation (Guo et al., 2019; Kleemann et al., 2017; Mastrucci et al., 2017). On the other hand, the building demolition in the urban renewal results in a shorter service time of buildings (∼25–30 years) compared to those in developed countries (Zhou et al., 2019). This makes CDW generation earlier (Gao et al., 2020; Reyna and Chestar., 2014) and amplifies associated environmental risks locally due to the low recycling rate of construction waste (∼5%) and illegal dumping or landfilling (NDRC 2014). From 2010 to 2017, ∼50 million tons of CDW were directly generated from urban renewal in Shenzhen (Yu et al., 2020). Dealing with these wastes with an environmental-friendly trajectory becomes a new challenge, and material reuse and recycling could be one of the alternatives. The high-resolution maps of in-use material stocks could provide a benchmark of potential amounts of reusing or recycling materials. Meanwhile, the spatial hotspots of CDW generation indicate key areas for planning local recycling facilities or logistic centers according to the trade-off between the cost of transportation and subsidy of treatment (Tong et al., 2018; Chen and Liu, 2021; Liu et al., 2022b). Therefore, both the spatial features of material stock and potential CDW generation could further help to design regional transportation and treatment facilities and optimize the waste management system for Shenzhen.
Uncertainties of the results in this study could also come from the geo-data. First, the training data of vintage estimation were collected based on the stratified sampling according to the year of buildings. Therefore, the spatial distribution of sampling could affect the performance of the RF model. Second, the footprint of buildings is often the outer surface of the roof retrieved based on remote sensing images rather than the exterior of the walls in reality (Augiseau and Barles., 2017), which leads to an overestimation of the building volume and related material stocks and flows. Meanwhile, the function and utility of buildings are not recognized in this study due to the data unavailability, although they could significantly help to better estimate vintage (different service-time of residential and commercial buildings) and material stocks and flows (distinct structure of residential and commercial buildings would change material intensity) (Haberl et al., 2021).
Forecasting the total amount of building volume and quantifying related material stocks and flows could be incorporated into this model in the next step. Previous studies have illustrated the relationship between the living space per capita and personal income (or GDP per capita) (Olaya et al., 2017), which would be of great help to forecast building volume in the future. Combining with the scenarios of land use/cover changes, especially for the built-up area, above predictions of building volume could be allocated in space and used to predict the birth and decay of buildings in a city (Chen and Liu, 2021). Characterization of the these dynamics of buildings and materials can provide insightful information that may better support and design effective policies for CDW management.
Quantifying spatiotemporal dynamics of buildings and related material metabolism is important to understand the environmental and socioeconomic consequences of urbanization. In this study, we retrieved building vintage and coupled it with a spatially explicit dataset of buildings in Shenzhen, China. The successful performance of the model allows us to further use this dataset to characterize urban material metabolism over time and across space. Detailed building form and vintage information could support the decision-making for urban renewal planning. The spatiotemporal patterns of in-use material stocks and potential CDW generation provide a benchmark of environmental risk assessment and potential secondary resources to reduce “original” material consumption, which could help alter urban renewal to an environmental-friendly and sustainable trajectory.
The raw data supporting the conclusion of this article will be made available by the authors, without undue reservation.
YL, TM, and W-QC conceived and designed the idea. TM and YL conducted the experiments and analyses. TM and YL wrote the article, and NL, ND, and YS contributed to the data collection.
This study was sponsored by the Strategic Pilot Science and Technology Projects of Chinese Academy of Sciences (XDA23030304 and XDA23030303), the International Partnership Program of the Chinese Academy of Sciences (132C35KYSB20200004 and 132C35KYSB20200007), the Fujian Foreign Cooperation Funding (2021I0042), and the National Natural Science Foundation of China (41801222), and the Youth Innovation Promotion Association of Chinese Academy of Sciences (2022307).
ND was employed by the company Beijing CityDNA Technology Company.
The remaining authors declare that the research was conducted in the absence of any commercial or financial relationships that could be construed as a potential conflict of interest.
All claims expressed in this article are solely those of the authors and do not necessarily represent those of their affiliated organizations, or those of the publisher, the editors and the reviewers. Any product that may be evaluated in this article, or claim that may be made by its manufacturer, is not guaranteed or endorsed by the publisher.
The Supplementary Material for this article can be found online at: https://www.frontiersin.org/articles/10.3389/feart.2022.944865/full#supplementary-material
Aksoezen, M., Daniel, M., Hassler, U., and Kohler, N. (2015). Building age as an indicator for energy consumption. Energy Build. 87, 74–86. doi:10.1016/j.enbuild.2014.10.074
Ali, M. M., and Moon, K. S. (2007). Structural developments in tall buildings: Current trends and future prospects. Archit. Sci. Rev. 50 (3), 205–223. doi:10.3763/asre.2007.5027
Angel, S., Parent, J., and Civco, D. L. (2010). Ten compactness properties of circles: Measuring shape in geography: Ten compactness properties of circles. Can. Geogr./Le Géogr. Can. 54 (4), 441–461. doi:10.1111/j.1541-0064.2009.00304.x
Augiseau, V., and Barles, S. (2017). Studying construction materials flows and stock: A review. Resour. Conservation Recycl. 123, 153–164. doi:10.1016/j.resconrec.2016.09.002
Biljecki, F., and Sindram, M. (2017). Estimating building age with 3d gis. ISPRS Ann. Photogramm. Remote Sens. Spat. Inf. Sci. IV-4/W5, 17–24. doi:10.5194/isprs-annals-IV-4-W5-17-2017
Cai, Y., Ding, Y., Zhang, H., Xiu, J., and Liu, Z. (2020). Geo-location algorithm for building targets in oblique remote sensing images based on deep learning and height estimation. Remote Sens. 12 (15), 2427. doi:10.3390/rs12152427
Chen, C., and Liu, Y. (2021). Construction and demolition wastes in Beijing: Where they come from and where they go? Waste Manag. Res. 39 (4), 555–560. doi:10.1177/0734242X20980819
Chen, J., He, P., Lv, F., and Shao, L. (2006). Generation and reutilization management of construction and demolition waste. Environ. Sanit. Eng. 14 (4), 27–33.
Cui, X., Wang, X., and Feng, Y. (2019). Examining urban metabolism: A material flow perspective on cities and their sustainability. J. Clean. Prod. 214, 767–781. doi:10.1016/j.jclepro.2019.01.021
Firozjaei Karimi, M, Sedighi, A, Kiavarz, Q, Haase, D, and Alavipanah, S. K (2019). Automated built-up extraction index: A new technique for mapping surface built-up areas using landsat 8 oli imagery. Remote Sens. 11 (17), 1966. doi:10.3390/rs11171966
Fu, C., Zhang, Y., and Yu, X. (2019). How has Beijing’s urban weight and composition changed with socioeconomic development? Sci. Total Environ. 675, 98–109. doi:10.1016/j.scitotenv.2019.04.205
Gao, X., Nakatani, J., Zhang, Q., Huang, B., Wang, T., and Moriguchi, Y. (2020). Dynamic material flow and stock analysis of residential buildings by integrating rural–urban land transition: A case of shanghai. J. Clean. Prod. 253, 119941. doi:10.1016/j.jclepro.2019.119941
Gromping, U. (2009). Variable importance assessment in regression: Linear regression versus random forest. Amer Statist. 63, 308–319
Gontia, P., Thuvander, L., and Wallbaum, H. (2020). Spatiotemporal characteristics of residential material stocks and flows in urban, commuter, and rural settlements. J. Clean. Prod. 251, 119435. doi:10.1016/j.jclepro.2019.119435
Guo, J., Miatto, A., Shi, F., and Tanikawa, H. (2019). Spatially explicit material stock analysis of buildings in Eastern China metropoles. Resour. Conservation Recycl. 146, 45–54. doi:10.1016/j.resconrec.2019.03.031
Haberl, H., Wiedenhofer, D., Schug, F., Frantz, D., Virág, D., Plutzar, C., et al. (2021). High-resolution maps of material stocks in buildings and infrastructures in Austria and Germany. Environ. Sci. Technol. 55 (5), 3368–3379. doi:10.1021/acs.est.0c05642
Han, J., and Xiang, W.-N. (2013). Analysis of material stock accumulation in China’s infrastructure and its regional disparity. Sustain. Sci. 8 (4), 553–564. doi:10.1007/s11625-012-0196-y
Hanley, J., and McNeil, B. (1982). The meaning and use of the area under a receiver operating characteristic (ROC) curve. Radiology 143, 29–36. doi:10.1148/radiology.143.1.7063747
Heldt, F. S., Vizcaychipi, M. P., Peacock, S., Cinelli, M., McLachlan, L., Andreotti, F, et al. (2021). Early risk assessment for COVID-19 patients from emergency department data using machine learning. Sci. Rep. 11 (1), 4200. doi:10.1038/s41598-021-83784-y
Huang, C., Han, J., and Chen, W.-Q. (2017). Changing patterns and determinants of infrastructures’ material stocks in Chinese cities. Resour. Conservation Recycl. 123, 47–53. doi:10.1016/j.resconrec.2016.06.014
Hu, D., You, F., Zhao, Y., Yuan, Y., Liu, T., and Cao, A. (201O). Input, stocks and output flows of urban residential building system in Beijing city, China from 1949 to 2008. Resour. Conservation Recycl. 54, 1177–1188. doi:10.1016/j.resconrec.2010.03.011
Huo, T., Cai, W., Ren, H., Feng, W., Zhu, M., and Lang, N. (2019). China’s building stock estimation and energy intensity analysis. J. Clean. Prod. 207, 801–813. doi:10.1016/j.jclepro.2018.10.060
Kleemann, F., Lehner, H., Szczypińska, A., Lederer, J., and Fellner, J. (2017). Using change detection data to assess amount and composition of demolition waste from buildings in Vienna. Resour. Conservation Recycl. 123, 37–46. doi:10.1016/j.resconrec.2016.06.010
Krausmann, F., Gingrich, S., Eisenmenger, N., Erb, K.-H., Haberl, H., Fischer-Kowalski, M., et al. (2009). Growth in global materials use, GDP and population during the 20th century. Ecol. Econ. 68 (10), 2696–2705. doi:10.1016/j.ecolecon.2009.05.007
Li, Z., Xin, Q., Sun, Y., and Cao, M. (2021). A deep learning-based framework for automated extraction of building footprint polygons from very high-resolution aerial imagery. Remote Sens. 13 (18), 3630. doi:10.3390/rs13183630
Liu, Y., Chen, C., Li, J., and Chen, W.-Q. (2020a). Characterizing three dimensional (3-D) morphology of residential buildings by landscape metrics. Landsc. Ecol. 35 (11), 2587–2599. doi:10.1007/s10980-020-01084-8
Liu, Y., Li, J., Chen, W., Song, L., and Dai, S. (2022a). Quantifying urban mass gain and loss by a GIS-based material stocks and flows analysis. J. Ind. Ecol. 26 (3), 1051–1060. doi:10.1111/jiec.13252
Liu, Y., Li, J., Duan, L., Dai, M., and Chen, W. (2020b). Material dependence of cities and implications for regional sustainability. Reg. Sustain. 1 (1), 31–36. doi:10.1016/j.regsus.2020.07.001
Liu, Y., Song, L., Wang, W., Jian, X., and Chen, W.-Q. (2022b). Developing a GIS-based model to quantify spatiotemporal pattern of home appliances and e-waste generation—a case study in xiamen, China. Waste Manag. 137, 150–157. doi:10.1016/j.wasman.2021.10.039
Mao, R., Bao, Y., Huang, Z., Liu, Q., and Liu, G. (2020). High-resolution mapping of the urban built environment stocks in beijing. Environ. Sci. Technol. 54 (9), 5345–5355. doi:10.1021/acs.est.9b07229
Marcellus-Zamora, K. A., Gallagher, P. M., Spatari, S., and Tanikawa, H. (2016). Estimating materials stocked by land-use type in historic urban buildings using spatio-temporal analytical tools. J. Industrial Ecol. 20 (5), 1025–1037. doi:10.1111/jiec.12327
Mastrucci, A., Marvuglia, A., Popovici, E., Leopold, U., and Benetto, E. (2017). Geospatial characterization of building material stocks for the life cycle assessment of end-of-life scenarios at the urban scale. Resour. Conservation Recycl. 123, 54–66. doi:10.1016/j.resconrec.2016.07.003
Müller, B. (2006). Stock dynamics for forecasting material flows—case study for housing in The Netherlands. Ecol. Econ. 59 (1), 142–156. doi:10.1016/j.ecolecon.2005.09.025
National Development and Reform Commission (NDRC) (2014). China integrated resource utilization annual report. China Economic & Trade Herald, 49–56. in Chinese.
Olaya, Y., Vásquez, F., and Müller, D. B. (2017). Dwelling stock dynamics for addressing housing deficit. Resour. Conservation Recycl. 123, 187–199. doi:10.1016/j.resconrec.2016.09.028
Ostmann, A., and Martínez Arbizu, P. (2018). Predictive models using randomForest regression for distribution patterns of meiofauna in Icelandic waters. Mar. Biodivers. 48 (2), 719–735. doi:10.1007/s12526-018-0882-9
Peled, Y., and Fishman, T. (2021). Estimation and mapping of the material stocks of buildings of europe: A novel nighttime lights-based approach. Resour. Conservation Recycl. 169, 105509. doi:10.1016/j.resconrec.2021.105509
Qian, J., Peng, Y., Luo, C., Wu, C., and Du, Q. (2015). Urban land expansion and sustainable land use policy in shenzhen: A case study of China’s rapid urbanization. Sustainability 8 (1), 16. doi:10.3390/su8010016
Reyna, J. L., and Chester, M. V. (2014). The growth of urban building stock: Unintended lock-in and embedded environmental effects. J. Industrial Ecol. 19 (4), 524–537. doi:10.1111/jiec.12211
Rosser, J. F., Boyd, D. S., Long, G., Zakhary, S., Mao, Y., and Robinson, D. (2019). Predicting residential building age from map data. Comput. Environ. Urban Syst. 73, 56–67. doi:10.1016/j.compenvurbsys.2018.08.004
Shenzhen Statistical Bureau (SSB) (2019). StatisticalYearbook of shenzhen. Shenzhen, China: China Statistics Press.
Sun, Y., Montazeri, S., Wang, Y., and Zhu, X. X. (2020). Automatic registration of a single SAR image and GIS building footprints in a large-scale urban area. ISPRS J. Photogrammetry Remote Sens. 170, 1–14. doi:10.1016/j.isprsjprs.2020.09.016
Tanikawa, H., Fishman, T., Okuoka, K., and Sugimoto, K. (2015). The weight of society over time and space: A comprehensive account of the construction material stock of Japan, 1945-2010: The construction material stock of Japan. J. Industrial Ecol. 19 (5), 778–791. doi:10.1111/jiec.12284
Tanikawa, H., and Hashimoto, S. (2009). Urban stock over time: Spatial material stock analysis using 4d-GIS. Build. Res. Inf. 37 (5–6), 483–502. doi:10.1080/09613210903169394
Tong, X., Wang, T., Chen, Y., and Wang, Y. (2018). Towards an inclusive circular economy: Quantifying the spatial flows of e-waste through the informal sector in China. Resour. Conservation Recycl. 135, 163–171. doi:10.1016/j.resconrec.2017.10.039
Tooke, T. R., Coops, N. C., and Webster, J. (2014). Predicting building ages from LiDAR data with random forests for building energy modeling. Energy Build. 68, 603–610. doi:10.1016/j.enbuild.2013.10.004
Wang, J., Wang, Y., Yi, Q., Luo, Y., Zeng, C., and Li, J. (2014). Analysis and suggestion for construction and demolition waste generation among life stages of construction engineering. J. Green Sci. Technol. (12), 132–136. in Chinese.
Yang, W., and Kohler, N. (2008). Simulation of the evolution of the Chinese building and infrastructure stock. Build. Res. Inf. 36 (1), 1–19. doi:10.1080/09613210701702883
Yousefiyan, F., Ebadi, H., and Sedaghat, A. (2019). Integrated local features to detect building locations in high-resolution satellite imagery. J. Indian Soc. Remote Sens. 47 (8), 1375–1389. doi:10.1007/s12524-019-01001-w
Yu, B., Wang, J., Li, J., Lu, W., Li, C. Z., and Xu, X. (2020). Quantifying the potential of recycling demolition waste generated from urban renewal: A case study in shenzhen, China. J. Clean. Prod. 247, 119127. doi:10.1016/j.jclepro.2019.119127
Zhou, W., Moncaster, A., Reiner, D. M., and Guthrie, P. (2019). Estimating lifetimes and stock turnover dynamics of urban residential buildings in China. Sustainability 11 (13), 3720. doi:10.3390/su11133720
Keywords: material flow analysis, geographic information systems, spatiotemporal analysis, random forest, building vintage, industrial ecology, high-resolution urban grids
Citation: Mao T, Liu Y, Chen W-Q, Li N, Dong N and Shi Y (2022) Quantifying spatiotemporal dynamics of urban building and material metabolism by combining a random forest model and GIS-based material flow analysis. Front. Earth Sci. 10:944865. doi: 10.3389/feart.2022.944865
Received: 16 May 2022; Accepted: 12 July 2022;
Published: 10 August 2022.
Edited by:
Qingxu Huang, Beijing Normal University, ChinaReviewed by:
Chong Jiang, Guangdong Provincial Academy of Chinese Medical Sciences, ChinaCopyright © 2022 Mao, Liu, Chen, Li, Dong and Shi. This is an open-access article distributed under the terms of the Creative Commons Attribution License (CC BY). The use, distribution or reproduction in other forums is permitted, provided the original author(s) and the copyright owner(s) are credited and that the original publication in this journal is cited, in accordance with accepted academic practice. No use, distribution or reproduction is permitted which does not comply with these terms.
*Correspondence: Yupeng Liu, eXBsaXVAaXVlLmFjLmNu
Disclaimer: All claims expressed in this article are solely those of the authors and do not necessarily represent those of their affiliated organizations, or those of the publisher, the editors and the reviewers. Any product that may be evaluated in this article or claim that may be made by its manufacturer is not guaranteed or endorsed by the publisher.
Research integrity at Frontiers
Learn more about the work of our research integrity team to safeguard the quality of each article we publish.