- 1State Key Laboratory of Hydraulics and Mountain River Engineering, Sichuan University, Chengdu, China
- 2College of Water Resources and Hydropower, Sichuan University, Chengdu, China
- 3China Energy Dadu River Hydropower Development Co., Ltd., Chengdu, China
The stability of reservoir bank slopes is critical to the engineering operation’s safety. Due to the complexity of geological conditions, the monitoring mode based on deformation monitoring data cannot directly respond to the structural damage stability state, whereas anther mode based on structural calculation is time-consuming and lacks real-time capabilities. To that end, this paper proposes a method for fast prediction of the safety state of reservoir bank rock slope based on the physical significance of time-dependent deformation and rock creep at monitoring points, with the safety coefficient and reliability obtained by numerical calculation as the dependent variables and the slope deformation monitoring sequence as the independent variable, based on full verification of the rationality of numerical calculation. The model can be used to forecast the stability and reliability coefficients of reservoir bank slopes online using deformation data from the field. The application verification of the left bank slope of the Dagangshan arch dam reveals that the average and maximum error of slope stability safety coefficient prediction is within 5% for 90 and 180 days and the average and maximum error of reliability index prediction is within 10%, which meet the engineering requirements and can provide a new way for rapid prediction of slope engineering safety.
Introduction
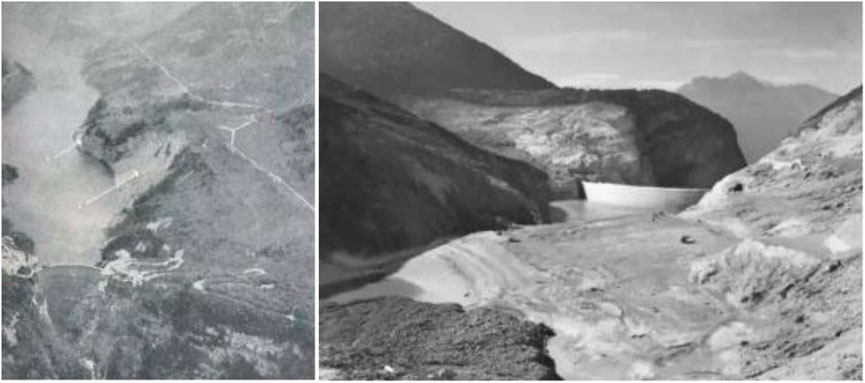
When hydraulic structures are built, high and steep artificial slopes, of which rock slopes are the most prominent, are frequently generated. The left bank slope of Jinping I Hydropower Station, for example, is as high as 530 m, with an average slope gradient of 55°, while the left bank slope of Dagangshan Hydropower Station is approximately 315 m, with an average slope gradient of 40°. The geological features of these slopes are complicated, and dam construction’s water level rise and frequent fluctuation have a significant impact on slope safety. Damage to the engineering slope causes damage to the dam structure and operation, endangering the safety of main buildings as well as the lives and property of downstream residents. The well-known Vajont dam fills the 1.8 km long reservoir section in front of the dam, with a landslide volume of 240 million cubic meters on the left bank slope, and the silting body is 150 m above the reservoir’s water surface, resulting in the reservoir’s abandonment (Figure 1). When the landslide occurs, the surge reaches 250 m and overtakes the dam’s crest, flattening the downstream town of galleons and five neighboring villages, killing 1925 people.
The stability of hydraulic slopes is critical for dam construction and operating safety. A fundamental difficulty in engineering construction and operation is the scientific evaluation of its stability and safety. Dam rock slope safety is mostly assessed using numerical analysis and monitoring data analysis, which are two ways.
The numerical analysis method studies the slope’s stability using the mechanical mechanism of the slope, and the most generally used methods are the limit equilibrium method, limit analysis method, numerical analysis method, and uncertainty analysis method.
The limit equilibrium approach, which is based on the Mohr–Coulomb shear strength criteria, is the oldest, most commonly used, and continually refined method in the field of slope stability analysis (Hoek and Bray, 1981; Sharma et al., 1995; Lin et al., 2009; Hossain, 2017). Shukla et al. (2009) proposed an analytical method for planar failure analysis by taking into account the weight of the sliding body, the hydraulic forces in tension fractures and along the potential damage surface, and the shear strength characteristics of the potential damage surface. Ahmadi and Eslami (2011) examined hydraulic forces and presented an analytical solution. Wu et al. (2019) suggested an enhanced Spencerian technique based on the classic strip partitioning method that takes into account the normal force distribution features between slices. Limit analysis approaches are often classified into two groups. The first is the elastoplastic analysis method, and the second is the plastic limit analysis method. The plastic limit analysis approach overlooks the intermediate phase of structural elastoplasticity and investigates the condition in which the structure achieves the load-bearing capacity limit (Huang, 2013; Zhang et al., 2018; Wang et al., 2019). In response to the limit equilibrium approach that does not meet either the static or kinematic permissibility criterion, Kim et al. constructed statically allowable stress fields for the lower-bound limit analysis and kinematically allowable velocity fields for the upper-bound limit analysis of the soil. Li and Wang (2007) presented a lower limit approach based on non-linear programming for finite element plastic limit analysis of rocky slopes. Zuo and Wang (2022) used a polycentric approach to extend the rotation mechanism of laminated slopes and suggested an upper limit solution technique for laminated slope stability analysis.
Duncan (1968) was the first to use the finite element approach to solve slope stability problems, ushering in a new age of finite element analysis for slope stability problems. Because the numerical analysis approach was still relatively new at the time, it grew quickly in geotechnical structural engineering and achieved considerable success. The numerical analysis method can solve a variety of problems, including simulating and calculating the entire process of slope excavation and support, the interaction between support measures like anchor rods and anchor cables and the geotechnical body, and the effect of rainfall seepage on slope stability (Lee et al., 2009; Xu et al., 2014; Cui et al., 2021; Tao et al., 2021; Li et al., 2022; Ma and Liu, 2022). The strength reduction approach is now the most generally used in slope stability analysis, and it is commonly used to determine the stability safety factor and solve slope instability slip crack surfaces (Cheng et al., 2007; Meng et al., 2019; He and Kusiak, 2017; Li et al., 2021a). By inventing the barometric material model and implementing it in the finite element system ABAQUS, Schneider-Muntau et al. (2017) enhanced the strength subtraction approach. Because the traditional strength discounting technique cannot be directly applied to geotechnical stability analysis involving non-linear damage criteria, Chen et al. (2018) proposed the concept of generalized strength discounting to solve geotechnical engineering problems involving non-linear failure models.
The reliability analysis approach can disclose more about the state of slope engineering and the uncertainty of factors like material specifications and loads (Li et al., 2011; Jiang et al., 2014; Li et al., 2015; Li et al., 2016; Li et al., 2021b; Song et al., 2021; Zhou et al., 2021). In recent years, geotechnical engineering has substantially enhanced the calculation, which takes into account the unpredictability of variables. It may be split into two parts based on distinct study contents: On the one hand, the reliability analysis technique of single failure mode key element reliability with the minimal safety factor or reliability index is investigated (Liu et al., 2015; Tan et al., 2016). The system reliability with instability uncertainty, on the other hand, may be seen as the slope’s overall dependability owing to the diversity of slope instability modes. Yang et al. (2020) investigated and evaluated the displacement, water content, pore water pressure, and failure time of the developed red clay slope, as well as analyzing slopes with various failure mechanisms. Lin et al. (2009) used the strength reduction method’s calculation results to directly determine the slope’s slip surface and analyze the factors affecting slope stability. Guei (2021) proposed the discontinuous dynamic strength reduction method (DDSRM), which is a new method for searching multi-level sliding surfaces. The microseismometer (MSM) and discrete element technique (PFC2D) were presented by Gao et al. (2022) to investigate the dynamic sliding process of soil–rock mixture (S-RM) landslides.
Furthermore, the assessment technique of monitoring data analysis is the most commonly used way of dam safety analysis. Li et al. (2014) developed a complete risk evaluation index system for the earth-rock dam building era and conducted a risk assessment of the earth-rock dam construction period. Based on long-term observed data, Zhang et al. (2022) evaluated the geographical and temporal features of dam top fractures and investigated the causes of dam cracking using deformation dip angle and strain index.
In summary, the numerical analysis method’s failure mechanism is evident; however, the modeling approach is difficult, the computation effort is huge, and real-time performance is not accessible. Due to diverse geological occurrence circumstances, defining index control levels by statistical analysis of monitoring data is challenging and subjectivity is high, weakening the application impact. The strength reduction approach is employed in this research to achieve the minimal stability control slip surface, and the structural safety factor sequence is computed based on the slope stability control slip surface stress. The Monte Carlo approach is used to solve the slope stability reliability sequence using the response surface equation of the slope stability function. The statistical regression model of the slope measurement point’s deformation measured value, slope stability safety factor, and stability reliability is then established. Finally, Dagangshan’s right bank slope is put to the test.
Methods
Overall Idea of Fast Prediction
The deformation monitoring data and trend of deformation monitoring locations are important. It is possible to develop the slope deformation monitoring sequence, stability safety factor statistics, and reliability regression equation based on the physical meaning of time-dependent deformation and rock creep at monitoring locations. The rock slope stability safety factor statistical regression model is built with the data sequence of deformation-measuring points on the key block of the slope as the independent variable and the slope stability safety factor or reliability as the dependent variable. Figure 2 depicts the technique procedure. The procedure is as follows:
1) The statistical regression model of the displacement of the monitoring point is created using the real project’s safety monitoring data. The model’s high-accuracy sequence is chosen as the analysis’ goal sequence, and the aging component of the monitoring point’s displacement is separated.
2) A three-dimensional finite element model is developed based on the real project.
3) The creep properties of slope excavation, support, and rock mass are examined using design parameters. Step 6 is performed if the error between the numerical simulation value and the measured value fulfills the engineering accuracy standards. If there is a significant difference between the numerical simulation value and the measured value, step 4 is performed.
4) The multi-factor sensitivity analysis technique is used to study the sensitivity of slope deformation–influencing parameters, and the findings of sensitivity analysis on slope deformation–influencing parameters are obtained.
5) The parameters having the greatest impact on slope deformation are chosen, and the inverse analysis technique based on time-dependent deformation is used to conduct the inverse analysis of sensitive parameters, yielding the ideal solution of inverse analysis parameters. The design parameters are replaced with the best solution of sensitive parameters, and step 3 is repeated.
6) The strength reduction approach is used to find the failure mode of the slope, key blocks, and stability control slip surface with the lowest possible safety factor.
7) The sensitive parameter optimization solution is used to analyze the slope excavation, support, and rock creep characteristics, and the stress sequence of the slope stability control sliding surface is obtained based on the results of the slope stability control section.
8) The stress algebra and ratio approach are used to generate the slope stability safety factor sequence.
9) The response surface equation of the slope stability function is established, and the slope stability reliability sequence is obtained using the Monte Carlo method.
10) The statistical regression model between the measured values of slope-measuring points and the safety factor and slope stability reliability is established, and the model’s accuracy is verified. The quick prediction of slope stability safety factor and stability reliability by deformation monitoring is done using a statistical regression model that fulfills the accuracy standards.
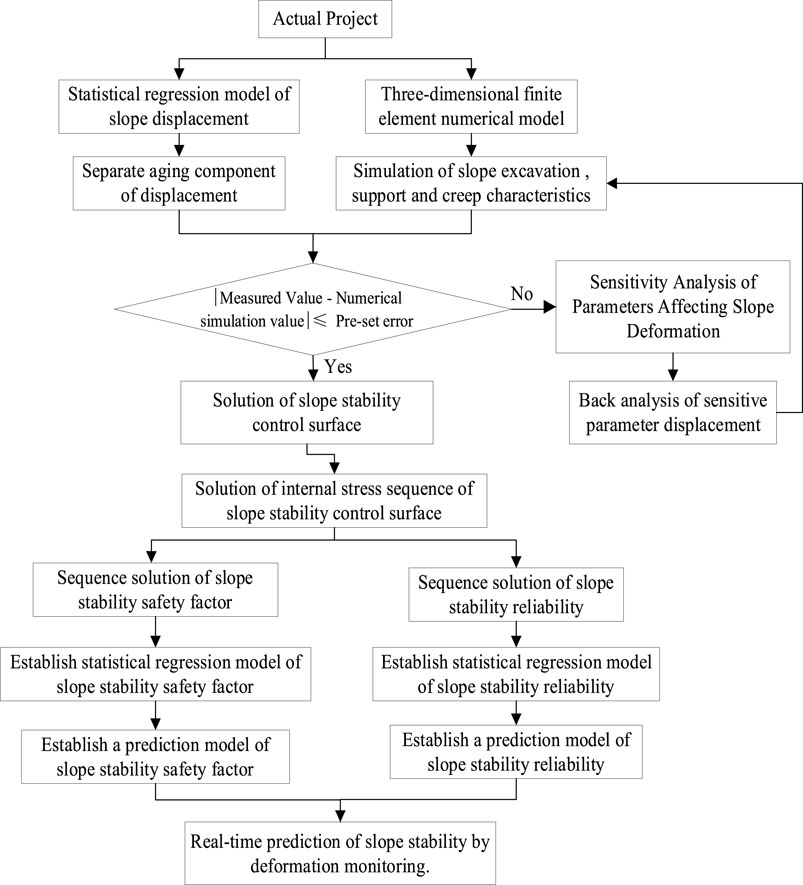
FIGURE 2. Flow chart of rock slope stability, safety, and reliability prediction method based on deformation monitoring.
Stability Safety and Reliability Prediction Model of Rock Slope
The data sequence and temperature of deformation-measuring sites on the key block of the slope are used as independent factors in the statistical regression model of rock slope stability safety factor, and the slope stability safety factor is used as the dependent variable:
where
where
Slope’s Finite Element Simulation Method
In the finite element analysis of a rock slope, the rock mass is often considered an elastic–plastic material. Before reaching the yield limit, it is termed an elastic body, and subsequently a plastic body. Its constitutive model is further subdivided into elastic and elastic–plastic constitutive models.
The constitutive relationship of rock material in the elastic state is
where
The constitutive relation of rock mass in the elastic state is as follows:
According to the plastic flow rule, the elastic–plastic matrix
where
The LUBBY2 rock creep model is derived from the non-linear Kelvin model, and it can simulate rock mass creep in the investigation of creep characteristics of slope rock mass. The following is the form:
where t is the time,
Here, m,
The numerical simulation of the control unit simulates the excavation. The rebar unit simulates the bolt and anchor cable, whereas the equivalent strain approach simulates the pre-stressed anchor cable in this project.
Strength Reduction Method
When the slope approaches the critical instability stage, the safety factor is defined as the rock shear strength reduction coefficient. The bigger the reduction coefficient, the better the degree of safety. In the calculation, the shear strength indexes c and tan
where
Slope Stability Reliability Analysis Method
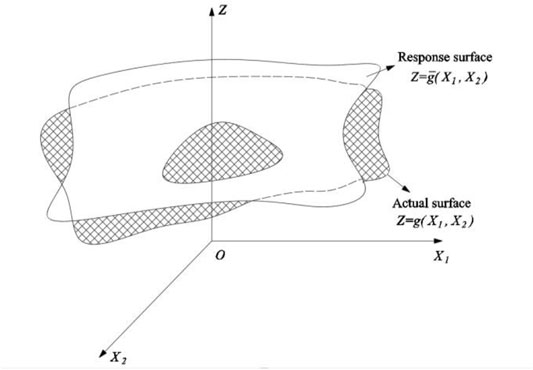
If the impact of a structure or system under action cannot be directly described in the experiment’s design and analysis, the response surface equation of the built effect can be utilized to solve it. For example, there are two variables
The response surface method can better deal with the response relationship between input and output in complex geotechnical engineering problems in the dam engineering field. So, the response surface analytical expression of the function can be obtained by finite calculation and test, and the real response surface can be approximated. For a complicated structure influenced by n random variables, the quadratic term that does not contain the cross between variables can be employed as follows:
where
The least square approach is typically used to fit and solve the indeterminate coefficients of the response surface problem. The rationality of the equation is determined by estimating whether the multiple correlation coefficient between the calculated value of the response surface equation and the experimental value is close to one or whether all of the points on the correlation diagram are concentrated near the surface constructed by the response surface equation. If the equation is easily visible, it means that the response surface can effectively respond to the complicated relationship between input and output. When the correlation coefficient is greater than or equal to 0.8, it is assumed that the accuracy meets the standards. The response surface equation can represent the real function, and thus, the actual function may be represented by the response surface equation. The slope stability reliability is solved using the Monte Carlo technique.
Overview of Left Bank Slope Engineering of Dagangshan Hydropower Station
Engineering Situations
The Dagangshan Hydropower Station is located in the Dadu River Basin’s middle reaches. The usual water storage level of reservoir is 1,130.00 m, whose corresponding storage capacity is 742 million m3. The power plant has a capacity of 2600 MW and an annual electricity production of 11.43 billion kWh, and the seismic design intensity is 9°.
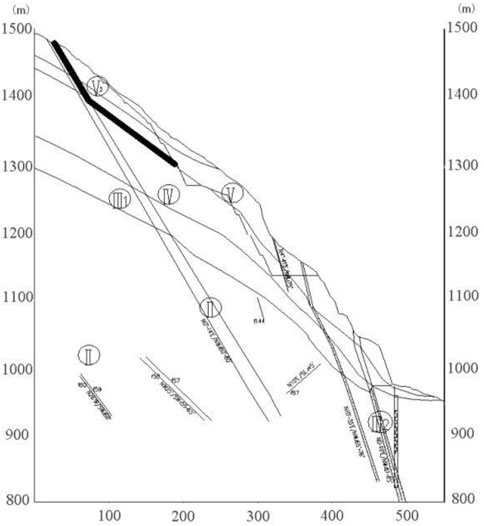
According to excavation, research, and testing, the left bank abutment slope is mostly composed of grayish-white and slightly red medium-grained biotite monzogranite, and there are diabase veins sprinkled throughout the rock mass. There are 84 dikes on the left bank slope and faults developed in the slope rock mass. In the slope rock mass on the left bank abutment, five sets of fractures were also formed. The horizontal and vertical zoning of weathering of rock mass on the left bank is visible. It has a law of gradual weakening with decreasing elevation, as well as a certain degree of heterogeneity influenced by geography, lithology, and structure. The slope’s totally weathered zone is normally dispersed above an elevation of 1,360 m, with a horizontal depth of 50–80 m. The strong weathering zone is mostly found at elevations of 1255–1360 m and horizontal depths of 70–100 m. Weakly weathered upper rock mass is primarily distributed between the cable crane platform and the dam crest slope at an elevation of 1255–1135 m, with a horizontal depth of 50–100 m. The lower part of the weak weathered rock mass is distributed at an elevation of 940–1135 m, with a horizontal depth of 60–100 m. According to the exploration flat cave, the unloading impact of rock mass operates mostly along the existing structural plane. Strong and weak unloading zones can be distinguished based on the degree of unloading development of the rock mass. On the left bank abutment slope, the depth of strong unloading is 30–100 m above the elevation of 1270 m, and the depth of weak unloading is larger than 150 m. The horizontal depth of strong unloading is 10–40 m below the elevation of 1270 m, and the horizontal depth of weak unloading is 40–100 m. The top slope has a high degree of weathering and unloading, mostly due to rock masses of class IV, class V, and class V2. The groundwater level line of slope is low, so the excavation and reinforcing of the slope above the dam crest cannot take into account the function of groundwater. Figure 4A reveals the geology of the left bank slope.
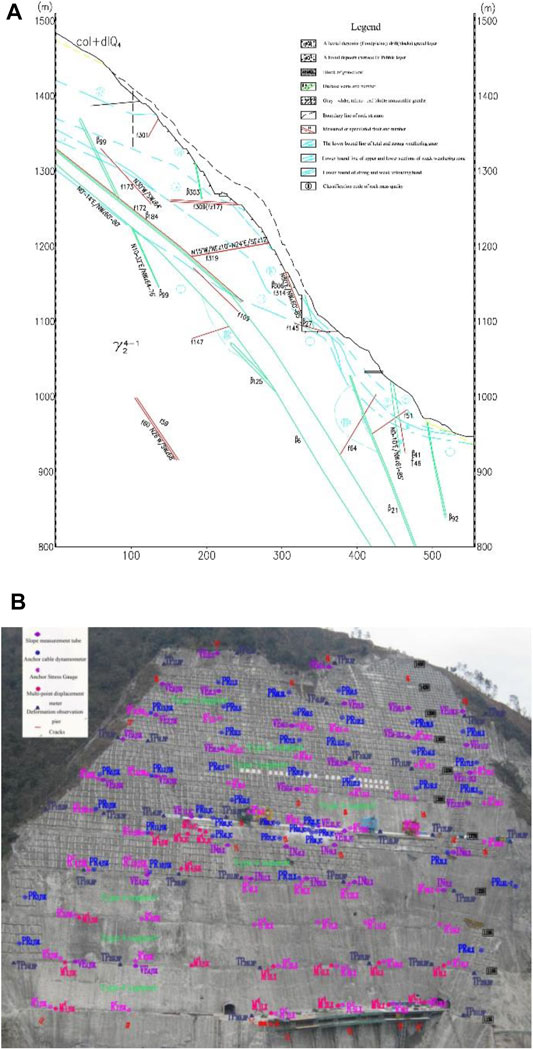
FIGURE 4. (A) Geological structure diagram of LPI section of the left bank slope. (B) Layout of excavation support and deformation monitoring for the left bank slope.
On the surface of the height of 1135 m on the left bank of Dagangshan Hydropower Station, 37 deformation observation piers are installed. The horizontal displacement identification and vertical displacement identification are set up on the same pier. On the excavation slope above the foundation of the cable machine platform, 18 measurement stations (TP1L–TP18L) are set. On the excavation slope below the cable machine platform’s height of 1270–970.00 m, 19 measurement stations (TP19L–TP37L) are positioned. These observation piers constitute four vertical monitoring sections. Figure 4B depicts the configuration of the monitoring locations.
Excavation Design
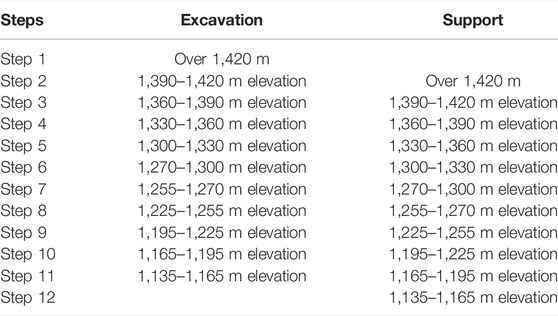
The excavation and reinforcing range of the slope is 1,135 m–1,492 m elevation above the dam crest. The left bank cable crane platform is located at a height of 1,270 m and has a width of approximately 16 m. The primary feed line height is the same as the dam crest elevation, 1,135 m, and the breadth is approximately 15 m. The dam crest to the cable crane platform slope is separated into four stages, from top to bottom 1255 m, 1225 m, 1195 m, and 1165 m, with a height difference of approximately 30 m between each stage. The slope track above the cable crane platform is separated into five stages, from top to bottom 1,420 m, 1,390 m, 1,360 m, 1,330 m, and 1,300 m. The slope above the dam crest has a maximum excavation height of approximately 315 m. Table 1 shows the planned excavation slope. Figure 5 depicts the typical geological profile and excavation arrangement of the project’s steep slope on the left bank.
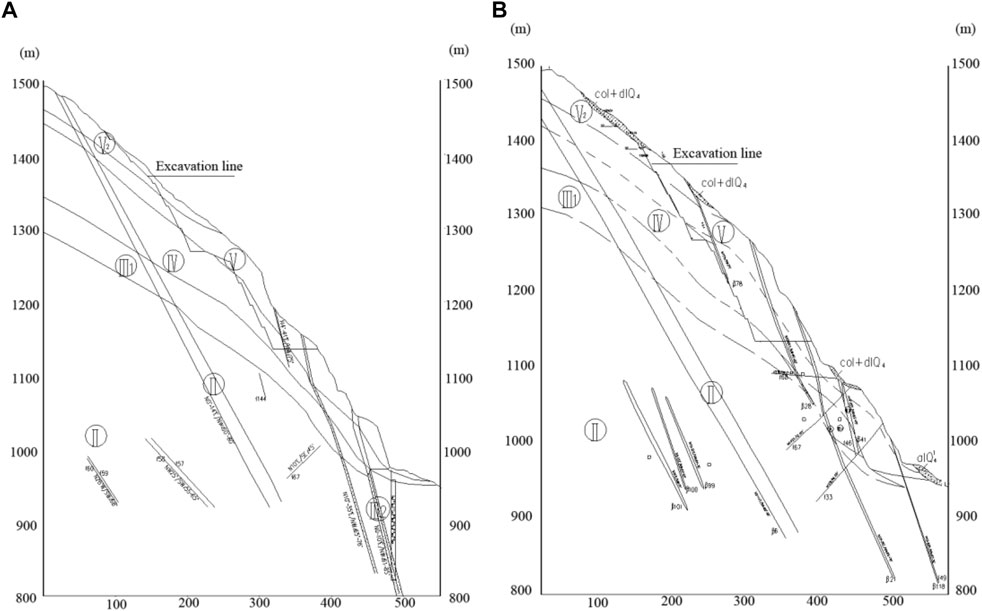
FIGURE 5. (A) Geological map of LPIII-III section of the left bank slope. (B) Geological map of LPVII-VII section of the left bank slope.
According to the current state of the project’s slope design and construction, the high slope on the left bank is split into 11 stages of excavation support. The simulation of excavation and support is accomplished by managing the unit’s life and death. Table 2 depicts excavation support operations.
The slope excavation began on 1 August 2007 and was finished at the end of April 2009, with a total construction length of 21 months. The first stage of slope excavation took 1 month, and the 2–11 stage excavation took approximately 2 months for each stage. From 20 July 2007 through 30 April 2014, the simulation ran.
Support Design
Table 3 shows the key supporting measures for slopes exceeding 1,135.00 m height on the left bank of Dagangshan Hydropower Station.
Finite Element Model and Material Parameters
Finite Element Modeling
According to the variables that govern the slope’s stability, such as rock border and rock veins, the elevation from 1,492 m to 800 m is taken as the vertical simulation range of 692 m, and the maximum horizontal simulation width is 550 m. There are 9,232 units and 246128 nodes in all, including 2088 excavation units. Figure 6A depicts the model before excavation, whereas Figure 6B depicts the model after excavation. The slope’s three-dimensional model is generated with a Cartesian coordinate system. The X-axis along the river is positive upstream, the Y-axis across the river is positive to the right bank, and the Z-axis along the lead is positive downhill.
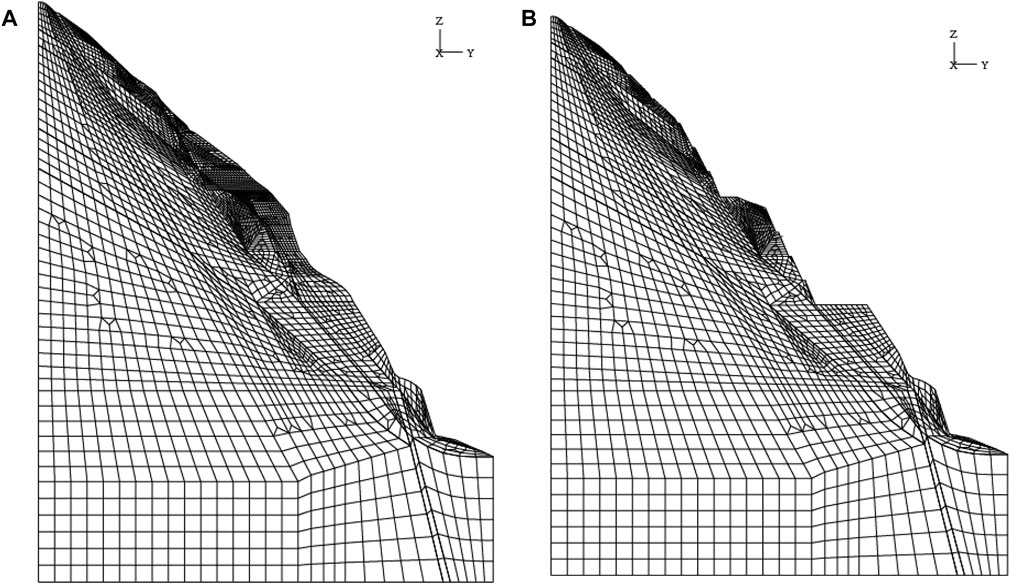
FIGURE 6. (A) Slope’s finite element model before excavation. (B) Slope’s finite element model after excavation.
Material Parameters
According to the engineering design results of the Dagangshan Hydropower Station and the values of the LUBBY2 creep model parameters in Thomas Nagel et al.’s investigation of the rock salt constitutive model, the initial settings of the creep parameters of the Dagangshan Hydropower Station’s left bank slope are chosen. Back analysis of parameters is used to find the optimal values of creep parameters of the Dagangshan Hydropower Station’s left bank slope based on deformation monitoring data. Table 4 shows the rock physical and mechanical slope engineering characteristics. Table 5 shows the creep parameters.
Slope Stability Control Sliding Surface Search
The strength reduction approach is utilized in this study to search for the unsupported controlled slip surface of the steep slope on the left bank of the Dagangshan Hydropower Station. The strength reduction iteration step is 0.05, and Figure 7 depicts the evolution of the slope plastic zone. The figure shows the following:
(1) When the reduction coefficient
(2) When the reduction coefficient
(3) The analysis of the slope plastic zone distribution map when the reduction coefficient
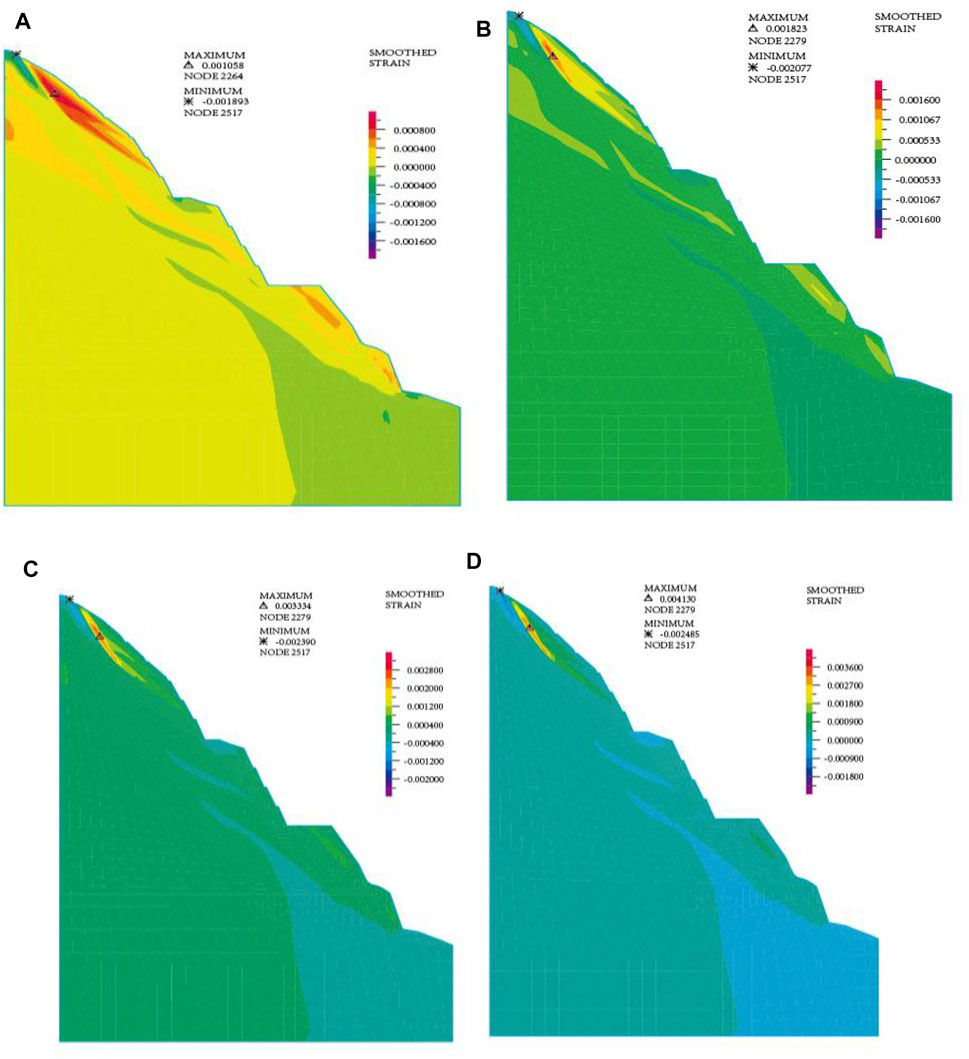
FIGURE 7. (A) Plastic zone diagram (
Construction of Prediction Model for Safety Coefficient of Left Bank Slope Stability of Dagangshan Hydropower Station
Analysis of Structural Calculation Results
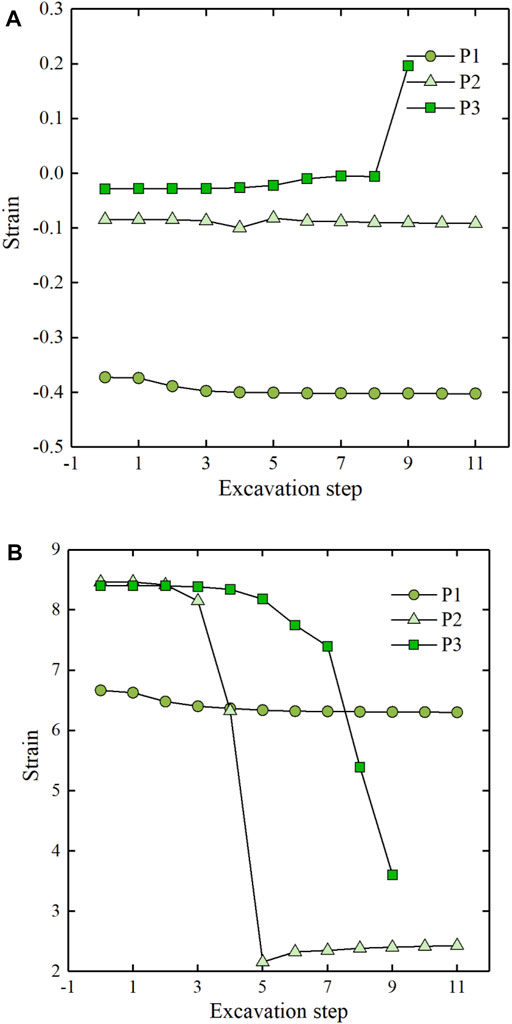
Figure 9 depicts the change in the plastic zone of slope excavation based on a numerical simulation of the left bank stability finite element from 20 July 2007 to 30 December 2014. Figure 8 depicts a schematic representation of the monitoring locations and their cross-river stress–strain path at altitudes of 1430 m, 1300 m, and 1195 m on the slope.
(1) The folded surface jointly composed of rock veins and class V rock body, class V2 rock body combined surface, class IV rock body, and class V rock body rock partition line, which is the stable control slip surface of the slope, is the potential control slip surface of the slope when the slope is not excavated. After the slope has been excavated, the lower slip channel is stopped, the higher slip body forms a new slip body, the weight of the slip body is lowered, and the slope’s safety status is enhanced.
(2) The strain and stress process line at point P1 in Figure 10 shows that the strain of P1 progressively lowers during excavation, while the compressive stress grows in the cross-river direction, which is favorable to the slope’s stability. The strain and stress process line at point P2 shows that, throughout the first four stages of excavation, the strain at the monitoring point reduces, while the compressive stress increases and the safety status improves. The excavation at step 5 causes the monitoring point to become a critical point where the compressive stress and strain decrease, and then point P2 shows a trend where the strain basically remains stable, while the compressive stress gradually increases, and the slope shows a development in the direction of stability. The strain and stress process line at point P3 indicates that the strain is clearly greater than the strain at point P1, and the analysis reveals that the safety status at point P3 is lower than that at point P1. The top half of the hill (over 1,300 height) has a greater safety level than the lower part. The upper part of the slope (above 1,300 elevation) has a higher safety state than the lower part, which provides a certain anti-slip force (tensile force) for the lower part of the slope, but after the excavation in step 5, the slip channel is blocked, the tensile force is broken, and the upper part’s safety state rises.
(3) In general, the finite element calculation results are compatible with the deformation and stability law of the bank slope, and the findings are plausible. It can serve as the foundation for predictive modeling.
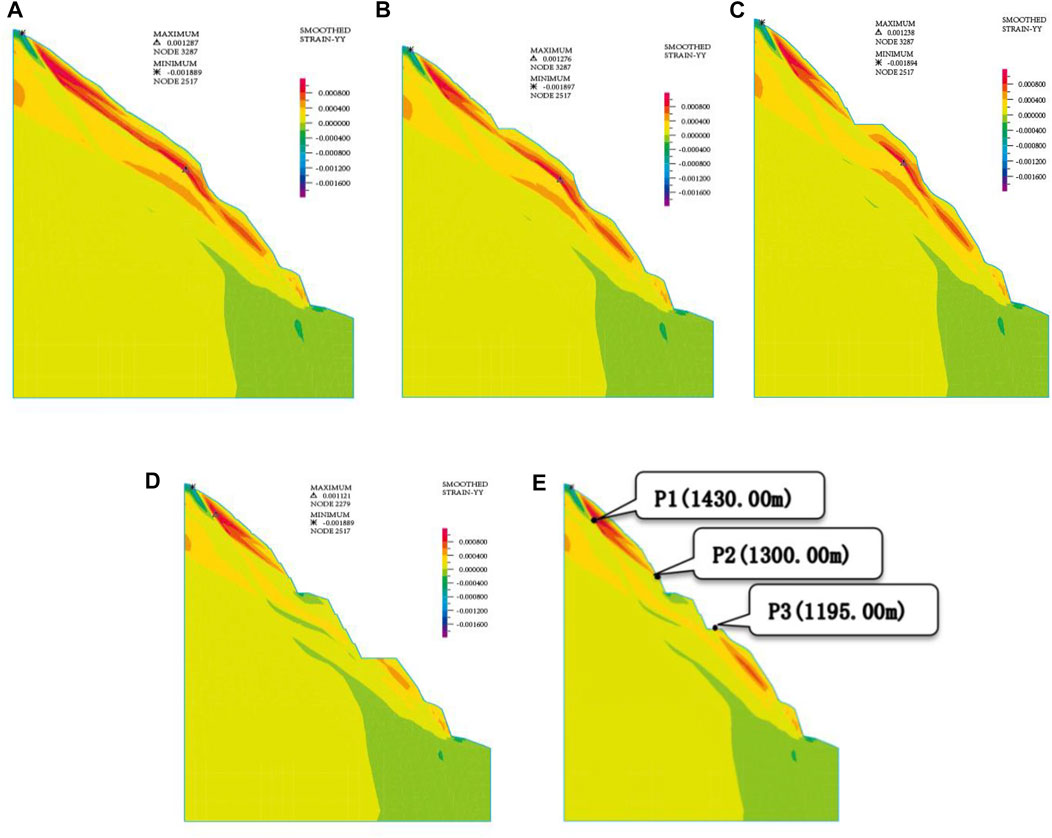
FIGURE 9. (A) Distribution of the plastic zone of natural slope. (B) Step 4 excavation plastic zone distribution. (C) Step 5 excavation plastic zone distribution. (D) Step 11 excavation plastic zone distribution. (E) Schematic diagram of feature points (after excavation in step 9).
Slope Stability Safety Coefficient Prediction Model Construction
The series of safety coefficients for slope stability is calculated using the technical press findings, as shown in Figure 11.
The model architecture of Eq. 16 is utilized to build the prediction model of the stability safety coefficient on the left bank slope of Dagangshan Hydropower Station based on the deformation measurement locations TP2L and TP9L on the slope control slip body:
where y1 is the horizontal displacement of TP2L measurement point, y2 is the vertical displacement of TP2L measurement point, y3 is the horizontal displacement of TP9L measurement point, and y4 is the vertical displacement of TP9L measurement point.
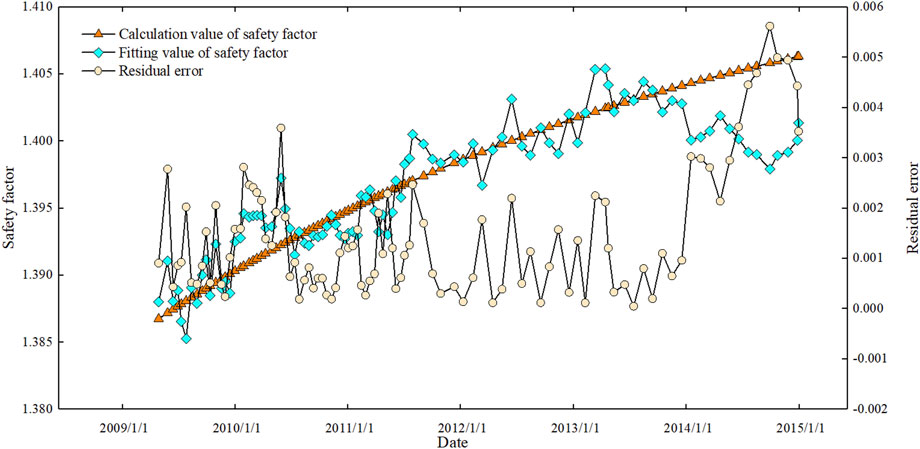
From the analysis of Figure 12 and Table 6, the following can be obtained:
1) As the excavation and support operation progresses, the safety coefficient improves faster. After excavation and support are completed, the safety coefficient hits 1.38 and then progressively increases at a rate of 0.001–0.005/year until it eventually stabilizes.
2) The complex correlation coefficient of the slope stability safety coefficient prediction model based on deformation monitoring is greater than 0.9, and the average error of safety coefficient calculation and fitted value is 0.12%, with a maximum error of 0.36%, indicating that the accuracy is high and the deformation curve can better fit the safety coefficient. The deformation curve is compatible with the changing law of the safety coefficient.
3) The average error and maximum error in the forecast of 90-day and 180-day slope stability safety coefficients are within 5%, and the total error is modest, which can fulfill the need of engineering prediction.
Dagangshan Hydropower Station Left Bank Slope Stability and Reliability Prediction Model Construction
Statistical Characteristics of Random Parameters
The estimation of statistical characteristic values of physical and mechanical characteristics of geotechnical bodies is frequently problematic in engineering structural reliability analysis. Because of the scarcity of statistical data on creep model parameters in the relevant literature, creep model parameters are treated as deterministic quantities in this research. Because the variance in rock bulk capacity and Poisson’s ratio is negligible, these parameters are likewise considered deterministic. Table 7 shows the eigenvalues of the rock elastic modulus E, cohesion C, and friction angle, which are considered random variables.
Construction of Functional Function of Slope Stability Response Surface
According to the results of the analysis of the aforementioned high slope control slip surface on the left bank of Dagangshan Hydropower Station, its stability control slip surface is a combination of the class IV rock body and class V rock body rock partition line, rock veins, and class V rock body and class V2 rock body, and its function Z is as follows:
where
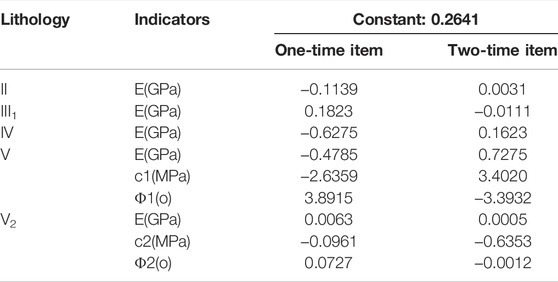
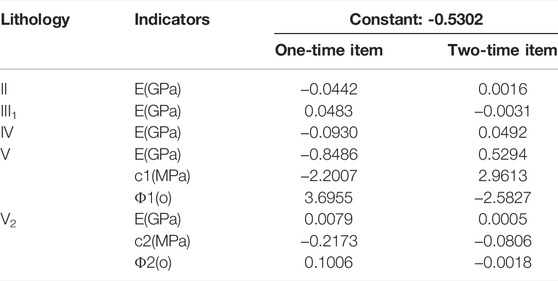
The response surface equation of the left bank slope control slip surface of Dagangshan Hydropower Station is constructed using a quadratic polynomial with no cross terms. The orthogonal test technique is utilized to derive the slope stability response surface equation coefficients at various moments, and the response surface equation coefficients at representative moments are provided in Tables 8, 9.
The complex correlation coefficients of response surface equations for slope stability at various times are more than 0.95, indicating that the response surface equations are significant.
Slope Stability and Reliability Prediction Model Construction
When the distribution type of random variables affecting slope stability is normal or log-normal distribution, the range of parameters in slope stability and reliability analysis can reach infinity; however, in practice, the physical and mechanical parameters of rock mass are not infinite, so the parameters in slope stability and reliability analysis must be truncated. The parameters have 99.7% guarantee rate when they are taken within the range of
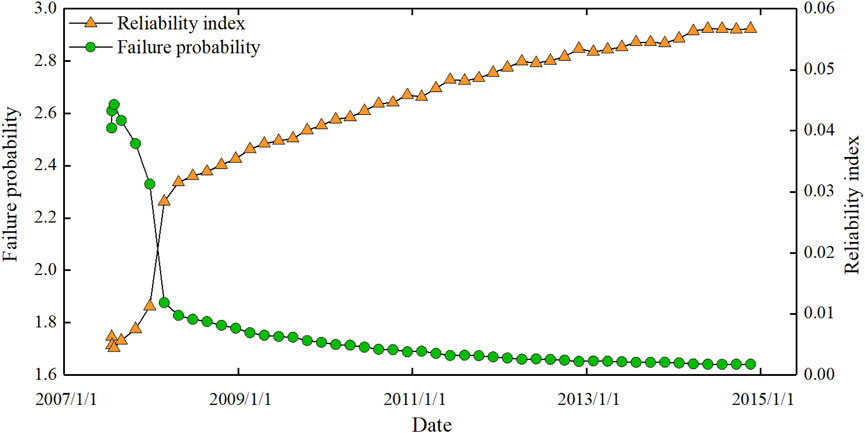
FIGURE 13. Stability and reliability indexes of the left bank slope and the probability of failure over time curve.
The model architecture of Eq. 18 is utilized to build the prediction model for the stability and reliability of the left bank slope of Dagangshan Hydropower Station based on the deformation measurement locations TP2L and TP9L on the slope control slip body:
The symbols in the formula have the same meaning as mentioned previously. Based on the examination of Figure 11 and Table 10, the following is concluded.
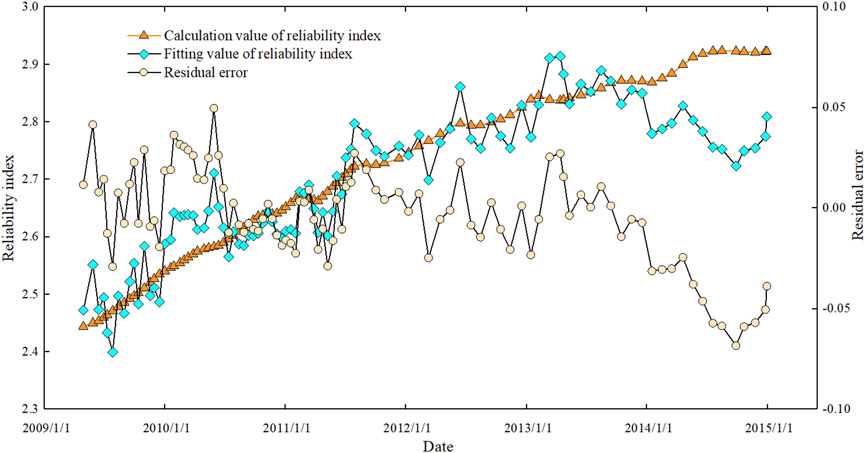
As shown in Figure 14, the slope stability reliability prediction model based on deformation monitoring has a complex correlation coefficient greater than 0.9, and the average error of calculated and fitted values of the reliability index is 1.94%, with a maximum error of 4.96%, indicating that the accuracy is high. The average error and maximum error in the prediction of the 90-day and 180-day slope stability reliability indexes are within 10%, indicating that reliability may be fitted by the actually observed deformation.
Conclusion
In this paper, a method for rapid prediction of reservoir bank rock slope safety is proposed, with the safety coefficient and reliability obtained by numerical calculation as dependent variables and the slope deformation monitoring sequence as the independent variable, to address the problem of rapid warning of dam slope structure. The verification of the left bank slope of Dagangshan Hydropower Station demonstrates the feasibility. The following are the primary conclusions:
1) The strength reduction approach is used to find the stability control slip surface of the Dagangshan Hydropower Station’s left bank slope. The slip surface is made up of the rock vein and the V type rock mass, the rock vein and the V2 type rock mass, and the border between the IV and V rock masses. The broken line surface is seen first as the plastic zone of penetration, and the safety and wealth are the lowest, indicating that the slope’s stability control slip surface is the smallest. Slope excavation reduces the major primary stress while increasing the minor principal compressive stress, and the impact on deformation diminishes progressively as the depth increases. Following excavation and support, the safety factor reached 1.38 and then continuously climbed at a rate of 0.00–0.005/year until it eventually stabilized. The value of the support process steadily grows, and the dependability index reaches 2.4 following excavation and eventually tends to be steady. The slope’s numerical computation structure is too close to engineering practice. The dependability index is the same as the stability safety factor, and the general law is reasonable, so it may be used to evaluate slope stability.
2) To design the dam safety status fast prediction technique, the dependent variables are the safety factor and reliability achieved by numerical computation, and the independent variable is the slope deformation monitoring sequence. The numerical calculation yields the independent variable sequence of safety factor and reliability, and the regression is constructed by taking into account the physical meaning of aging deformation and rock creep at monitoring locations.
Data Availability Statement
The original contributions presented in the study are included in the article/supplementary material, and further inquiries can be directed to the corresponding author.
Author Contributions
ZH: Conceptualization, methodology, investigation, formal analysis, and writing the original draft. CJ: Conceptualization, funding acquisition, resources, supervision, and reviewing and editing the paper. KQ: Data curation and writing the original draft. PL: Validation. HH: Resources and supervision.
Conflict of Interest
The author HH was employed by China Energy Dadu River Hydropower Development Co. Ltd.
The remaining authors declare that the research was conducted in the absence of any commercial or financial relationships that could be construed as a potential conflict of interest.
Publisher’s Note
All claims expressed in this article are solely those of the authors and do not necessarily represent those of their affiliated organizations, or those of the publisher, the editors, and the reviewers. Any product that may be evaluated in this article, or claim that may be made by its manufacturer, is not guaranteed or endorsed by the publisher.
Acknowledgments
The data in this article was provided by China Energy Dadu River Hydropower Development Co., Ltd. The writers appreciate China Energy Dadu River Hydropower Development Co., Ltd’s assistance and appreciate the editors’ and commentators’ insightful criticism.
References
Ahmadi, M., and Eslami, M. (2011). A New Approach to Plane Failure of Rock Slope Stability Based on Water Flow Velocity in Discontinuities for the Latian Dam Reservoir Landslide. Mt. Sci. 8 (002), 124–130. doi:10.1007/s11629-011-2088-5
Chen, X., Ren, J., Wang, D., Lyu, Y., and Zhang, H. (2018). A Generalized Strength Reduction Concept and its Applications to Geotechnical Stability Analysis. Geotech. Geol. Eng. 37 (4), 2409–2424. doi:10.1007/s10706-018-00765-1
Cheng, Y. M., Lansivara, T., and Wei, W. B. (2007). Two-dimensional Slope Stability Analysis by Limit Equilibrium and Strength Reduction Methods[J]. Comput. Geotechnics 34 (3), 137–150. doi:10.1016/j.compgeo.2006.10.011
Cui, S., Pei, X., Jiang, Y., Wang, G., Fan, X., Yang, Q., et al. (2021). Liquefaction within a Bedding Fault: Understanding the Initiation and Movement of the Daguangbao Landslide Triggered by the 2008 Wenchuan EarthquakeMs = 8.0). Eng. Geol. 295, 106455. doi:10.1016/j.enggeo.2021.106455
Gao, W., Yang, H., and Hu, R. (2022). Soil–rock Mixture Slope Stability Analysis by Microtremor Survey and Discrete Element Method. Bull. Eng. Geol. Environ. 81, 121. doi:10.1007/s10064-022-02622-1
Guei, J. Z. (2021). Searching for Multistage Sliding Surfaces Based on the Discontinuous Dynamic Strengtoqing Chen, Hong Li, Tao Wh Reduction Method. Eng. Geol. 286, 106086. doi:10.1016/j.enggeo.2021.106086
He, Y., and Kusiak, A. (2017). Performance Assessment of Wind Turbines: Data-Derived Quantitative Metrics[J]. IEEE Trans. Sustain. Energy 9 (1), 65–73. doi:10.1109/TSTE.2017.2715061
Hoek, E., and Bray, J,W. (1981). Rock Slope Engineering. Third Edition. London: Institute of Mining and Metallurgy.
Hossain, M. (2017). Stability Analysis of Anchored Rock Slopes against Plane Failure Subjected to Surcharge and Seismic Loads (Australia: Edith Cowan University). Available at: https://ro.ecu.edu.au/theses/139
Huang, C.-C. (2013). Developing a New Slice Method for Slope Displacement Analyses. Eng. Geol. 157 (8), 39–47. doi:10.1016/j.enggeo.2013.01.018
Jiang, S.-H., Li, D.-Q., Zhang, L.-M., and Zhou, C.-B. (2014). Slope Reliability Analysis Considering Spatially Variable Shear Strength Parameters Using a Non-intrusive Stochastic Finite Element Method. Eng. Geol. 168, 120–128. doi:10.1016/j.enggeo.2013.11.006
Kim, J., Salgado, R., and Lee, J. (2002). Stability Analysis of Complex Soil Slopes Using Limit Analysis. J. Geotech. Geoenviron. Eng. 128 (7), 546–557. doi:10.1061/(asce)1090-0241(2002)128:7(546)
Lee, L. M., Gofar, N., and Rahardjo, H. (2009). A Simple Model for Preliminary Evaluation of Rainfall-Induced Slope Instability[J]. Eng. Geol. Amst. 108 (3-4), 272–285. doi:10.1016/j.enggeo.2009.06.011
Li, D.-Q., Jiang, S.-H., Cao, Z.-J., Zhou, W., Zhou, C.-B., and Zhang, L.-M. (2015). A Multiple Response-Surface Method for Slope Reliability Analysis Considering Spatial Variability of Soil Properties. Eng. Geol. 187, 60–72. doi:10.1016/j.enggeo.2014.12.003
Li, D.-Q., Zheng, D., Cao, Z.-J., Tang, X.-S., and Phoon, K.-K. (2016). Response Surface Methods for Slope Reliability Analysis: Review and Comparison. Eng. Geol. 203, 3–14. doi:10.1016/j.enggeo.2015.09.003
Li, D., Chen, Y., Lu, W., and Zhou, C. (2011). Stochastic Response Surface Method for Reliability Analysis of Rock Slopes Involving Correlated Non-normal Variables. Comput. Geotechnics 38 (1), 58–68. doi:10.1016/j.compgeo.2010.10.006
Li, H., Deng, J., Feng, P., Pu, C., Arachchige, D. A. K., and Cheng, Q. (2021a). Short-Term Nacelle Orientation Forecasting Using Bilinear Transformation and ICEEMDAN Framework[J]. Front. Energy Res. 9, 780928. doi:10.3389/fenrg.2021.780928
Li, H., Deng, J., Yuan, S., Feng, P., and Arachchige, D. A. K. (2021b). Monitoring and Identifying Wind Turbine Generator Bearing Faults Using Deep Belief Network and EWMA Control Charts[J]. Front. Energy Res. 9, 799039. doi:10.3389/fenrg.2021.799039
Li, H., He, Y., Xu, Q., Deng, J., Li, W., and Wei, Y. (2022). Detection and Segmentation of Loess Landslides via Satellite Images: a Two-phase Framework. Landslides 19, 673–686. doi:10.1007/s10346-021-01789-0
Li, Z., and Wang, J. (2007). Lower Bound Limit Study on Plastic Limit Analysis of Rock Slope Using Finite Elements Based on Nonlinear Programming[J]. J. Rock Mech. Eng. 26 (4), 747–753. doi:10.3321/j.issn:1000-6915.2007.04.013
Li, Z., Ge, W., Wang, J., and Guo, W. (2014). Application of Improved Sudden Change Evaluation Method in Risk Evaluation of Earth and Rock Dam Construction Period[J]. J. Water Resour. 45 (10), 1256–1260. doi:10.13243/j.cnki.slxb.2014.10.015
Lin, H., Cao, P., Gong, F., Li, J., and Gui, Y. (2009). Directly Searching Method for Slip Plane and its Influential Factors Based on Critical State of Slope[J]. Cent. South Univ. Technol. 16, 131–135. doi:10.1007/s11771-009-0022-6
Lin, H., Zhong, W., Xiong, W., Tang, W., et al. (2014). Slope Stability Analysis Using Limit Equilibrium Method in Nonlinear Criterion [J]. (New York: scientific world journal), 206062. doi:10.1155/2014/206062
Liu, Z., Tang, Z., Wang, W., Sun, J., and Peng, K. (2015). New Algorithm of Mine Slope Reliability Based on Limiting State Hyper-Plane and its Engineering Application[J]. J. Central South Univ. 22 (01), 317–322. doi:10.1007/s11771-015-2524-8
Ma, K., and Liu, G. (2022). Three-Dimensional Discontinuous Deformation Analysis of Failure Mechanisms and Movement Characteristics of Slope Rockfalls. Rock Mech. Rock Eng. 55, 275–296. doi:10.1007/s00603-021-02656-z
Meng, Q., Wang, H., Xu, W., Cai, M., Xu, J., and Zhang, Q. (2019). Multiscale Strength Reduction Method for Heterogeneous Slope using Hierarchical FEM/DEM Modeling [J]. Comput. Geotech. 115 (2019). doi:10.1016/j.compgeo.2019.103164
Schneider-Muntau, B., Medicus, G., and Fellin, W. (2017). Strength Reduction Method in Barodesy[J]. Comput. Geotechnics 95 (3), 57–67. doi:10.1016/j.compgeo.2017.09.010
Sharma, S., Raghuvanshi, T. K., and Anbalagan, R. (1995). Plane Failure Analysis of Rock Slopes. Geotech. Geol. Eng. 13 (2), 105–111. doi:10.1007/bf00421876
Shukla, S. K., Khandelwal, S., Verma, V. N., and Sivakugan, N. (2009). Effect of Surcharge on the Stability of Anchored Rock Slope with Water Filled Tension Crack under Seismic Loading Condition. Geotech. Geol. Eng. 27 (4), 529–538. doi:10.1007/s10706-009-9254-3
Song, L., Yu, X., Xu, B., Pang, R., and Zhang, Z. (2021). 3D Slope Reliability Analysis Based on the Intelligent Response Surface Methodology. Bull. Eng. Geol. Environ. 80, 735–749. doi:10.1007/s10064-020-01940-6
Tan, X., Wang, X., Hu, Xj, Shen, M., and Hu, N. (2016). Two Methods for Predicting Reliability Index and Critical Probabilistic Slip Surface of Soil Slopes. Geotech. Geol. Eng. 34, 1283–1292. doi:10.1007/s10706-016-0041-7
Tao, Z., Wang, Y., Li, M., Wang, Y., Han, W., and Yang, X. (2021). Numerical Simulation Analysis of Mechanical Properties and Application of Large Deformation Cable with Constant Resistance. Geotechnical Geol. Eng. 39 (4), 81–93. doi:10.1007/s10706-020-01422-2
Wang, X., Lin, X., Li, X., Sun, P., and Ling, Y. (2019). 3D Slope Stability Analysis Method Based on Pan's Maximum Principle[J]. Landslides 17 (1), 1163–1176. doi:10.1007/s10346-019-01303-7
Wu, S., Han, L., Cheng, Z., Zhang, X., and Cheng, H. (2019). Study on the Limit Equilibrium Slice Method Considering Characteristics of Inter-slice Normal Forces Distribution: the Improved Spencer Method[J]. Environ. Geol. 78 (20), 611.1–611.18. doi:10.1007/s12665-019-8621-5
Xu, T., Xu, Q., Deng, M., Ma, T., Yang, T., and Tang, C.-a. (2014). A Numerical Analysis of Rock Creep-Induced Slide: a Case Study from Jiweishan Mountain, China. Environ. Earth Sci. 72 (6), 2111–2128. doi:10.1007/s12665-014-3119-7
Yang, L., Kaisheng, C., Mengfei, L., and Yingchang, W. (2020). Study on Failure of Red Clay Slopes with Different Gradients under Dry and Wet Cycles[J]. Bull. Eng. Geol. Environ. 79, 4609–4624. doi:10.1007/s10064-020-01827-6
Zhang, H. T., Luo, X. Q., Shen, H., and Bi, J. (2018). Vector-sum-based Slip Surface Stress Method for Analysing Slip Mass Stability[J]. Rock Soil Mech. 39 (5), 1691–1697. doi:10.16285/j.rsm.2016.1218
Zhang, H., Jing, Y., Chen, J., Gao, Z., and Xu, Y. (2022). Characteristics and Causes of Crest Cracking on a High Core-Wall Rockfill Dam: A Case Study[J]. Eng. Geol. 297, 106488. doi:10.1016/j.enggeo.2021.106488
Zhou, J., Wei, J., YangSeepage, T., Zhang, P., Liu, F., and Chen, J. (2021). Channel Development in the Crown Pillar: Insights from Induced Microseismicity[J]. Int. J. Rock Mech. Min. Sci. 145, 104851. doi:10.1016/j.ijrmms.2021.104851
Keywords: reservoir bank slope, deformation monitoring, reliability, slope warning, online judging
Citation: Han Z, JianKang C, Jian KQ, Liang P and Huibao H (2022) A Fast Prediction Method for Stability Safety and Reliability of Reservoir Bank Rock Slopes Based on Deformation Monitoring Data. Front. Earth Sci. 10:944299. doi: 10.3389/feart.2022.944299
Received: 15 May 2022; Accepted: 06 June 2022;
Published: 14 July 2022.
Edited by:
Yusen He, Grinnell College, United StatesCopyright © 2022 Han, JianKang, Jian, Liang and Huibao. This is an open-access article distributed under the terms of the Creative Commons Attribution License (CC BY). The use, distribution or reproduction in other forums is permitted, provided the original author(s) and the copyright owner(s) are credited and that the original publication in this journal is cited, in accordance with accepted academic practice. No use, distribution or reproduction is permitted which does not comply with these terms.
*Correspondence: Chen JianKang, c2N1LWppYW5rYW5nQHNjdS5lZHUuY24=
 Zhang Han
 Chen JianKang1,2*