 Wangting Ye
 Yu Li
Yu Li Zhuowen Feng
- Key Laboratory of Western China’s Environmental Systems (Ministry of Education), College of Earth and Environmental Sciences, Center for Hydrologic Cycle and Water Resources in Arid Region, Lanzhou University, Lanzhou, China
Global paleomonsoon precipitation evolution is confined to asynchronous responses to global monsoons to shared forcings, including summer insolation, sea surface temperature, atmospheric circulation coupling, and ocean circulation. However, most studies are based on conclusions drawn from single or a few discrete records or deduced from top-down climate models, which limits our ability to understand the latitudinal effect of monsoon precipitation. In particular, precipitation is a locally constrained climate factor. Here, we present a comprehensive assessment of global monsoon precipitation over the last 12,000 cal year BP based on modern observations, paleoclimate simulations, paleoclimate records, and monsoon precipitation reconstructions over the past 12,000 cal year BP based on a bottom-up algorithm called climate field reconstruction approaches. The results show that the middle latitude monsoon precipitation is in line with the evolution of the insolation and significant long-term decreasing (increasing) trends in low latitude monsoon precipitation have not occurred over the last 12,000 years BP. For modern monsoon evolution, the monsoon precipitation also changes along the meridional direction, with overall decreasing precipitation in the global monsoon region and increasing precipitation in the monsoon margin area. Monsoon systems at different latitudes all record eight Holocene weak precipitation events, including the Younger Dryas (12,900 cal year BP to 11,700 cal year BP), which can be considered a strong effect caused by a significant reduction or collapse of a meridional ocean circulation system, namely, the Atlantic Meridional Overturning Circulation. Moreover, the low- and middle-latitude monsoon precipitation lags by approximately 2,000 years behind the onset of North Atlantic warming. Taken together, our findings provide important insights into the latitudinal effect of monsoon precipitation at different locations.
1 Introduction
The Asian monsoon is an essential component of the global atmospheric circulation, and its importance has received widespread attention, as the precipitation brought by the monsoon affects the productive life of most of the world’s population (Wang, 2009; An et al., 2015). At present, there are six monsoon regions in the world: the North American monsoon, South American monsoon, North African monsoon, South African monsoon, Asian monsoon, and Australian-Indonesian monsoon. These regions have similar and distinct characteristics as well as complex interactions (Adegbie et al., 2003; Fleitmann et al., 2003; Wang et al., 2005; Griffiths et al., 2009). The global monsoon system is influenced by orbital factors as well as meridional climate systems, such as ocean circulation and atmospheric circulation. Thus, the underlying mechanism is complex. Therefore, understanding the monsoon precipitation evolution history in a meridional direction will improve our knowledge of the global monsoon system and provide crucial information for predicting future precipitation in global monsoon regions.
Global monsoon trends became apparent with the proliferation of high-resolution climate records from the Holocene in recent years. Stalagmite δ18O values from Dongge Cave and Qunf Cave suggest that Northern Hemisphere insolation controls low latitude monsoon precipitation (Fleitmann et al., 2003; Wang et al., 2005), and similar records indicate a gradual weakening of the Northern Hemisphere summer monsoon since 8,000 cal year BP. The changes in summer insolation due to the precession cycles have opposite trends in the Northern and Southern Hemispheres. Hence, the monsoon in the Southern Hemisphere should be weaker in the early to middle Holocene and stronger in the late Holocene. Lake Titicaca (approximately 16° to 17.50°S, 68.5° to 70°W) is the driest region until 8,000 cal year BP to 5,500 cal year BP, became wetter until 5,000 cal year BP and developed a high lake surface until 3,000 cal year BP (Paul et al., 2001), thus reflecting the intensification of summer winds in South America during the late Holocene compared with that in the Northern Hemisphere.
High-resolution oxygen isotopes (Fleitmann et al., 2003; Wang et al., 2005; Griffiths et al., 2009), model-simulated experiments (Li et al., 2018), lake records (Li and Xu, 2016), and pollen data (Li et al., 2018) reveal that variations in global monsoon precipitation correspond to local summer insolation at orbital timescales, and all monsoon subsystems have a consistent evolutionary history. However, Maher and Hu (2006) evaluated the relationship between the Indian/African monsoon and the East Asian monsoon based on a quantitatively reconstructed precipitation record from a high-resolution eolian/soil sequence in the southeast monsoon region, and they identified asynchronous evolution between the two, and this asynchronous evolution is widely present in monsoon systems. All of the above show the common variability of orbit-driven monsoon changes since the Holocene with hemispheric coherence, although they also show the difference in the background of the meridional ocean-land–air circulation driving monsoons in different locations, such as the Atlantic Meridional Overturning Circulation (AMOC) (Griffiths et al., 2009) and Intertropical Convergence Zone (ITCZ) (Wang, 2009).
In Australia and South America, which are both in the Southern Hemisphere, the monsoon in South America showed a strengthening trend in the Holocene, as described above, although the monsoon in Australia did not show a weak trend in the early Holocene but rather showed a strong trend in the late Holocene, and the reason for the difference is the ocean. Simulations show that the positive feedback caused by Sea Surface Temperature (SST) makes the Australian–Indonesian monsoon weak in the early Holocene (Liu et al., 2003). Studies based on records have shown similar processes. Griffiths et al. (2009) analyzed the relationship between Australian-Indonesian monsoon rainfall and the AMOC in the Holocene and found that the monsoon precipitation intensified rapidly from 11,000 cal year BP to 7,000 cal year BP when the AMOC was relatively weak. The meridional ocean system and sea surface temperature occasionally amplify the insolation signal, thus strengthening the feedback of monsoonal precipitation to insolation (Giannini et al., 2003; Clement et al., 2004). For example, because of the high water temperatures in the Atlantic Ocean off the African coast, atmospheric convection from land moves offshore, thereby reducing monsoon rainfall (Giannini et al., 2003). Lake Chad, which covered an area of 34 km2 at approximately 7,000 cal year BP ago, has shrunk to only 6,000 km2 (Zeng, 2003). The complexity of monsoon evolution lies in the fact that the signal from the high latitude meridional climate system is not reflected in the precipitation signal of each monsoon system in real time. The Younger Dryas, at 8.2 ka, has been recorded in East Asian (Wang et al., 2005) and West African monsoons (Adegbie et al., 2003; Weldeab et al., 2007) and can be compared with the Greenland ice core. However, since the signal at high latitudes needs to be transmitted to the monsoon signal according to the respective land–sea layout, the feedback from different monsoon systems to the high latitude meridional climate does not occur in real time. According to Weldeab et al. (2007), in the Gulf of Guinea off the equatorial West African coast, the surface seawater temperature increases on the millennial scale with radiative forcing during the ice-out period, while the intensification of the African monsoon lags behind the seawater temperature by 7,000 cal year BP. This result is consistent with previous studies showing that Zhuye Lake reached the maximum lake level during the early-mid-Holocene transition (Li and Xu, 2016). Pollen, foraminifera, and alkenone palaeothermometry from DG9603 (Okinawa Trough, East China Sea) also shows that terrestrial deglacial warming lagged behind marine warming from approximately 3,000 cal year BP to 4,000 cal year BP, which is consistent with cave carbonate δ18Ο (‰) values in southern China (Dongge Cave; Dykoski et al., 2005; Xu et al., 2013). All the abovementioned monsoon evolution types in both hemispheres meet the requirements of classical models and mechanisms of precession cycles. That is, an antiphase relationship occurs between the two hemispheres, with Holocene aridification in the low latitudes of the Northern Hemisphere and increasingly wet conditions in the low latitudes of the Southern Hemisphere. However, growing evidence has shown the limitations of this hypothesis. Stable nitrogen isotope data from rock hyrax (Procavia capensis) middens in northwestern Namibia (20°27.83′S, 14°26.54′E) indicate hemispheric synchrony in tropical climate change during the Holocene, which is similar to the trends in the Northern Hemisphere (Chase et al., 2010). Three absolutely dated oxygen isotope records from stalagmites in northern Borneo (4°N, 114°E) show that the tropical Pacific hydrological cycle is sensitive to high latitude climatic processes in both hemispheres as well as external radiative forcing (Partin et al., 2007). These findings run counter to the assumption that the model requires an anti-phase relationship between the hemispheres. Changes in ocean circulation, atmospheric circulation, and sea surface temperature in the tropical Pacific zone are considered important for understanding the mechanism of global paleomonsoon precipitation, but no detailed studies have evaluated these influences from a latitudinal effect perspective. Therefore, the mechanisms underlying the global monsoon precipitation response to meridional climate systems at different latitudes are poorly understood.
To emphasize the latitudinal effect in submonsoon system precipitation during the last 12,000 cal year BP, instead of taking the traditional approach of dividing the global monsoon region into six parts, we reconstructed global monsoon precipitation at intervals of 10 latitudinal degrees in this paper. We apply a synthesis climate field reconstruction (CFR) method to quantitatively reconstruct the precipitation changes in monsoon regions at different latitudes over the past 12,000 cal year BP. This paper is organized as follows. In Section 2, we introduce the multimodel modern precipitation datasets for calculating modern monsoon precipitation change rates and then the unified monsoon index to calculate the monsoon regions and then present the criteria for selecting paleoclimatic indicators and paleoclimatic climate models and the climate field reconstruction method. In Section 3, we present the precipitation change rates of modern monsoon regions, the leading statistical indicators of the reconstructed monsoon precipitation’s significance, and the reconstructed precipitation results. In Section 4, we discuss the precipitation trends of monsoons at different latitudes on the millennium scale and their links to ocean circulation and associated change rates in recent decades.
2 Data and methods
2.1 Modern precipitation datasets and modern monsoon regions
2.1.1 Modern precipitation dataset
Accurate modern precipitation data are an important guarantee for reconstructing past precipitation. The modern precipitation dataset used in the study underwent a comprehensive process of dataset collection, which included median calculations of all existing global-scale modern precipitation monthly datasets (Table 1). The dataset includes the commonly used Climate Research Unit (CRU) precipitation dataset, which covers the world from 1900 to 2016, and the V4.01 dataset, which covers the time period from 1900 to 2015. The CRU high-resolution grid dataset, which is integrated with several well-known databases, is one of the most widely used near-ground climate datasets in the world. It was developed by the University of East Anglia in the United Kingdom, and it includes a set of time range slots reconstructed from 1901 to 2015, with a spatial resolution of 0.5 × 0.5°. The UDEL grid dataset is integrated with several common database station observation datasets and employs the DEM-assisted interpolation method, traditional interpolation method, and climate-assisted interpolation method to establish a grid dataset with a resolution of 0.5 × 0.5 × 13. Previous studies have shown that China’s precipitation trends are not well represented in the dataset, and as a critical monsoon region, China’s precipitation trend is an essential condition that must be determined for reconstructing past precipitation (Li et al., 2018). The key reason for the inaccuracy of precipitation trends in China is that there are too few weather stations; thus, to be able to represent China’s modern precipitation trend, we chose the Chinese monthly surface temperature and precipitation gridded dataset with corrections for precipitation trends. The dataset includes monthly data from 1961 to the latest national stations (including basic, baseline, and general stations) collected and collated by the National Meteorological Information Center (Data access: http://data.cma.cn/data/cdcdetail/dataCode/SURF_CLI_CHN_PRE_DAY_GRID_0.5.html). Other datasets were downloaded from https://gis.ncdc.noaa.gov/maps/ncei/summaries/monthly.
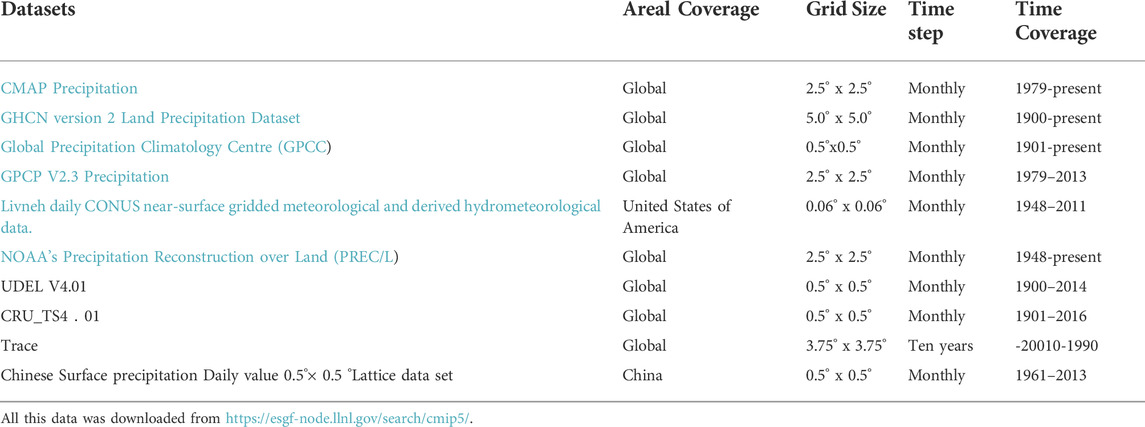
TABLE 1. Datasets are selected to analyze precipitation over the last century.
To explore the precipitation pattern of global monsoon regions at different latitudes, we selected nine climate models to show the climate mechanism of past climates (Table 2).
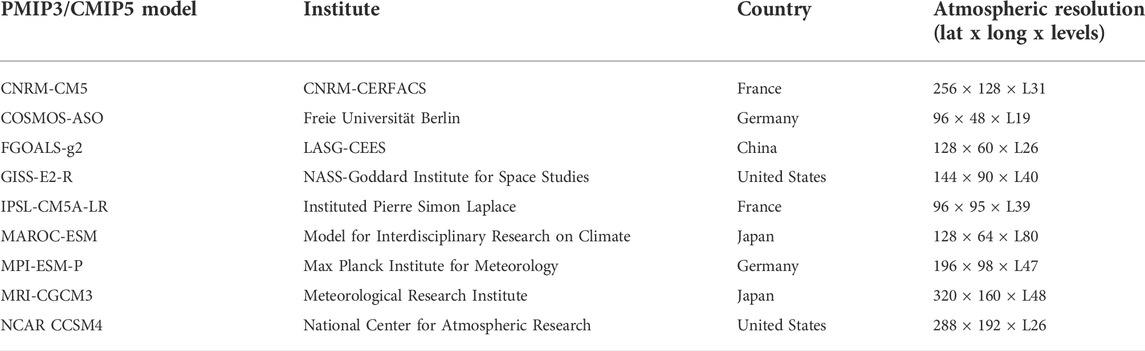
TABLE 2. Models are selected to explore past precipitation mechanism.
2.1.2 Unified monsoon index
The monsoon precipitation has strong seasonal variations; therefore, the global monsoon region can be reasonably defined by using seasonal variations in precipitation. This paper uses Wang’s method to calculate the monsoon index and monsoon area based on the global monsoon area and global monsoon precipitation index defined by monsoon precipitation (Wang and Ding, 2008; Wang et al., 2012). According to its definition, the global monsoon year is from May 1 to April 30 of the following year. The monsoon region is the area where summer precipitation is less than 2 mm/day and winter precipitation is greater than 55% of the annual precipitation. In addition, the summer in the Northern Hemisphere is from May to September while the summer in the Southern Hemisphere is from November to March of the next year (Wang, 2009; Wang et al., 2012). The daily average summer precipitation in the monsoon region is the monsoon index of the region.
2.2 Holocene climate records and reconstructions of past precipitation
2.2.1 Reconstructed methods
In this work, to rebuild historical precipitation, the region was comprehensively considered according to a solid iterative literature screening process that covered a large number of published study sites in different monsoon regions of the globe (Table 3). Since monsoon regions are common worldwide, monsoon precipitation signals are recorded by different materials, precipitation information is extracted using different physical, chemical, and biological indicators, and different indicators may represent different climate elements in different locations. Therefore, interpreting the robustness between precipitation and records is difficult. To confirm the robustness of the relationship between records and precipitation, this study reviewed the original documentation of each record and confirmed that it represents the fluctuations in precipitation. Since we use the correlation analysis and independent sample tests between the instrumental precipitation and the reconstructed precipitation to test the reliability of the reconstruction, the selected records should extend to the 1900AD and after. Nonetheless, the results show that we still cannot avoid records that may be mixed with other types of climate information (for more detail, see the Results and Discussion). Relevant climate data should be collected in digital form for flexible mapping and correlation. The listed data are retrieved from the online paleoclimate data repository 1) (such as NOAA’s National Climate Data Center (NCDC) and thesis data supplement) based on the 1) research section’s profile and 2) digitization and vectorization using GetData. This software is a powerful programming software integrated with various mathematical statistics toolkits. It can flexibly address various mathematical statistics problems, including writing Reg-EM methods for reconstructing precipitation.
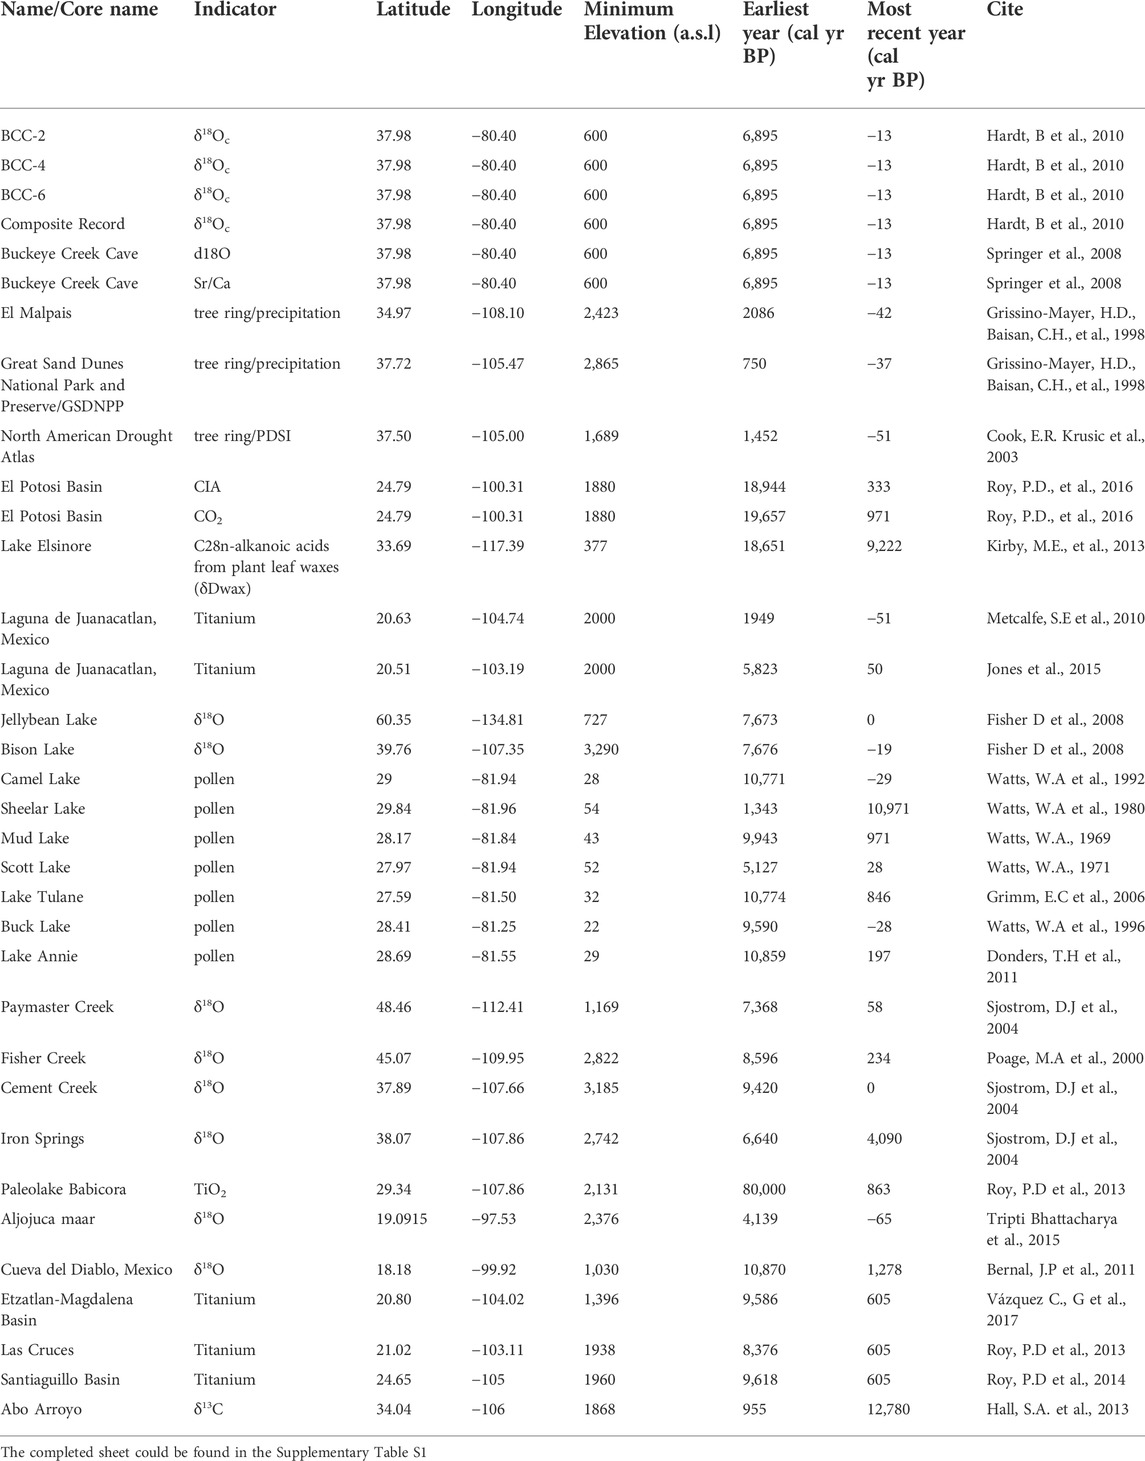
TABLE 3. Proxies are selected to reconstruct past precipitation.
To emphasize the latitudinal effect in submonsoon system precipitation during the last 12,000 cal year BP, in this paper, instead of taking the traditional approach of dividing the global monsoon region into six parts, we reconstructed global monsoon precipitation at intervals of 10 latitudinal degrees. Schneider (2001) presented a statistical approach for analyzing incomplete climate data called the Regularized Expectation Maximization Algorithm (Reg-EM). The method can estimate the mean and covariance matrix of an incomplete dataset, and missing values are filled in with imputed values, which is generally considered a nonlinear problem. Paleoclimate datasets are usually incomplete enough to calculate the mean and covariance matrix, although Reg-EM algorithms can estimate and use the covariance matrix to estimate missing values. In the iteration of the EM algorithm, the estimated values of the mean and covariance matrix reach convergence in three-step iterations. First, for each record with missing values, the regression parameters for the variables with missing values on the variables with available values were calculated from the estimates of the mean and covariance matrix. Second, given the available values and the estimates of the mean and covariance matrix, the missing values in the record are filled with their conditional expectation values, the product of the available values, and the estimated regression coefficients. Third, the mean and covariance matrix were re-estimated using the mean as the sample mean of the completed dataset, the covariance matrix as the sum of the sample covariance matrix of the completed dataset, and the contribution of the conditional covariance matrix with interpolation errors in records with interpolation values (see Little and Rubin 2019, Chapter 8). The EM algorithm starts with the initial estimates of the mean and covariance matrix and cycles through the above steps until the interpolation and estimates of the mean and covariance matrix converge. After that, the reconstructions was rescaled based on the instrumental precipitation values from 1900 to 2015 AD, and then minus the mean values of instrumental precipitation.
For a given general biased estimated linear regression model:
For a given record
Mean value of the EM algorithm:
where t is the number of steps. Expectations of the EM algorithm in an iteration are as follows:
For the regularized EM algorithm, its regularization parameter h is given by the generalized cross-validation (GCV) function:
A residual covariance matrix
where G is
The next iteration of the EM algorithm will determined the
2.2.2 Validation of the reconstruction results
After reconstructing the precipitation, the reliability of the precipitation reconstruction must be determined. Here, we used Levene’s test, independent-samples t test, and independent-samples Mann–Whitney U test to calculate the difference between the precipitation reconstructions and the mean value of precipitation from instrumental data between 1900 AD and 2015 AD to determine the reliability of the reconstructed precipitation. In addition, Pearson’s correlation, Kendall’s tau_b correlation coefficient, and Spearman’s rho were used to calculate the correlation between the instrumental data and the reconstructed precipitation. The instrumental data are the means of eight modern precipitation reanalysis datasets at different latitudes.
3 Results
3.1 Change rate of precipitation in the last 100 years
We combine the eight most commonly used modern precipitation reanalysis data and integrate them into a precipitation model covering all global monthly rainfall data from 1900 to 2015. According to Wang et al.’s (2008) method, the modern global monsoon region was calculated and the precipitation change rate in the global monsoon region over the past century was calculated. The results show that the precipitation in most of the world’s monsoon regions over the past 100 years has been decreasing. The modern precipitation rates range from −252 to 65%, although the precipitation in most regions decreases by more than 50% (Figure 1). Figure 1 shows that most areas of AM, AIM, NAmM, SAmM, NAfM, and SAfM have faced a decrease in precipitation over the past 100 years. Both hemispheres have experienced similar changes in precipitation, although such changes are consistent with the changes in precipitation over the millennium in the reconstructed global monsoon region.
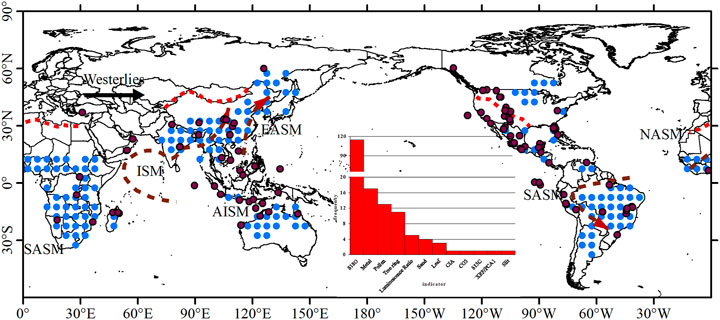
FIGURE 1. Precipitation changes in the global monsoon area over the last 100 years. Change rates (%) of the global monsoon area (GMA) derived from the composite precipitation reanalysis dataset.
3.2 GMA precipitation reconstruction since the past 12,000 cal year BP
For the GMA precipitation reconstitution (Figure 2), the global precipitation is in a constant reduction process and summer insolation in the Northern Hemisphere represents an important driving force for precipitation changes in the global monsoon region. Over ∼400 cal year BP, reconstructions showed a significant drought process. Because the global precipitation anomaly combines the different records of the Northern and Southern Hemispheres, the total precipitation presented shows limited changes.
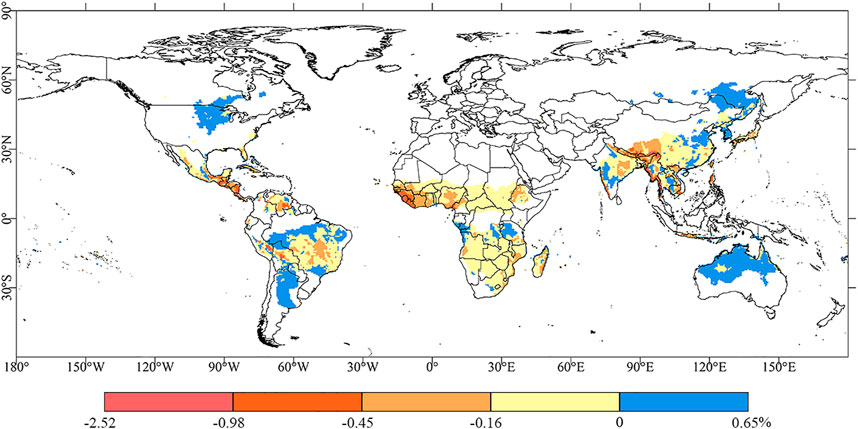
FIGURE 2. Calendar ages against precipitation anomalies (mm/yr) for monsoon area per 10° since the last 12,000 cal year BP. The uncertainties are plotted at the 2-sigma levels (gray bar), and the loess method filtered results are plotted in red.
3.3 Statistical indicators for the reconstructions
To verify the reliability of the reconstructed precipitation, Levene’s test for equality of variances, independent sample T tests, and Mann–Whitney U tests, a nonparametric estimation, were conducted for the same period (1900 AD – 2015 AD) of reconstructed precipitation and instrumental measurement data in this paper. From Table 4, the p values for the results of Levene’s test were calculated based on the mean, median, and trimmed mean range from 0.212 to 0.957, 0.211–0.988, and 0.186–0.957, respectively, with the range of the F test being 1.568–0.003. The t test values are near 1, and the independent-samples Mann–Whitney U test values are 0.334–0.935. All results are insignificant (p > 0.05). Notably, the results of the Mann–Whitney U test also indicate an asymptotically significant difference between the reconstructions and instrumental data (p < 0.05), thus demonstrating that the records are inhomogeneous. The material near the surface may not have undergone the same physicochemical and geological processes as the material beneath it. Overall, the results of the independent sample test and Levene’s test indicate that the difference between the two is not significant, which suggests that the distribution is the same across categories of reconstructions and instrumental values. In other words, our reconstructions are reliable.
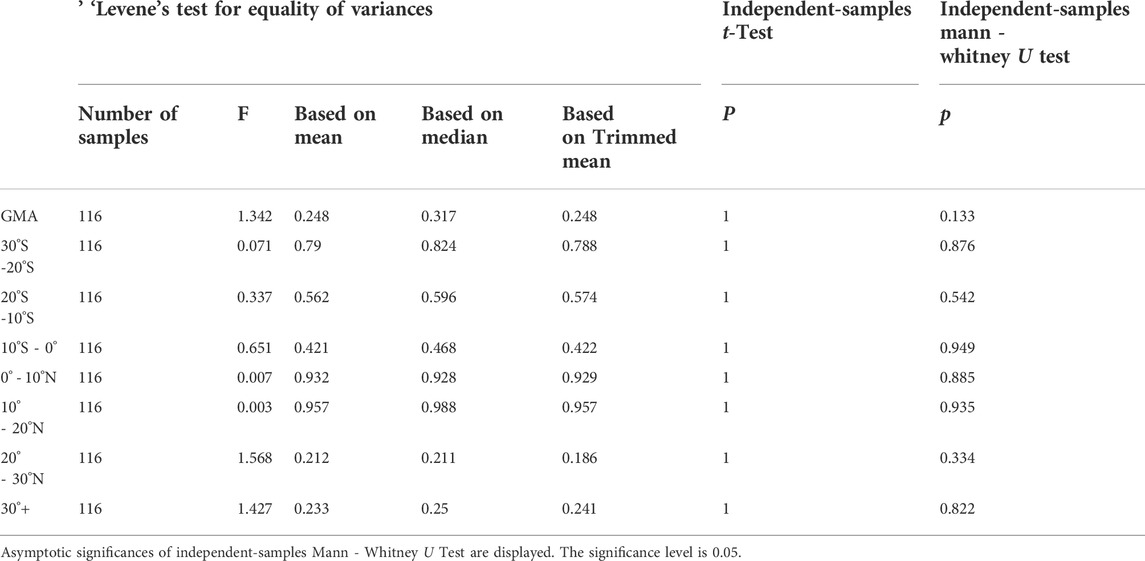
TABLE 4. The independent sample test between reconstructions and instrumental values.
In addition, we also examined the correlations between tests, and the results are shown in Table 5. The results of Pearson’s correlation, Kendall’s tau_b correlation coefficient, and Spearman’s rho are similar. All three results show significant correlations at 30°S - 20°S, 20° - 30°N, and 30°N+ (p < 0.01), while precipitation at low latitudes does not have significant correlations. Further correlation analysis indicates a clear latitudinal difference in precipitation in the global monsoon region, where a single factor may drive the monsoon precipitation at mid-latitudes; however, the precipitation drivers at low latitudes are much more complex.
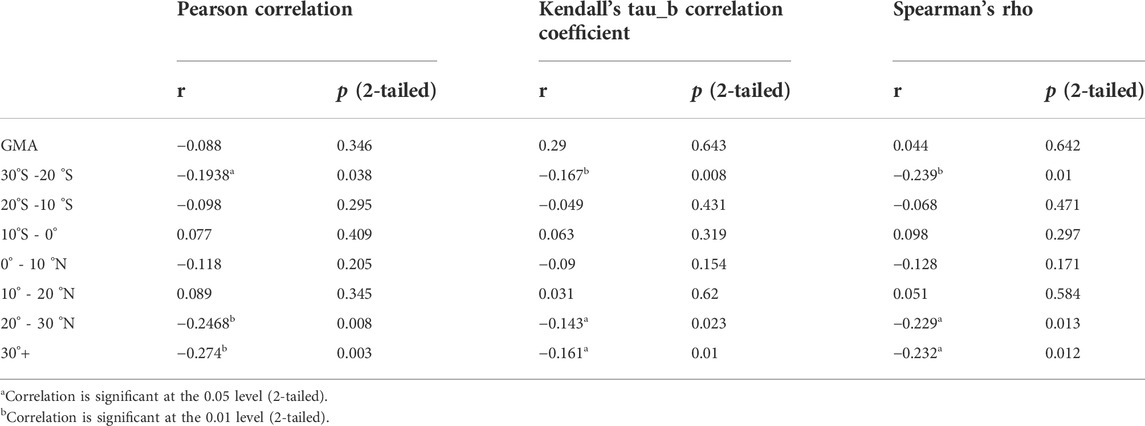
TABLE 5. the correlation coefficient between reconstructions and instrumental values.
4 Discussion
4.1 Low latitude monsoon precipitation reconstructions
Significant long-term trend in precipitation reconstructions are not observed at low latitudes (10°S to 20°N, Figure 3). Over the past 12,000 years, the precipitation fluctuates from 600 ± 400 mm (0°–10°S) and 150 ± 200 mm/yr (0°–20°N). According to classical theory, the counter phase of low latitude insolation forces the anti-phase precipitation to change between the hemispheres (Wang, 2009). The stalagmite δ18O values from Dongge Cave and Qunf Cave in the Northern Hemisphere suggest that Northern Hemisphere insolation controls low latitude monsoon precipitation (Fleitmann et al., 2003; Wang et al., 2005; Griffiths et al., 2009). In the Southern Hemisphere, sediment cores recovered from the deep portions of Lake Titicaca revealed that the precipitation in the tropical South America region was the driest until 8,000 cal year BP to 5,500 cal year BP (Paul et al., 2001). However, the theory is not consistent with our results, and increasing evidence points to the limitation of the hypothesis. Griffiths et al. (2009) showed that the coupling of ocean circulation and atmospheric circulation is the dominant force for the Australian-Indonesian summer monsoon rainfall change, while neither the low latitude insolation signal in the Southern and Northern Hemispheres is evident in its monsoon precipitation. The records from Borneo (4°N, 114°E, Northern Hemisphere) show that precipitation is correlated with Southern Hemisphere insolation at low latitudes over the past 12,000 cal year BP (Partin et al., 2007). The algorithmic results indicate that low-latitude precipitation does not have a significant linear relationship with southern or northern low-latitude insolation (Figure 3). During the past 12,000 cal year BP, the effective humidity in the central-eastern equatorial Pacific and the Indian Ocean had a significant anti-phase shift in the meridional direction, with the 200 hPa and 850 hPa wind fields shifting northward and then southward in the meridional direction (Figure 4). The effective humidity, wind field, and SST at low latitudes are likely explanations for the overall insignificant variation in precipitation at low latitudes over the last 12,000 cal year BP (Wang et al., 2004; Wang, 2009; An et al., 2015). Low latitudes receive more than the average amount of heat from solar radiation (Berger, 2009), and a decrease (increase) in heat in the Southern Hemisphere and an increase (decrease) in heat in the Northern Hemisphere do not change the total amount of heat absorbed at low latitudes. Precipitation in the low latitude monsoon region does not show a positive (negative) correlation with local insolation, as is the case for monsoon precipitation at different locations of low latitude. In addition, the linear relationship between the δ18O on G. ruber from Andaman Sea core RC12-344 and the low-latitude insolation of the North Hemisphere was not significant compared to the seawater δ18O values of core RC12-344 and the total organic carbon (%TOC) from Arabian Sea core SO90-111KL (Schulz et al., 1998; Rashid et al., 2007).
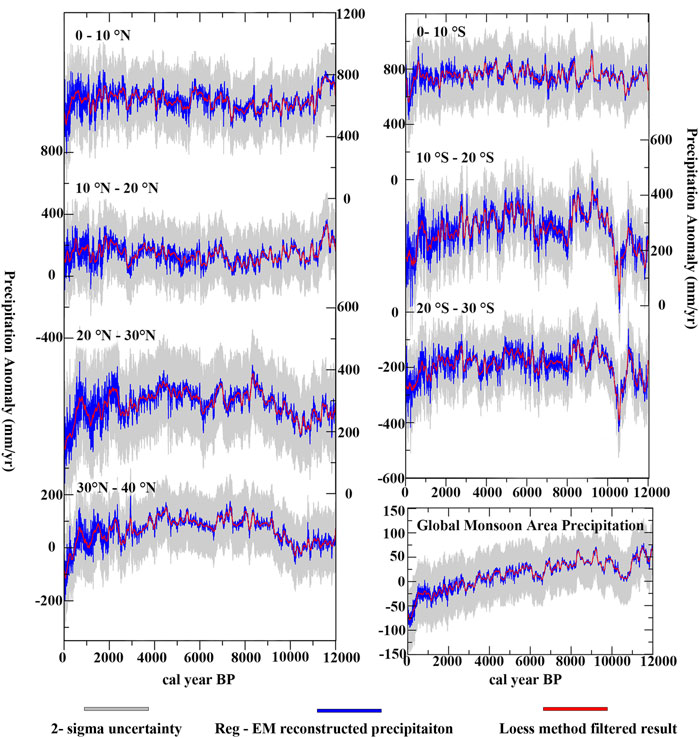
FIGURE 3. Monsoon precipitation reconstructions per 10 latitudinal degrees and different proxies. (A) Monsoon precipitation reconstructions at low latitudes; (B) monsoon precipitation reconstructions at middle latitudes; and (C) GMA precipitation reconstructions. Indicators are cited in this figure: Liang Luar δ18O (‰) values (8° 32′ S, 120°26′ E; 550 m above sea level; Griffiths et al., 2009); Dongge Cave δ18O (‰) values (25°17′ N, 10° 85′ E, 680 m above sea level; Dykoski et al., 2005; Wang et al., 2005); GISP2 δ18O (‰) values (72°34.58′ N, 38°28.08′ W, 3,208 m above sea level; Grootes et al., 1993); Cariaco Basin titanium counts (%) (10°42.73′ N, 65°10.18′ W, 893 m deep; Haug et al., 2001; Dean, 2007); Florida Straits δ18O (‰) values (24°24.70′ N, 83°13.14′ W, 198 m deep; Schmidt et al., 2012; Domínguez-Villar et al., 2017); Kaite Cave δ18O (‰) values (43°2′ N, 3°39′ W; 860 m above sea level; Domínguez-Villar et al., 2008; Domínguez-Villar et al., 2017); Soledad Basin Mg/Ca (%) (25°12′ N, 112°42′ W; Marchitto et al., 2010); Laguna Pallcacocha Red Color Intensity (28°46′ S, 79°14′ W, 4,200 m above sea level; Moy et al., 2002); and Niño3.4 (°C) (170–120° W, 5° S-5° N; Liu et al., 2014).
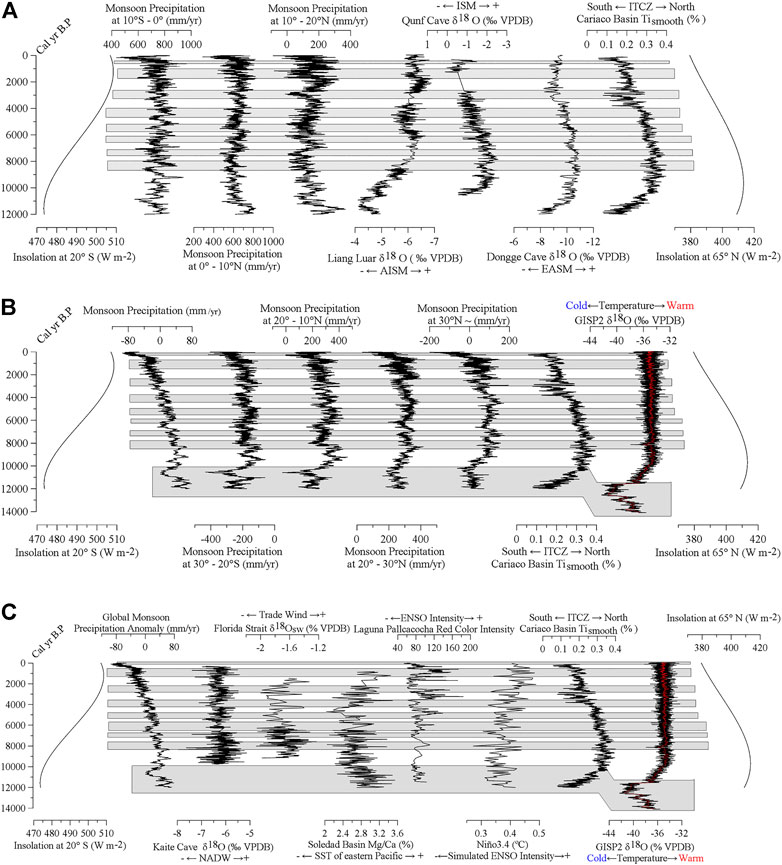
FIGURE 4. (A) Wind field at 200 hPa in December, January, and February (DJF) of the mid-Holocene minus the Last Glacial Maximum (LGM) and wind field at 200 hPa in December, January, and February of the mid-Holocene minus preindustrialization. (B) Wind field at 800 hPa in June, July, and August of the mid-Holocene minus the Last Glacial Maximum and wind field at 800 hPa in June, July and August (JJA) of the mid-Holocene minus preindustrialization. (C) Annual effective moisture status in the middle Holocene minus the Last Glacial Maximum and annual (ANN) effective moisture status in the middle Holocene minus the Last Glacial Maximum preindustrialization.
4.2 Middle latitude monsoon precipitation
The evolution of the middle latitude monsoon precipitation is related to the summer insolation in the Northern Hemisphere. In the area between 30°S and 10°S and north of 20°N, precipitation intensified from the late glacial period and lasted until the early and middle Holocene. The monsoon precipitation (20°N+) in the middle latitudes is the highest in the late glacial period to the middle Holocene and relatively low in the late Holocene (Figure 3). The climate modeling results and records reveal the mechanism of this change (Figure 3, Figure 4). The stalagmite records from Dongge Cave, the Florida Straits, and Kaite Cave all indicate a strong summer monsoon in the early Holocene. (Wang et al., 2005; Domínguez-Villar et al., 2008; Domínguez-Villar et al., 2017). The reconstructions (20°S to 30°S) are related to the Northern Hemisphere insolation over the past 12,000 cal year BP. The prominent feature is the wettest values at ∼10,000 cal year BP, which gradually decreased until modern times (Figure 3). Stable nitrogen isotope data from a rock hyrax (Procavia capensis) midden from northwestern Namibia (20°27.83′S, 14°26.54′E) indicate hemispheric synchrony in tropical climate change during the Holocene, which is similar to the trends in the Northern Hemisphere (Chase et al., 2010). The Spitzkoppe hyrax midden site (Chase et al., 2009), Brandberg (Scott et al., 2004), and marine core site ODP 1078 are strongly correlated with the southeast Atlantic coastal upwelling (Farmer et al., 2005). The results of the algorithm were obtained according to the weights of the indicators in the dataset, and it is known from Figure 5 that we collected more records in South America than in Africa. Records in South America, such as Titicaca (Paul et al., 2001), recorded the opposite trend relative to the reconstructed precipitation. Therefore, further studies are needed to elucidate the precipitation mechanisms in the monsoon region of the Southern Hemisphere’s middle latitudes.
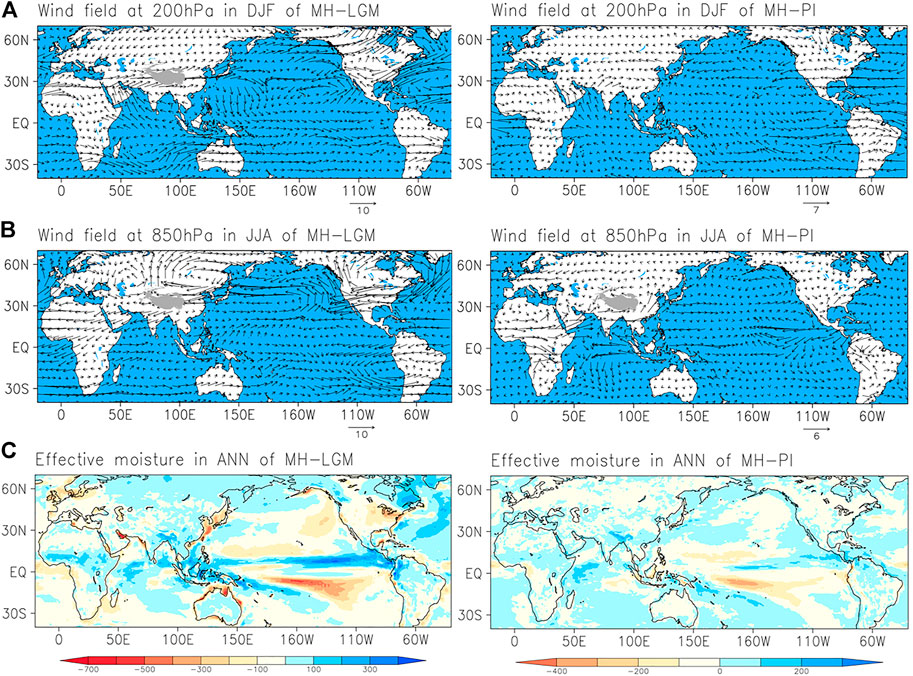
FIGURE 5. Schematic showing lacustrine archives for study (red wine circle), with modern monsoon area (blue circle). The modern monsoon area was calculated in terms of Wang’s method (Wang and Ding, 2008; Wang et al., 2012). The histogram displays different types and numbers of proxies selected in this study (for more precise sample information, see Supplementary Material). Abbreviations: EASM, East Asia summer monsoon; ISM, Indian summer monsoon; SASM, South African summer monsoon, South American summer monsoon; AISM, Australian-Indonesian summer monsoon; and NASM, North American summer monsoon.
4.3 Links to North Atlantic climate
Eight weak precipitation events are observed in the reconstructed precipitation in the monsoon region (Figure 3), which is consistent with the eight ice-rafting events in the North Atlantic (Bond et al., 2001). During an ice raft event, the rapid injection of freshwater into the North Atlantic causes the density of sea surface water to decrease, thereby inhibiting the formation of North Atlantic Deep Water, weakening the AMOC, and reducing the heat exchange efficiency between high and low latitudes (Broecker, 2003; Domínguez-Villar et al., 2017). Modeling experiments show that the weakening of the AMOC is in line with the southward displacement of the ITCZ in the tropical Pacific (Zhang and Delworth, 2005) because lower titanium counts occur in the Cariaco basin (Haug et al., 2001; Dean, 2007). Therefore, the slowdown of the AMOC drives the nonlinear change in the precipitation in the monsoon region at low latitudes. During the period from the Younger Dryas, the precipitation in the reconstructed global monsoon region decreased by ∼40 mm/yr and the GISP2 δ18Ο (‰) values were negative (Figure 3). It is worth noting that the Younger Dryas signal is not shown in the speleothem from northern Borneo (Partin et al., 2007), which is in contrast to our results. Other famous cooling events, such as that at 8.2 ka, are also found in precipitation reconstructions, which is consistent with Mg/Ca data from the Soledad Basin (Marchitto et al., 2010), Red Color Intensity from Laguna Pallcacocha (Moy et al., 2002), and Niño 3.4 values (Liu et al., 2014). In addition, the meridional shift of the trade wind also plays an important role in monsoon precipitation variations (Figure 3, Domínguez-Villar et al., 2008). The latitudinal response of precipitation to insolation has a regional structural asymmetry rooted in a greater thermodynamic response to incoming forcing on land than in the ocean, which can hold more heat than the land (Clement et al., 2004; Xu et al., 2013).
4.4 Asynchronous precipitation and temperature signals
Figure 3 compares the reconstruction of millennial-scale variations in global monsoon precipitation, long-term changes in the ITCZ and AMOC, the simulation of the effective moisture and wind field, and the GISP2 δ18Ο (‰) values. GISP2 δ18O (‰) is considered to be a good indicator for studying temperature change in the North Atlantic (Schulz and Paul, 2002; Friedrich et al., 2010; Bathiany et al., 2018). The reconstructed precipitation is consistent with GISP2 δ18O (‰), which is also in accordance with summer insolation changes, ocean circulation, and sea surface temperature, thus revealing the orbital forcing and interconnection of ocean circulation and atmospheric circulation on millennial-scale variations in monsoon precipitation. However, the reconstructed summer monsoon precipitation simulated lags of almost 2,000 cal year BP to the onset of the GISP2 δ18O (‰) from 10,000 cal year BP to 12,000 cal year BP (Figure 3). The relative consistency of GISP2 δ18O (‰) and precipitation between 14,000 cal year BP to 10,100 cal year BP and 12,000 cal year BP to 10,100 cal year BP explains the role of the North Atlantic in abrupt climate changes and the fact that the changes in precipitation in the middle and low latitudes lag behind those in the high latitudes (Figure 3). Since the early Holocene, intensified insolation has warmed the ocean, although the shutdown of the AMOC between 18,000 cal year BP and 15,000 cal year BP is insufficient to cause land warming and increase precipitation (Xu et al., 2013). This result is consistent with previous studies showing that Zhuye Lake reached the maximum lake level during the early-mid-Holocene transition (Li and Xu, 2016). Pollen, foraminifera, and alkenone paleothermometry from DG9603 (Okinawa Trough, East China Sea) also indicate that terrestrial deglacial warming lagged behind marine warming by approximately 3,000 cal year BP to 4,000 cal year BP, which is consistent with cave carbonate δ18Ο (‰) values in southern China (Dykoski et al., 2005; Xu et al., 2013). Monsoon dynamics are linked to snow accumulation in Asia and Europe, and the monsoon-glacier connection in monsoon dynamics is unclear; however, what we do know is that the combination of glacially recharged lakes and relatively high monsoon precipitation maintained a high lake level during the early to mid-Holocene (Li and Morrill, 2010).
4.5 Modern monsoon annual precipitation variation
The results calculated from eight modern precipitation reanalysis datasets show that most of the monsoon regions face a decrease in precipitation in the last hundred years, and the modern precipitation change rates range from -252 to 65%, but most regions reduce to less than 50% (Figure 1). Some researchers point out that there is no nonlinear jump between the centennial and millennial scales; therefore, centennial precipitation change may be a part of the millennial-scale precipitation change (Schulz and Paul, 2002; Shepherd, 2005; Friedrich et al., 2010; Prein et al., 2017; Bathiany et al., 2018). As a part of the millennial-scale monsoon precipitation variation, monsoon precipitation will weaken further with the change in the Northern Hemisphere summer insolation in the future. However, the monsoon margin area may become more moist due to the monsoon precipitation increase in this area, which accounts for 65% (Figure 1).
5 Conclusion
In this study, simulations, records, and modern monsoon indices were synthesized to reveal global monsoon precipitation patterns over the last 12,000 cal year BP. Our results suggest that meridional ocean and atmospheric circulation play a key role in the long-timescale precipitation change in global monsoon regions. Significant long-term trends in precipitation reconstructions at low latitudes are not observed. The evolution of the middle latitude monsoon precipitation is related to the summer insolation in the Northern Hemisphere. In addition, further studies are needed to elucidate the precipitation mechanisms in the monsoon region of the Southern Hemisphere’s middle latitudes.
Data availability statement
The raw data supporting the conclusions of this article will be made available by the authors, without undue reservation.
Author contributions
The YL contributed to the conception of the study; WY performed the experiment and contributed significantly to analysis and wrote manuscript; ZF performed some data analyses; YZ and SP drafted some figures and interpretation of data for the article.
Funding
This research was supported by the Second Tibetan Plateau Scientific Expedition and Research Program (STEP) (Grant No. 2019QZKK0202); the National Natural Science Foundation of China (Grant No. 42077415); and the 111 Project (BP0618001).
Conflict of interest
The authors declare that the research was conducted in the absence of any commercial or financial relationships that could be construed as a potential conflict of interest.
Publisher’s note
All claims expressed in this article are solely those of the authors and do not necessarily represent those of their affiliated organizations, or those of the publisher, the editors and the reviewers. Any product that may be evaluated in this article, or claim that may be made by its manufacturer, is not guaranteed or endorsed by the publisher.
Supplementary material
The Supplementary Material for this article can be found online at: https://www.frontiersin.org/articles/10.3389/feart.2022.944015/full#supplementary-material
References
Adegbie, A. T., Schneider, R. R., Röhl, U., and Wefer, G. (2003). Glacial millennial-scale fluctuations in central african precipitation recorded in terrigenous sediment supply and freshwater signals offshore cameroon. Palaeogeogr. Palaeoclimatol. Palaeoecol. 197, 323–333. doi:10.1016/s0031-0182(03)00474-7
Bathiany, S., Scheffer, M., Nes, E. V., Williamson, M. S., and Lenton, T. M. (2018). Abrupt climate change in an oscillating world. Sci. Rep. 8, 5040. doi:10.1038/s41598-018-23377-4
Berger, A. (2009). Monsoon and general circulation system. Sci. Bull. 54, 1111–1112. doi:10.1007/s11434-009-0170-y
Bond, G., Kromer, B., Beer, J., Muscheler, R., Evans, M. N., et al. (2001). Persistent solar influence on north atlantic climate during the holocene. Science 294, 2130–2136. doi:10.1126/science.1065680
Broecker, W. S. (2003). Does the trigger for abrupt climate change reside in the ocean or in the atmosphere? Science 300, 1519–1522. doi:10.1126/science.1083797
Chase, B. M., Meadows, M. E., Carr, A. S., and Reimer, P. J. (2010). Evidence for progressive holocene aridification in southern africa recorded in namibian hyrax middens: implications for african monsoon dynamics and the “‘african humid ’period. Quat. Res. 74, 36–45. doi:10.1016/j.yqres.2010.04.006
Chase, B. M., Meadows, M. E., Scott, L., Thomas, D. S. G., Marais, E., et al. (2009). A record of rapid holocene climate change preserved in hyrax middens from southwestern africa. Geology 37, 703–706. doi:10.1130/G30053A.1
Clement, A. C., Hall, A., and Broccoli, A. J. (2004). The importance of precessional signals in the tropical climate. Clim. Dyn. 22, 327–341. doi:10.1007/s00382-003-0375-8
Dean, W. E. (2007). Sediment geochemical records of productivity and oxygen depletion along the margin of western north america during the past 60,000 years: teleconnections with greenland ice and the cariaco basin. Quat. Sci. Rev. 26, 98–114. doi:10.1016/j.quascirev.2006.08.006
Domínguez-Villar, D., Wang, X., Cheng, H., Martín-Chivelet, J., and Edwards, R. L. (2008). Α high-resolution late holocene speleothem record from kaite cave, northern Spain: Δ18O variability and possible causes. Quat. Int. 187, 40–51. doi:10.1016/j.quaint.2007.06.010
Domínguez-Villar, D., Wang, X., Krklec, K., Cheng, H., and Edwards, R. L. (2017). The control of the tropical north atlantic on holocene millennial climate oscillations. Geology 45, 303–306. doi:10.1130/G38573.1
Dykoski, C. A., Edwards, R. L., Hai, C., Yuan, D., Cai, Y., et al. (2005). A high-resolution, absolute-dated holocene and deglacial asian monsoon record from dongge cave, china. Earth Planet. Sci. Lett. 233, 71–86. doi:10.1016/j.epsl.2005.01.036
Farmer, E. C., Demenocal, P. B., and Marchitto, T. M. (2005). Holocene and deglacial ocean temperature variability in the Benguela upwelling region: implications for low-latitude atmospheric circulation. Paleoceanography 20. doi:10.1029/2004PA001049
Fleitmann, D., Burns, S. J., Mudelsee, M., Neff, U., Kramers, J., et al. (2003). Holocene forcing of the indian monsoon recorded in a stalagmite from southern oman. Science 300, 1737–1739. doi:10.1126/science.1083130
Friedrich, T., Timmermann, A., Menviel, L., Timm, O. E., and Roche, D. M. (2010). The mechanism behind internally generated centennial-to-millennial scale climate variability in an earth system model of intermediate complexity. Geosci. Model. Dev. 3, 377–389. doi:10.5194/gmd-3-377-2010
Giannini, A., Saravanan, R., and Chang, P. (2003). Oceanic forcing of sahel rainfall on interannual to interdecadal time scales. Science 302, 1027–1030. doi:10.1126/science.1089357
Griffiths, M. L., Drysdale, R. N., Gagan, M. K., Zhao, J., Ayliffe, L. K., et al. (2009). Increasing australian–indonesian monsoon rainfall linked to early holocene sea-level rise. Nat. Geosci. 2, 636–639. doi:10.1038/NGEO605
Grootes, P. M., Stuiver, M., White, J., Johnsen, S., and Jouzel, J. (1993). Comparison of oxygen isotope records from the GISP2 and GRIP greenland ice cores. Nature 366, 552–554. doi:10.1038/366552a0
Haug, G. H., Hughen, K. A., Sigman, D. M., Peterson, L. C., and Rohl, U. (2001). Southward migration of the intertropical convergence zone through the holocene. Science 293, 1304–1308. doi:10.1126/science.1059725
Li, Y., Liu, Y., Ye, W., Xu, L., Zhu, G., et al. (2018). A new assessment of modern climate change, china—an approach based on paleo-climate. Earth-Science Rev. 177, 458–477. doi:10.1016/j.earscirev.2017.12.017
Li, Y., and Morrill, C. (2010). Multiple factors causing holocene lake-level change in monsoonal and arid central asia as identified by model experiments. Clim. Dyn. 35 (6), 1119–1132. doi:10.1007/s00382-010-0861-8
Li, Y., and Xu, L. (2016). Asynchronous Holocene Asian monsoon vapor transport and precipitation. Palaeogeogr. Palaeoclimatol. Palaeoecol. 461, 195–200. doi:10.1016/j.palaeo.2016.08.024
Liu, Z., Lu, Z., Wen, X., Otto-Bliesner, B. L., Timmermann, A., et al. (2014). Evolution and forcing mechanisms of El Niño over the past 21,000 years. Nature 515, 550–553. doi:10.1038/nature13963
Liu, Z., Otto-Bliesner, B., Kutzbach, J., Li, L., and Shields, C. (2003). Coupled climate simulation of the evolution of global monsoons in the holocene. J. Clim. 16, 24722–32490. doi:10.1175/1520-0442(2003)016<2472:CCSOTE>2.010.1175/1520-0442(2003)016<2472:ccsote>2.0.co;2
Maher, B. A., and Hu, M. (2006). A high-resolution record of Holocene rainfall variations from the western Chinese loess plateau: anti-phase behaviour of the african/indian and east asian summer monsoons. Holocene 16, 309–319. doi:10.1191/0959683606hl929rp
Marchitto, T. M., Muscheler, R., Ortiz, J. D., Carriquiry, J. D., and van Geen, A. (2010). Dynamical response of the tropical pacific ocean to solar forcing during the early holocene. Science 330, 1378–1381. doi:10.1126/science.1194887
Moy, C. M., Seltzer, G. O., Rodbell, D. T., and Anderson, D. M. (2002). Variability of el niño/southern oscillation activity at millennial timescales during the holocene epoch. Nature 420, 162–165. doi:10.1038/nature01194
Partin, J. W., Cobb, K. M., Adkins, J. F., Clark, B., and Fernandez, D. P. (2007). Millennial-scale trends in west Pacific warm pool hydrology since the Last Glacial Maximum. Nature 449, 452–455. doi:10.1038/nature06164
Paul, A. B., Geoffrey, O. S., Sherilyn, C. F., Robert, B. D., Matthew, J. G., et al. (2001). The history of south american tropical precipitation for the past 25,000 years. Science 291, 640–643. doi:10.1126/science.291.5504.640
Prein, A. F., Liu, C., Ikeda, K., Trier, S. B., Rasmussen, R. M., et al. (2017). Increased rainfall volume from future convective storms in the US. Nat. Clim. Change 7, 880–884. doi:10.1038/s41558-017-0007-7
Rashid, H., Flower, B. P., Poore, R. Z., and Quinn, T. M. (2007). A- 25 ka indian ocean monsoon variability record from the andaman Sea. Quat. Sci. Rev. 26 (19-21), 2586–2597. doi:10.1016/j.quascirev.2007.07.002
Schmidt, M. W., Weinlein, W. A., Marcantonio, F., and Lynch‐Stieglitz, J. (2012). Solar forcing of florida straits surface salinity during the early holocene. Paleoceanography 27 (3). doi:10.1029/2012PA002284
Schneider, T. (2001). Analysis of incomplete climate data: estimation of mean values and covariance matrices and imputation of missing values, J. Clim. 14, 8532–8871. doi:10.1175/1520-0442(2001)014<0853:AOICDE>2.010.1175/1520-0442(2001)014<0853:aoicde>2.0.co;2
Schulz, H., von Rad, U., and Erlenkeuser, H. (1998). Correlation between Arabian Sea and Greenland climate oscillations of the past 110,000 years. Nature 393 (6680), 54–57. doi:10.1038/31750
Schulz, M., and Paul, A. (2002). “Holocene climate variability on centennial-to-millennial time scales: 1. Climate records from the North-atlantic realm,” in Climate development and history of the North Atlantic realm (Berlin, Heidelberg: Springer), 41–54. doi:10.1007/978-3-662-04965-5_4
Scott, L., Marais, E., and Brook, G. A. (2004). Fossil hyrax dung and evidence of late pleistocene and holocene vegetation types in the namib desert. J. Quat. Sci. 19, 829–832. doi:10.1002/jqs.870
Shepherd, J. M. (2005). A review of current investigations of urban-induced rainfall and recommendations for the future. Earth Interact. 9, 1–27. doi:10.1175/EI156.1
Wang, B., and Ding, Q. (2008). Global monsoon: dominant mode of annual variation in the tropics. Dyn. Atmos. Oceans 44, 165–183. doi:10.1016/j.dynatmoce.2007.05.002
Wang, B., Liu, J., Kim, H., Webster, P. J., and Yim, S. (2012). Recent change of the global monsoon precipitation (1979–2008). Clim. Dyn. 39, 1123–1135. doi:10.1007/s00382-011-1266-z
Wang, P. (2009). Global monsoon in a geological perspective. Sci. Bull. 54, 1113–1136. doi:10.1007/s11434-009-0169-4
Wang, X., Auler, A. S., Edwards, R. L., Cheng, H., Cristalli, P. S., et al. (2004). Wet periods in northeastern brazil over the past 210 kyr linked to distant climate anomalies. Nature 432, 740–743. doi:10.1038/nature03067
Wang, Y., Cheng, H., Edwards, R. L., He, Y., Kong, X., et al. (2005). The holocene Asian monsoon: links to solar changes and north atlantic climate. Science 308, 854–857. doi:10.1126/science.1106296
Weldeab, S., Lea, D. W., Schneider, R. R., and Andersen, N. (2007). 155,000 years of west african monsoon and ocean thermal evolution. Science 316, 1303–1307. doi:10.1126/science.1140461
Xu, D., Lu, H., Wu, N., Liu, Z., Li, T., et al. (2013). Asynchronous marine-terrestrial signals of the last deglacial warming in east asia associated with low- and high-latitude climate changes. Proc. Natl. Acad. Sci. 110, 9657–9662. doi:10.1073/pnas.1300025110
Zhang, R., and Delworth, T. L. (2005). Simulated tropical response to a substantial weakening of the Atlantic thermohaline circulation. J. Clim. 18, 1853–1860. doi:10.1175/JCLI3460.1
Keywords: monsoon precipitation, climate models, holocene, latitudinal effect, AMOC
Citation: Ye W, Li Y, Feng Z, Zhang Y and Peng S (2022) Long-term latitudinal effects of precipitation change in global monsoon regions. Front. Earth Sci. 10:944015. doi: 10.3389/feart.2022.944015
Received: 14 May 2022; Accepted: 27 June 2022;
Published: 26 July 2022.
Edited by:
Xianyong Cao, Institute of Tibetan Plateau Research (CAS), ChinaCopyright © 2022 Ye, Li, Feng, Zhang and Peng. This is an open-access article distributed under the terms of the Creative Commons Attribution License (CC BY). The use, distribution or reproduction in other forums is permitted, provided the original author(s) and the copyright owner(s) are credited and that the original publication in this journal is cited, in accordance with accepted academic practice. No use, distribution or reproduction is permitted which does not comply with these terms.
*Correspondence: Yu Li, bGl5dUBsenUuZWR1LmNu