 Jie Shao
 Yibo Wang
 Yikang Zheng
 Yi Yao1,2
 Shaojiang Wu
 Zesheng Yang
- 1Key Laboratory of Petroleum Resource Research, Institute of Geology and Geophysics, Chinese Academy of Sciences, Beijing, China
- 2The Innovation Academy for Earth Science, Chinese Academy of Sciences, Beijing, China
The recently developed fiber-optic distributed acoustic sensing (DAS) technology has attracted widespread attention in engineering applications, oil exploration, and seismological research. Compared with the conventional geophones, DAS can acquire high-resolution data due to a dense sampling and can be deployed conveniently in the complex acquisition environment. These advantages of DAS make it promising for near-surface characterization in the urban city. In this study, a DAS line was utilized to record traffic noise seismic data in the urban city and to investigate the near-surface characterization. Seismic surface waves were reconstructed from the acquired traffic noises using seismic interferometry. Thereafter, we obtain the near-surface shear wave velocity profile below the DAS line by surface wave dispersion curve inversion using a Bayesian Markov Chain Monte Carlo method. The results demonstrate the effectiveness of DAS-based urban traffic noise in near-surface characterization.
Introduction
The urban underground space is increasingly being developed and utilized with the advancement of urbanization. Various underground facilities have been built and put into use in many countries, such as subways, underground parking spaces, underground shopping malls, and so on (Bobylev and Sterling, 2016). However, there are uncertainties in the construction and operation of underground engineering due to the complexity and instability of near-surface structures. Therefore, accurate near-surface characterization is important for understanding the underground condition better and reducing the potential safety risks (Von der Tann et al., 2020).
Compared with the near-surface surveys in resource exploration, near-surface characterization in the urban city presents additional challenges, which require high spatial and temporal resolution, efficient data acquisition, low cost, and minimal disruption to urban life. Different from the destructive active sources in the conventional near-surface surveys, the urban traffic noise provides a readily available and clean source to obtain the near-surface structure (Zhang et al., 2019; Ma and Qian, 2020). The newly developed fiber-optic distributed acoustic sensing (DAS) has emerged as a promising seismic data acquisition technology. Different from the particle displacement or velocity measurements of conventional geophones, DAS measures the strain rate or strain caused by vibrations using a fiber-optic cable (Zhan, 2020; Song et al., 2021a). Compared with the geophone, DAS can acquire high-resolution data with sampling frequencies from kHz to MHz and spatial sampling of several meters (Parker et al., 2014; Paitz et al., 2021). In addition, DAS can be deployed conveniently in the complex acquisition environment and enable long-term monitoring. The potential and advantages of DAS have been validated recently in seismic exploration (Daley et al., 2016; Lei et al., 2021; Wang et al., 2021), regional and teleseismic earthquake observations (Williams, et al., 2019; Shinohara et al., 2022), and microseismic monitoring (Walter et al., 2020). In terms of near-surface structure characterization, Fang et al. (2020) used blast signals from quarry sites to obtain the near-surface velocity changes. They picked travel times from virtual source gathers on each day and estimated the velocities by least-squares linear regression. Song et al. (2021b) analyzed the traffic noise distribution using the ambient noise from an urban city. The data were recorded by urban telecommunication fiber-optic cables. The fundamental-mode dispersion curves were extracted from the reconstructed Rayleigh surface waves in the virtual source gathers and then were inverted for the near-surface velocity structure using the ambient noise tomography with a neighborhood algorithm.
In this study, we acquired traffic noise using a DAS line deployed along a busy road in an urban city. We analyzed the recorded seismic wavefield and reconstructed seismic surface wave from 1 hour of continuous data. Then dispersion curves were extracted and inverted for the near-surface velocity below the DAS line. The inverted velocity agrees well with the prior geological knowledge. The results confirm the reliability of near-surface characterization using urban traffic noise recorded by a DAS line.
Data and preprocessing
The study site is located in an urban city (Beijing) in Northeast China, as shown in Figure 1A. The near-surface stratigraphy in this area mainly consists of horizontal layers. Data in this study were continuously acquired using a fiber-optic distributed acoustic sensing (DAS) line with a length of 402.5 m. The DAS line was installed along the road (Figure 1B) to ensure that the recorded data contained rich traffic noise. The gauge length is 5.0 m. The trace interval of acquired data is 0.5 m and the sampling frequency is 4,000 Hz.
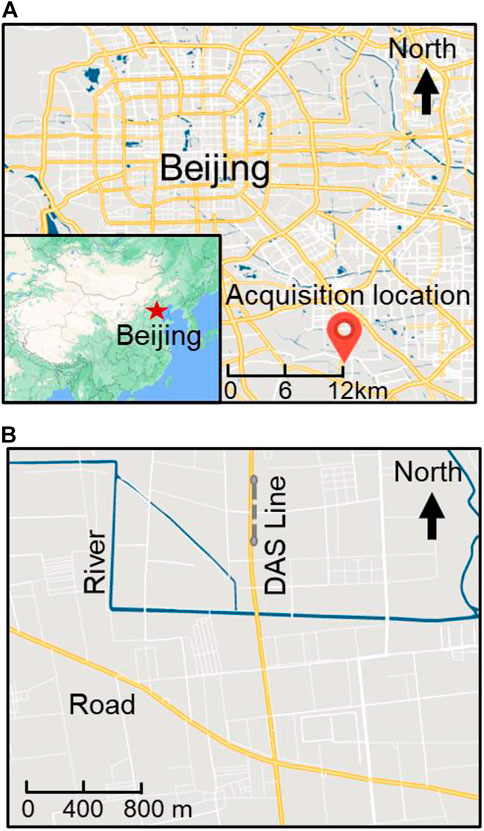
FIGURE 1. (A) Location of the data acquisition area in Beijing, China. (B) A zoomed-in view of the field acquisition layout. The dashed gray line indicates the DAS line along the road.
We first analyzed the acquired urban traffic seismic noise collected by the DAS line. Figures 2A,B shows examples of 10 min recording when there are many vehicles and when no vehicles pass across the entire DAS line. As shown by the black arrows in Figure 2A, there are clear vehicle-related seismic data when vehicles pass through the DAS line. These vehicle-related seismic signals show linear events with different slopes, indicated by the green dashed lines in Figure 2A. They are excited by vehicles with different running speeds and directions. A zoomed-in view of a vehicle-related seismic event indicated by a rectangle labeled A in Figure 2A is shown in Figure 2C. The blue lines in Figure 2C indicate linear events with positive and negative slopes excited by a vehicle passing through the DAS line. The slopes of these blue lines represent the propagation velocity of the wavefield excited by the vehicle. Figures 2E,F shows the zoomed-in views of background noise indicated by the rectangle labeled B in Figure 2A and labeled C in Figure 2B. The two background noises are extracted from the records with and without vehicles to compare the effect of urban traffic. The waveforms and amplitude spectra of data indicated by the arrows in Figures 2C,D,E are shown in Figure 3. The vehicle-related seismic data in Figure 3A presents strong amplitude vibrations compared with the background noise in Figures 3B,C. The amplitude spectrum is distributed in a frequency range of 0–30 Hz, indicated by the blue line in Figure 3D. The red line in Figure 3D represents the amplitude spectrum of background noise extracted from a period in the vicinity of the vehicle-related seismic data. It shows a similar frequency band (0–30 Hz) to the vehicle-related seismic data (the blue line) but with weaker energy. In comparison, the amplitude spectrum of background noise extracted from a quiet period without vehicles has a lower frequency range of 0–10 Hz and the smallest energy. Therefore, the noise sources of urban traffic can provide a broadband frequency data than the common ambient noise. The F-K analyses of data in Figures 2C,D,E are shown in Figure 4. The energy bands in all the three F-K spectra distribute in an almost similar slope range defined by the red lines in Figure 4, indicating the similar apparent velocities of these waves.
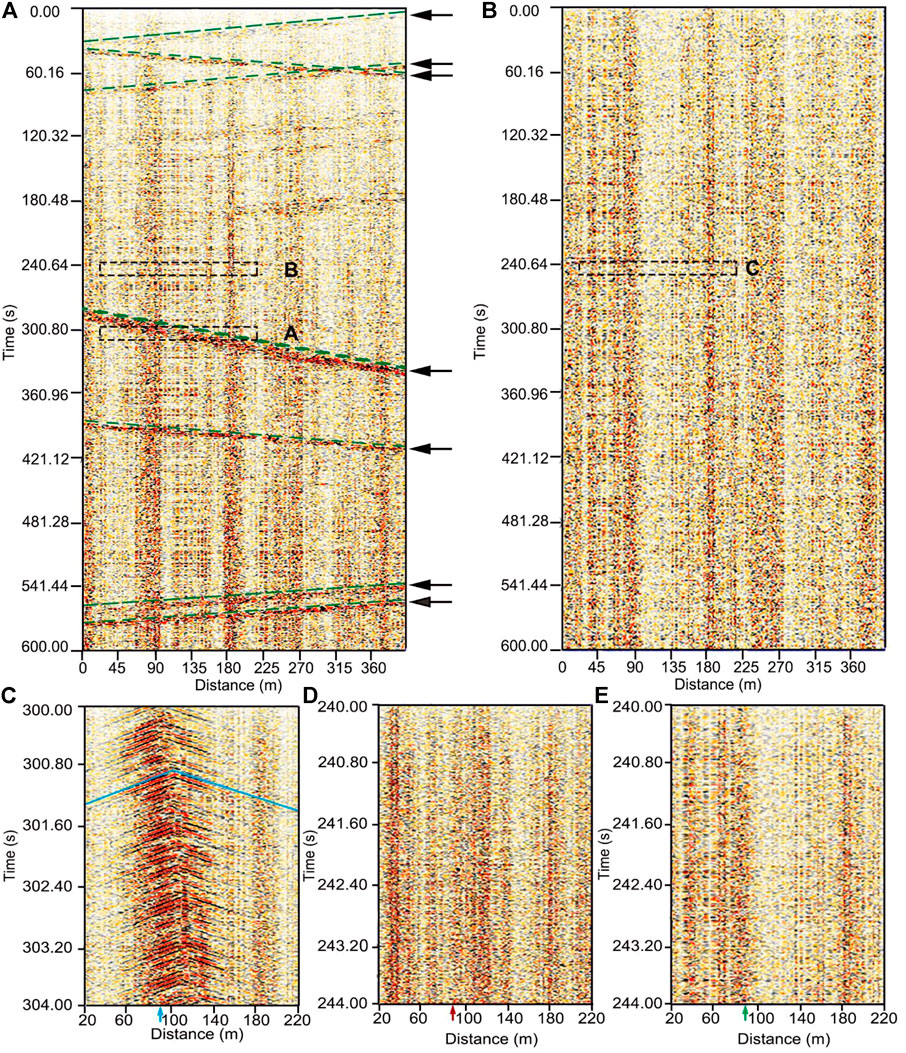
FIGURE 2. (A) Seismic data recorded by DAS line during 10 min of heavy road traffic. The black arrows indicate the vehicle-related seismic event and the green dashed lines indicate their slopes. (B) Seismic data recorded by DAS line during 10 min without road traffic. (C–E) The zoomed-in view of data indicated by the rectangles labeled A-B in (A) and labeled C in (B). The color arrows indicate the locations of seismic waveforms and amplitude spectra in Panel 3. The blue lines in (C) represent the propagation velocity of wavefield excited by the vehicle.
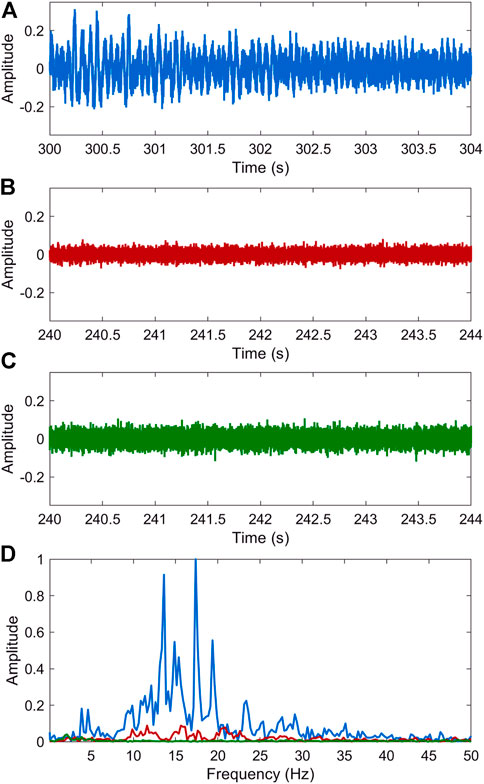
FIGURE 3. (A–C) Normalized waveforms of the traces at the locations indicated by the color arrows in Panel 2C-E. (D) Amplitude spectra of the traces in (A–C).
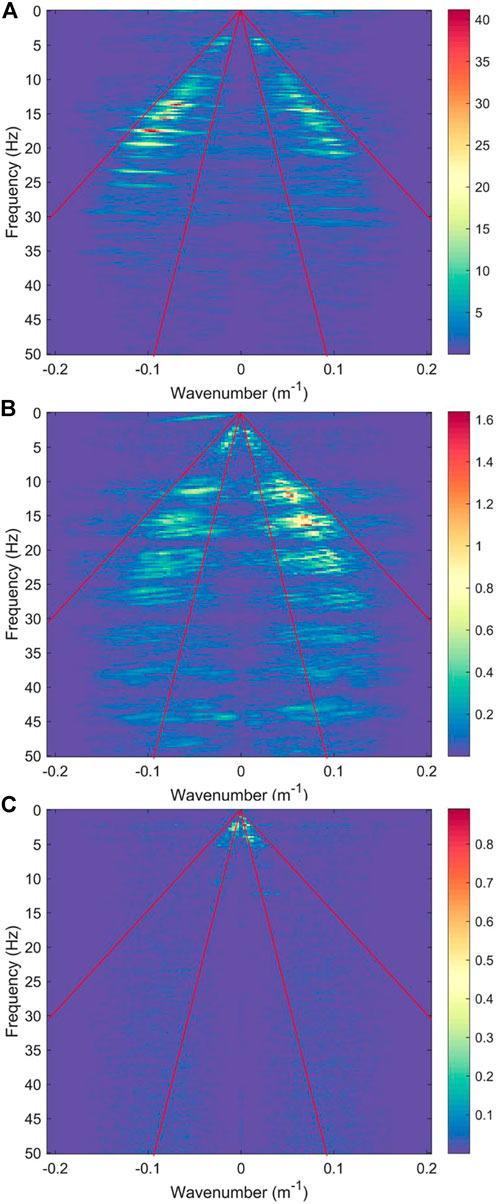
FIGURE 4. (A–C) F-K analyses of the DAS data in Panel 2C-E.
Based on the analysis, surface waves are reconstructed by seismic interferometry using 1 h of continuous records, during which busy vehicles were moving along the road. The raw noise data are first preprocessed by a series of methods summarized in Bensen et al. (2007). They are then cut into segments with a length of 1 minute. Then, all the 1-min segments are removed mean and linear trend and are bandpass filtered to 5–25 Hz, followed by the one-bit normalization and spectral whitening Figure 5.

FIGURE 5. Ray diagram sketch of surface waves reconstruction by seismic interferometry.
Methods
Surface waves reconstruction using seismic interferometry
Seismic interferometry is used to reconstruct surface waves from continuous records, which has attracted wide attention in active and passive seismic data processing and imaging (Wang et al., 2009, 2010; Halliday et al., 2015; Shao et al., 2021; Zeng et al., 2022). Based on the reciprocity theorem of correlation type, the basic equation for seismic interferometry in the time domain is given as follows (Wapenaar, 2004):
where
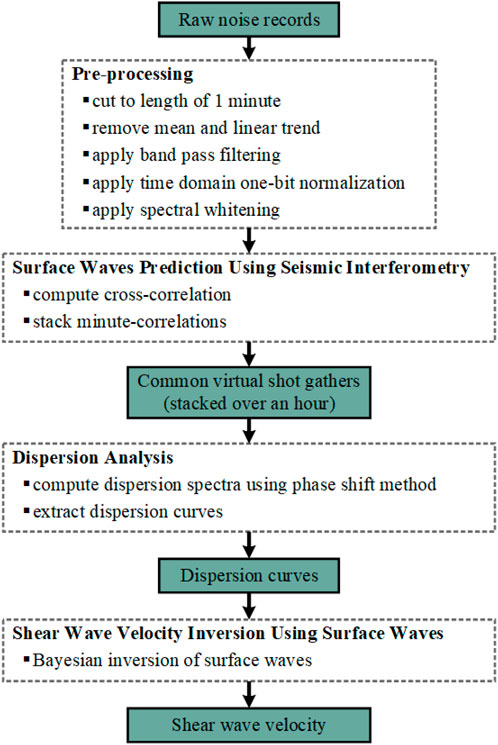
FIGURE 6. Workflow of shear wave velocity inversion using traffic noise.
Shear wave velocity inversion using surface waves
After surface waves are reconstructed by seismic interferometry, dispersion analysis is implemented by the phase shift method due to its advantages in robustness and computational efficiency (Dal Moro et al., 2003). Then dispersion curves are extracted. Finally, the shear wave velocity is calculated by dispersion curves inversion using a Bayesian Markov Chain Monte Carlo (MCMC) method (Malinverno, 2002). The inversion problem is recast as a problem of statistical inference in the MCMC method. The Bayesian posterior probability density of the shear velocity model
where
The construction of the likelihood function and the prior probability density are the main components of the Bayesian inversion. The former measures how well the forward data fits the observed data, and the latter expresses the current prior knowledge about the model. The likelihood function
where
Assumed that the shear wave velocity model is uniformly distributed in a fixed range, the prior probability density is given as follows:
where
Finally, the posterior probability density is obtained by combining Eqs 3, 4 in Eq.2. The task of Bayesian inversion then is to evaluate the complete posterior probability density
where
Results
The processing workflow of shear wave velocity inversion using traffic noise is summarized in Figure 6. The reconstructed wavefields by seismic interferometry show surface waves with clear dispersive effects, as shown in the virtual shot gathers at different locations in Figure 7. Because the virtual traces at the far offset have a low signal-to-noise ratio (SNR), a window function is applied to the virtual shot gathers to extract the high SNR data at the near offset. Thereafter, dispersion spectra are calculated from the windowed data, and the multi-mode dispersion curves can be picked, as shown in Figure 8. However, the picked first-order mode dispersion curves in some virtual shot gathers are not reliable, as shown in Figures 7A,E,F. In addition, the picked surface wave dispersion curves from the virtual shot gathers at different positions show similar shapes, especially for the fundamental mode. This verifies the correct identification of multi-mode surface waves.
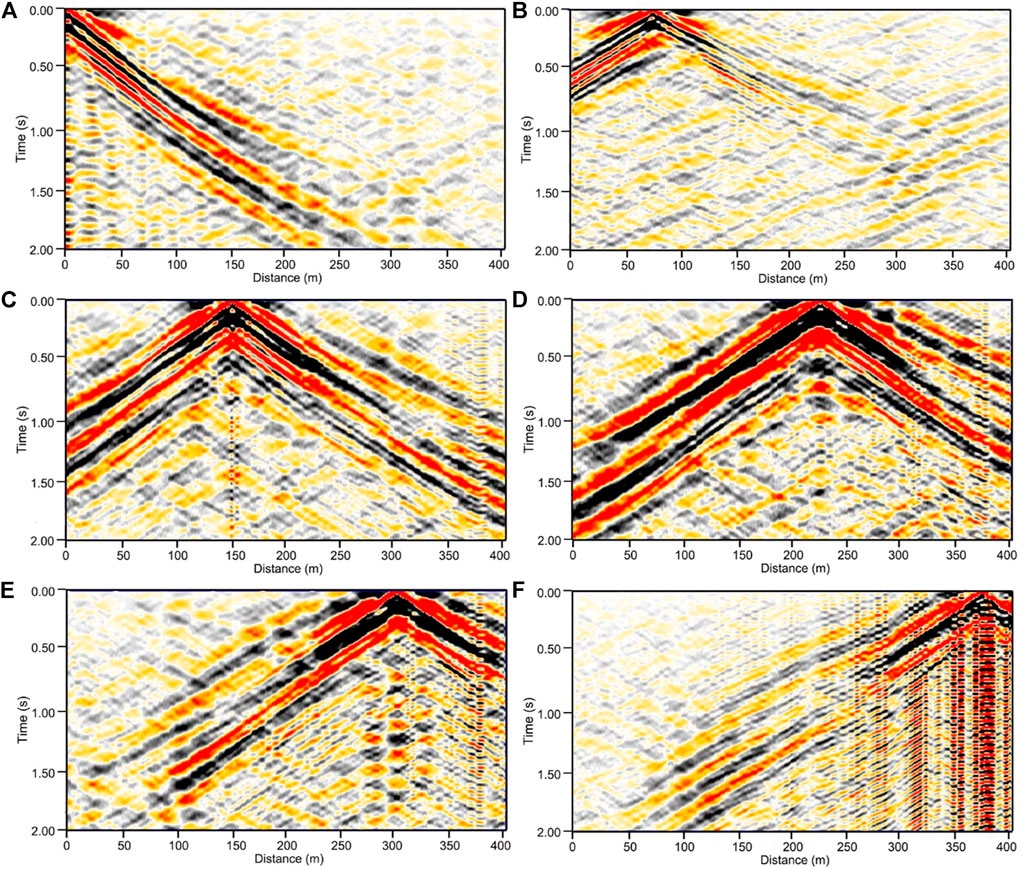
FIGURE 7. The virtual shot gather with a virtual source at (A) 2.5 m, (B) 77.5 m, (C) 152.5 m, (D) 227.5 m, (E) 302.5 m, and (F) 377.5 m.
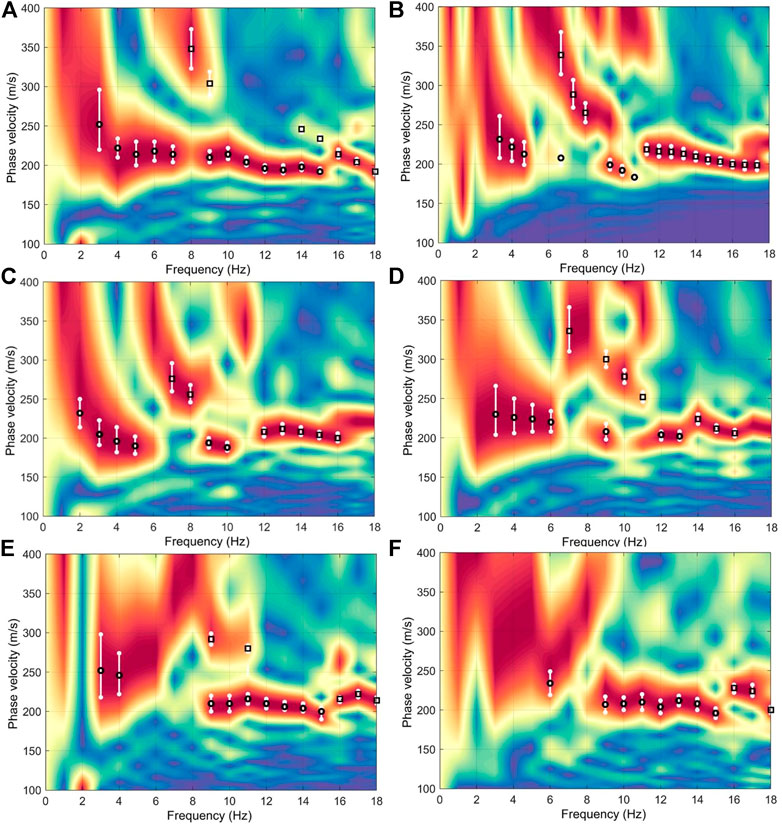
FIGURE 8. (A–F) Dispersion spectrum and the extracted dispersion curve from data in Figures 7A–F. The picked fundamental and first-order mode dispersion curves are respectively indicated by circles and rectangles.
Different from a commonly used 2D array in the passive survey, a linear array was implemented in this study considering the limited space in the urban city. This regular 1D acquisition geometry may cause artifacts in the phase velocity maps inverted by a surface wave tomography method because of the nonuniform ray coverage related to the acquisition layout (Barone et al., 2021). In addition, the subsurface structure in the study area mainly consists of horizontal layers. Therefore, we invert the 2D velocity profile using a 1D inversion scheme of multichannel analysis of surface wave (Park et al., 2007; Morton et al., 2021). This method inverts a 1D velocity from the dispersion curve picked from a virtual shot gather. Then 1D velocities inverted from all the virtual shot gathers are assembled to build a 2D velocity. We consider only the fundamental mode for the dispersion curve inversion due to the unreliability of first-order mode. Figure 9 shows the dispersion curve inversion results of the fundamental mode in Figure 8. The forward dispersion curves shown by the blue lines in Figure 10 are calculated using the best inverted velocities in Figure 9, which fits well with the picked dispersion curves (shown by the solid circles in Figure 10). The final 2D velocity profile along the DAS line is shown in Figure 11. We compared the final velocity profile with the prior geological information in the study site to validate the result. The previous study shows that the quaternary deposits in the study area include the Holocene and Pleistocene sequences (Zhao et al., 2019). Boundaries of the Holocene-Upper Pleistocene, the Upper-Middle Pleistocene, and the Middle-Lower Pleistocene are respectively located at depths of 17.35, 57.20 and 75.60 m. These stratigraphic boundaries are approximately consistent with those in the inverted velocity, as shown in the color bar in Figure 11.
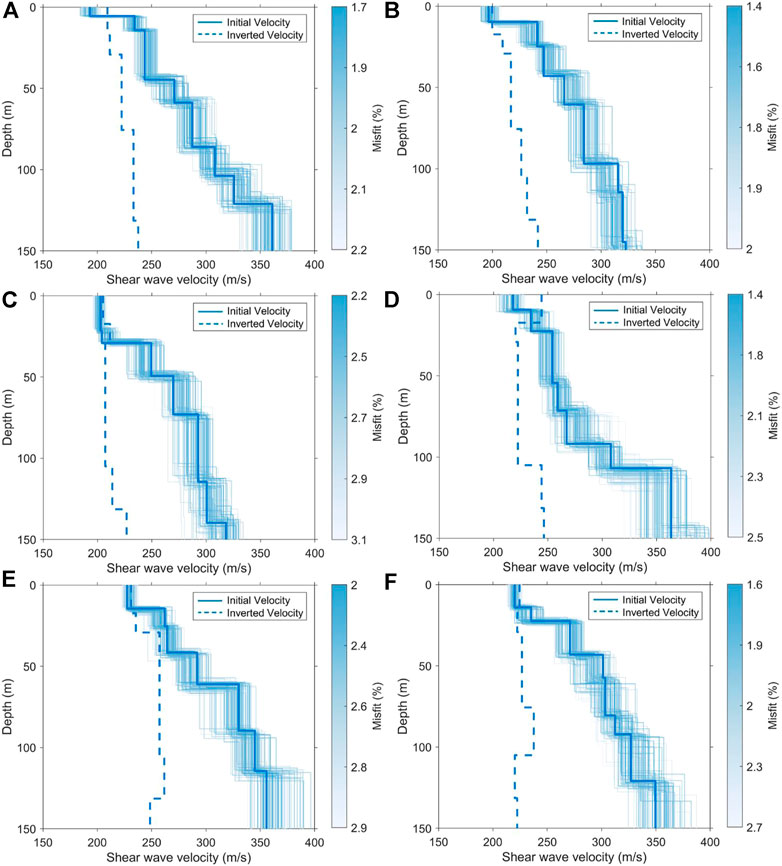
FIGURE 9. (A–F) The inverted 1D shear wave velocities using the fundamental mode dispersion curves in Figures 8A–F.
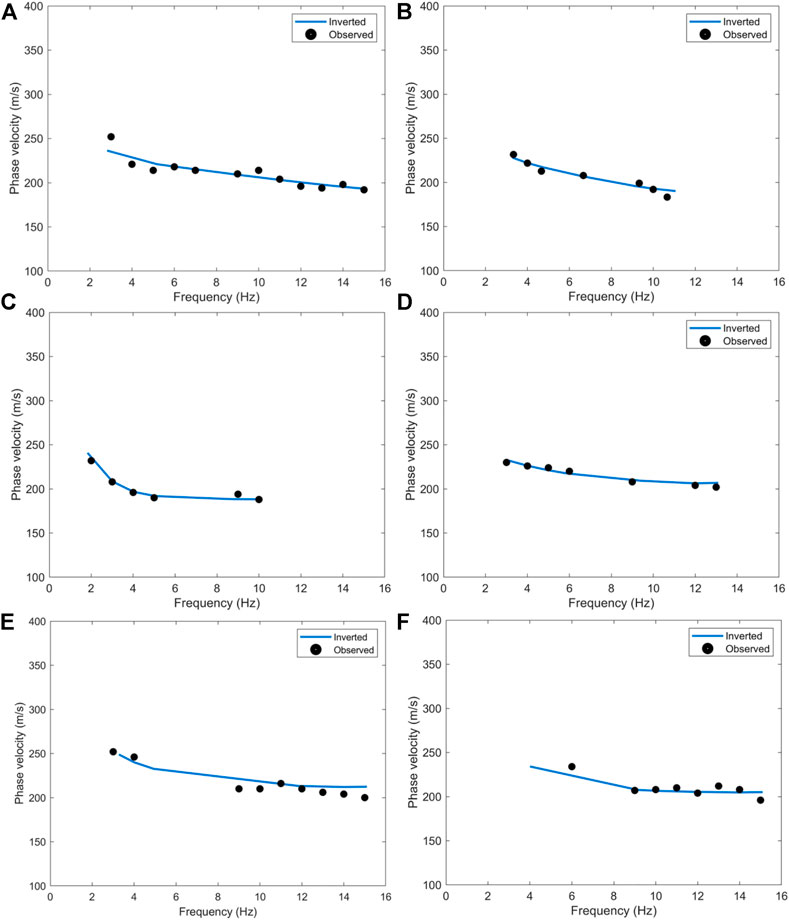
FIGURE 10. (A–F) The fit of the forward fundamental-mode dispersion curve using the inverted velocity in Figures 9A–F to the picked one in Figures 8A–F.
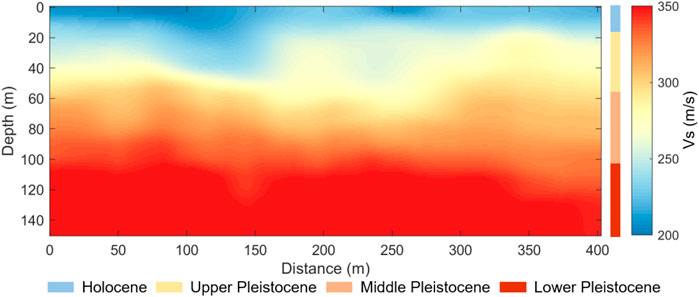
FIGURE 11. The 2D shear wave velocity profile along the DAS line. The color bar indicates the depths of key horizons according to the prior geological information in the study area.
Discussion
We have demonstrated the feasibility of near-surface characterization using urban traffic noise recorded by DAS. Compared with the conventional geophones, DAS has obvious advantages in high-density sampling, which can provide a high-resolution subsurface structure. In addition, the convenient deployment of DAS makes it stand out in the near-surface characterization of urban cities and other harsh environment. However, different from the particle displacement or velocity measurement of geophones, DAS measures the strain or strain rate. This leads to the difference between the interferometric wavefield obtained from the geophone and DAS data according to the representation theorem defined by different physical quantities (velocity and strain) (Paitz, et al., 2019). Therefore, the dynamic information (waveform) of velocity and strain wavefield are obviously different. This difference should be considered for near-surface characterization using a full waveform inversion method for velocity wavefield. On the other hand, the kinematic information of the velocity and strain wavefield are similar. Therefore, the dispersion curves extracted from the two wavefields may reveal similar near-surface velocity (Martin, et al., 2015; Song, et al., 2021b). The dispersion curve inversion method for geophone data is applicable to DAS data.
Conclusion
We present the near-surface characterization in this study using traffic noise seismic data acquired by a DAS line deployed along the road in the urban city. Seismic surface waves are extracted from the traffic noise data using seismic interferometry. Compared with the common natural sources, the traffic noise source exhibits strong energy and can provide a wider frequency range. Finally, the near-surface shear wave velocity structure along the DAS line is obtained by surface wave dispersion curves inversion using a Bayesian Markov Chain Monte Carlo method. The inverted velocity agrees well with the geological structure in the study area. The results demonstrate that traffic noise can be regarded as a powerful and effective tool for high-resolution near-surface characterization in the urban city, especially when combining the DAS technique with the unused telecommunication networks in the city.
Data availability statement
The datasets presented in this article are not readily available because it is still being used for scientific research. Requests to access the datasets should be directed to the corresponding author.
Author contributions
JS and YW studied the method, processed the data and wrote the manuscript. YZ, YY, SW, ZY, and QX acquired the data underlying this study. All authors discussed the results and contributed to the final manuscript.
Funding
This study was funded by the CAS Project for Young Scientists in Basic Research (Grant No. YSBR-020) and the National Key R&D Program of China (Grant No. 2021YFA0716800).
Conflict of interest
The authors declare that the research was conducted in the absence of any commercial or financial relationships that could be construed as a potential conflict of interest.
Publisher’s note
All claims expressed in this article are solely those of the authors and do not necessarily represent those of their affiliated organizations, or those of the publisher, the editors and the reviewers. Any product that may be evaluated in this article, or claim that may be made by its manufacturer, is not guaranteed or endorsed by the publisher.
References
Barone, I., Kästle, E., Strobbia, C., and Cassiani, G. (2021). Surface wave tomography using 3D active-source seismic data. Geophysics 86 (1), EN13–EN26. doi:10.1190/geo2020-0068.1
Bensen, G. D., Ritzwoller, M. H., Barmin, M. P., Levshin, A. L., Lin, F., Moschetti, M. P., et al. (2007). Processing seismic ambient noise data to obtain reliable broad-band surface wave dispersion measurements. Geophys. J. Int. 169 (3), 1239–1260. doi:10.1111/j.1365-246x.2007.03374.x
Bobylev, N., and Sterling, R. (2016). Urban underground space: A growing imperative. Tunn. Undergr. space Technol. 55, 1–4. doi:10.1016/j.tust.2016.02.022
Dal Moro, G., Pipan, M., Forte, E., and Finetti, I. (2003). Determination of Rayleigh wave dispersion curves for near surface applications in unconsolidated sediments. Seg. Tech. Program Expand. Abstr. 22, 1247–1250. doi:10.1190/1.1817508
Daley, T. M., Miller, D. E., Dodds, K., Cook, P., and Freifeld, B. M. (2016). Field testing of modular borehole monitoring with simultaneous distributed acoustic sensing and geophone vertical seismic profiles at Citronelle, Alabama. Geophys. Prospect. 64 (5), 1318–1334. doi:10.1111/1365-2478.12324
Fang, G., Li, Y. E., Zhao, Y., and Martin, E. R. (2020). Urban near-surface seismic monitoring using distributed acoustic sensing. Geophys. Res. Lett. 47 (6), e2019GL086115. doi:10.1029/2019gl086115
Halliday, D., Bilsby, P., West, L., Kragh, E., and Quigley, J. (2015). Scattered ground‐roll attenuation using model‐driven interferometry. Geophys. Prospect. 63 (1), 116–132. doi:10.1111/1365-2478.12165
Lei, Y. H., Yin, F., Hong, H. T., Li, Y. L., and Wang, B. S. (2021). Shallow structure imaging using higher-mode Rayleigh waves based on FJ transform in DAS observation. Chin. J. Geophys. 64 (12), 4280–4291. doi:10.6038/cjg2021P0438
Ma, Z., and Qian, R. (2020). Overview of seismic methods for urban underground space. Interpretation 8 (4), SU19–SU30. doi:10.1190/int-2020-0044.1
Malinverno, A. (2002). Parsimonious Bayesian Markov chain Monte Carlo inversion in a nonlinear geophysical problem. Geophys. J. Int. 151 (3), 675–688. doi:10.1046/j.1365-246x.2002.01847.x
Martin, E., Ajo-Franklin, J., Lindsey, N., Daley, T., Freifeld, B., Robertson, M., et al. (2015). Applying interferometry to ambient seismic noise recorded by a trenched distributed acoustic sensing array. SEP 158, 247–254.
Morton, S. L., Ivanov, J., Peterie, S. L., Miller, R. D., and Livers-Douglas, A. J. (2021). Passive multichannel analysis of surface waves using 1D and 2D receiver arrays. Geophysics 86 (6), EN63–EN75. doi:10.1190/geo2020-0104.1
Paitz, P., Edme, P., Gräff, D., Walter, F., Doetsch, J., Chalari, A., et al. (2021). Empirical investigations of the instrument response for distributed acoustic sensing (DAS) across 17 octaves. Bull. Seismol. Soc. Am. 111 (1), 1–10. doi:10.1785/0120200185
Paitz, P., Sager, K., and Fichtner, A. (2019). Rotation and strain ambient noise interferometry. Geophys. J. Int. 216 (3), 1938–1952. doi:10.1093/gji/ggy528
Park, C. B., Miller, R. D., Xia, J., and Ivanov, J. (2007). Multichannel analysis of surface waves (MASW) - active and passive methods. Lead. edge 26 (1), 60–64. doi:10.1190/1.2431832
Parker, T., Shatalin, S., and Farhadiroushan, M. (2014). Distributed Acoustic Sensing - a new tool for seismic applications. First break 32 (2), 61–69. doi:10.3997/1365-2397.2013034
Shao, J., Wang, Y. B., and Chang, X. (2021). Radon domain interferometric interpolation of sparse seismic data. Geophysics 86 (5), WC89–WC104. doi:10.1190/geo2020-0878.1
Shinohara, M., Yamada, T., Akuhara, T., Mochizuki, K., and Sakai, S. I. (2022). Performance of seismic observation by distributed acoustic sensing technology using a seafloor cable off Sanriku, Japan. Front. Mar. Sci. 466, 844506. doi:10.3389/fmars.2022.844506
Song, Z. H., Zeng, X. F., and Thurber, C. H. (2021a). Surface-wave dispersion spectrum inversion method applied to Love and Rayleigh waves recorded by distributed acoustic sensing. Geophysics 86 (1), EN1–EN12. doi:10.1190/geo2019-0691.1
Song, Z. H., Zeng, X. F., Xie, J., Bao, F., and Zhang, G. B. (2021b). Sensing shallow structure and traffic noise with fiber-optic internet cables in an urban area. Surv. Geophys. 42, 1401–1423. doi:10.1007/s10712-021-09678-w
Von der Tann, L., Sterling, R., Zhou, Y., and Metje, N. (2020). Systems approaches to urban underground space planning and management–A review. Undergr. Space 5 (2), 144–166. doi:10.1016/j.undsp.2019.03.003
Walter, F., Gräff, D., Lindner, F., Paitz, P., Köpfli, M., Chmiel, M., et al. (2020). Distributed acoustic sensing of microseismic sources and wave propagation in glaciated terrain. Nat. Commun. 11 (1), 2436. doi:10.1038/s41467-020-15824-6
Wang, B. S., Zeng, X. F., Song, Z. H., Li, X. B., and Yang, J. (2021). Seismic observation and subsurface imaging using an urban telecommunication optic-fiber cable. Chin. Sci. Bull. 66, 2590–2595. doi:10.1360/tb-2020-1427
Wang, Y. B., Dong, S., and Xue, Y. W. (2009). “Surface waves suppression using interferometric prediction and curvelet domain hybrid L1/L2 norm subtraction,”the 2009 SEG Annual Meeting, Houston, Texas, October 25 2009, 3292–3296.
Wang, Y., Dong, S., and Luo, Y. (2010). Model-based interferometric interpolation method. Geophysics 75 (6), WB211–WB217. doi:10.1190/1.3505816
Wapenaar, K., Draganov, D., Snieder, R., Campman, X., and Verdel, A. (2010). Tutorial on seismic interferometry: Part 1—basic principles and applications. Geophysics 75 (5), 75A195–75A209. doi:10.1190/1.3457445
Wapenaar, K. (2004). Retrieving the elastodynamic Green's function of an arbitrary inhomogeneous medium by cross correlation. Phys. Rev. Lett. 93 (25), 254301. doi:10.1103/physrevlett.93.254301
Wathelet, M. (2005).Array recordings of ambient vibrations: Surface-wave inversion. PhD Diss. Belgium: Liége University, 161.
Williams, E. F., Fernández-Ruiz, M. R., Magalhaes, R., Vanthillo, R., Zhan, Z., González-Herráez, M., et al. (2019). Distributed sensing of microseisms and teleseisms with submarine dark fibers. Nat. Commun. 10 (1), 5778. doi:10.1038/s41467-019-13262-7
Zeng, X., Thurber, C. H., Wang, H. F., Fratta, D., and Feigl, K. L. (2022). “High-resolution shallow structure at Brady Hot Springs using ambient noise tomography (ANT) on a trenched distributed acoustic sensing (DAS) array,” in Distributed Acoustic Sensing in Geophysics: Methods and Applications. Editor Y. Li (New York, NY: John Wiley & Sons), 101–110.
Zhan, Z. (2020). Distributed acoustic sensing turns fiber-optic cables into sensitive seismic antennas. Seismol. Res. Lett. 91 (1), 1–15. doi:10.1785/0220190112
Zhang, Y. H., Li, Y. E., Zhang, H., and Ku, T. (2019). Near-surface site investigation by seismic interferometry using urban traffic noise in Singapore. Geophysics 84 (2), B169–B180. doi:10.1190/geo2017-0798.1
Keywords: fiber-optic distributed acoustic sensing, near-surface characterization, urban traffic noise, seismic interferometry, Surface wave
Citation: Shao J, Wang Y, Zheng Y, Yao Y, Wu S, Yang Z and Xue Q (2022) Near-surface characterization using urban traffic noise recorded by fiber-optic distributed acoustic sensing. Front. Earth Sci. 10:943424. doi: 10.3389/feart.2022.943424
Received: 13 May 2022; Accepted: 07 July 2022;
Published: 08 August 2022.
Edited by:
Fenglin Niu, Rice University, United StatesReviewed by:
Hongrui Qiu, Massachusetts Institute of Technology, United StatesYang Zhao, China University of Petroleum, Beijing, China
Copyright © 2022 Shao, Wang, Zheng, Yao, Wu, Yang and Xue. This is an open-access article distributed under the terms of the Creative Commons Attribution License (CC BY). The use, distribution or reproduction in other forums is permitted, provided the original author(s) and the copyright owner(s) are credited and that the original publication in this journal is cited, in accordance with accepted academic practice. No use, distribution or reproduction is permitted which does not comply with these terms.
*Correspondence: Yibo Wang, d2FuZ3lpYm9AbWFpbC5pZ2djYXMuYWMuY24=