 Donghui Xing
 Yiren Fan4
 Cheng Lu
95% of researchers rate our articles as excellent or good
Learn more about the work of our research integrity team to safeguard the quality of each article we publish.
Find out more
ORIGINAL RESEARCH article
Front. Earth Sci. , 26 July 2022
Sec. Sedimentology, Stratigraphy and Diagenesis
Volume 10 - 2022 | https://doi.org/10.3389/feart.2022.942895
This article is part of the Research Topic Gas Hydrate Appearance Accumulation, Exploration and Exploitation in Continental Margins - Volume 2 View all 15 articles
Langgu Depression is a mature oil and gas exploration area with complicated lithological and physical properties. The varying formation fluid, low-resistivity hydrocarbon-bearing reservoirs, and non-uniform logging series greatly increase the difficulty of gas reservoir identification. The Monte Carlo method is employed to simulate the neutron–gamma logging responses to gas saturation and the influential factors. According to the result, a new gas identification chart eliminating the influence of porosity and formation water salinity is proposed to identify gas reservoirs in the old wells. At the same time, a fluid factor extracted from array acoustic logging and core measurement data is sensitive to the development of gas-bearing layers and useful for the identification of gas reservoirs in the new wells with array acoustic logging. The field examples show that the new combined method greatly improves the ability to identify gas-bearing layers and works well in old well reexamination and new well interpretation.
Langgu Depression is a mature oil and gas exploration area located in the Bohai Bay Basin, China. As a typical complex reservoir involving fault blocks, it is one of the main gas-bearing depressions in the North China Oilfield. With sediments transported from multiple sources, its sedimentary facies zones changed rapidly, and the glutenite migrated drastically in both vertical and horizontal directions, resulting in high anisotropy. Due to the development of the fault blocks, its structure and the relationship between water and oil are very complicated, and the logging response characteristics of different reservoirs are indistinguishable. All of these factors make it hard to determine the development of gas reservoirs correctly (Song et al., 2006; Liu et al., 2012; Zhou et al., 2013).
The identification of gas reservoirs is one of the most important and challenging tasks of formation evaluation, especially in heterogeneous formations with complex minerals, detrital clays, and varying salinity of formation fluid. In spite of this, quite a few achievements have been made in the research on gas reservoirs. Moreover, a great number of methods for identifying gas-bearing layers have been proposed based on the conventional and new logging techniques. These methods include overlapping or cross-plot of log curves (Krief et al., 1990; Brie et al., 1995; Freedman et al., 1998), reservoir reconstruction through the inversion of logging curves (Zhang et al., 2009; Tan et al., 2013), quantitative determination of gas saturation and direct hydrocarbon indicators (DHI) based on elastic and pore space modulus (Hedlin, 2000; Dillon et al., 2003), and selection of parameters sensitive to gas-bearing reservoirs (Goodway et al., 1997; Sun et al., 2000; Xu et al., 2014; Fan et al., 2015). With the continuous development of information processing technology, a number of mathematical methods and intelligent algorithms, including wavelet transform, fuzzy cluster analysis, neural network, and grey modeling, have been widely used in fluid identification (Shi, 2008; Shi et al., 2016; Azudin et al., 2018; Zhang et al., 2018; Zhao et al., 2018). These gas identification methods have achieved good results in practice, and each method has the corresponding suitable formation conditions. In view of the characteristics of Langgu Depression, a gas identification method that can be used under the local formation and logging conditions is urgently needed.
In this study, based on the response characteristics for gas-bearing reservoirs in different logging series, a new gas identification chart is presented to improve the applicability of neutron–gamma logging in gas identification in the old wells. At the same time, an array acoustic logging fluid factor sensitive to the development of gas layer is introduced to identify gas-bearing reservoirs in the new wells where the array acoustic logging technique is widely used.
Mainly developed in middle segment of the Shahejie Formation, Langgu Depression is a porous sandstone reservoir with complex lithology and pore structure. Laboratory tests of 90 rock core samples extracted from the field show that the average value of porosity and permeability is 27.4% and 1220 mD, respectively (Figure 1). Previous studies show that the distribution of low-resistivity oil and gas zone, controlled by structure and sedimentation, is regular and random at the same time. In this mature field, different well logging methods are used at different stages of exploration and development. Some wells drilled in the early period of exploration only have acoustic and neutron–gamma logging curves, while in newer wells completed in recent years, the latest logging technologies, such as array acoustic, NMR, and electrical imaging, are used.
These logging methods have achieved certain effects in the identification of gas-bearing reservoirs, but due to high content of shale and calcium carbonate, the effective porosity and the response of well logging curves to gas decrease greatly. In addition, the vertical distributions of formation fluid chemical and dynamical properties change radically, with formation fluid salinity varying from 1,000 ppm to more than 20,000 ppm. The complex and variable formation fluid characteristics and mud invasion make it difficult to identify the low-resistivity gas layers using resistivity logging. Furthermore, the non-uniform combinations of logging methods used at different stages of exploration and development also increase the difficulty of gas reservoir identification both in old well reexamination and in new well interpretation.
Neutron–gamma logging is often used to identify gas layers because the count rate is sensitive to the presence of gas reservoirs. However, the count rate is greatly affected by two factors, namely, porosity and chloride ion content. The neutron–gamma count rate varies with reservoir porosity, and chlorine, which has a larger capture cross-section than water and gas, may cause the neutron–gamma count rate to increase in reservoirs with high-salinity formation fluid. These factors make it more difficult to determine the development of gas reservoirs with neutron–gamma logging.
To address the aforementioned problems, the response of neutron–gamma logging to gas saturation and the influential factors were studied using the Monte Carlo simulation. Based on the simulation results, a new gas identification chart considering the effects of porosity and formation fluid salinity was developed to improve the ability to identify gas reservoirs, especially in the old wells with very limited logging curves.
As an advanced simulation method, the Monte Carlo method can be used to simulate the transport process of continuous energy particles, such as neutrons, photons, and electrons, in arbitrarily shaped media by establishing the corresponding calculation models. Due to its advantages including simple structure and strong adaptability, it is widely used in nuclear industry, medicine, and other fields (Briesmeister, 2000). In the area of nuclear logging, the Monte Carlo method is widely used to simulate the attenuation of neutrons in different media and determine the efficiency and response of detectors, playing an important role in the theoretical and practical research on nuclear logging (Zhang and Liu, 2014).
In this study, the Monte Carlo method is employed to simulate the transport process of neutrons in various formations, especially in gas reservoirs, and to study the relationship between the gamma-ray count rate and formation conditions. The simulation model is built based on the Monte Carlo N-Particle Transport Code (MCNP) with the specifications given below.
The borehole (20 cm in diameter) includes a casing and a 3-cm–thick cement sheath, and is filled with fresh water. The formation is filled with formation water and 0.2 g/cc CH4. The radius is set to 10–70 cm and height to 140 cm. Two detectors are provided for simulation. The distance between the neutron source and the near detector is 30 cm, and the distance between the neutron source and the far detector is 60 cm (Figure 2).
In the aforementioned simulation model, the formation is a gas-saturated sandstone formation filled with water. When porosity is 0%, 10%, 20%, 30%, and 40%, the level of gas saturation is set to 100%, 80%, 60%, 40%, 20%, and 0% to simulate the neutron capture gamma-ray count rate. The relationship between neutron capture gamma-ray count rate and porosity at different levels of gas saturation is analyzed. The results are shown in Figure 3.
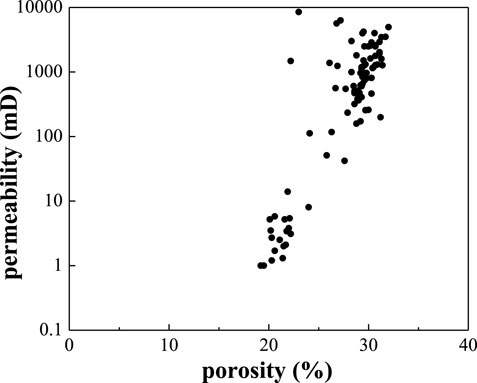
FIGURE 1. Porosity and permeability of 90 cores extracted from Langgu Depression.
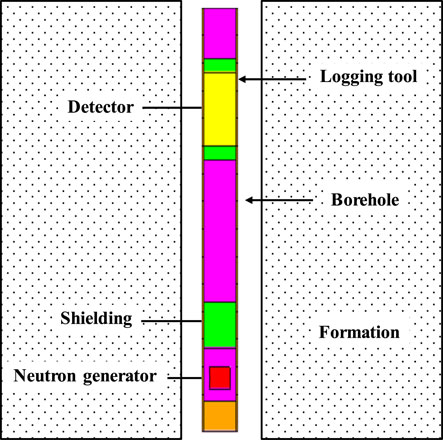
FIGURE 2. MCNP simulation model.
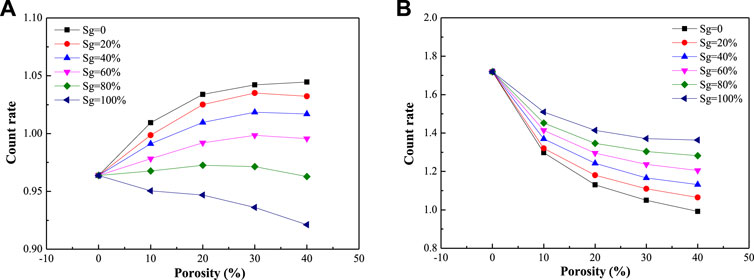
FIGURE 3. Relationship between neutron capture gamma-ray count rate and porosity at various levels of gas saturation. (A) Near detector. (B) Far detector.
The curves in Figure 3 show that the neutron capture gamma-ray count rate measured by the far detector increases almost linearly with the increase in gas saturation, while the gamma-ray count rate measured by the near detector decreases almost linearly with the increase in gas saturation.
The same simulation model with water-saturated sandstone formation is used. When porosity is 0%, 10%, 20%, 30%, and 40%, formation fluid salinity is set to 0, 2,000, 5,000, 10,000, 20,000, and 100,000 ppm, respectively. The relationship between neutron capture gamma-ray count rate and porosity at different levels of formation fluid salinity is analyzed based on the simulation. The results are shown in Figure 4 and Table 1.
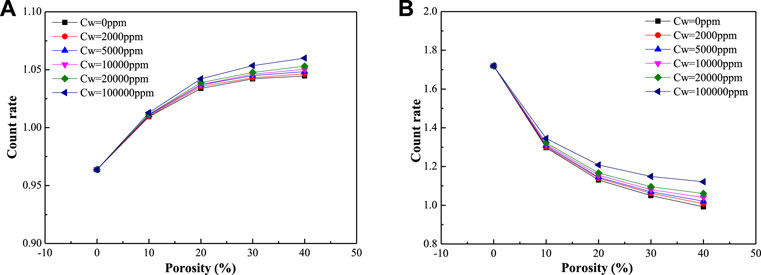
FIGURE 4. Relationship between neutron capture gamma-ray count rate and porosity at different levels of formation fluid salinity. (A) Near detector. (B) Far detector.
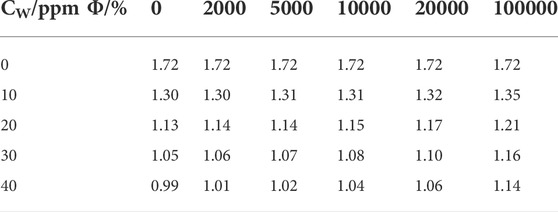
TABLE 1. Results of the MC simulation with far detector.
As shown in Figure 4, the neutron capture gamma-ray count rate measured by the far detector decreases with the increase in hydrogen index (porosity), while the gamma-ray count rate measured by the near detector increases with the increase in hydrogen index. The neutron capture gamma-ray count rates measured by both the near and the far detectors increase almost linearly with the increase in formation fluid salinity. The data in Table 1 also indicate that in addition to hydrogen index (porosity), formation water salinity is also an important factor affecting the neutron capture gamma-ray count rate. This is because chlorine, which has a larger capture cross-section than water and gas, can result in higher neutron–gamma count rates in reservoirs with high-salinity formation fluids. For this reason, it is difficult to identify gas reservoirs in the formations where the distributions of porosity and formation fluid salinity are complex.
A new gas identification chart is developed based on the simulation results. A new parameter △NG1 is defined as △NG1 = △NG/Φ, which means the ratio between the difference in neutron–gamma count rate per unit porosity between target layers and mudstone layers. △NG is defined as △NG = NG-NG0, that is, the difference in the neutron–gamma count rate between target layers (NG) and mudstone layers (NG0). △NG1 is set as the X-axis of the gas identification chart and formation water salinity is set as the Y-axis. The points of gas layers appear in different parts of this chart depending on the levels of gas saturation and formation fluid salinity.
The data of 51 well test layers in 22 old wells from neutron–gamma logging and formation water analysis were used to make the gas identification chart (Figure 5). The points of gas layers in the study area, where the gamma-ray count rate is higher and which are mostly concentrated in the top section of the cross-plot, are obviously different from those of non-gas layers. The dividing line rises upward as formation fluid salinity increases, which is consistent with the result of MCNP simulation.
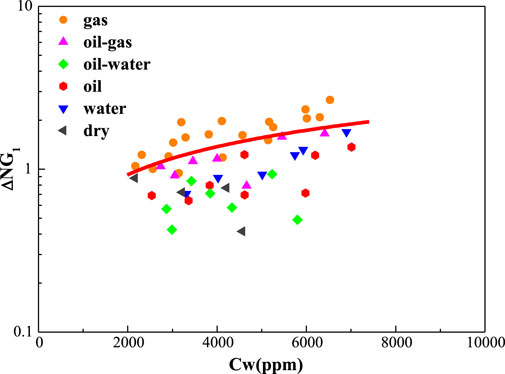
FIGURE 5. New gas identification chart.
The new gas identification chart is used to evaluate reservoirs based on well logs in Langgu Depression. One of the results is presented in Figure 6. Well A1 is one of the wells used for old well reexamination. Neutron–gamma logging is an important method that can be used because the available logging curves from old wells are limited. The reservoirs are sandstone formations with high density and low porosity. Layer #125 is a tight sandstone reservoir with porosity of about 10%. The value of △NG1 in layer #125 is about 2.4, and the formation fluid salinity is 4650 ppm. Using the new gas identification chart, we interpret this layer as a gas layer, and this interpretation result is identical with the well test result, indicating that neutron–gamma logging is effective in the discovery and evaluation of such gas layers.
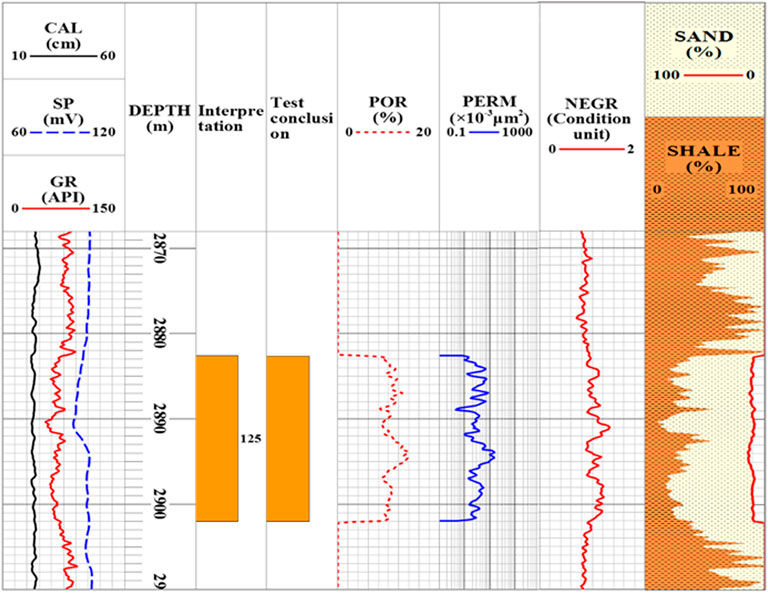
FIGURE 6. Result of gas reservoir prediction with neutron–gamma logging in well A1.
The great advances in exploration technology enable more new logging methods, such as array acoustic logging, to be widely used in new wells. Array acoustic logging can obtain information on the solid matrix and the acoustic velocity of the formation fluid because it is not affected by the salinity of the formation fluid. More importantly, by combining it with conventional logging data, we can obtain the elastic mechanical parameters that are sensitive to gas-bearing layers. These parameters can be used to identify and evaluate gas reservoirs. In this study, a method based on fluid factor is derived to improve the ability to identify gas reservoirs in new wells with array acoustic logging curves.
Biot and Gassmann identified the relationship between the Lame’s coefficients and bulk modulus for saturated and dry rocks (Biot, 1941; Gassmann, 1951)
where
where
By substituting Eqs 3, 4 into Eq. 2, the following equation can be obtained (Mavko et al., 2009):
The term
It can be simplified into the following:
where
As discussed earlier, the equation for P-wave velocity Vp of the rock can be combined with dry-skeleton term s and fluid/porosity term f. Using these two terms, the equation P- and S-wave impedances, ZP and ZS, can be rewritten as follows:
Assuming that
where
Many research studies have been conducted to get an estimate of c. Murphy et al. (1993) found that the average value of Kdry/μ ratio for clean quartz sandstones with different porosities was 0.9, in which the value of c is 2.233. Zhang et al. (2015) measured the P- and S-wave velocity for 75 dry sandstones with different porosities and found that the value of c was 2.324. The P- and S-wave velocities of 44 rock core samples taken from Langgu Depression were measured under saturated and dry conditions to find the suitable value of c in this area. The measurement results are shown in Figure 7. From Figure 7, it can be seen that the ratio of P- and S-wave velocity of dry rock cores is mainly within the range of 1.4 to 1.6, and the average value is 1.54. The ratio of Vp/Vs of saturated rock cores is affected by the porosity, and its value increases as porosity increases. Table 1 shows the average value of Vp/Vs and other elastic parameters of the 44 rock core samples. It can be seen from Table 2 that the value of c for samples taken from Langgu Depression is 2.375.
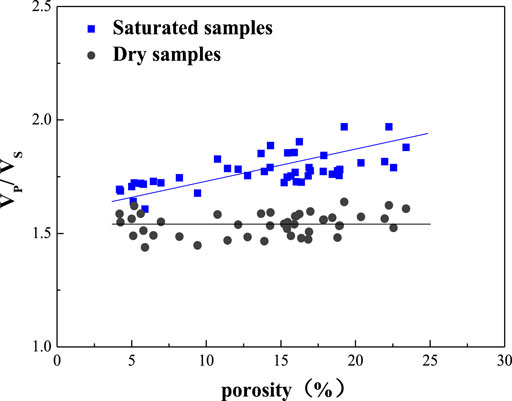
FIGURE 7. Plot of P- and S-wave velocity vs. porosity.
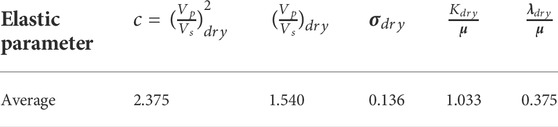
TABLE 2. Elastic constant ratios of dry cores.
The data of array acoustic logging and density logging of 53 well test layers in 19 new wells were used to calculate fluid factor and Vp/Vs. The results are shown in Figure 8. Figure 8 shows that the points of gas layers are mostly concentrated in the lower left corner of the cross-plot and are obviously different from those of non-gas layers, and the values of Vp/Vs and fluid factor of gas layers are smaller than those of non-gas layers. Most of the fluid factors of gas layers are less than 15, and those of non-gas layers are greater than 15. Therefore, the fluid factor’s value of 15 is taken as the dividing line between gas and non-gas layers.
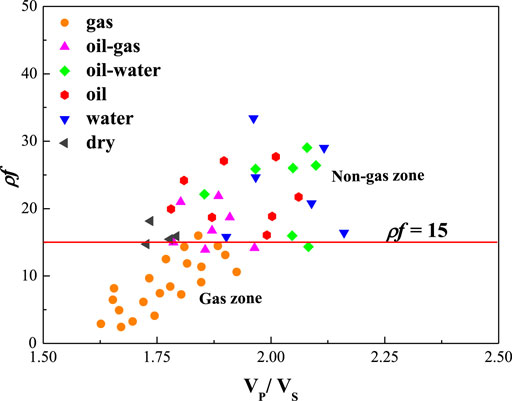
FIGURE 8. Plot of
The fluid factor was used to identify gas layers in the new wells in which array acoustic logging was carried out. Taking well B1 (Figure 9) in the study area as an example, the first track includes the caliper (CAL), self-potential (SP), and natural gamma (GR), which can reflect the wellbore conditions and the reservoir’s lithology. Track 2 displays the well depth of logs. Track 7 contains the compensated neutron (CNL), density (DEN), and acoustic log (AC), which could provide estimates of the reservoir’s physical properties, such as porosity (track 5) and permeability (track 6). Track 8 shows high-definition array induction logs, which are commonly used to evaluate the properties of reservoir fluid. We can obtain the value of fluid factor
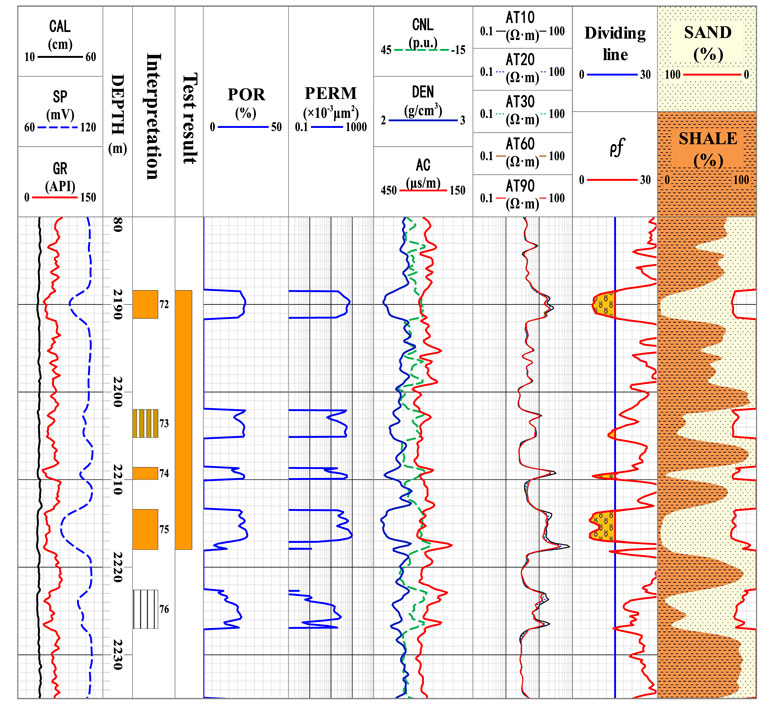
FIGURE 9. Result of gas reservoir prediction with array acoustic logging in well B1.
The target tight reservoir in Figure 9 can be divided into five sandstone layers, represented by different icons in track 3. The three layers, 72, 74, and 75, have high porosity and permeability and are characterized by low density, high neutron, and high resistivity. In particular, the value of
Neutron–gamma logging is an important method to identify gas layers in old well reexamination due to the limited logging data. However, the results of Monte Carlo simulations show that the capture neutron–gamma ray count rate is significantly influenced by hydrogen index (porosity) and water salinity. Therefore, the new gas identification chart is proposed to eliminate the influences of porosity and formation water salinity.
Array acoustic logging is widely used in new wells, and the fluid factor extracted from it is a good method for gas layer identification in conventional oil and gas fields. In recent years, more and more attention has been paid to natural gas hydrate and its associated gas reservoirs (Boswell and Collett, 2011; Yin et al., 2016; Xie et al., 2022). As a number of NGH reservoirs are present either with a gas layer or water layer, there are similar properties to conventional oil and gas reservoirs in the associated gas reservoirs. Therefore, it is possible for fluid factor to be used in the identification of NGH-associated gas reservoirs under certain circumstances, which needs further study.
Neutron capture gamma-ray count rate is significantly affected by hydrogen index (porosity) and formation fluid salinity. The new gas identification chart based on neutron–gamma logging can effectively eliminate the effects of porosity and formation fluid salinity and perform well in identifying gas reservoirs, especially in the old wells with limited conventional logging curves.
The fluid factor extracted from array acoustic logging and core measurement data is sensitive to the presence of gas-bearing layers. The new gas identification standard based on the fluid factor is a good way for identifying gas reservoirs in the new wells with array acoustic logging.
The new combined method improves the ability to identify gas-bearing layers and the accuracy of prediction of such layers both in old wells reexamination and in new wells interpretation. It has delivered good results in complex sandstone reservoir such as Langgu Depression and can be used to provide reference for the evaluation of gas reservoirs in other areas.
The original contributions presented in the study are included in the article/Supplementary Material, and further inquiries can be directed to the corresponding author.
DX, YF, HoL, and CL conceived the method. HuL and YD contributed to the interpretation of the results. DX wrote the manuscript with support from PZ. All authors provided critical feedback and helped shape the research, analysis, and manuscript.
This work was supported by the Key Special Project for Introduced Talents Team of Southern Marine Science and Engineering Guangdong Laboratory (Guangzhou) (GML2019ZD0105), the Guangzhou Science and Technology Project (202201011463), the National Natural Science Foundation of China (No. 51991365), and the China Geological Survey Project (Nos. DD20211350 and DD20221700).
The authors would like to thank Quanying Zhang from College of Geophysics and Petroleum Resources, Yangtze University, for his warm help in the Monte Carlo simulation.
PZ was employed by the Changqing Oilfield Company. HuL and YD were employed by the PetroChina Huabei Oilfield Company.
The remaining authors declare that the research was conducted in the absence of any commercial or financial relationships that could be construed as a potential conflict of interest.
All claims expressed in this article are solely those of the authors and do not necessarily represent those of their affiliated organizations, or those of the publisher, the editors, and the reviewers. Any product that may be evaluated in this article, or claim that may be made by its manufacturer, is not guaranteed or endorsed by the publisher.
Azudin, Y. M., Augustine, A., Afeez, G., Radzuan, J., and Azza, A. (2018). Uncertainty analysis of hydrocarbon in place calculation using 3D seismic and well data during appraisal stage – case study of goldie field, offshore sarawak. J. Nat. Gas. Sci. Eng. 57, 238–265. doi:10.1016/j.jngse.2018.06.038
Biot, M. A. (1941). General theory of three-dimensional consolidation. J. Appl. Phys. 12, 155–164. doi:10.1063/1.1712886
Boswell, R., and Collett, T. S. (2011). Current perspectives on gas hydrate resources. Energy Environ. Sci. 4 (4), 1206–1215. doi:10.1039/c0ee00203h
Brie, A., Pampuri, F., Marsala, A., and Meazza, O. (1995). “Shear sonic interpretation in gas-bearing sands,” in SPE annual technical conference and exhibition, Dallas, Texas, October 22–25, 1995. doi:10.2118/30595-MS
Briesmeister, J. F. (2000). MCNP – a general Monte Carlo N-particle transport Code. Los Alamos Natl. Lab. Report number: LA-13709-M. doi:10.1016/j.cclet.2011.04.015
Dillon, L., Schwedersky, G., Vásquez, G., Velloso, R., and Nunes, C. (2003). A multiscale DHI elastic attributes evaluation. Lead. Edge 22 (10), 1024–1029. doi:10.1190/1.1623644
Fan, Y., Xing, D., Deng, S., Li, R., and Ge, X. (2015). Acoustic properties of low permeability cores and its application to reservoir gas predication. Xinan Shiyou Daxue Xuebao/Journal Southwest Pet. Univ. 51 (1), 1–9. doi:10.11885/j.issn.1674-5086.2013.08.11.07
Freedman, R., Minh, C. C., Gubelin, G., J, F. J., Mc Ginness, T., Terry, B., et al. (1998). “Combining nmr and density logs for petrophysical analysis in gas-bearing formations,” in SPWLA 39th annual logging symposium, Keystone, Color, 26-28 May.
Gassmann, F. (1951). Uber die Elastizitat poroser Medien [On the Elasticiy of porous Media]. Zürich: Inst. für Geophysik an der ETH.
Goodway, B., Chen, T., and Downton, J. (1997). Improved AVO fluid detection and lithology discrimination using Lamé petrophysical parameters; “λρ”,“μρ”,& “λ/μ fluid stack”, from P and S inversions. SEG Technical Program Expanded Abstracts 1997. doi:10.1190/1.1885795
Hedlin, K. (2000). Pore space modulus and extraction using AVO. SEG Technical Program Expanded Abstracts 2000. doi:10.1190/1.1815749
Krief, M., Garat, J., Stellingwerf, J., and Ventre, J. (1990). A petrophysical interpretation using the velocities of P and S waves (full-waveform sonic). Log. Anal. 31 (6), 355–369.
Liu, H., Jiang, Z., Zhang, R., and Zhou, H. (2012). Gravels in the daxing conglomerate and their effect on reservoirs in the oligocene Langgu depression of the Bohai Bay Basin, North China. Mar. Pet. Geol. 29, 192–203. doi:10.1016/j.marpetgeo.2011.07.010
Mavko, G., Mukerji, T., and Dvorkin, J. (2009). The rock physics handbook. Tools for seismic analysis of porous media. Statewide Agricultural Land Use Baseline 2015. Cambridge: Cambridge University Press. doi:10.1192/bjp.182.2.123
Murphy, W., Reischer, A., and Hsu, K. (1993). Modulus decomposition of compressional and shear velocities in sand bodies. Geophysics 58, 227–239. doi:10.1190/1.1443408
Russell, B. B. H., Hedlin, K., Hilterman, F. J., and Lines, L. R. L. (2003). Fluid-property discrimination with AVO: A biot-gassmann perspective. Geophysics 68, 29–39. doi:10.1190/1.1543192
Shi, G. R. (2008). Superiorities of support vector machine in fracture prediction and gassiness evaluation. Petroleum Explor. Dev. 35, 588–594. doi:10.1016/S1876-3804(09)60091-4
Shi, Y., Pan, B., Jiang, B., Zhnag, H., Yang, X., Guo, Y., et al. (2016). Application of wavelet analysis in identification of tight sandstone gas reservoirs. Earth Sci. 41 (12), 2127–2135. doi:10.3799/dqkx.2016.148
Song, R. C., Zhang, S. N., Dong, S. Y., Zhou, W., Fu, H., Ren, W. B., et al. (2006). “An analysis of the characteristic and controlling factors of the Paleogene glutenite fan in the actic area of the Langgu depression,” in J. Chengdu Univ. Technol. (Sci. Technol. Ed.), 33, 587–592. doi:10.1007/s11104-008-9888-6
Sun, X., Shi, Y., and Jiang, Y. (2000). Log interpretation method for low permeability sandstone gas reservoir of Changqing gas field. Petroleum Explor. Dev. 27 (5), 115–118.
Tan, F., Li, H., Sun, Z., Yu, X., and Ouyang, M. (2013). Identification of natural gas fractured volcanic formation by using numerical inversion method. J. Pet. Sci. Eng. 108, 172–179. doi:10.1016/j.petrol.2013.02.004
Xie, Y., Lu, J., Cai, H., Deng, W., Kuang, Z., Wang, T., et al. (2022). The in-situ NMR evidence of gas hydrate forming in micro-pores in the Shenhu area, South China Sea. Energy Rep. 8, 2936–2946. doi:10.1016/j.egyr.2022.01.097
Xu, C., Ma, P., Lai, L., Sun, Y., and Li, Z. (2014). Sensitivity parameters of tight sand gas: A case study of lower cretaceous yingcheng formation of yingtai gas field in songliao basin, NE China. Petroleum Explor. Dev. 41, 778–783. doi:10.1016/S1876-3804(14)60092-6
Yin, Z., Chong, Z., Tan, H., and Linga, P. (2016). Review of gas hydrate dissociation kinetic models for energy recovery. J. Nat. Gas Sci. Eng. 35, 1362–1387. doi:10.1016/j.jngse.2016.04.050
Zhang, F., and Liu, J. (2014). Monte Carlo simulation of PGNAA system for determining element content in the rock sample. J. Radioanal. Nucl. Chem. 299, 1219–1224. doi:10.1007/s10967-013-2858-3
Zhang, H., Shi, Y., Zhang, P., Fan, Y., Yang, X., and Li, H. (2015). Identification of low permeability sandstone gas reservoir based on the DSI. Well Logging Technol. 39 (5), 591–595.
Zhang, J., Zhang, H., Li, Y., Zheng, C., and Li, Z. (2009). Gas-bearing prediction on tight sandstone gas reservoirs of Xujiahe formation in south Sichuan basin. Nat. Gas. Ind. 29 (1), 45–47. doi:10.3787/j.issn.1000-0976.2009.01.011
Zhang, Q., Zhang, F., Liu, J., Wang, X., Chen, Q., Zhao, L., et al. (2018). A method for identifying the thin layer using the wavelet transform of density logging data. J. Pet. Sci. Eng. 160, 433–441. doi:10.1016/j.petrol.2017.10.048
Zhao, P., Cai, J., Huang, Z., Huang, Z., and Mehdi Ostadhassan, Ran F. (2018). Estimating permeability of shale-gas reservoirs from porosity and rock compositions. Geophysics 83 (5), MR283–MR294. doi:10.1190/geo2018-0048.1
Zhou, L., Cao, Y., Xi, K., Zhao, X., Jin, F., and Dong, X. (2013). Characteristics and genetic mechanism of low-permeability reservoirs of the 4th member of Shahejie formation in Hexiwu structural zone of Langgu sag. J. China Univ. Petroleum Ed. Nat. Sci. 37 (3), 8–16. doi:10.3969/j.issn.1673-5005.2013.03.002
Keywords: well logging, gas reservoir identification, neutron–gamma logging, array acoustic logging, Biot–Gassmann function
Citation: Xing D, Fan Y, Lu H, Lu C, Zhang P, Li H and Ding Y (2022) A combined method for gas-bearing layer identification in a complex sandstone reservoir. Front. Earth Sci. 10:942895. doi: 10.3389/feart.2022.942895
Received: 13 May 2022; Accepted: 29 June 2022;
Published: 26 July 2022.
Edited by:
Jinan Guan, Guangzhou Institute of Energy Conversion (CAS), ChinaReviewed by:
Peiqiang Zhao, China University of Petroleum, ChinaCopyright © 2022 Xing, Fan, Lu, Lu, Zhang, Li and Ding. This is an open-access article distributed under the terms of the Creative Commons Attribution License (CC BY). The use, distribution or reproduction in other forums is permitted, provided the original author(s) and the copyright owner(s) are credited and that the original publication in this journal is cited, in accordance with accepted academic practice. No use, distribution or reproduction is permitted which does not comply with these terms.
*Correspondence: Donghui Xing, eGluZ2RoMTI2QDEyNi5jb20=
Disclaimer: All claims expressed in this article are solely those of the authors and do not necessarily represent those of their affiliated organizations, or those of the publisher, the editors and the reviewers. Any product that may be evaluated in this article or claim that may be made by its manufacturer is not guaranteed or endorsed by the publisher.
Research integrity at Frontiers
Learn more about the work of our research integrity team to safeguard the quality of each article we publish.