 Beatriz Martínez Montesinos1*
 Manuel Titos Luzón2
 Laura Sandri1Oleksandr Rudyy3Alexey Cheptsov3Giovanni Macedonio4Arnau Folch5,6
 Sara Barsotti2Jacopo Selva1
 Antonio Costa1
- 1Istituto Nazionale di Geofisica e Vulcanologia, Bologna, Italy
- 2Icelandic Met Office, Reykjavík, Iceland
- 3High-Performance Computing Center Stuttgart, Stuttgart, Germany
- 4Istituto Nazionale di Geofisica e Vulcanologia, Naples, Italy
- 5Barcelona Supercomputing Center, Barcelona, Spain
- 6Geociencias Barcelona (GEO3BCN), CSIC, Barcelona, Spain
For active volcanoes, knowledge about probabilities of eruption and impacted areas becomes valuable information for decision-makers to develop short- and long-term emergency plans, for which probabilistic volcanic hazard assessment (PVHA) is needed. High-resolution or spatially extended PVHA requires extreme-scale high-performance computing systems. Within the framework of ChEESE (Center of Excellence for Exascale in Solid Earth; www.cheese-coe.eu), an effort was made to generate exascale-suitable codes and workflows to collect and process in some hours the large amount of data that a quality PVHA requires. To this end, we created an optimized HPC-based workflow coined PVHA_HPC-WF to develop PVHA for a volcano. This tool uses the Bayesian event tree methodology to calculate eruption probabilities, vent-opening location(s), and eruptive source parameters (ESPs) based on volcano history, monitoring system data, and meteorological conditions. Then, the tool interacts with the chosen hazard model, performing a simulation for each ESP set or volcanic scenario (VS). Finally, the resulting information is processed by proof-of-concept-subjected high-performance data analytics (HPDA) scripts, producing the hazard maps which describe the probability over time of exceeding critical thresholds at each location in the investigated geographical domain. Although PVHA_HPC-WF can be adapted to other hazards, we focus here on tephra (i.e., lapilli and ash) transport and deposition. As an application, we performed PVHA for Campi Flegrei (CF), Italy, an active volcano located in one of the most densely inhabited areas in Europe and under busy air traffic routes. CF is currently in unrest, classified as being in an attention level by the Italian Civil Protection. We consider an approximate 2,000 × 2,000 × 40 km computational domain with 2 km grid resolution in the horizontal and 40 vertical levels, centered in CF. To explore the natural variability and uncertainty of the eruptive conditions, we consider a large number of VSs allowing us to include those of low probability but high impact, and simulations of tephra dispersal are performed for each of them using the FALL3D model. Results show the potential of HPC to timely execute a vast range of simulations of complex numerical models in large high-resolution computational domains and analyze great volumes of data to obtain quality hazard maps.
1 Introduction
Volcanic eruptions can cause a wide variety of hazardous phenomena, with impacts ranging from proximal to global scales. For instance, during explosive eruptions (Newhall and Hoblitt, 2002; Jenkins et al., 2014), volcanoes can inject large volumes of fragmented pyroclasts (tephra), which disperse into the atmosphere under the effects of turbulence and prevailing winds, and deposit up to thousands of km from the volcano (Martin and Nemeth, 2007). Pyroclasts can range in size from several cm to a few µm. Depending upon their size, they can persist in the atmosphere for a few seconds or for several days and can represent a serious threat when an eruption occurs near inhabited areas or to air traffic routes in very distal regions. The finest fraction of tephra (i.e., PM10, with a diameter smaller than 10 µm) can be inhaled by humans and animals, and the fraction with a diameter smaller than 4 µm (called respirable) can be breathed into the alveolar region of the lung and has the greatest toxic potential (Horwell and Baxter, 2006). Exposure to high concentrations of fine tephra can have serious implications for human health and represents a serious hazard to consider in the presence of explosive volcanoes (Damby et al., 2013). Eventually, tephra fallout may affect a variety of infrastructures that are essential for our daily lives all over the world. Examples are the road network, where a few-mm thick tephra deposit can create dangerous driving conditions (Blake et al., 2017); power plants and powerline transmissions (Wilson et al., 2012); transportation systems in general (Guffanti et al., 2010); contamination of water reservoirs and vegetation (Ágústsdóttir, 2015); telecommunication networks (Wilson et al., 2012). The adverse effect of volcanic ash (i.e., tephra smaller than 2 mm in size) on aircraft gas turbine engines is well known (Prata and Tupper, 2009; Chen and Zhao, 2015) and recently described more quantitatively (Clarkson et al., 2016). Fine ash can travel for thousands of km, extending the potential impact of explosive eruptions beyond borders and continents.
The quantification of tephra hazard is particularly relevant for volcanoes located close to large urban centers and/or to air traffic routes; the Neapolitan area in Southern Italy is one of those. Field-based hazard maps obtained from the study of the deposits of past eruptions and the eruptive history of specific volcanoes represent important information to assess volcanic hazards (Lirer et al., 2001; Alberico et al., 2002; Orsi et al., 2004). However, since volcanic processes are complex, that is, governed by many degrees of freedom (the number of independent parameters that define their state), their outcome is intrinsically unpredictable in terms of temporal occurrence and eruption parameters. For this reason, a probabilistic approach, that is able to integrate the uncertainty due to intrinsic stochasticity (aleatory uncertainty) and due to our limited knowledge of chemical-physical processes and system conditions (epistemic uncertainty), is more suitable than a deterministic approach, where randomness or uncertainty are not considered (Budnitz et al., 1997; Bonadonna et al., 2005; Macedonio et al., 2008; Marti et al., 2008; Neri et al., 2008; Folch et al., 2009; Marzocchi et al., 2010; Biasse et al., 2014; Marzocchi and Jordan, 2014; Barsotti et al., 2018; Selva et al., 2018; Marzocchi et al., 2021). PVHA is indeed the main tool for hazard and risk mitigation plans, as well as the main input to quantitative risk assessment (Spence et al., 2004; Zuccaro, 2008; Jenkins et al., 2014). Depending on the application, PVHA may be performed in the long-term by forecasting the hazard over long time windows (e.g., 50 years) as well as in the short-term by forecasting the hazard over shorter time windows (e.g., few hours). Long-term PVHA is the primary tool for long-term mitigation actions like evacuation plans or regulatory aspects of buildings (Marzocchi et al., 2008, 2010), while short-term PVHA (Selva et al., 2014) is more suitable for actions such as evacuation or air traffic management (for example, airport closure and rerouting).
PVHA can be defined as the quantification of the potential impact of a volcanic hazardous phenomenon generated by any possible volcanic eruption, evaluated at specific geographical points around the volcano, and quantified by the exceedance probability of a selected set of thresholds (e.g., tephra load at the ground or ash concentration at flight levels in case of tephra hazard) in a given time window (hours/days for short-term analyses or years/tens-of-years for long-term analyses). This information allows estimation of, for instance, the probability that the tephra deposit accumulated during an eruption exceeds the critical condition that causes building collapse/failure, the probability that the ash cloud concentration exceeds the critical values for flight safety and with what persistence, or the probability that airports or important assets will be affected by the presence of ash (Sulpizio et al., 2012).
The performance of PVHA with physics-based fully resolved numerical models (e.g., FALL3D) is computationally expensive, as it ideally involves thousands to millions of simulation runs exploring the full natural variability of the source (eruption magnitude, intensity, vent position, etc.) and of the propagation conditions (wind distribution), also considering the epistemic uncertainty (alternative databases, alternative models, etc.). This problem has typically been solved by restricting the exploration of natural variability (e.g., with representative scenarios) or simplifying the modeling strategy (e.g., with analytical models or with restricted target grids), potentially introducing unwanted biases in the hazard estimates (Bonadonna et al., 2005; Sandri et al., 2016; Selva et al., 2018).
Advances at the computational level, particularly in high-performance computing (HPC) and high-performance data analytics (HPDA), already permit PVHA in a reasonable time (hours), with a sufficient level of detail to help civil protection officials and society for reliable risk ranking and assessment. Several works have been carried out in this direction. For instance, Folch and Sulpizio (2010) performed a long-term probabilistic assessment of volcanic ash hazard for Somma–Vesuvius (Italy) using a specific range of eruption parameters, and Titos et al. (2022) developed a long-term hazard assessment of ash dispersion at relevant flight levels for Jan Mayen (Norway) exploring a large set of possible combinations of eruptive parameters.
Herein, we present the probabilistic volcanic hazard assessment workflow (PVHA_HPC-WF) developed within the ChEESE project (www.cheese-coe.eu), an optimized numerical tool for developing short-term to long-term PVHA for a specific volcano. We then apply it to the Campi Flegrei caldera (CFc), Italy, considering a wide number of VSs for demonstrating the feasibility and potential usefulness of PVHA_HPC-WF to produce robust and unbiased tephra PVHA for end users such as civil protection agencies, aviation stakeholders, and other scientific institutions. To this end, first, the probabilistic methodology on which this study is based is outlined in Section 2. Section 3, then describes PVHA_HPC-WF in which this methodology is accommodated and illustrates how the workflow manager system light (WMS-light) and the performance optimization and productivity (POP) process have helped to make optimized codes and workflows. The test cases at Campi Flegrei are discussed in Section 4. Finally, the results are discussed, and some conclusions are drawn in Section 5. Although we also briefly explore the volcanological background, this work focuses on the probabilistic and computational methodology.
2 Probabilistic volcanic hazard analysis
The chain of processes leading to a volcanic eruption is complex (Marzocchi et al., 2004, 2008), implying that there are substantial and non-negligible uncertainties, stemming both from the intrinsic natural variability of such processes (so-called aleatory variability) and from the limitations of our models and observations (epistemic uncertainty). Probabilistic volcanic hazard analysis defines a set of variables, called intensity measures X, that describe the intensity of a given hazardous phenomenon h and quantifies the so-called hazard curves θ, which report the probability that X exceeds the interest intensity values (thresholds) x at a specific target point
Statistically, this exceedance probability curve is a survivor function, describing the natural variability of the phenomenon at the site, that is, the aleatory uncertainty.
With the total probability theorem, hazard curves can be evaluated considering the contribution of a set of volcanic scenarios, that is,
where P (ΔT, E) represents the probability of the occurrence of a general event eruption E during the period of time ΔT, and Ω represents the infinite set of possible source (vs) (e.g., magnitude and location) combinations that can be approximated with a finite set of N specific volcanic scenarios. The factor
This representation is possible only if such scenarios represent a set of mutually exclusive and collectively exhaustive representations of the general event E, that is,
which is approximately achieved by using as many randomly selected volcanic configurations as possible within the known ranges for each volcano. This formulation assumes that the probability of observing more than one eruption in ΔT is negligible and, under this condition, it holds for both long- and short-term PVHA.
The hazard curves are often computed conditional on the event E, in which case only the summation in Eq. 1 is evaluated, neglecting the temporal component P (ΔT, E). The obtained conditional volcanic hazard (cVH) curves have direct application to planning short-term risk mitigation actions during a volcanic crisis, such as the definition of evacuation areas.
In all cases, hazard curves are usually quantified on a set of points within the geographic area under study, and hazard/probability maps are produced to show the exceeded thresholds/probability distribution by cutting at a probability/critical-intensity value.
The evaluation of Eq. 1 involves studying the statistics (aleatory uncertainty) of the source (i.e., eruption scenarios) and the propagation of the hazard from the source to the target point (e.g., tephra dispersion). Multiple alternative models can be formulated, leading to alternative quantifications of
2.1 Short-term and long-term probabilistic volcanic hazard assessment
PVHA can be focused on different scales for ΔT depending on the time horizon in which significant variations are expected in the activity of the volcano under study and on the type of potentially risk-reducing actions. We focus here on two different time scales: the short-term (ST) PVHA and the long-term (LT) PVHA. ST PVHA refers to a time window ranging from hours to weeks and is useful for crisis management during volcanic unrest (Sandri et al., 2012; Selva et al., 2014). LT PVHA considers years to decades and is interesting, for example, in the case of a quiescent volcano for land-use planning (Marti et al., 2008; Neri et al., 2008; Selva et al., 2010; Titos et al., 2022). The methods adopted in ST/LT PVHA are inherently linked to different sources of information used to issue an eruption forecast or to model the hazard (Marzocchi et al., 2008). For LT assessments, PVHA mostly relies on the historical and/or geological records of the volcano under study (or from analog volcanoes) and on expert opinion (e.g., Aspinall, 2006), as well as on the statistics for propagation conditions of the hazard we are assessing. For ST assessment, PVHA considers the actual and updated information coming from the monitoring system and other short-term forecast systems (e.g., weather).
Also, the information used to constrain propagation conditions may change for ST and LT PVHA. In the case of tephra hazard, ST and LT PVHAs rely on different information for the wind data: for the former, the present wind forecast is used to run the tephra dispersion model; for the latter, the climatology of wind over tens of years is used instead. This impacts the quantification of p(h,a,ΔT)(X ≥ x|V Si)) in Eq. 1, which in fact explicitly depends on ΔT. Actually, the difference between ST and LT is the potential variability of the wind to be accounted for in the ΔT. In the ST (few days), the possible meteorological scenarios (propagators) are strictly connected to wind forecasts, and only a rather small set of wind scenarios have practically non-zero probability, resulting in a smaller N. As ΔT increases, their variability necessarily increases because we move from forecast to seasonal climatology and finally to annual averages, and N should increase accordingly.
2.2 Probabilistic volcanic hazard assessment through Bayesian event tree analysis
The Bayesian event tree (BET) method can be used to calculate the long- and short-term probabilities of any volcanic phenomena (Eq. 1) by applying a Bayesian inference procedure (Newhall and Hoblitt, 2002; Marzocchi et al., 2004, 2008; Lindsay et al., 2010; Selva et al., 2010, 2014). Using a structured event tree, each volcanic event is represented by an individual branch which splits up into a set of possible subsequent events whose probabilities and uncertainties are estimated from prior information available from the volcanological information obtained from the history of a volcano, empirical and theoretical models, and monitoring observations.
Figure 1A shows a graphical representation of the BET used in this work (Selva et al., 2014). This event tree describes the possible evolution of an eruption in eight steps (nodes). Node 1 indicates the probability of unrest or not unrest within the time interval ΔT, Node 2 gives the probability that, in the case of unrest, it is due to magma or to other causes, and Node 3 provides the probability that, in the case of unrest due to magma, the magma will trigger an eruption or not. The final eruption probability, representing the eruptive forecasting (EF), will then be calculated by a combination of Nodes 1, 2, and 3. Nodes 4 and 5 handle the VSs, dealing with variability in potential vent positions and size, respectively. Node 6 expresses the probability of generating or not generating a specific hazardous phenomenon h, Node 7 expresses the probability to reach or not to reach a site
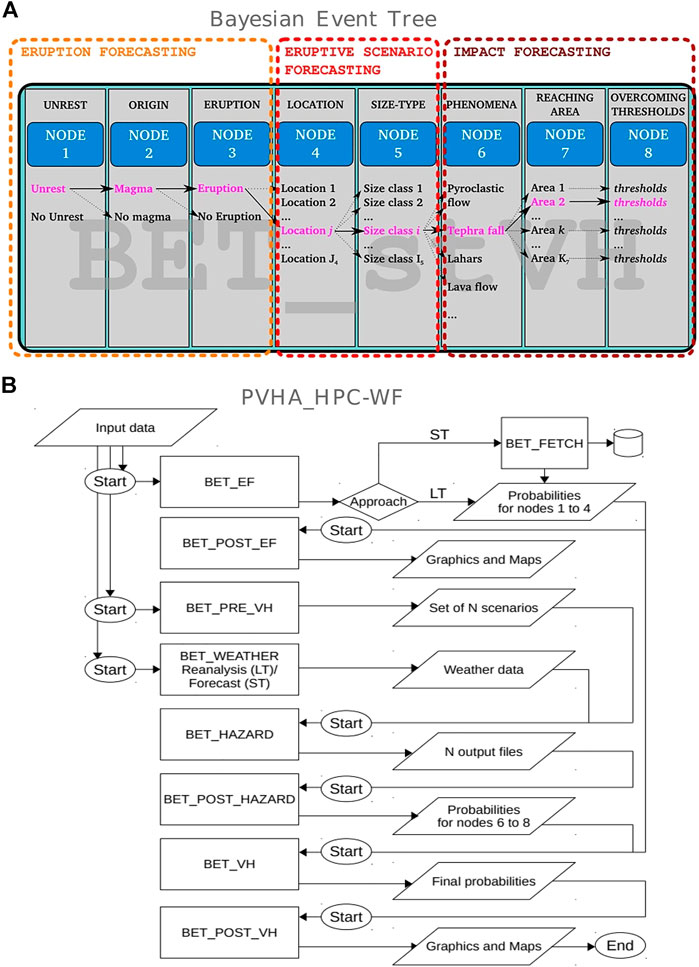
FIGURE 1. (A) Graphical representation of the Bayesian event tree methodology (BET) used in this work [image from Selva et al. (2014)]. (B) Flow diagram of the PVHA_HPC-WF.
The event tree factorizes Eq. 1 into a set of conditional probabilities θi, with i from 1 to 8. The probability at each node is evaluated with a Bayesian method, quantifying the epistemic uncertainty as a distribution for θi, hereinafter indicated as [θi]. In this way, Eq. 1 can be expressed as
where
is the probability that an eruption occurs in the time window ΔT, and X is the random variable that describes the intensity measure associated with the hazard h at the point
A critical role in the definition of PVHA hazard curves through Eqs. 1 and 2 is played by the definition of volcanic scenarios (VSs). A VS is defined as an eruption of a given size in a given vent location. At Nodes 4 and 5, often a generic definition of VS is applied, defining a set of VS classes, each class often modeled with representative scenarios. However, Sandri et al. (2016) demonstrated the importance of modeling the intra-class variability (i.e., eruptive size difference within a class). To this end, it is important to create a consistent stratified sampling of the VSs in order to represent the entire variability of the eruptive source parameters (ESPs). To this end, a four-step procedure may be proposed. First, the possible eruptive size classes may be defined, for example, based on the volcanic explosivity index (VEI) (Newhall and Self, 1982) or preferably on eruption magnitude and intensity (Mason et al., 2004; Pyle, 2015). Each eruptive size class will be characterized by a series of ESPs such as the total erupted mass (TEM), the column height, and the duration of tephra fallout phases, as well as any known parameters that may influence the modeling of the volcanic hazard. The parameters used for the modeling of tephra dispersal by means of FALL3D in Campi Flegrei are listed in Table 2. Such size classes and ESPs will be in turn fully described by probability density functions (PDFs) fixed on the basis of the knowledge of the volcano. Next, within an eruptive size class, a value should be sampled from each ESP’s PDF, characterizing this set as the ESPs of the VS. Then, the vent location has to be estimated from historical or monitoring data. Finally, the propagation conditions (e.g., wind distribution) have to be associated with the VS. For example, for an ST tephra PVHA, the sampled scenarios would be associated with the forecast meteorological conditions, while for an LT tephra PVHA, each scenario would have different weather conditions chosen randomly from the meteorological data of a period of time.
3 Probabilistic volcanic hazard assessment HPC workflow
To accommodate the methodology described in the previous section, we built the software package PVHA_HPC-WF (Probabilistic Volcanic Hazard Assessment HPC Workflow) based on the prototype tool BET@OV (Perfetti et al., 2021). BET@OV was created by researchers at Istituto Nazionale di Geofisica e Vulcanologia (INGV, Italy) to compute eruption forecasting and probabilistic tephra fallout hazard assessment at CFc by combining the Bayesian event tree method and the FALL3D tephra dispersal model (Costa et al., 2006; Folch et al., 2009). In particular, BET@OV was designed to compute 1) the probability of eruption at CFc
3.1 Workflow architecture
PVHA_HPC-WF is made up of a set of Python modules (see Figure 1B) in charge of calculating each of the BET nodes described earlier in Subsection 2.2 as well as performing the post-processing and visualization of results. The workflow tasks are managed by the ChEESE workflow management system WMS-light, and to consolidate the data and keep history, the PostgreSQL LISTEN exchange is used. The next section describes how the workflow is managed by WMS-light and how the optimization has been carried out. A description of each of the Python modules can be found in the Supplementary Material.
3.2 Workflow implementation
The PVHA_HPC-WF is a classic workflow-based application, in which the data-interconnected components are executed in a synchronized order according to the application logic, as depicted in Figure 1B. Running such applications on IT infrastructures, including diverse HPC systems with their distributed computing and storage components or their respective different resource access and application execution strategies, is a challenging task. In practice, running application workflows on the on-demand parallel and distributed infrastructures often impose the following issues:
• Automation of distributed control flow. The workflow components that are running on different parts of the physically distributed infrastructure resources have to employ sophisticated synchronization strategies in order to be able to track the progress of the interdependency of tasks.
• Heterogeneous deployment configurations. Depending on the infrastructure availability and the application’s non-functional requirements, it might be necessary for application components to be executed on different infrastructure sites, which can change from one deployment (execution) to the next one. In such cases, the application will have to deal with different access policies (e.g., certificate-based authorization instead of the user’s login and password), job execution strategies (different job managers like PBS/Torque or SLURM), organization of the storage, and many other site-specific settings that have zero or little relevance to the application itself.
• Distributed data access. The application components are interchained not only by the control but also by the data flow. The data dependencies can be implemented in several different ways, depending on the concrete (and, generally, deployment-specific) properties of the infrastructure resources that are hosting the components, such as with the classic FTP and SCP, but also with the throughput-optimized grid protocols such as GridFTP.
• Dynamic scaling of components. Depending on the availability of the infrastructure resources, the application components might need to scale up or down to saturate the maximal capacity of the assigned hardware in order to increase the performance and/or optimize non-functional properties. As the available resource size might be unknown at the time of the application workflow submission, the scaling has to be performed dynamically at the runtime of the application instance.
In order to address the abovementioned issues during the development and execution of the application workflow, the PVHA_HPC-WF application employs a workflow management system WMS-light, which was developed in the context of the ChEESE project (see a basic introduction in Cheptsov and Beljaev, 2020). WMS-light is a lightweight middleware that supports developers of the application workflows that are to be run in distributed, parallel, and heterogeneous computing environments and have dynamic deployment properties. The WMS-light support generally includes the synchronized execution of components on distributed hosts (serial, parallel, HPC), the realization of data dependencies, and the tracking of execution properties (across several applications and/or their instances) and requires minimal to zero changes in the original application components’ code due to a non-intrusive programming model of WMS-light. Non-intrusiveness is a key property of WMS-light and applies not only to the applications but also to the infrastructure. Unlike the majority of well-established workflow managers, WMS-light requires only a minimal set of software that has to be installed in the user’s space and does not require any special administrative privileges. WMS-light is designed in a modular and highly transparent way (see Figure 2A). The core of WMS-light is constituted by a set of Java components and service bash scripts, which makes it portable to almost any architecture, from a small edge-server to the largest HPC system. All data related to the execution of instances (runs) of the application workflows are stored in the intelligent data layer and made available to the users and system middleware components by means of a rich-functional RESTful web service interface. All specifications, including the workflow definition (see Figure 2Bi), are made in the flexible JSON format. WMS-light allows live-tracking of the workflow execution status for each of the submitted instances (Figure 2Bii).
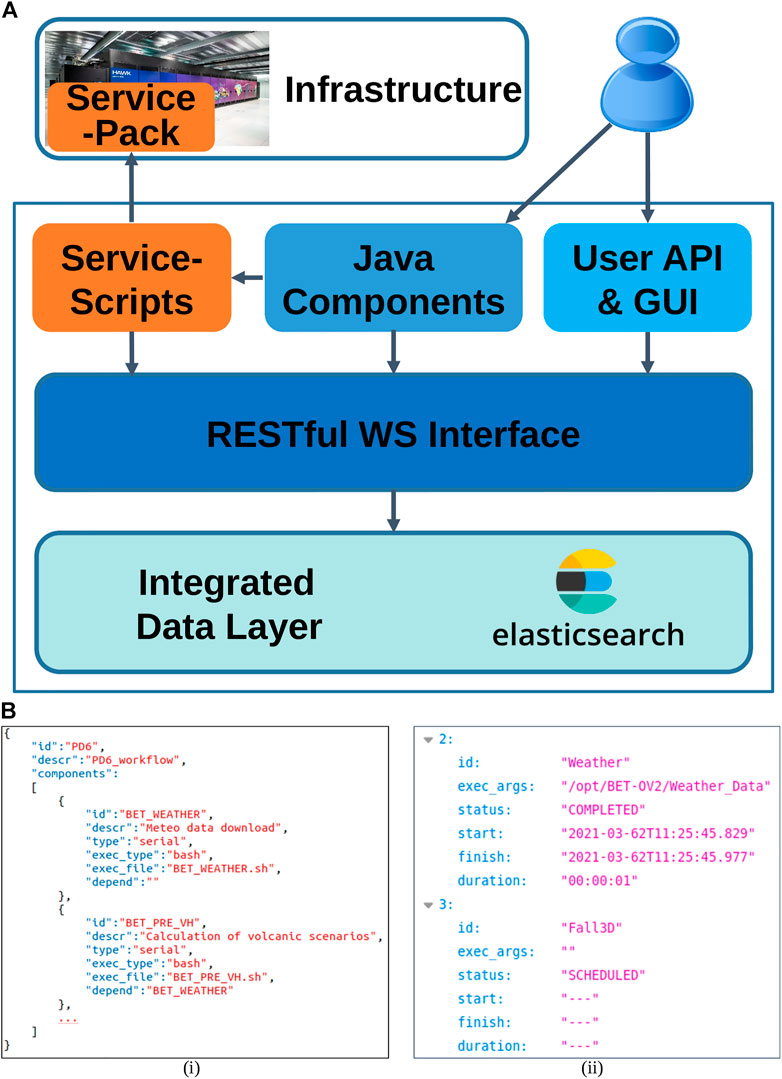
FIGURE 2. (A) Architecture of WMS-light workflow management system. (B) WMS-light specifications: i) workflow and ii) monitoring information.
3.3 Workflow performance optimization
Within the framework of the EU Performance Optimization and Productivity Center of Excellence in HPC (POP CoE), critical parts of the PVHA workflow were analyzed because of their initial poor performance. More specifically, the analysis of volcanic hazard probabilities from FALL3D capability simulations became a concerning bottleneck due to long capability workflow execution times (note that this optimization does not concern single FALL3D model instances, but the capability workflow resulting from the aggregation of many independent instances). Thus, we applied the POP’s profiling and optimization cycle. First, we identified through a performance assessment what was causing such bad workflow performance. Second, we addressed with a proof-of-concept (PoC) each individual problem.
3.3.1 Workflow performance assessment
With a performance assessment, we discovered that the part of the code that was slowing down the workflow was the analysis of the many instances of FALL3D, and we figured out what factors were responsible. Using Extrae (Center, 2022), we traced the application in various strong scalability tests up to 1,024 ranks MPI (Message Passing Interface). Then, with Paraver (Pillet et al., 1995), we analyzed the traces and generated a set of metrics giving us insights into the application’s efficiency. For example, Figure 3A displays a Paraver trace showing qualitatively what regions of the program are being run in one execution with 48 MPI ranks. In Figure 3B, we can see the quantitative results of one strong scalability test. Thanks to these POP performance metrics (POP, 2022) we could identify that PVHA_HPC-WF suffered mainly from two problems. First, it suffered from load-balancing problems. For instance, with 192 MPI ranks (four compute nodes in this setup), the load balance is already below 80%. Second, it presented a low serial performance as indicated by the average IPC (instructions per cycle). With 4 MPI ranks, the average IPC is 0.98, which is already low since a good IPC would be 2–3 for an application. However, from here, it only gets worse until an average IPC of 0.36 with 1,024 MPI ranks.
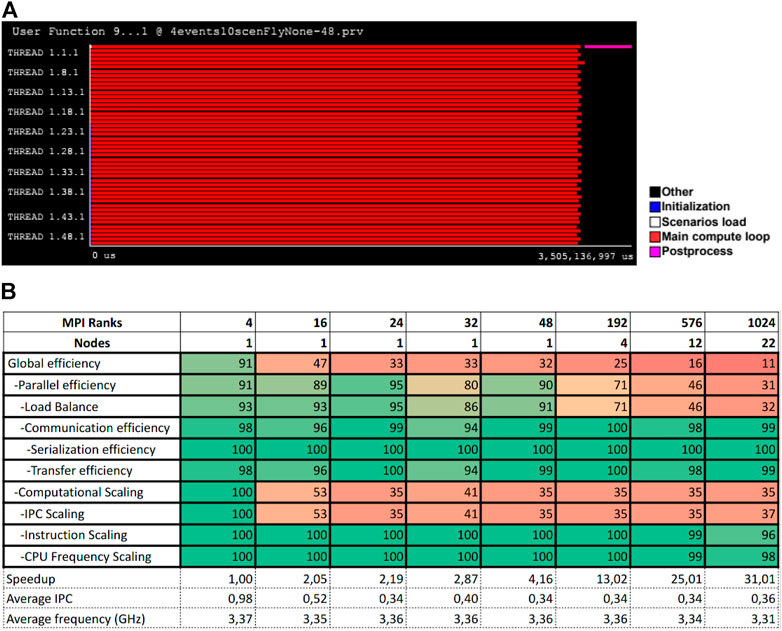
FIGURE 3. (A) PVHA_HPC-WF Paraver trace. The x-axis shows the program’s execution time in microseconds, while the y-axis displays each one of the 48 parallel MPI ranks. Colors indicate what part of the application is being run at a time. (B) POP metrics table of a PVHA_HPC-WF strong scalability test. Colored values are in percentage.
Given the previous analysis, we identified why the workflow performed badly and the reasons for load imbalance and poor CPU (central processing unit) utilization. Indeed, we realized that the different processor performances between ranks and one non-parallel region were causing load balance problems. Regarding low IPC, we attributed it to poorly optimized Python code. In addition to all that, we also saw that MPI usage could be improved.
3.3.2 Proof-of-concept
Once we discovered what could be improved, we started working on optimizations in a proof-of-concept. On one hand, we addressed load balance issues by equally mapping data to every processor, keeping NUMA (non-uniform memory access) awareness in mind and parallelizing a region of serial code. On the other hand, we improved the poor workflow serial performance by optimizing the main nested loops of the Python code. The outcome of these optimizations improved the workflow’s time-to-solution by 588 times.
We first optimized the serial computation loops. After some experiments, we found that the best performance was achieved using Numpy vectorization. Thanks to Numpy we replaced all Python for-loops with calls to Numpy vector operations, which yielded a maximum speedup of 775 times in the execution of that part of the code compared to the original workflow version. Listings 1 and 2 show an example of a change made to the code, which is to replace matrix multiplication in plain Python with matrix multiplication using Numpy vectorization. We also fixed a memory access pattern that was not exploiting the spatial locality of cache memory well.
Listing 1. Matrix multiply in plain Python.
product = np.zeros ((n, m), dtype = ‘int’)
for i in range (n):
for j in range (m):
for z in range (k):
product [i, j] += matrix1 [i, z] * matrix2 [z, j]
Listing 2. Matrix multiply using Numpy vectorization.
import numpy as np
product = np.matmul (matrix1, matrix2)
After the first optimization, all processors had the same amount of data to compute and the same memory access latency, so one balancing problem was already gone. The second problem was a sequential workflow region that took 2/3 of the execution time. Therefore, we parallelized this part with MPI, which reduced the total execution time by 2.3 times. Figure 4A shows the result of this parallelization. In the window at the bottom, the master rank is doing useful computation (in blue) for the last 2/3 of the window, while all the other processors are idle (in black) waiting. In the window at the top, the master rank is spending 2.3 times less execution time running sequential code. It seems that there is still room for improvement, as the application presents large serial parts. However, those parts belong mostly to the I/O operations of pre and post processing.
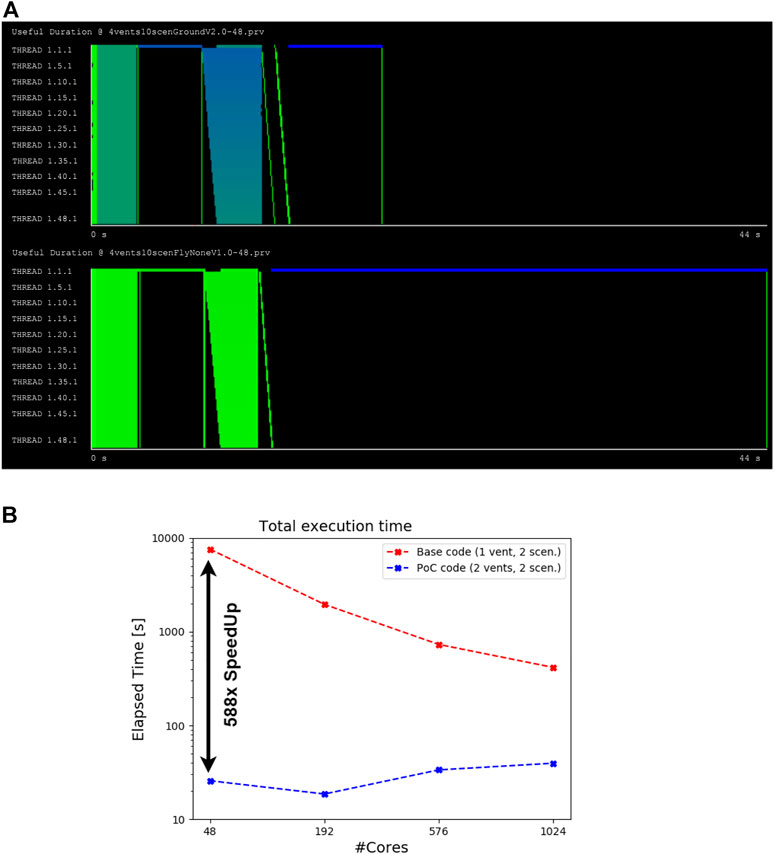
FIGURE 4. (A) Paraver traces showing useful duration (computation) of two executions with 48 MPI ranks. Both windows have the same duration. The trace at the bottom is the application with the expensive sequential region. The trace at the top is the same application but with that region parallelized. Ignore the color gradient, only notice that the execution at the bottom takes 44s to finish, while the execution at the top takes a bit less than half of the time. Black means threads are not running the program. (B) PVHA_HPC-WF execution time comparison between the original code (in red color) and the proof-of-concept version (in blue color) for the FL050 case.
The final results of this PoC are displayed in Figure 4B, where we compare the base version versus our PoC version running with different number of ranks. Thanks to our changes; we were able to reduce the application’s runtime by up to 588 times on average. Usage of Numpy vectorization was the main source of this large improvement and after that the parallelization with MPI of the sequential region.
4 Test case: Tephra probabilistic volcanic hazard assessment for Campi Flegrei
The metropolitan area of Naples (more than three million inhabitants, www.cittametropolitana.na.it) is under the threat of three active and well-studied volcanoes: Somma-Vesuvius, Campi Flegrei, and Ischia. The PVHA of these volcanoes is based on several multidisciplinary studies (Costa et al., 2009; Selva et al., 2010; Sandri et al., 2016; Macedonio and Costa, 2018; Selva et al., 2018, 2021). In this study, we focused on the Campi Flegrei volcanic system, although the presented methodology can be applied to other volcanoes as well. The Campi Flegrei caldera (CFc) resulted from at least two major collapses from the Campanian Ignimbrite (Ort et al., 2003) and the Neapolitan Yellow Tuff (Deino et al., 2004) eruptions, 37,000 and 12,000 years BP, respectively. More recent volcanism was concentrated in epochs of intense activity (i.e., eruptions occurred at time intervals of a few tens of years), alternating with periods of quiescence (Costa et al., 2022). Subsection 4.2 provides information on eruption probabilities, styles, intensity, and vent locations in CF. CFc is located in one of the most densely populated areas in Europe, so an eruption would have a tremendous impact, not only on air traffic but also on people and infrastructure. INGV is the reference scientific institution for the Italian government in the field of volcanic monitoring and hazards and operates in close synergy with the Italian Civil Protection authorities at the national and local levels. The surveillance system of Osservatorio Vesuviano of INGV continuously monitors, among others, volcano seismicity, ground deformations, and gas emissions and performs tephra dispersion simulations driven by this information and the ARPA-SIM meteorological data for forecasting plume evolution in the Campania region. A short-term PVHA is currently run twice daily for tephra fallout and is based on three representative scenarios over a 250 km × 200 km geographic area at 1 km grid spacing due to the high computational cost of simulating the eruptive variability on local servers (Perfetti et al., 2021).
Herein, we improve the assessment of the tephra hazard associated with an eruption at Campi Flegrei in order to better answer important questions such as
1. In the short term, what are the probabilities of eruption and vent-opening locations?
2. In the short and long term, what is the probability, both absolute and conditional on the occurrence of an eruption, that the cumulative tephra deposit will exceed critical thresholds known to cause issues, such as building collapse/failure or traffic disruption after a certain number of hours from the eruption onset?
3. In the short and long term, what is the probability, both absolute and conditional on the occurrence of an eruption, that the ash cloud concentration will exceed critical conditions and hazardous temporal persistence known for safe flights within a certain number of hours since the beginning of the eruption, and which levels (FLs) are likely to be most predominantly affected?
4. In the short and long term, what is the expected time for ash concentration to reach a critical value at a specific geographical point and flight level?
The PVHA_HPC-WF presented here allows us to answer these questions by conducting a hazard assessment related not only to tephra ground load but also to ash concentration at various FLs over a surveillance area large enough to track the evolution of ash clouds, and considering a large number of VSs, thus reducing the uncertainty in the eruptive parameters and meteorological conditions.
In this application case, we generated both LT and ST tephra PVHA for Campi Flegrei. For an LT assessment, we have considered 1,500 VSs for each of the three explosive eruption sizes at Campi Flegrei, that is, low (L), medium (M), high (H) size, and meteorological conditions during 20 years of reanalysis from Copernicus Climate Change Service ERA5. As examples of ST, we developed the PVHA for December 5, 6, and 7, 2019, when seismic activity was more energetic than usual with a magnitude 3.1 intracaldera earthquake: in the present example, we consider 180 VSs for each explosive eruption size and day and the monitoring data from the Osservatorio Vesuviano surveillance system recorder on those days. All the studies were carried out in a regional-scale domain of 2,000 km × 2,000 km at a 2 km horizontal resolution, approximately, and a vertical resolution ranging from 0.5 to 1 km, considering eight flight levels from FL050 to FL400, 5,000 ft (1.5 km) to 40,000 ft (12.2 km) altitude, approximately. The simulations for each of the 6,120 VSs (1,500 VSs × 3 sizes +180 VSs × 3 sizes × 3 days) have been carried out by running the FALL3D-8.0 model on the French Joliot-Curie supercomputer, while the eruptive forecast (EF) has been calculated on the CENERI server of the Osservatorio Vesuviano of INGV, and the workflow manager system has been launched in the ADA cluster at INGV-Bologna.
An introduction to the monitoring system is given in the next Subsection 4.1. Subsection 4.2 describes the configuration of the model adopted for this test case and the parameters used to calculate each of the BET nodes, and a detailed explanation of the VS generation process is shown in Subsection 4.3. In Subsection 4.4, it is specified how the meteorological data have been obtained. Subsection 4.5 is dedicated to the specification of the computational resources and performance of the PVHA_HPC-WF. Finally, the presentation of results and a sample of the graphs and maps obtained are shown in Subsection 4.6.
4.1 Monitoring system
Monitoring data, necessary for ST assessment, are provided by the Osservatorio Vesuviano’s surveillance system (Bianco et al., 2022). Seismic data are collected from the seismological database SERENADE (SEismic Restful ENAbled DatabasE), which was developed to manage multiple locations for each event in order to unify the data source for automatic, preliminary, and revised locations (Peluso, 2014). The PostgreSQL database server is the internal engine of SERENADE and allows requests to be made using standard HTTP commands. On the other hand, from the network of permanent GPS stations operating in the CFc, we obtained the deformation data for these studies (De Martino et al., 2021). Other data, such as anomalies in gas fluxes or compositions, can also be accounted for as user-specified parameters.
4.2 Model setup
Here, we describe the parameters at each of the BET nodes and the computational domains used for this test case.
The BET_EF settings used to calculate Nodes 1, 2, and 3 rely on the work of Selva et al. (2012a) and are reported in the first three rows of Table 1 and in Figure 5A regarding the probability of unrest, magmatic unrest, and eruption, respectively. For the LT, a Poisson distribution over time has been assumed, and the results of which are compatible with the works of Sandri et al. (2018) and Bevilacqua et al. (2017).
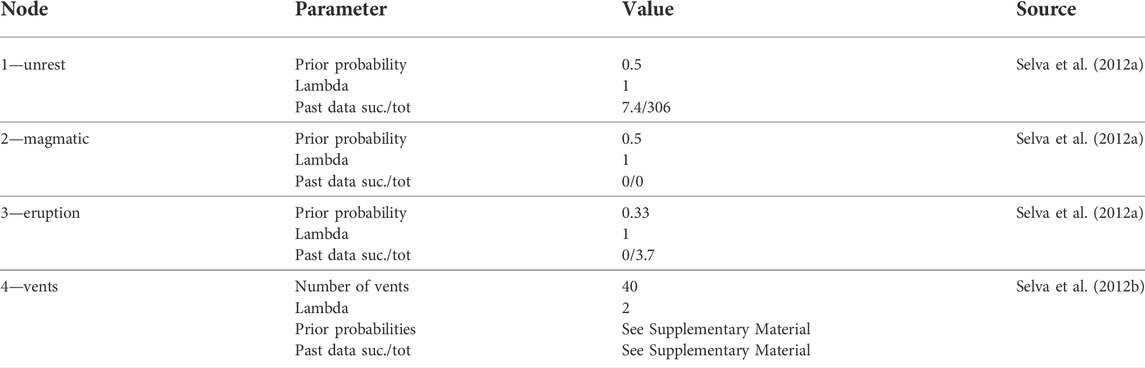
TABLE 1. Parameters of Gaussian functions used for Nodes 1 to 4 for the application of the PVHA_HPC-WF in Campi Flegrei.
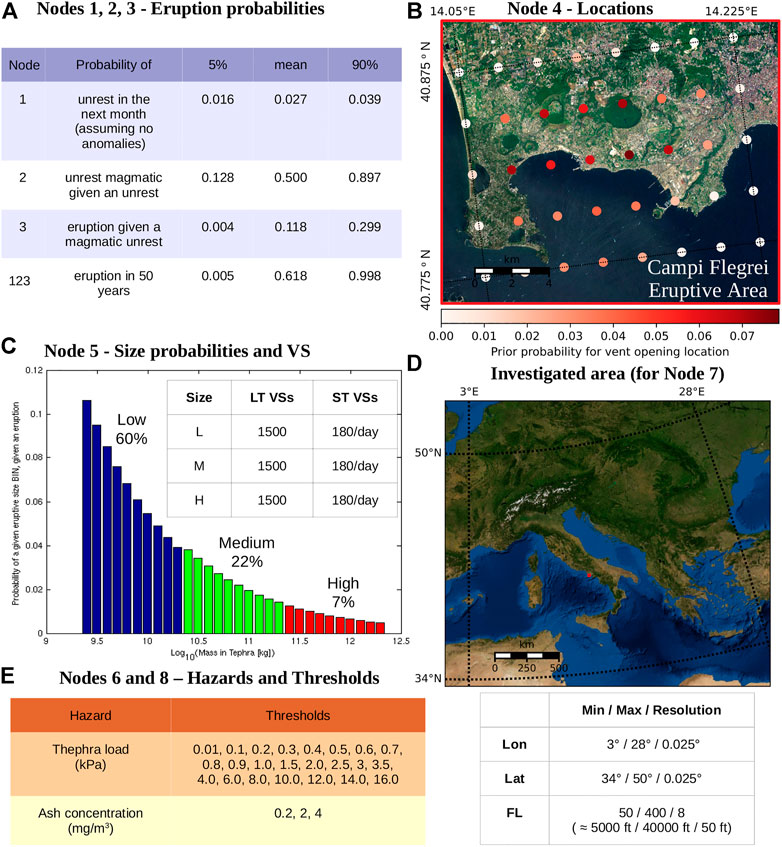
FIGURE 5. CF model setup. (A) reports the probability of unrest (Node 1), magmatic unrest (Node 2), and eruption (Node 3) and the combination of the three nodes. (B) is the Campi Flegrei eruptive area where the 40 vent-opening locations considered in this study and their respective prior probabilities are indicated. (C) shows the probability density function for the size of the eruption at Campi Flegrei and the number of scenarios considered for each of them. (D) indicates the geographical area studied in this work (upper image) and the resolution and coordinates of the computational domain (lower table). (E) specifies the thresholds set for each hazard.
The considered eruptive area for Node 4, based on the geodynamical structures and the position of past eruptive vents within the CF caldera (Selva et al., 2012b), consists of 40 potential vent-opening locations distributed equidistantly in a geographical area encompassed between 40.775°N and 40.875°N latitude and 14.05°E to 14.225°E longitude, whose locations and prior (LT) probabilities are indicated in Table 1 and displayed in Figure 5B. Short-term maps are built by integrating the position of observed anomalies, such as seismic activity and deformation, as in Marzocchi et al. (2008). Although part of the CFc is under the sea, since the most likely opening vent areas are in shallow waters and the effects are generally negligible at relatively large distances (Selva et al., 2018), we do not consider the effects of the sea on the formation of eruptive columns. The reader who wants to go deeper into the effects over sea water on the eruptions at CFc, including tsunamis, can consult, for example, Tonini et al. (2015), Selva et al. (2018), Paris et al. (2019), and Grezio et al. (2020).
Based on the eruptive record of Campi Flegrei (Orsi et al., 2009), we consider four eruption sizes: an effusive (E) size and three explosive ones, which are the low (L) (e.g., Averno 2), the medium (M) (e.g., Astroni 6), and the high (H) (e.g., Agnano-Monte Spina) sizes. The probabilities of occurrence for each size are defined in Table 1 and graphically represented in Figure 5C (Sandri et al., 2016). Then, as we already mentioned earlier, for each explosive size, we build 1,500 VSs for LT assessment, 180 VSs for ST, and for 5, 6, and 7 December 2019, totaling 6,120 VSs. In Subsection 4.3, we provide the details on the creation of the volcanic scenarios.
Regarding Node 6, we study tephra fallout hazard at ground and ash concentration hazard at eight flight levels (FL050–FL400) during the 24 and 48 h after the eruption by running FALL3D-8.0 for each VS in a computational domain spanning from 31°N to 50°N latitude and from 3°E to 28°E longitude at 0.025° resolution (2 km, approximately). Due to the flat topography of the CFc (that does not affect significantly the pattern of ash dispersal), to the proximity of the volcanic vents with respect to the size of the simulation grid, and to the resolution of the meteorological data, we do not repeat the tephra dispersion simulations for each of the vent locations but instead translate the output of simulations to each of the 40 vent positions (Selva et al., 2010).
For Node 7, we examined the target area from 34°N to 50°N latitude and 3°E to 28°E longitude (Figure 5D) at 0.025° resolution and the eight flight levels from FL050 to FL400. The reason this target area is slightly smaller than the FALL3D area is to have the same number of simulation outputs in each target area cell after translating the simulations over the 40 vent locations.
With respect to Node 8, we examine 23 critical thresholds, from 0.01 to 16.0 kPa, for the ground load hazard (Wilson et al., 2012) and the thresholds of 0.2, 2, and 4 mg/m3 for the airborne ash concentration, as well as the temporal persistence of 1, 3, 6, 12, 18, and 24 h.
These input parameters are collected in a configuration file called bet. cfg, which is the input file to the PVHA_HPC-WF (see Supplementary Material).
4.3 Generation of volcanic scenarios
As explained in previous sections, we adopt a probabilistic approach that merges the results of a large number of numerical simulations, each of them corresponding to a potential VS, to fully explore the natural variability associated with volcanic phenomena and to take into account the impact of low-probability but high-consequence events. The probabilistic approach adopted follows Sandri et al. (2016) based on the definition of three broad eruptive size classes (low-, medium-, and high-explosive, respectively): L, M, and H. Each eruptive explosive size is fully described by a set of ESPs sampled from PDFs previously defined. The PDF shape and parameters are defined on the basis of previously published articles in agreement with field observations (Sandri et al., 2016; Mele et al., 2020) and compiled in Table 2. The methodology followed to generate a potential eruptive scenario is reported in the Supplementary Material.
TABLE 2. PDFs and value ranges of the main eruptive parameters for CFc. Bounds on mass eruption rate (MER) values are a consequence of the sampling procedure for total erupted volume (TEV) and duration of the fallout phase described in this work. For the total grain size distribution (TGSD), we selected three different kinds of particles: juveniles, lithics, and crystals. To describe juvenile particle, we used a bi-Gaussian (in Φ) distribution where both μ and σ were sampled from the distribution detail and whose degree of mixing is given by the TGSD probabilities of juveniles. Lithics and crystals were described using a Gaussian distribution.
4.4 Meteorological data
To fully explore the natural variability of weather conditions, each VS was randomly assigned weather conditions corresponding to a time period between 1 January 1999 and 1 January 2019 for the tephra dispersal simulations for the long-term assessment. For the short-term assessment, the meteorological data corresponding to each of the days 5, 6, and 7 December 2019 have been used. All these data have been obtained from the Copernicus Climate Change Service ERA5 reanalysis with a temporal resolution of 3 h at a spatial resolution of 0.25°. Details for downloading and handling these data are attached in the Supplementary Material.
4.5 Computational resources and performance
The PVHA_HPC-WF has been distributed into three clusters:
• ADA. HPC-MASTER-Computing Cluster, 140 cores × node, INGV Section of Bologna;
• CENERI. Debian GNU/Linux, Osservatorio Vesuviano in INGV Section of Naples;
• IRENE-SKYLAKE. Bi-processor with 24 cores per node, TGCC, France.
The workflow management system was installed and launched on ADA which interacted with CENERI, IRENE, and with itself. The BET_EF and BET_FETCH modules, in charge of interrogating the monitoring database and calculating the probabilities of eruption, were serially executed on the CENERI server, lasting less than 1 min. Also, the BET_PRE_VH was run in series on ADA, generating the set of VSs in a few seconds for the LT and the ST. The module BET_TEPHRA, responsible for executing the simulations of volcanic tephra transport and deposition via FALL3D-8.0 for each of the 6,120 VSs generated, was executed in parallel on IRENE using an average of 16 nodes and 3 h, approximately, of elapsed time for each simulation. The analysis of the FALL3D simulations, through the BET_POST_TEPHRA module, has been carried out in parallel in IRENE using 1 node and less than 20 min, approximately, for each set of simulations corresponding to each of the three eruptive sizes. Also in IRENE, the module BET_VH was executed utilizing 12 nodes and 15 min, approximately, for each desired combination of altitude level/persistency/period of time. In total, approximately 11⋅106 h of CPU time was used in Irene for the LT, and 125⋅104 for each of the ST days. Finally, the final hazard curves and figures were generated serially in ADA by BET_POST_VH, requiring approximately 8 min. All this information is compiled in Table 3.
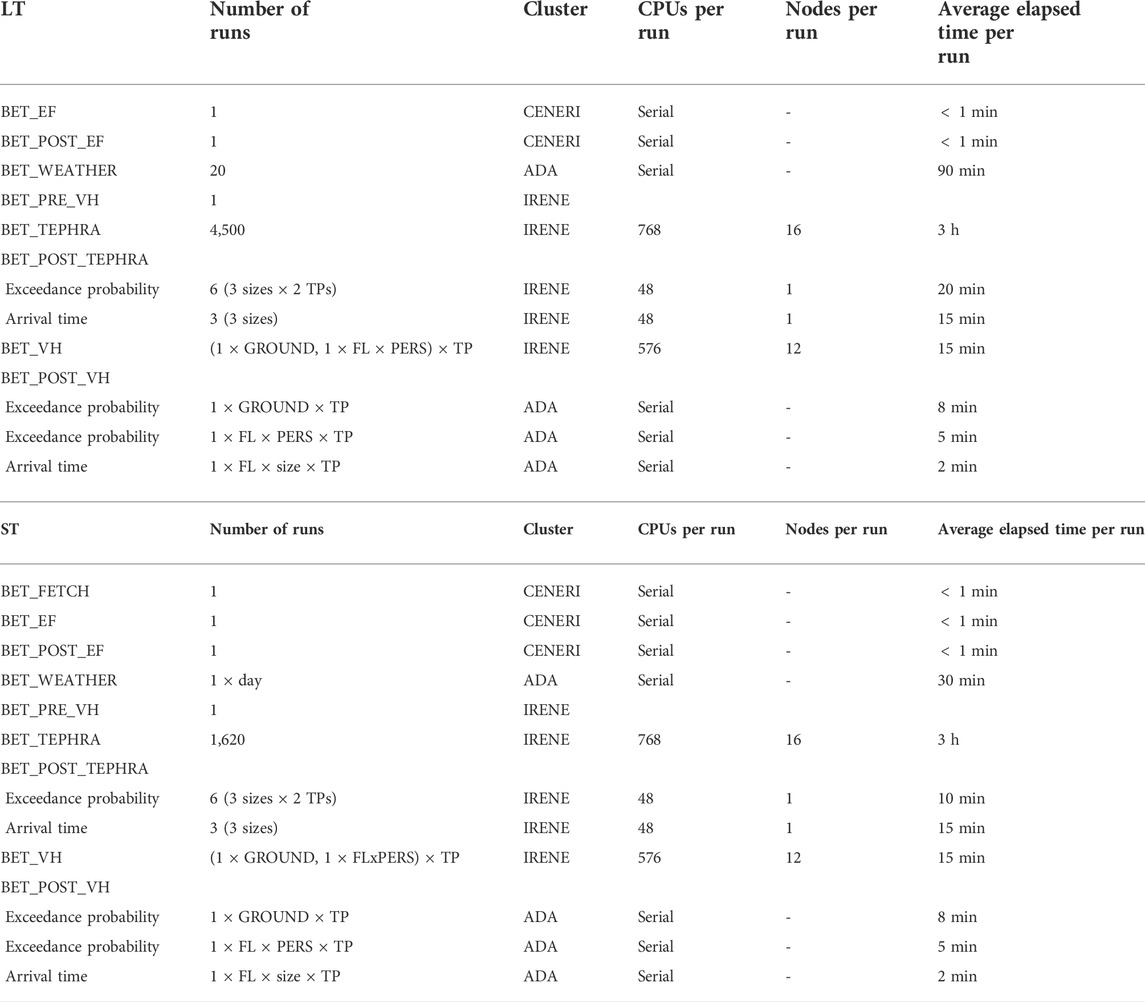
TABLE 3. Computational performance for PVHA at Campi Flegrei. Herein, we use the abbreviation PERS for temporal persistence and TP for period of time.
4.6 Results
A large portfolio of results from the workflow can be extracted and mapped. Herein, we show some of the results that may answer the questions posed in the second paragraph of Section 4, following the numbering of those questions.
For LT analysis, the workflow can provide:
1. probability maps with uncertainty showing the 50-year forecast absolute probability and the probability conditional on the occurrence of an eruption exceeding the previously defined critical tephra fallout thresholds after 24 and 48 h from the beginning of an eruption,
2. probability maps with uncertainty showing the 50-year forecast absolute probability and the probability conditional on the occurrence of an eruption exceeding the critical ash concentration thresholds of 0.2, 2, and 4 mg/m3 for at least 1, 3, 6, 12, 18, and 24 of the hours after 24 and 48 h from the beginning of an eruption at eight flight levels from FL050 to FL400,
3. maps of the time required to exceed the ash concentration thresholds corresponding to each explosive eruption size.
For ST analysis corresponding to each of December 5, 6, and 7, 2019, the workflow can provide:
1. eruption probabilities and vent-opening location maps,
2. probability maps with uncertainty showing the absolute probability and the probability conditional on the occurrence of an eruption exceeding the critical tephra fallout thresholds after 24 and 48 h from the beginning of an eruption,
3. probability maps with uncertainty showing the absolute probability and the probability conditional on the occurrence of an eruption exceeding the previously defined critical ash concentration thresholds for at least 1, 3, 6, 12, 18, and 24 of the hours after 24 and 48 h from the beginning of an eruption at eight flight levels from FL050 to FL400, and
4. maps showing the time required to exceed the ash concentration thresholds corresponding to each explosive eruption size.
We show here only a small sample of the large number of maps generated. Other maps can be found in the Supplementary Material, including those corresponding to each of the seasons of the year.
4.6.1 Long-term analysis
As an example of probability maps, Figure 6 presents the 50-year forecast absolute probability that the ash concentration at FL050, FL150, FL250, and FL350 exceeds the critical concentration of 2 mg/m3 with persistency of 1, 6, 12, 18, and 24 h in the 48 h following an eruption onset. We can observe that the probability for the next 50 years of exceeding 2 mg/m3 for at least 1 of the 48 h observed is greater than 1% at all flight levels. FL050, especially interesting because it is the aircraft takeoff and landing flight level, would be the most affected where the critical threshold could be exceeded for at least 24 out of the 48 h studied. As a sample of intensity hazard maps, Figure 7 shows the tephra ground load and the ash concentration at FL050 within 48 h from eruption onset, both the mean values and those corresponding to the 2.5 and 97.5 percentiles, relative to the 5% probability conditional on an eruption event. We can see that in the case of an eruption, a large part of the Campania region would be affected by tephra load above 1 kg/m2 with a probability greater than 5%, even exceeding thresholds above 300 kg/m2 in the areas closest to the volcano. Also, an eruption would affect air traffic in extensive areas with exceedingly high ash concentrations above 4 mg/m3. Both Figures 6 and 7 show the trend of the ash to spread to the east and slightly to the south, following the most common wind patterns in that area. As for the arrival time maps, Figure 8 shows, for each eruption size, the expected time to reach the critical ash concentration threshold of 2 mg/m3 at FL050 with a probability of 5% in the event of an eruption and, for some of the airports around Campi Flegrei, arrival time values versus their probability values. Most airports would be affected in less than 48 h in case of an explosive eruption with a probability of 5%. We can observe that the arrival time to exceed the critical threshold of ash concentration in the different airports is less the greater the size of the eruption. Examples for other flight levels and persistence can be found in the Supplementary Material.
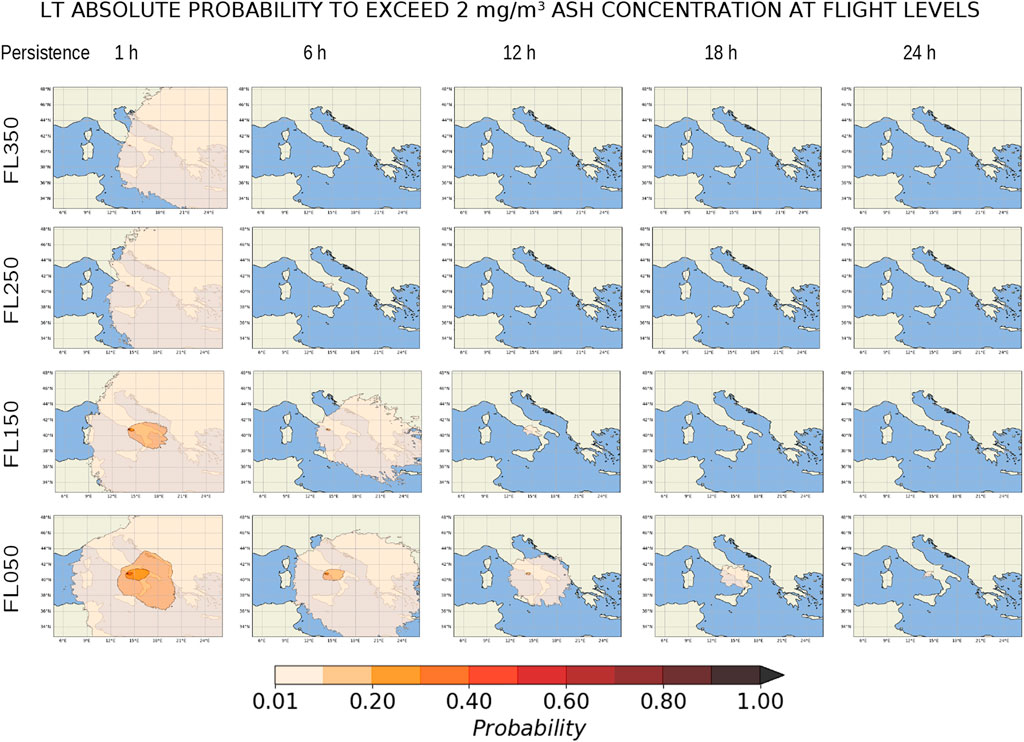
FIGURE 6. Probability maps showing the long-term mean absolute probability that the 50-year forecast ash will exceed a concentration of 2 mg/m3 with persistence of 1, 6, 12, 18, and 24 h (left to right columns) during a period of time of 48 h in FL050, FL150, FL250, and FL350 (bottom to top columns). We can see that the probability for the next 50 years of exceeding 2 mg/m3 for at least 1 of the 48 h observed is greater than 1% at all flight levels. FL050 would be the most affected where the critical threshold could be exceeded for at least 24 out of the 48 h studied. We can also observe that the spread pattern is toward the east and slightly south.
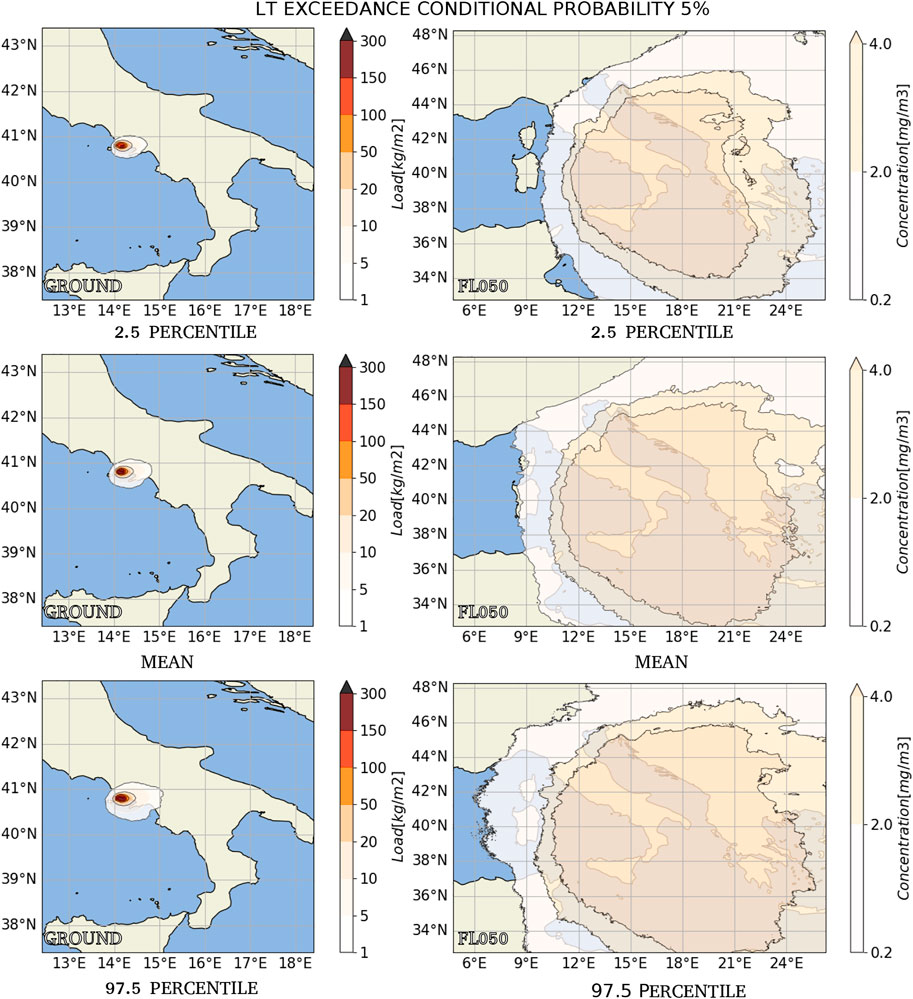
FIGURE 7. Long-term hazard maps relative to the 5% probability threshold conditional on an eruption event provide a graphical representation of epistemic uncertainty for tephra fallout (left column) and ash concentration at FL050 (right column). For each hazard intensity value (color bar label), the maps show the areas where that value will be exceeded with a probability greater than 0.05 in the event of an eruption within 48 h from eruption onset. We can see that in the case of an eruption, a large part of the Campania region would be affected for tephra load with a probability greater than 5%. Also, an eruption would affect air traffic with an exceedingly high ash concentration above 4 mg/m3 throughout a large area with a spread pattern to the east and slightly south.
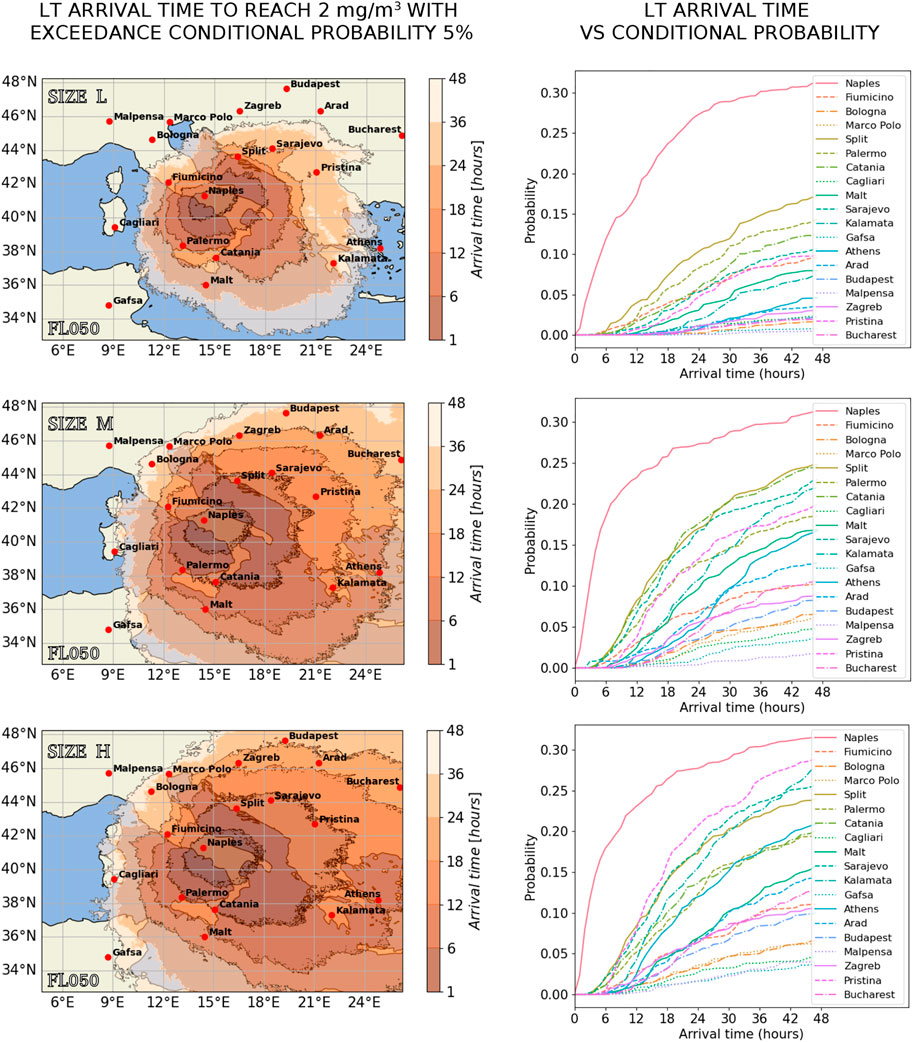
FIGURE 8. Long-term arrival time maps. Left column shows, from top to bottom, the expected time in which the ash concentration at FL050 will reach the critical threshold of 2 mg/m3 with a probability of 5% in the event of a low-, medium-, and high-sized eruption at Campi Flegrei, respectively. The right column shows the probabilities to reach 2 mg/m3 at FL050 above some of the surrounding airports in each of the hours following the eruption.
4.6.2 Short-term analysis for days 5, 6, and 7 December 2019
Figure 9 is a compilation of the eruption forecasting (EF) for 5, 6, and 7 December 2019. As we have explained previously, EF is independent of the hazard we are modeling, and it is based mainly on the information from the monitoring system. Regarding the location of the eruption, Figure 9A presents the temporal evolution of the mean conditional probability of the eruption occurring at each of the 40 potential vent locations. Figure 9B shows the temporal evolution of the mean and the 16, 50, and 84 percentiles of the conditional probability density function (CDF) of unrest, magmatic unrest, and magmatic eruption (those percentiles are equal to two standard deviations (2σ), that is, 68% confidence interval). Figure 9C, left panel, displays the temporal evolution of the mean values of the probability density function of unrest, magmatic unrest, and eruption in the 3 days of application, where the occurrence of a magnitude 3.1 earthquake is marked by the red arrow on the left panel. The right panel shows the time trend in the probability of unrest, magmatic unrest, and eruption in the previous days, where shaded areas indicate the 10th–90th percentile confidence band. As a sample of ST probability maps, Figure 10 presents the mean absolute probability for each of the days of exceeding the tephra load of 1 kg/m2 at the ground and that of exceeding an ash concentration of 2 mg/m3 at FL050, FL150, and FL300, respectively, for at least 1 hour in the 48 h following the eruption onset. The most affected flight level would have been FL050, closely followed by FL150, while at FL300, this critical threshold would have not been exceeded. Figure 11 shows ST hazard maps with tephra load and ash concentration at FL050 with a probability of 5%. Note, for example, that the day 6 eruption could have produced a tephra load beyond the Albanian coast. The arrival time of exceeding the threshold of 1 kg/m2 and 2 mg/m3 at the ground and at FL050, respectively, with a probability of 5% in the case of a medium-size eruption, is displayed in Figure 12. In all the images, the wind field pointed predominantly to the north on day 5, to the east on day 6, and to the southeast on day 7, which illustrated the influence of meteorological variability and the need to develop a daily evaluation of the tephra hazard in a wide geographical area.
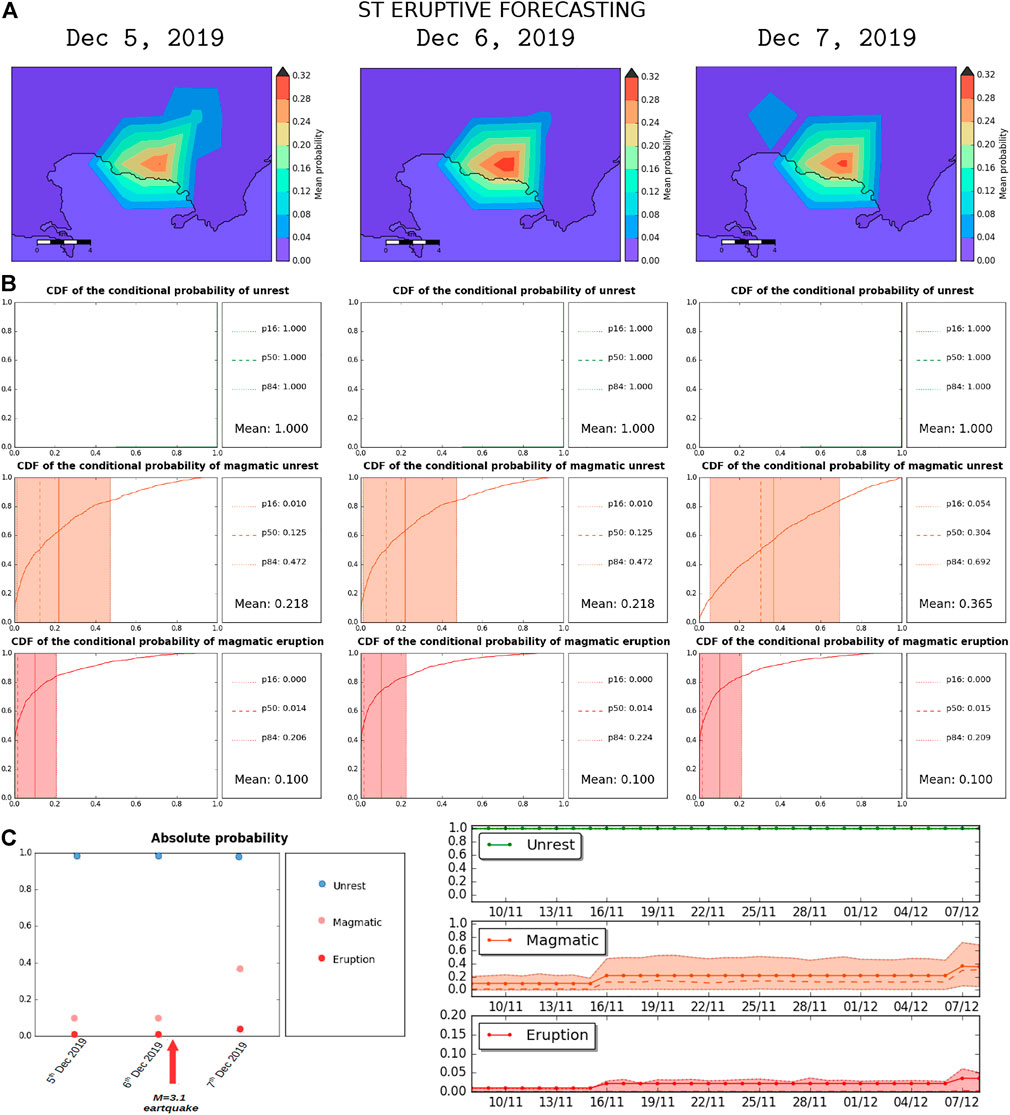
FIGURE 9. ST eruptive forecasting (EF) for December 5, 6, and 7, 2019. (A) is the temporal evolution during the 3 days of the vent-opening probability map, conditional to eruption occurrence. (B) shows the temporal evolution of the CDF of unrest, magmatic unrest, and magmatic eruption. (C) displays the temporal evolution of the mean values of the probability density function of unrest (blue circles), magmatic unrest (pink circles), and eruption (red circles) in the 3 days of application, where the occurrence of a magnitude 3.1 earthquake is marked by the red arrow.
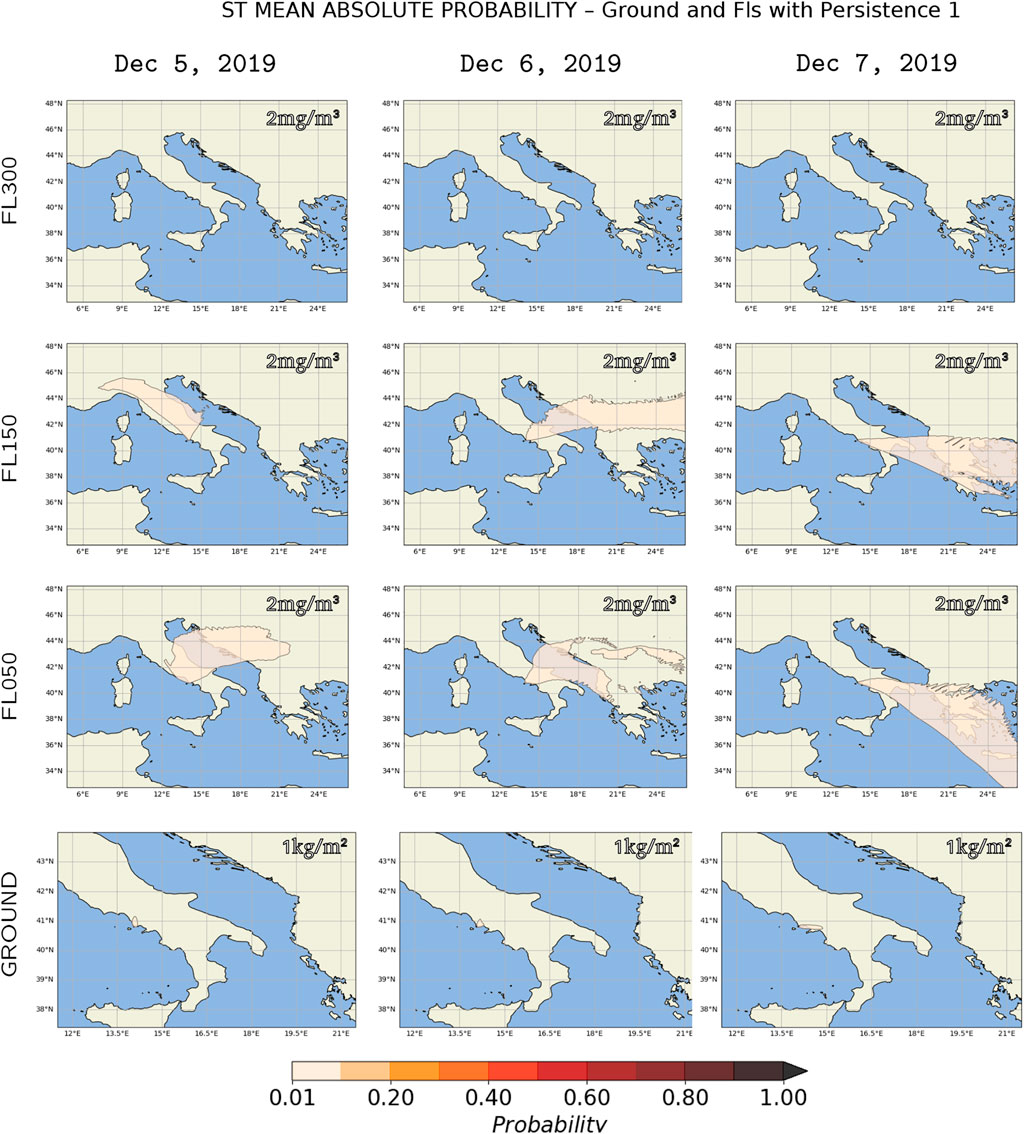
FIGURE 10. Maps showing the short-term mean absolute probability for December 5, 6, and 7, 2019. The last row shows the probability of exceeding the 1 kg/m2 tephra load, while rows from 1 to 3 show the probability of exceeding the 2 mg/m3 ash concentration at FL300, FL150, and FL050, respectively, with the persistence of 1 h.
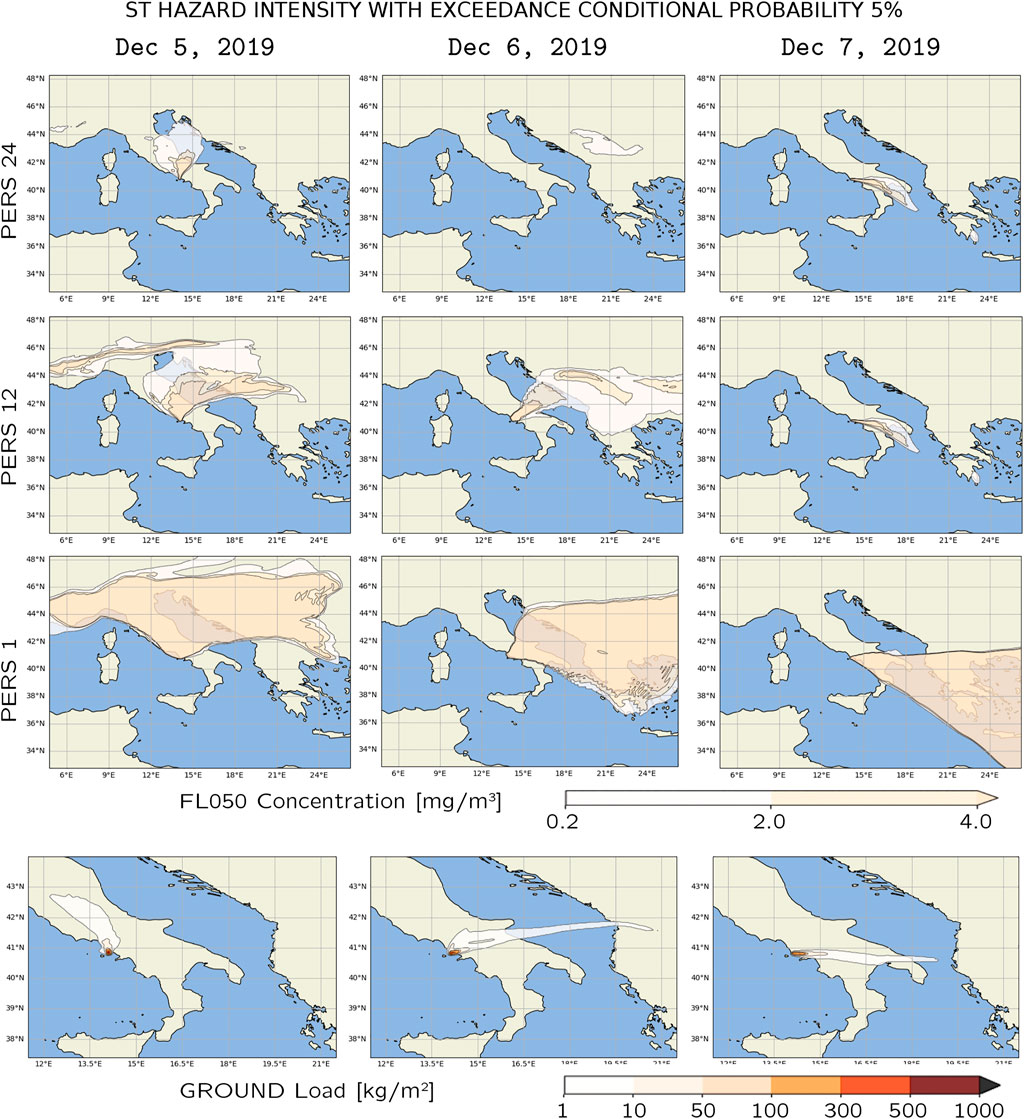
FIGURE 11. Short-term hazard maps relative to the 5% probability threshold conditional on an eruption event providing in the first four rows the tephra concentration at FL050 with persistence 1, 12, and 24, respectively. The last row shows the ground load. For each hazard intensity value (color bar label), the maps show the areas where that value will be exceeded with a probability greater than 5% in the event of an eruption within 48 h of the observed time.
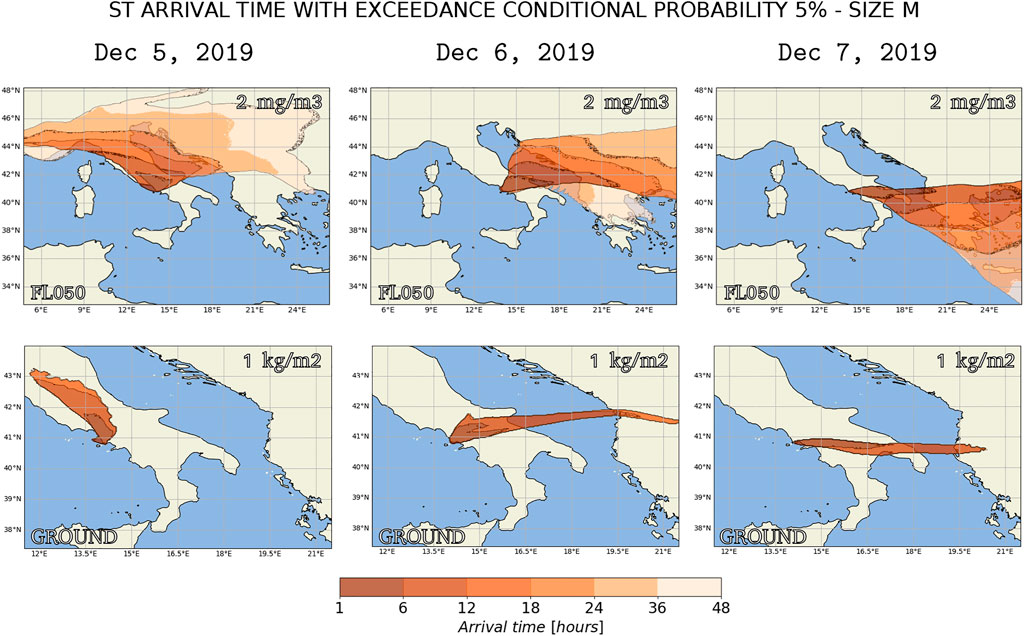
FIGURE 12. Short-term arrival time maps for medium (M) size for December 5, 6, and 7, 2019. The bottom and top rows show the expected time for tephra ground load and for ash concentration at FL050 to reach the critical thresholds of 1 kg/m2 and 2 mg/m3, respectively, with a probability of 5% in the event of a medium-sized eruption at Campi Flegrei.
5 Conclusion
This study highlights the feasibility and usefulness of HPC-integrated PVHA. In particular, we have shown that HPC integrated into PVHA can provide quantitative hazard results capable of answering some of the questions that decision-makers have to face in case of volcanic unrest possibly evolving toward an eruption (short-term) or in planning land use or air traffic development (long-term) over a large-scale and high-resolution domain.
We have implemented the Probabilistic Volcanic Hazard Assessment HPC Workflow (PVHA_HPC-WF) to calculate the short-term (ST) and the long-term (LT) probabilistic volcanic hazard assessment (PVHA) for a specific volcano based on the Bayesian event tree (BET) methodology and starting from the existing prototype tool BET@OV. We have subjected the code to a performance and productivity audit and have optimized it following a proof-of-concept process, thanks to which the execution time of some of the most critical parts of the workflow has been reduced by up to 588 times. Through the workflow manager system light (WMS-light), we have given the PVHA_HPC-WF the ability to interact with different machines to distribute tasks and exchange data.
We have tested the LT PVHA_HPC-WF by performing a long-term tephra hazard assessment of the Campi Flegrei (CF) volcanic caldera, Italy, on the ground and at eight flight levels in a geographic area of approximately 2,000 km × 2,000 km. To this end, we have used the FALL3D-8.0 model to perform ash dispersion simulations at a horizontal resolution of 0.025° (approximately 2 km) for 4,500 different volcanic scenarios (VS), also including those of low probability but high impact, and considering 20 years of meteorological data from ERA5. The workflow tasks have been distributed into three clusters, the ADA, HPC-MASTER Super Computing Cluster in the INGV Section of Bologna (Italy), the CENERI, Cluster at the Osservatorio Vesuviano in the INGV Section of Naples (Italy), and the IRENE-SKYLAKE, in the Computing Center TGCC (France), using approximately 576 h of CPU time in ADA, some minutes in CENERI, and 11⋅106 h of CPU time in IRENE, demonstrating that the entire process could be carried out in a real time within 4.5 h if resources are available to execute the independent tasks simultaneously.
We have also tested the ST PVHA_HPC-WF by performing the short-term tephra hazard assessment of CF for December 5, 6, and 7, 2019, with the same model configuration used for LT but using, for each of the days, 540 VS and its corresponding meteorological data also from ERA5. For this, we have used approximately, for each date, 576 h of CPU time in ADA, some minutes in CENERI, and 125⋅104 h of CPU time in IRENE, showing that a daily process considering 540 VSs could run in 4.25 h if resources are available. We note that this time could be improved for real-time crisis management if specific location targets are provided (e.g., a specific FL).
Data availability statement
The raw data supporting the conclusions of this article will be made available by the authors, without undue reservation.
Author contributions
Conceptualization: LS, ACo, JS, GM, AF. Methodology: BMM,MTL, LS, ACo, JS, AF, GM, SB. Software: BMM, MTL, OR (Performance Optimization), ACh (development of WMS-light and adaptation to PVHA HPC-WF) Writing – original draft: BMM Writing – review and editing: BMM, MTL, LS, ACo, JS, AF, GM, SB, OR, and ACh. Supervision and coordination: ACo. Funding: ACo.
Funding
The research leading to these results has been supported by the European Commission’s CORDIS [ChEESE (grant no. 823844)]. Part of this work was supported by European Community’s Horizon 2020 POP project under grant agreements (no. 824080). Multi-year PRACE Project Access “Volcanic ash hazard and forecast” (ID 2019215114). This work was granted access to the HPC/AI resources of TGCC under the allocation 2020-RA2020235114 made by GENCI.
Acknowledgments
We thank the European Union’s Horizon 2020 research and innovation program. We thank the PRACE partnership. We thank TGCC France. We thank Copernicus Climate Change Service (C3S) (2017): ERA5: Fifth generation of ECMWF atmospheric reanalyses of the global climate. Copernicus Climate Change Service Climate Data Store (CDS) date of access for the access to the meteorological data. We thank SERENADE—SEismic Restful ENAbled DatabasE—for the provision of the seismic data of the Campi Flegrei area. We thank Paolo Perfetti and Roberto Tonini for early support at the beginning of the study with help on BET@OV basics. We thank Stefano Cacciaguerra (INGV) for its technical support in the use of the computer clusters. We also acknowledge the MIUR project Premiale Ash-RESILIENCE.
Conflict of interest
The authors declare that the research was conducted in the absence of any commercial or financial relationships that could be construed as a potential conflict of interest.
Publisher’s note
All claims expressed in this article are solely those of the authors and do not necessarily represent those of their affiliated organizations, or those of the publisher, the editors, and the reviewers. Any product that may be evaluated in this article, or claim that may be made by its manufacturer, is not guaranteed or endorsed by the publisher.
Supplementary material
The Supplementary Material for this article can be found online at: https://www.frontiersin.org/articles/10.3389/feart.2022.941789/full#supplementary-material
References
Ágústsdóttir, A. M. (2015). Ecosystem approach for natural hazard mitigation of volcanic tephra in Iceland: Building resilience and sustainability. Nat. Hazards (Dordr). 78, 1669–1691. doi:10.1007/s11069-015-1795-6
Alberico, I., Lirer, L., Petrosino, P., and Scandone, R. (2002). A methodology for the evaluation of long-term volcanic risk from pyroclastic flows in campi flegrei (Italy). J. Volcanol. Geotherm. Res. 116, 63–78. doi:10.1016/s0377-0273(02)00211-1
Aspinall, W. (2006). Structured elicitation of expert judgment for probabilistic hazard and risk assessment in volcanic eruptions. Statistics Volcanol. 1, 15–30.
Barsotti, S., Di Rienzo, D. I., Thordarson, T., Björnsson, B. B., and Karlsdóttir, S. (2018). Assessing impact to infrastructures due to tephra fallout from öræfajökull volcano (Iceland) by using a scenario-based approach and a numerical model. Front. Earth Sci. (Lausanne). 6, 196. doi:10.3389/feart.2018.00196
Bevilacqua, A., Neri, A., Bisson, M., Esposti Ongaro, T., Flandoli, F., Isaia, R., et al. (2017). The effects of vent location, event scale, and time forecasts on pyroclastic density current hazard maps at Campi Flegrei caldera (Italy). Front. Earth Sci. (Lausanne). 5, 72. doi:10.3389/feart.2017.00072
Bianco, F., Caliro, S., De Martino, P., Orazi, M., Ricco, C., Vilardo, G., et al. (2022). “The permanent monitoring system of the Campi Flegrei Caldera, Italy,” in Campi Flegrei. A restless caldera in a densely populated area. Active volcanoes of the world. Editors G. Orsi, M. D’Antonio, and L. Civetta (Berlin, Heidelberg: Springer), 219–237. doi:10.1007/978-3-642-37060-1_8
Biasse, S., Bagheri, G., Aeberhard, W., and Bonadonna, C. (2014). Terror: towards a better quantification of the uncertainty propagated during the characterization of tephra deposits. Stat. Volcanol. 1, 1–27. doi:10.5038/2163-338x.1.2
Blake, D. M., Deligne, N. I., Wilson, T. M., Lindsay, J. M., and Woods, R. (2017). Investigating the consequences of urban volcanism using a scenario approach ii: Insights into transportation network damage and functionality. J. Volcanol. Geotherm. Res. 340, 92–116. doi:10.1016/j.jvolgeores.2017.04.010
Bonadonna, C., Connor, C. B., Houghton, B. F., Connor, L., Byrne, M., Laing, A., et al. (2005). Probabilistic modeling of tephra dispersal: Hazard assessment of a multiphase rhyolitic eruption at Tarawera, New Zealand. J. Geophys. Res. 110, B03203. doi:10.1029/2003JB002896
Budnitz, R., Apostolakis, G., and Boore, D. M. (1997). Recommendations for probabilistic seismic hazard analysis: guidance on uncertainty and use of experts. Tech. rep. Washington, DC (United States): US Nuclear Regulatory Commission NRC, Div.
Center, B. S. (2022). Extrae instrumentation package. [Dataset]. Available at: https://tools.bsc.es/extrae.
Chen, W., and Zhao, L. (2015). Review–volcanic ash and its influence on aircraft engine components. Procedia Eng. 99, 795–803. doi:10.1016/j.proeng.2014.12.604
Cheptsov, A., and Beljaev, O. (2020). “A microservices approach for parallel applications design: A case study for cfd simulation in geoscience domain,” in The twelfth international conference on advanced geographic information systems, applications, and services, Valencia, Spain, November 21–25, 2020 (IARIA), 25–30.
Clarkson, R. J., Majewicz, E. J., and Mack, P. (2016). A re-evaluation of the 2010 quantitative understanding of the effects volcanic ash has on gas turbine engines. Proc. Institution Mech. Eng. Part G J. Aerosp. Eng. 230, 2274–2291. doi:10.1177/0954410015623372
Costa, A., Macedonio, G., and Folch, A. (2006). A three-dimensional eulerian model for transport and deposition of volcanic ashes. Earth Planet. Sci. Lett. 241, 634–647. doi:10.1016/j.epsl.2005.11.019
Costa, A., Dell’Erba, F., Di Vito, M. A., Isaia, R., Macedonio, G., Orsi, G., et al. (2009). Tephra fallout hazard assessment at the Campi Flegrei caldera (Italy). Bull. Volcanol. 71, 259–273. doi:10.1007/s00445-008-0220-3
Costa, A., Di Vito, M. A., Ricciardi, G. P., Smith, V. C., and Talamo, P. (2022). The long and intertwined record of humans and the Campi Flegrei volcano (Italy). Bull. Volcanol. 84, 5–27. doi:10.1007/s00445-021-01503-x
Damby, D., Horwell, C., Baxter, P., Delmelle, P., Donaldson, K., Dunster, C., et al. (2013). The respiratory health hazard of tephra from the 2010 Centennial eruption of Merapi with implications for occupational mining of depositsMerapi eruption. J. Volcanol. Geotherm. Res. 261, 376–387. doi:10.1016/j.jvolgeores.2012.09.001
De Martino, P., Dolce, M., Brandi, G., Scarpato, G., and Tammaro, U. (2021). The ground deformation history of the neapolitan volcanic area (campi flegrei caldera, somma–vesuvius volcano, and ischia island) from 20 years of continuous GPS observations (2000–2019). Remote Sens. 13, 2725. doi:10.3390/rs13142725
Deino, A. L., Orsi, G., Piochi, M., and de Vita, S. (2004). The age of the Neapolitan Yellow Tuff caldera-forming eruption (Campi Flegrei caldera-Italy) assessed by 40ar/39ar dating method. J. Volcanol. Geotherm. Res. 133, 157–170. doi:10.1016/s0377-0273(03)00396-2
Folch, A., and Sulpizio, R. (2010). Evaluating long-range volcanic ash hazard using supercomputing facilities: application to somma-vesuvius (Italy), and consequences for civil aviation over the central mediterranean area. Bull. Volcanol. 72, 1039–1059. doi:10.1007/s00445-010-0386-3
Folch, A., Costa, A., and Macedonio, G. (2009). Fall3d: A computational model for transport and deposition of volcanic ash. Comput. Geosci. 35, 1334–1342. doi:10.1016/j.cageo.2008.08.008
Folch, A., Mingari, L., Gutierrez, N., Hanzich, M., Macedonio, G., and Costa, A. (2020). FALL3D-8.0: a computational model for atmospheric transport and deposition of particles, aerosols and radionuclides – part 1: Model physics and numerics. Geosci. Model Dev. 13, 1431–1458. doi:10.5194/gmd-13-1431-2020
Grezio, A., Cinti, F. R., Costa, A., Faenza, L., Perfetti, P., Pierdominici, S., et al. (2020). Multisource bayesian probabilistic tsunami hazard analysis for the gulf of naples (Italy). J. Geophys. Res. Oceans 125, e2019JC015373. doi:10.1029/2019jc015373
Guffanti, M., Casadevall, T. J., and Budding, K. E. (2010). Encounters of aircraft with volcanic ash clouds: A compilation of known incidents, 1953-2009. U.S. Geological Survey Data Series 545, ver. 1.0, 12 p.. Reston, VA: U.S. Geological Survey. Available at: https://pubs.usgs.gov/ds/545/.
Horwell, C. J., and Baxter, P. J. (2006). The respiratory health hazards of volcanic ash: a review for volcanic risk mitigation. Bull. Volcanol. 69, 1–24. doi:10.1007/s00445-006-0052-y
Jenkins, S., Spence, R., Fonseca, J., Solidum, R., and Wilson, T. (2014). Volcanic risk assessment: Quantifying physical vulnerability in the built environment. J. Volcanol. Geotherm. Res. 276, 105–120. doi:10.1016/j.jvolgeores.2014.03.002
Lindsay, J., Marzocchi, W., Jolly, G., Constantinescu, R., Selva, J., and Sandri, L. (2010). Towards real-time eruption forecasting in the auckland volcanic field: application of BET_EF during the New Zealand national disaster exercise ‘ruaumoko. Bull. Volcanol. 72, 185–204. doi:10.1007/s00445-009-0311-9
Lirer, L., Petrosino, P., Alberico, I., and Postiglione, I. (2001). Long-term volcanic hazard forecasts based on Somma-Vesuvio past eruptive activity. Bull. Volcanol. 63, 45–60. doi:10.1007/s004450000121
Macedonio, G., and Costa, A. (2018). “Mappe di pericolosità per la dispersione di cenere a larga scala per lo scenario medio del Vesuvio,” in Relazione per il Dipartimento della Protezione Civile e il Centro di Competenza Plinivs (Istituto Nazionale di Geofisica e Vulcanologia).
Macedonio, G., Costa, A., and Folch, A. (2008). Ash fallout scenarios at vesuvius: numerical simulations and implications for hazard assessment. J. Volcanol. Geotherm. Res. 178, 366–377. doi:10.1016/j.jvolgeores.2008.08.014
Marti, J., Spence, R., Calogero, E., Ordoñez, A., Felpeto, A., and Baxter, P. (2008). Estimating building exposure and impact to volcanic hazards in Icod de los Vinos, Tenerife (Canary Islands). J. Volcanol. Geotherm. Res. 178, 553–561. doi:10.1016/j.jvolgeores.2008.07.010
Martin, U., and Nemeth, K. (2007). Practical volcanology-Lecture notes for understanding volcanic rocks from field based studies. Budapest: Geological Institute of Hungary.
Marzocchi, W., and Jordan, T. H. (2014). Testing for ontological errors in probabilistic forecasting models of natural systems. Proc. Natl. Acad. Sci. U. S. A. 111, 11973–11978. doi:10.1073/pnas.1410183111
Marzocchi, W., Sandri, L., Gasparini, P., Newhall, C., and Boschi, E. (2004). Quantifying probabilities of volcanic events: the example of volcanic hazard at mount vesuvius. J. Geophys. Res. 109, B11201. doi:10.1029/2004jb003155
Marzocchi, W., Sandri, L., and Selva, J. (2008). BET_EF: a probabilistic tool for long-and short-term eruption forecasting. Bull. Volcanol. 70, 623–632. doi:10.1007/s00445-007-0157-y
Marzocchi, W., Sandri, L., and Selva, J. (2010). BET_VH: a probabilistic tool for long-term volcanic hazard assessment. Bull. Volcanol. 72, 705–716. doi:10.1007/s00445-010-0357-8
Marzocchi, W., Selva, J., and Jordan, T. H. (2021). A unified probabilistic framework for volcanic hazard and eruption forecasting. Nat. Hazards Earth Syst. Sci. 21, 3509–3517. doi:10.5194/nhess-21-3509-2021
Mason, B. G., Pyle, D. M., and Oppenheimer, C. (2004). The size and frequency of the largest explosive eruptions on Earth. Bull. Volcanol. 66, 735–748. doi:10.1007/s00445-004-0355-9
Mele, D., Costa, A., Dellino, P., Sulpizio, R., Dioguardi, F., Isaia, R., et al. (2020). Total grain size distribution of components of fallout deposits and implications for magma fragmentation mechanisms: examples from campi flegrei caldera (Italy). Bull. Volcanol. 82, 31–12. doi:10.1007/s00445-020-1368-8
Neri, A., Aspinall, W. P., Cioni, R., Bertagnini, A., Baxter, P. J., Zuccaro, G., et al. (2008). Developing an event tree for probabilistic hazard and risk assessment at Vesuvius. J. Volcanol. Geotherm. Res. 178, 397–415. doi:10.1016/j.jvolgeores.2008.05.014
Newhall, C., and Hoblitt, R. (2002). Constructing event trees for volcanic crises. Bull. Volcanol. 64, 3–20. doi:10.1007/s004450100173
Newhall, C. G., and Self, S. (1982). The volcanic explosivity index (vei) an estimate of explosive magnitude for historical volcanism. J. Geophys. Res. 87, 1231–1238. doi:10.1029/jc087ic02p01231
Orsi, G., Di Vito, M. A., and Isaia, R. (2004). Volcanic hazard assessment at the restless campi flegrei caldera. Bull. Volcanol. 66, 514–530. doi:10.1007/s00445-003-0336-4
Orsi, G., Di Vito, M. A., Selva, J., and Marzocchi, W. (2009). Long-term forecast of eruption style and size at Campi Flegrei caldera (Italy). Earth Planet. Sci. Lett. 287, 265–276. doi:10.1016/j.epsl.2009.08.013
Ort, M., Orsi, G., Pappalardo, L., and Fisher, R. V. (2003). Emplacement processes in a far-traveled dilute pyroclastic current: anisotropy of magnetic susceptibility studies of the campanian ignimbrite. Bull. Volcanol. 65, 55–72. doi:10.1007/s00445-002-0241-2
Paris, R., Ulvrova, M., Selva, J., Brizuela, B., Costa, A., Grezio, A., et al. (2019). Probabilistic hazard analysis for tsunamis generated by subaqueous volcanic explosions in the campi flegrei caldera, Italy. J. Volcanol. Geotherm. Res. 379, 106–116. doi:10.1016/j.jvolgeores.2019.05.010
Peluso, R. (2014). Il database sismico serenade: un sistema rest per la gestione delle localizzazioni sismiche. Roma: MISCELLANEA INGV 46.
Perfetti, P., Tonini, R., and Selva, J. (2021). [Dataset]. perfettp/BET-Tephra: v0.2017.04. Zenodo. doi:10.5281/zenodo.4638667
Pillet, V., Labarta, J., Cortes, T., and Girona, S. (1995). “Paraver: A tool to visualize and analyze parallel code,” in Proceedings of WoTUG-18: transputer and occam developments (Citeseer), 17–31.44
POP (2022). POP standard metrics for parallel performance analysis. [Dataset]. Available at: https://pop-coe.eu/node/69.
Prata, A., and Tupper, A. (2009). Aviation hazards from volcanoes: the state of the science. [Dataset].
Prata, A. T., Mingari, L., Folch, A., Macedonio, G., and Costa, A. (2021). FALL3D-8.0: a computational model for atmospheric transport and deposition of particles, aerosols and radionuclides – Part 2: Model validation. Geosci. Model Dev. 14, 409–436. doi:10.5194/gmd-14-409-2021
Pyle, D. M. (2015). “Sizes of volcanic eruptions,” in The encyclopedia of volcanoes (Elsevier), 257–264.
Sandri, L., Jolly, G., Lindsay, J., Howe, T., and Marzocchi, W. (2012). Combining long-and short-term probabilistic volcanic hazard assessment with cost-benefit analysis to support decision making in a volcanic crisis from the Auckland Volcanic Field, New Zealand. Bull. Volcanol. 74, 705–723. doi:10.1007/s00445-011-0556-y
Sandri, L., Costa, A., Selva, J., Tonini, R., Macedonio, G., Folch, A., et al. (2016). Beyond eruptive scenarios: assessing tephra fallout hazard from neapolitan volcanoes. Sci. Rep. 6, 24271–24313. doi:10.1038/srep24271
Sandri, L., Tierz, P., Costa, A., and Marzocchi, W. (2018). Probabilistic hazard from pyroclastic density currents in the Neapolitan area (Southern Italy). J. Geophys. Res. Solid Earth 123, 3474–3500. doi:10.1002/2017jb014890
Selva, J., Costa, A., Marzocchi, W., and Sandri, L. (2010). BET_VH: exploring the influence of natural uncertainties on long-term hazard from tephra fallout at campi flegrei (Italy). Bull. Volcanol. 72, 717–733. doi:10.1007/s00445-010-0358-7
Selva, J., Marzocchi, W., Papale, P., and Sandri, L. (2012a). Operational eruption forecasting at high-risk volcanoes: the case of campi flegrei, naples. J. Appl. Volcanol. 1, 5–14. doi:10.1186/2191-5040-1-5
Selva, J., Orsi, G., Di Vito, M. A., Marzocchi, W., and Sandri, L. (2012b). Probability hazard map for future vent opening at the Campi Flegrei caldera, Italy. Bull. Volcanol. 74, 497–510. doi:10.1007/s00445-011-0528-2
Selva, J., Costa, A., Sandri, L., Macedonio, G., and Marzocchi, W. (2014). Probabilistic short-term volcanic hazard in phases of unrest: A case study for tephra fallout. J. Geophys. Res. Solid Earth 119, 8805–8826. doi:10.1002/2014jb011252
Selva, J., Costa, A., De Natale, G., Di Vito, M. A., Isaia, R., and Macedonio, G. (2018). Sensitivity test and ensemble hazard assessment for tephra fallout at Campi Flegrei, Italy. J. Volcanol. Geotherm. Res. 351, 1–28. doi:10.1016/j.jvolgeores.2017.11.024
Selva, J., Azzaro, R., Taroni, M., Tramelli, A., Alessio, G., Castellano, M., et al. (2021). The seismicity of ischia island, Italy: An integrated earthquake catalogue from 8th century bc to 2019 and its statistical properties. Front. Earth Sci. (Lausanne). 9, 629736. doi:10.3389/feart.2021.629736
Spence, R. J., Baxter, P. J., and Zuccaro, G. (2004). Building vulnerability and human casualty estimation for a pyroclastic flow: a model and its application to vesuvius. J. Volcanol. Geotherm. Res. 133, 321–343. doi:10.1016/s0377-0273(03)00405-0
Sulpizio, R., Folch, A., Costa, A., Scaini, C., and Dellino, P. (2012). Hazard assessment of far-range volcanic ash dispersal from a violent strombolian eruption at somma-vesuvius volcano, naples, Italy: Implications on civil aviation. Bull. Volcanol. 74, 2205–2218. doi:10.1007/s00445-012-0656-3
Titos, M., Martínez Montesinos, B., Barsotti, S., Sandri, L., Folch, A., Mingari, L., et al. (2022). Long-term hazard assessment of explosive eruptions at Jan Mayen (Norway) and implications for air traffic in the North Atlantic. Nat. Hazards Earth Syst. Sci. 22, 139–163. doi:10.5194/nhess-22-139-2022
Tonini, R., Sandri, L., Costa, A., and Selva, J. (2015). Brief Communication: The effect of submerged vents on probabilistic hazard assessment for tephra fallout. Nat. Hazards Earth Syst. Sci. 2, 7181–7196. doi:10.5194/nhessd-2-7181-2014
Wilson, T. M., Stewart, C., Sword-Daniels, V., Leonard, G. S., Johnston, D. M., Cole, J. W., et al. (2012). Volcanic ash impacts on critical infrastructure. Phys. Chem. Earth, Parts A/B/C 45, 5–23. doi:10.1016/j.pce.2011.06.006
Zuccaro, G. (2008). “A probabilistic model for the evaluation of the impact of explosive eruption scenarios at Vesuvius,”. Urban habitat constructions under catastrophic events: COST Action C26. Editors F. M. Mazzolani, E. Mistakidis, R. P. Borg, M. Byfield, G. De Matteis, and E. Dubina (Malta: University of Malta), 476, 486–70.
Glossary
BET Bayesian event tree
CDF conditional probability density function
CF Campi Flegrei
CFc Campi Flegrei caldera
ChEESE Center of Excellence for Exascale in Solid Earth
CPU central processing unit
E effusive
EF eruptive forecasting
ESP eruptive source parameter
ESPs eruptive source parameters
FL flight level
H high
HPC high-performance computing
HPDA high-performance data analytics
INGV Istituto Nazionale di Geofisica e Vulcanologia
IPC instructions per cycle
L low
LT long term
M medium
MER mass eruption rate
MPI Message Passing Interface
NUMA non-uniform memory access
PDF probability density function
PoC proof of concept
POP performance optimization and productivity
POP CoE EU Performance Optimization and Productivity Center of Excellence in HPC
PVHA probabilistic volcanic hazard assessment
PVHA_HPC-WF Probabilistic Volcanic Hazard Assessment Workflow
SERENADE SEismic Restful ENAbled DatabasE
ST short term
TEM total erupted mass
TEV total erupted volume
TGSD total grain size distribution
VEI volcanic explosivity index
VS volcanic scenario
WMS-light workflow manager system light.
Keywords: HPC, probabilistic volcanic hazard assessment, ash dispersal, exascale computing, Bayesian event tree, performance optimization and productivity, workflow manager, Campi Flegrei
Citation: Montesinos BM, Luzón MT, Sandri L, Rudyy O, Cheptsov A, Macedonio G, Folch A, Barsotti S, Selva J and Costa A (2022) On the feasibility and usefulness of high-performance computing in probabilistic volcanic hazard assessment: An application to tephra hazard from Campi Flegrei. Front. Earth Sci. 10:941789. doi: 10.3389/feart.2022.941789
Received: 11 May 2022; Accepted: 22 August 2022;
Published: 23 September 2022.
Edited by:
Mark Bebbington, Massey University, New ZealandReviewed by:
Alberto Armigliato, Alma Mater Studiorum—Università di Bologna, ItalyKaroly Nemeth, Massey University, New Zealand
Copyright © 2022 Montesinos, Luzón, Sandri, Rudyy, Cheptsov, Macedonio, Folch, Barsotti, Selva and Costa. This is an open-access article distributed under the terms of the Creative Commons Attribution License (CC BY). The use, distribution or reproduction in other forums is permitted, provided the original author(s) and the copyright owner(s) are credited and that the original publication in this journal is cited, in accordance with accepted academic practice. No use, distribution or reproduction is permitted which does not comply with these terms.
*Correspondence: Beatriz Martínez Montesinos, YmVhdHJpei5tYXJ0aW5lekBpbmd2Lml0