 Yifei Chen1,2
 Yongjian Wang
 Fuqiong Huang
 Haoyu Shi
95% of researchers rate our articles as excellent or good
Learn more about the work of our research integrity team to safeguard the quality of each article we publish.
Find out more
ORIGINAL RESEARCH article
Front. Earth Sci. , 12 September 2022
Sec. Solid Earth Geophysics
Volume 10 - 2022 | https://doi.org/10.3389/feart.2022.941239
This article is part of the Research Topic Advanced Methods in Signal Processing, Image Processing and Pattern Recognition in Geosciences View all 6 articles
In situ stress is a natural phenomenon. According to the Mohr–Coulomb criterion, it is found that when the ratio of principal stress (the ratio of maximum principal stress to minimum principal stress) of crustal rock mass in a certain environment exceeds the critical value, the rock mass will change from an elastic state to a plastic state. This critical value is the extreme limit of the principal stress ratio, which is related to the cohesion and internal friction angle of rock mass, and the limit of the principal stress ratio in the shallow part is discrete. Although the principal stress of deep rock mass is large, the ratio limit is mainly related to the internal friction angle. The calculation results show that the principal stress ratio of deep rock mass is stable in a small range. By comparing and analyzing 574 groups of measured data, it is found that all the measured principal stress ratios are within the limit range of the theoretical ratio, which also shows the characteristics of shallow dispersion and deep stability, indicating that the theoretical analysis and the measured results are consistent with each other. In order to show the change process of in situ stress, a numerical model fitting plate motion is established, and the limits of the principal stress ratio in five periods in the past 500,000 years are compared. The results show that the maximum principal stress at measuring points at different depths shows a change law of “first increasing and then stabilizing.” In areas close to or exceeding the principal stress ratio, high shear strain zones appear in the rock mass, and the stress is released in the form of plastic failure or shear dislocation, making the main stress ratio finally stable between 6.0 and 8.0. Therefore, it is easy to judge the stability of regional strata by using the ratio of principal stress; the area with a small ratio of principal stress belongs to the area with good stability, and when the ratio of principal stress is close to the limit of the ratio, it is an unstable area. The measured data show that the area with a high ratio of principal stress is often the recent seismic activity area; therefore, the ratio of in situ stress may become a possible index for earthquake prediction.
Mohr–Coulomb criterion has good applicability in judging rock mass damage (Coulomb, 1773). In human engineering activities such as coal mining and dam construction, the engineering rock mass is buried shallow and in a low confining pressure environment. Technicians in the field of mining engineering can use the Mohr–Coulomb criterion to effectively judge the risks of rock mass, such as roof accidents and rock burst accidents (Li et al., 2018; Shi et al., 2020b). These accidents are often caused by the fracture of the rock mass. For shallow rock mass with small confining pressure, we often use the principal stress difference as an index to judge whether the rock mass is damaged, but in a deep high-stress environment, the principal stress difference will become very large and discrete, which is inconvenient for practical application. Deep rock mass activities such as earthquakes and volcanoes will bring disastrous consequences to human society, and we have not yet obtained effective prediction indicators of deep disasters. Coulomb stress is usually used as an index to predict earthquakes, but it describes the increment of in situ stress, which is still the shallow stress value (Wan, 2020), which is not enough to explain the mechanical mechanism of rock mass failure or fault dislocation. Therefore, earthquake prediction is still a worldwide problem (Huang et al., 2017). Therefore, we need to find a discriminant index that can meet both the shallow and the deep. According to the author’s previous research (Shi and Ma, 2018a; Shi et al., 2018b), when the local stress ratio reaches a certain critical value, the crustal rock mass begins to appear as a plastic zone or fault dislocation. In the same region, the limit value of the in situ stress ratio is basically similar, so the purpose of predicting the deep stress state can be achieved by monitoring the change of the shallow stress.
The distribution of crustal stress must follow certain rules. Brown and Hoek obtained the regression equation of in situ stress distribution on the basis of a large number of statistics and gave the general law of in situ stress distribution (Brown and Hoek, 1978). Based on the measured data of 1,780 two-dimensional hydraulic fracturing and stress releases in the Chinese Mainland, Wang Yanhua analyzed the regression relationship between multiple stress parameters and depth (Wang et al., 2012), and Yang Shuxin gave the variation characteristics of the lateral pressure coefficient in the Chinese Mainland with depth: discrete in the shallow, concentrated with the increase of depth (Yang et al., 2012). However, these laws are obtained on the basis of statistics, and their deep-seated mechanical mechanism has not been clarified. Xie Furen and others found through the “world stress diagram” that the direction of the maximum horizontal principal stress in most parts of the world is very consistent with the absolute motion trajectory of the plate, reflecting the close relationship between tectonic stress and plate motion (Xie et al., 2004) but failed to give the relationship between plate motion and stress increase. In fact, there is a limit to the increase of the maximum principal stress of the crustal rock mass, and when the maximum principal stress approaches the limit, the value is usually stable in a small range (Bak et al., 1987; Shi and Ma, 2018a; Shi et al., 2018b). When the ratio of the maximum principal stress to the minimum principal stress reaches the critical state, the failure range of the rock mass may increase exponentially. At this time, small stress variables may lead to sudden large-scale fracture of the rock (Ma et al., 2015; Guo et al., 2016). This feature is of great significance to the study of rock dynamic phenomena such as earthquakes. Taking the limit value of the in situ stress ratio as an index to judge regional stability has a good application prospect, and the in situ stress ratio may become a possible index to predict the occurrence of earthquakes.
Mohr–Coulomb criterion is the most widely used strength criterion at present. The criterion expresses the mathematical relationship between shear stress and normal stress (Shi et al., 2020c), and yield occurs once the shear stress and normal stress meet the failure criterion. The Mohr–Coulomb yield function expressed by the maximum and minimum principal stress is as follows:
where σ1 and σ3 represent the maximum and minimum principal stresses of rock mass MPa, respectively, and the vertical stress of crustal rock mass is generally γH. γ is the average unit weight of rock mass, and H is the depth. Then, λ is the ratio of maximum and minimum principal stresses; φ represents the internal friction angle of rock mass; c is the cohesion of rock mass, MPa, and Eq. 1 can be rewritten as follows:
In Eq. 1, f =0 indicates that the rock mass is in a critical state; f > 0 indicates that the rock mass enters the plastic state and plastic flow occurs, resulting in the coordinated change of local in situ stress until f = 0 at this position; f < 0 indicates that the rock mass is in the elastic state. Therefore, f =0 is the critical value of the elastic-plastic state of rock mass (Stephansson et al., 1986). The ratio of principal stress in a critical state is its ratio limit λmax:
The distribution of the stress state of rock mass in nature must follow a certain law. In most areas, two principal stresses are located in the horizontal or near horizontal plane. Hoek and Brown gave the hyperbolic relationship of σh max/σv value with depth by means of linear regression according to the measured data of in situ stress (Brown and Hoek, 1978). Stephensson et al. gave the linear relationship of the maximum horizontal principal stress and the minimum horizontal principal stress with depth in the Fennoscandian paleocontinent according to the measured results (Stephansson et al., 1986). Generally speaking, the distribution of principal stress in the shallow part of these results is relatively scattered. With the increase of depth, the maximum horizontal principal stress gradually shows a linear relationship, but the mechanical essence of this phenomenon has not been clarified. In this article, 452 measured in situ stress data at home and 122 foreign in situ stress data (Liao et al., 1985; Liang et al., 1991; Wang et al., 2000; Li et al., 2004; Li et al., 2007; Li et al., 2008; Wu et al., 2008; Chen et al., 2012; Du et al., 2013; Tan et al., 2014; Niu et al., 2015; Zhang et al., 2015; Song et al., 2018) are counted. The distribution of depth and stress ratio is shown in Figure 1.
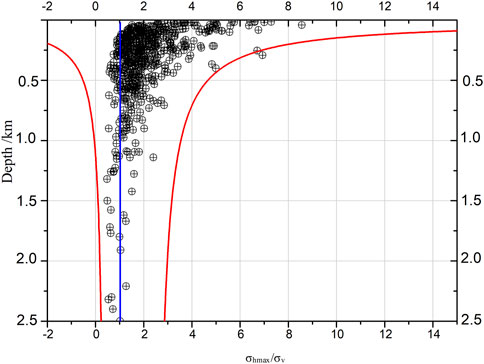
FIGURE 1. Distribution of measured results and the theoretical ratio of in situ stress. The black dot is the ratio of the maximum horizontal principal stress to the vertical stress when the cohesion is 30 MPa and the internal friction angle is 25°; the theoretical ratio limit calculated by Eq. 3 is indicated by a red line in the figure.
It can be seen from Figure 1 that the statistical data of 574 in situ stress measurement points basically fall within λh max. It shows that the in situ stress ratio has limited characteristics, and it can be seen that the in situ stress ratio in the shallow part is relatively dispersed. When the depth exceeds 1 km, the in situ stress ratio is close to 1.
This article selects FLAC3D5.0 numerical simulation software, which is suitable for dealing with large-scale and large deformation engineering and geological problems. The strike length of this model is designed to be 80 km; the height of the model is 40 km; the thickness of the model is 1 km. The boundary conditions and loading mode of the model are shown in Figure 2. The upper part of the model is a free boundary; the lower part of the model is simplified as a displacement boundary condition, which can move in the X direction and provide fixed support in the Z direction. On the right side of the model is the boundary of relative static motion, which is simplified as moving in the Z direction and providing fixed hinge support in other directions. Before the displacement is applied to the left boundary of the model, the gravity stress field is applied to the rock mass within the whole model to make the model have the initial stress environment. The vertical stress of the rock mass is roughly proportional to the depth and σx = σy = σz. The movement amount on the left side of the model is gradually applied according to the loading steps, that is, 1 mm/yr is applied in each loading step. If the relative movement speed of the block is 1 mm/step, each loading step is 1 year. In order to study the changes of principal stress at different positions in the model, tracking measuring points are set at different positions in the model to monitor the changes of principal stress. The measuring points are shown in Figure 2.
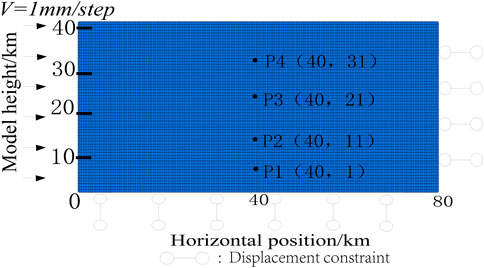
FIGURE 2. Boundary conditions and loading of the calculation model.
Mohr–Coulomb criterion is selected for rock failure, and its basic physical and mechanical parameters include elastic modulus, Poisson’s ratio, cohesion, internal friction angle, dilatancy angle, and tensile strength. So far, there are not many studies on the mechanical properties of rocks in the deep crust, which are only limited to a few kilometers. It is generally believed that with the increase in depth, the rock mass becomes denser, and the density and elastic modulus of rock mass will increase with the increase in depth (Cai and Wang, 1997; Qin et al., 2012; Xiong et al., 2015). The elastic modulus of rock mass in the numerical simulation analysis model in this article refers to the value of granite. Taking deep granite as an example, its internal friction angle is generally 45°–60°, taking 50°; cohesion is generally 10–50 MPa, and the value here is 30 MPa. The physical and mechanical parameters of rock mass are shown in Table 1.
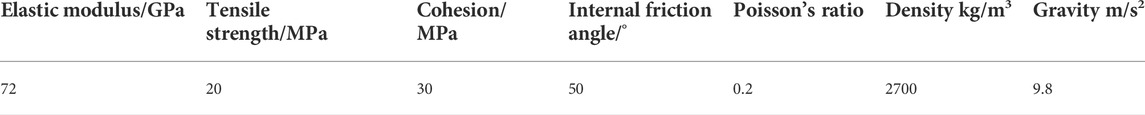
TABLE 1. Rock mechanics parameter list.
It can be seen from Figure 3 that the maximum principal stress of measuring points at different depths increases with the increase in depth, which has experienced the process of first increasing and then stabilizing, but the shallow measuring points reach a stable state first. The ratio of each measuring point is basically stable between 6 and 8, and the variation range of the minimum principal stress is small, indicating that there are limits or limit ratios at measuring points at different depths. The minimum principal stress of deep rock mass can be close to γH. The vertical stress at 10 km depth is about 270 MPa, while the cohesion of granite generally does not exceed 50 MPa. According to Eq. 3, the cohesion of deep rock mass is far less than the minimum principal stress, and the main parameter determining the limit ratio of deep in situ stress is the internal friction angle of rock mass. At this time, the limit ratio is expressed as follows:
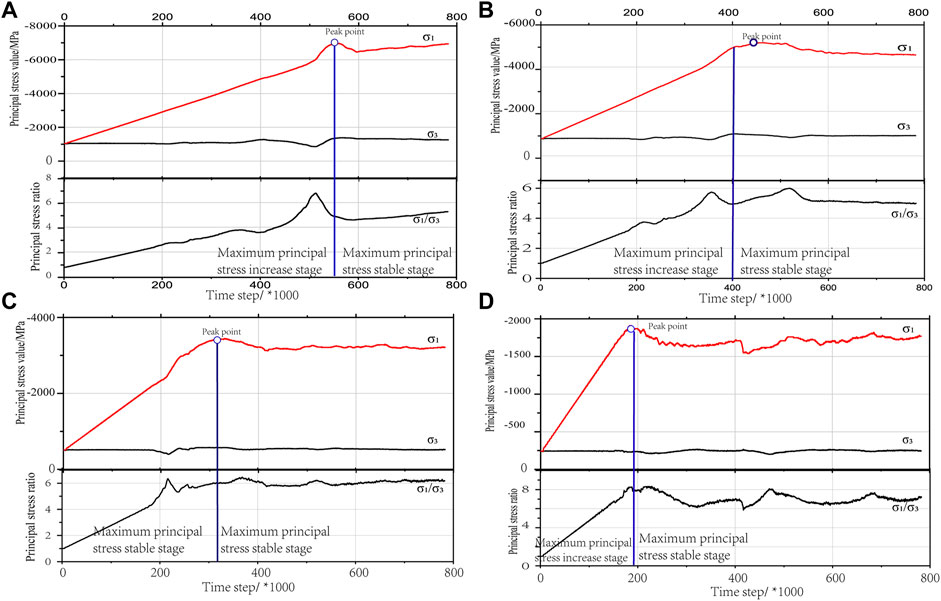
FIGURE 3. Curves of maximum principal stress at different depths. The depth of measuring point 1 is 39 km (A), the depth of measuring point 2 is 29 km (B), the depth of measuring point 3 is 19 km (C), and the depth of measuring point 4 is 9 km (D); the red line in the figure is the change curve of the maximum principal stress.
When φ = 50°, λmax = 7.54. The theoretical results are similar to the numerical simulation results, as shown in Figure 3. When φ = 34°, λmax = 3.54.
It can be seen from Figure 4A that in 100 k years of plate movement, the maximum principal stress ratio in the deep is relatively small, close to 1.08, and the principal stress ratio near the surface in the shallow is relatively large, up to 15.9. At this time, the stress variable of the rock mass is at a low level, and the maximum stress variable is 1.59×10⁻⁷, as shown in Figure 4B. By 200 k years, the minimum ratio of maximum and minimum principal stresses in the deep is 2.6. As shown in Figure 4C, there is an inclined high shear strain zone in the shallow rock mass. The maximum and minimum ratio of principal stress in the high shear strain zone is 6.0–8.0, and the shear strain is 5.77×10⁻⁷, as shown in Figure 4D. By 300 k years, the maximum and minimum principal stress ratio in the deep is greater than 3.2, as shown in Figure 4E. At this time, there are several roughly parallel high shear strain zones in the shallow rock mass. The maximum and minimum principal stress ratio in the high shear strain zone is 6.0–8.0, and the maximum shear strain is 9.82×10⁻⁷, as shown in Figure 4F. By 400 k years, the minimum ratio of maximum and minimum principal stresses in the deep is 3.0, as shown in Figure 4G. At this time, there are multiple conjugate high shear strain zones in the shallow rock mass. The maximum and minimum ratio of principal stress in the high shear strain zone is 6.0–8.0, and the maximum shear strain is 16.8×10⁻⁷, as shown in Figure 4H. At 500 k years, the minimum ratio of maximum and minimum principal stresses in the deep is 2.5, as shown in Figure 4I. At this time, there are multiple conjugate high shear strain zones in the shallow rock mass. The maximum and minimum ratio of principal stress in the high shear strain zone is 6.0–8.0, and the maximum shear strain is 9.92×10⁻⁷, as shown in Figure 4J.
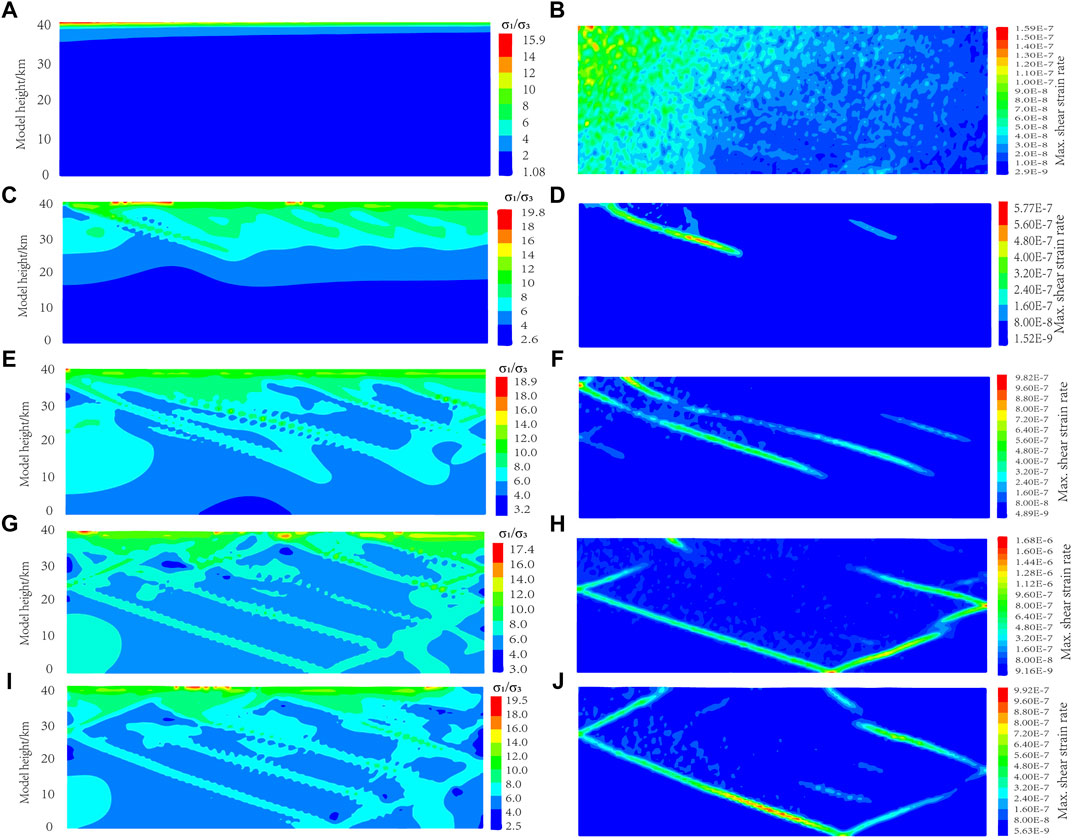
FIGURE 4. Spatial distribution of maximum and minimum principal stress ratio in different periods. The stress ratio and the maximum shear strain (A) (B) when the plate movement acts for 100 k years, the stress ratio and the maximum shear strain (C) (D) when the plate movement acts for 200 k years, the stress ratio and the maximum shear strain (E) (F) when the plate movement acts for 300 k years, the stress ratio and the maximum shear strain (G) (H) when the plate movement acts for 400 k years, and the stress ratio and the maximum shear strain (I) (J) when the plate movement acts for 500 k years.
From the abovementioned analysis, it can be seen that the ratio of the maximum and minimum principal stresses in the shallow part has great discreteness, while the maximum ratio in the deep part is mainly in the high shear strain zone, and its ratio is generally 6.0–8.0. According to the calculation of Eq. 3, λmax at a depth of 20 km is 7.8, which is roughly consistent with the simulation results.
Generally speaking, the measured maximum horizontal stress, minimum horizontal stress, and vertical stress are basically similar to the magnitude and direction of the principal stress. Set maximum horizontal stress σhmax=k1γH, minimum horizontal stress σhmin = k2γH, and vertical stress σv = γH. So, k1 = σhmax/γH and k2 = σhmin/γH。
When k2>1, k2γH > γH, that is, σ3=γH, and σ1=λmaxγH;
When k2=1, σ3=γH and σ1=λmaxγH;
When k2<1, σ3=k2γH and σ1=λmaxσ3.
When the calculation result is σhmax/σv<1 according to Eq. 3, that is, the maximum principal stress is the vertical stress. The relationship between K2 value and in-situ stress environment is shown in Table 2.
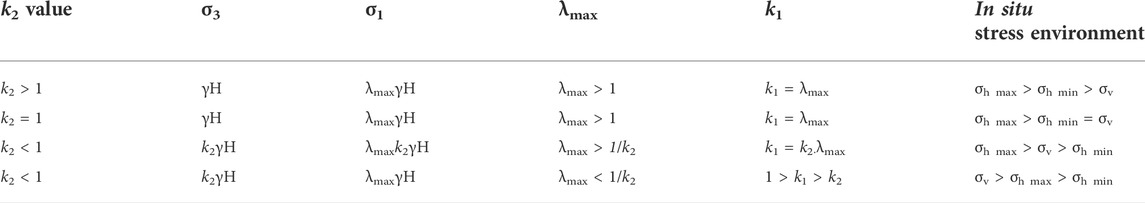
TABLE 2. In situ stress environment analysis.
If k2 takes 1, we can get a relationship between λmax and H as shown in Figure 5.
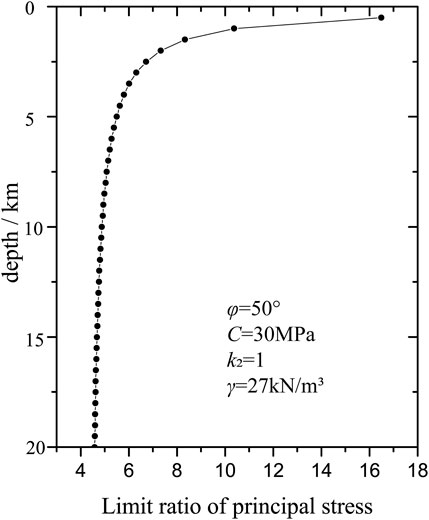
FIGURE 5. Relationship between limit and depth of principal stress ratio.
When k2 value is less than 1, it indicates that the minimum principal stress at this time is less than the vertical stress, that is, σ3 = k2γH. Substitute into Eq. 3 to calculate the limit of the ratio of the principal stress as shown in Figure 6. At the same time, we can get that with the increase of k2 value, the maximum ratio of the principal stress at different depths decreases with the increase of depth but gradually converges.
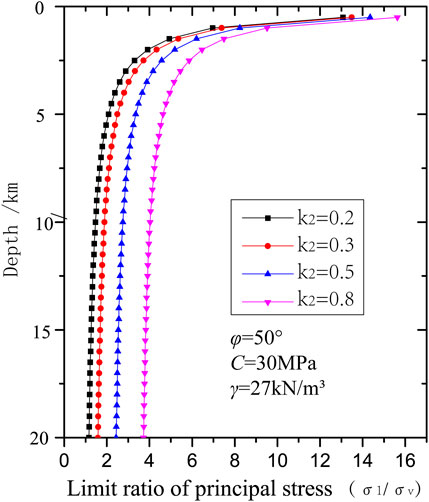
FIGURE 6. Distribution of principal stress ratio under different k2.
Similarly, when k1 is determined and k1 > 1, the maximum principal stress σ1 = k1γH and σ3 = λminγH. Eq. 1 can be written as follows:
The minimum ratio limit of principal stress (λmin) can be calculated by Eq. 5.
As can be seen from Figure 7, since the value of k is 1.0, that is, the minimum principal stress at this time is the vertical stress. When other parameters are determined and only the internal friction angle of rock mass is changed, the limit value of the ratio of principal stress of rock mass tends to a certain value with the increase in depth, and the limit value decreases with the decrease of internal friction angle of rock, from 7.88 with an internal friction angle of 60° to 1.34 with an internal friction angle of 20°. When other parameters are determined and only the cohesion of rock mass is changed, with the increase in depth, the limit of principal stress ratio of rock mass with different cohesion is relatively discrete in the shallow part, up to 24, while the limit of principal stress ratio in the deep part gradually approaches a fixed value, that is, for rock mass with the cohesion of 10–50 MPa and a depth of 20 km, the ratio limit of principal stress is close to 4.3–4.7. In other words, the internal friction angle has a great influence on the limit of principal stress ratio in shallow and deep parts; cohesion has a great influence on the limit of principal stress ratio of shallow rock mass and less on deep rock mass, as shown in Figure 8.
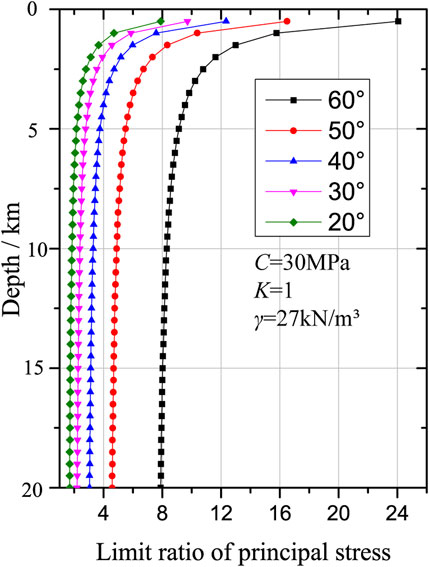
FIGURE 7. Distribution of stress limit ratio at different internal friction angles.
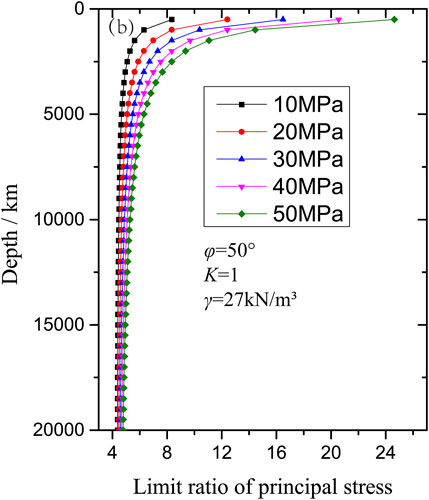
FIGURE 8. Distribution of stress limit ratio under different cohesion.
When the ratio of in situ stress in a region approaches the ratio limit, the crustal rock mass in the region will be in an unstable critical state, resulting in a wide range of plastic zones, forming faults, and even dynamic phenomena such as earthquakes (Ma and Guo, 2014; Ma et al., 2019; Qiao et al., 2019).
When there is a large fault in this area, the large in situ stress will cause the fault to dislocate, so as to release the stress accumulated due to plate movement and make the maximum principal stress fluctuate in a small range, and when this release occurs in a short time, it may cause a seismic effect (Shi et al., 2020a). When the local stress ratio approaches the limit and there is no pre-existing fault in this area, a plastic zone with a certain direction is formed in the crustal rock mass, as shown in Figure 4, under continuous plate compression, plastic dislocation occurs in the rock mass, which can also maintain a relatively stable state of the maximum principal stress of the rock mass. When the lateral pressure coefficient approaches the limit, the rock stratum in this area will be in an unstable critical state, and taking the in situ stress ratio of λH > 2.8 from Figure 1 obtains the results shown in Table 3. For example, the values of lateral pressure coefficients near Erlang Mountain of Sichuan Tibet highway, Pingwu and Panlong near Longmen Mountain, and Zhangbei of Hebei Province are obviously high. When the measured results are close to the theoretical limit of the lateral pressure coefficient, the region may be in an unstable state. According to the variation law of in situ stres, the author inferred that the principal stress near the Longmenshan fault zone will be in a critical state for a long time. In the actual tectonic dynamic environment, the Longmenshan fault zone is in a seismic cycle of “stress accumulation—entering a critical state—earthquake generation-new stress accumulation” for a long time.
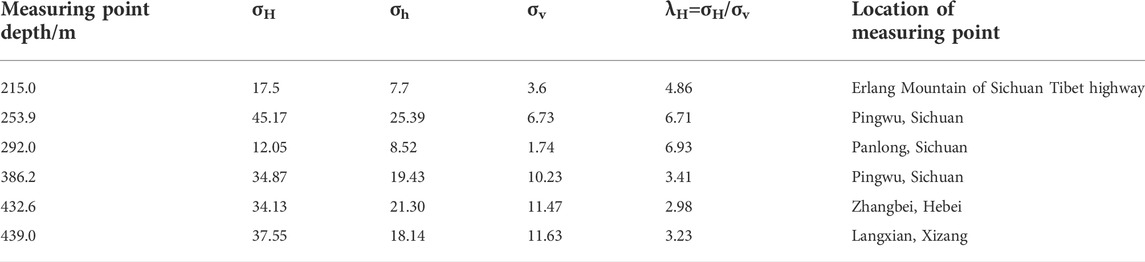
TABLE 3. Regional distribution of measured results close to the theoretical ratio limit.
Through theoretical derivation, numerical simulation, and calculation, combined with the actual measurement results, it is proved that it is feasible to judge the stability of crustal rock mass by taking the in situ stress ratio as an index, which can become a unified discrimination index for shallow and deep parts, and provides a new idea for predicting the occurrence of earthquakes.
(1) The difference between the maximum principal stress and the minimum principal stress is usually used to judge whether the rock mass is damaged, but this method is suitable for a low confining pressure environment. As the depth increases, the difference will become very large, resulting in inconvenience in the application. However, the principal stress ratio of deep rock mass is easier to constrained in a small range, which is convenient for application.
(2) According to the theoretical analysis, the shallow in situ stress ratio is relatively dispersed, while the limit of in situ stress ratio of deep rock mass is mainly related to the internal friction angle of rock mass, and the limit of in situ stress ratio is close to λmax = (1+sinφ)/(1-sinφ).
(3) Under the plate compression, the in situ stress increases linearly in the early stage, and the high shear strain zone appears in the late stage because the rock mass reaches the strength limit. After that, the in situ stress stabilizes in a small range.
(4) Our research provides a useful index for exploring earthquake precursors. When the principal stress ratio is close to 1, the stratum in this area is relatively stable. When the ratio of principal stress is close to the ratio limit, the crustal rock mass in this area will be in an unstable critical state. The application of the principal stress ratio to analyze the stability of regional rock mass is very convenient.
The original contributions presented in the study are included in the article/Supplementary Material; further inquiries can be directed to the corresponding author.
YC is the main writer of the manuscript; YW assisted in the analysis of geological data; FH provided the writing ideas of the manuscript and gave guidance in the writing process; LM processed some graphics; CY assisted in data sorting. HS is the author of the writing point of view and innovation.
The study is supported by self selected project of North China University of science and Technology (hjxkt2020001), the financial support provided by the Foundation of Basic Research of Central University (3142018022) and the National Natural Science Foundation of China (51674119).
We thank the four reviewers and the editor for their constructive comments to improve the quality of this manuscript. Also, thanks to Guo Xiaofei from the China University of Mining and Technology for helping with English writing.
Author YC was employed by Pingshu Coal Industry, Shanxi Huayang Group.
The remaining authors declare that the research was conducted in the absence of any commercial or financial relationships that could be construed as a potential conflict of interest.
All claims expressed in this article are solely those of the authors and do not necessarily represent those of their affiliated organizations, or those of the publisher, the editors, and the reviewers. Any product that may be evaluated in this article, or claim that may be made by its manufacturer, is not guaranteed or endorsed by the publisher.
The Supplementary Material for this article can be found online at: https://www.frontiersin.org/articles/10.3389/feart.2022.941239/full#supplementary-material
Bak, P., Tang, C., and Wiesenfeld, K. (1987). Self-organized criticality: An explanation of the 1/f noise. Phys. Rev. Lett. 59 (4), 381–384. doi:10.1103/physrevlett.59.381
Brown, E. T., and Hoek, E. (1978). Trends in relationships between measured in-situ stresses and depth. Int. J. Rock Mech. Min. Sci. Geomechanics Abstr. 15 (4), 211–215. doi:10.1016/0148-9062(78)91227-5
Cai, M. F., and Wang, S. H. (1997). Relation between ground stress behavior and properties of surrounding rock. China Min. Mag. 6 (6), 38–41.
Chen, Q. C., Feng, C. J., Meng, W., and Qin, X. (2012). Analysis of insitu stress measurements at the northeastern section of the Longmenshan fault zone after the 5.12 Wenchuan earthquake. Chin. J.Geophys 55 (12), 3923–3932. doi:10.6038/j.issn.0001-5733.2012.12.005
Coulomb, C. A. (1773). Essai sur une application des regles des maximis et minimis a quelques problemes de statique relatifs a 1’architecture. Memoires de Math. de Physique, Present. a I’ Acad. R. des Sci. par divers Savans, Ius dans ses Assemblees 7, 343–382.
Du, J. J., Chen, Q. C., An, Q. M., Wang, Y., Wen, M., and Li, G. (2013). Hydro fracturing in-situ stress measurement in hanzhong basin, shaanxi Province. Acta Seismol. Sin. 34 (6), 799–808. doi:10.3969/j.issn.0253-3782.2013.06.003
Guo, X. F., Nianjie, M., and Zhao, X. D. (2016). General shapes and criterion for surrounding rock mass plastic zone of round roadway. J. China Coal Soc. 41 (8), 1871–1877. doi:10.13225/j.cnki.jccs.2016.0787
Huang, F. Q., Li, M., Ma, Y. C., Han, Y., Tian, L., Yan, W., et al. (2017). Studies on earthquake precursorsin China: Are view for recent 50 years. Geodesy Geodyn. 8 (1), 1–12. doi:10.1016/j.geog.2016.12.002
Li, H., Xie, F. R., and Liu, F. Q. (2007). Studies on in-situ stress measurement near fault in Urumqicity. Seismol. Geol. 29 (4), 805–812.
Li, H. M., Zhou, Y., and Su, C. D. (2004). Measurement and characteristics analysis of in-situ stresses of Yanbei coal mine. Chin. J. Rock Mech. Eng. 23, 3938–3942.
Li, J., Man, N. J., and Ding, Z. W. (2018). Heterogeneous large deformation mechanism based on change of principal stress direction in deep gob side entry and control. J. Min. Saf. Eng. 35 (4), 670–676. doi:10.13545/j.cnki.jmse.2018.04.002
Li, R. S., Cui, X. F., and Diao, G. L. (2008). Temporal andspatial variation of present crustal stress in northern part of North China. Acta Seismol. Sin. 30 (6), 570–580.
Liang, G. P., Sun, S. Z., and Guo, Q. L. (1991). “Results of hydrofracture stress measu rement in laxiw a hydropower station region , qing hai Province,” in Proceeding of crustal tectonic and crustal stress, 132–141.5
Liao, C. T., Cui, M. D., and Ren, X. F. (1985). In-situ stress m easurements and t ect oni c stress field in the Jinchuan mine area. Beijing: Geological Pu blishing House, 22–35.
Ma, J., and Guo, Y. S. (2014). Accelerated synergism priorto fault instability: Evidencefrom laboratory experiments and an earthquake case. Seismol. Geol. 36 (3), 547–561. doi:10.3969/j.issn.0253-4967.2014.03.001
Ma, J., Zhao, Z. Q., and Shi, H. Y. (2019). Research on sources of seismic energy based on butterfly failure theory. Journalof China Coal Soc. 44 (6), 1654–1665. doi:10.13225/j.cnki.jccs.2019.0126
Ma, N. J., Li, J., and Zhao, Z. Q. (2015). Distribution of the deviatoric stress field and plastic zone in circular road-way surrounding rock. J. China Univ. Min. Technol. 44 (2), 206–213. doi:10.13247/j.cnki.jcumt.000309
Niu, L. L., Du, J. J., Feng, C. J., Wen, M., Li, G., and Chen, Q. (2015). In-situ stress measurement of deep borehole in east of Hebei and its significance. Acta Seismol. Sin. 37 (1), 89–102. doi:10.11939/jass.2015.01.008
Qiao, J. Y., Ma, N. J., and Ma, J. (2019). Conjugate fault-seismic composite model based on structural stability of dynamic system. Journalof China Coal Soc. 44 (6), 1637–1646. doi:10.13225/j.cnki.jccs.2019.0124
Qin, X. H., Tan, C. X., and Sun, J. Z. (2012). Experimental study of relation between in-situ crustal stress and rock elastic modulus. Rock Soil Mech. 33 (6), 1689–1695. doi:10.16285/j.rsm.2012.06.005
Shi, H. Y., Huang, F. Q., Ma, Z. K., Feng, J., Wang, Y., and Xu, G. (2020a). Mechanical mechanism of fault dislocation based on in-situ stress state. Front. Earth Sci. 8, 52. doi:10.3389/feart.2020.00052
Shi, H. Y., and Ma, N. J. (2018a). Geomorphic formation and crustal stress evolution mechanism in the Longmen Shan fault zone and its adjacent regions. Acta Seismol. Sin. 40 (3), 332–340. doi:10.11939/jass.20170173
Shi, H. Y., Ma, N. J., and Ma, J. (2018b). Numerical simulation for the formation process of the Longmenshan fault zone and its crustal stress state. Chin. J.Geophys 61 (5), 1817–1823. doi:10.6038/cjg2018L0386
Shi, H. Y., Ma, N. J., and Shi, J. J. (2020b). Simulation study on energy evolution and release of surrounding rock in stope. Coal Sci. Technol. 48 (3), 106–111. doi:10.13199/j.cnki.cst.2020.03.011
Shi, H. Y., Zhu, Q. J., and Shi, J. J. (2020c). Comparison of shape characteristics of plastic zone around circular tunnel under different strength criteria. J. Mech. 36, 849–856. doi:10.1017/jmech.2020.45
Song, C. Y., Ma, J., and Wang, H. T. (2018). Studyon metain stability stage and instable section of the fault before strong earthquake: Taking western section of Southern Tianshan as anexample. ChineseJ. Geophys 61 (2), 604–615. doi:10.6038/cjg2018K0259
Stephansson, O., Sarkka, P., and Myrvang, A. (1986). “A state of stress in Fennoscandia,” in Proc. Int. Symp. On rock stress and rock stess measurement (Stockholm, 21–32.
Tan, C. X., Zhang, P., and Feng, C. J. (2014). An approach to deep borehole crustal stress measuring and real-time monitoring and its application in seismogeology research in Capital Beijing Region. Acta Geol. Sin. 88 (8), 1436–1452.
Wan, Y. G. (2020). Simulation on relationship between stress regimes and focal mechanisms of earthquakes. Chin. J. Geophys. 63 (6), 2281–2296.
Wang, X. C., Guo, Q. L., and Zhang, H. (2000). Crustal stress measu rement in northeastern Qingzang plateau by hydrofracturing. Journa Geomech. 6 (2), 64–70.
Wang, Y. H., Cui, X. F., and Hu, X. P. (2012). Study on the stress state in upper crust of China mainland based on in-situ stress measurements. Chin. J. Geophys 55 (9), 3016–3027. doi:10.6038/j.issn.0001-5733.2012.09.020
Wu, M. L., Ma, Y. S., and Zhang, C. S. (2008). In-situ stress mea surement and tec to nic stre ss field study in the regio n o f Lanzhou-Maqu. Chin. J. Geophys 51 (5), 1468–1474.
Wu, M. L., Zhang, C. S., Liao, C. T., Ma, Y. S., and Ou, M. Y. (2005). The recent state of stress in the central Qinghai-Tibet Plateau according to in-situ stress measurements. Chin. J. Geophys. 48 (2), 362–368. doi:10.1002/cjg2.662
Xie, F. R., Cui, X. F., and Zhao, J. T. (2004). Regional division of the recent tectonic stress field in China and adjacent areas. Chin. J.Geophysics 47 (4), 654–662.
Xiong, H., Fu, X. M., and Wang, C. Y. (2015). Experimental study of sandstone under different confining pressure deformation characteristics. China Meas. Test 43 (3), 113–116120.
Yang, S. X., Yao, R., and Cui, X. F. (2012). Analysis of the characteristics of measured stress in Chinese mainland and its active blocks and North-South seismic belt. Chin. J. Geophys 55 (12), 4207–4217. doi:10.6038/j.issn.0001-5733.2012.12.032
Keywords: in situ stress, Mohr–Coulomb criterion, principal stress ratio, limit phenomenon, numerical simulation
Citation: Chen Y, Wang Y, Huang F, Ma L, Yang C and Shi H (2022) Mechanical mechanism of in situ stress ratio limit and its evolution simulation. Front. Earth Sci. 10:941239. doi: 10.3389/feart.2022.941239
Received: 11 May 2022; Accepted: 12 August 2022;
Published: 12 September 2022.
Edited by:
Orietta Nicolis, Andres Bello University, ChileReviewed by:
Xiaozhao Li, Beijing University of Civil Engineering and Architecture, ChinaCopyright © 2022 Chen, Wang, Huang, Ma, Yang and Shi. This is an open-access article distributed under the terms of the Creative Commons Attribution License (CC BY). The use, distribution or reproduction in other forums is permitted, provided the original author(s) and the copyright owner(s) are credited and that the original publication in this journal is cited, in accordance with accepted academic practice. No use, distribution or reproduction is permitted which does not comply with these terms.
*Correspondence: Haoyu Shi, U2hpaGFveXUyMDAwQDE2My5jb20=
Disclaimer: All claims expressed in this article are solely those of the authors and do not necessarily represent those of their affiliated organizations, or those of the publisher, the editors and the reviewers. Any product that may be evaluated in this article or claim that may be made by its manufacturer is not guaranteed or endorsed by the publisher.
Research integrity at Frontiers
Learn more about the work of our research integrity team to safeguard the quality of each article we publish.