 Bo Xu
Bo Xu Qisong Huang1*
95% of researchers rate our articles as excellent or good
Learn more about the work of our research integrity team to safeguard the quality of each article we publish.
Find out more
ORIGINAL RESEARCH article
Front. Earth Sci. , 30 August 2022
Sec. Geohazards and Georisks
Volume 10 - 2022 | https://doi.org/10.3389/feart.2022.940438
This article is part of the Research Topic Rock Landslide Risk Assessment, Stability Analysis and Monitoring for The Development of Early Warning Systems and Reinforcement Measures View all 24 articles
The occurrence and development of creeping landslides lead to a gradual destruction of the affected environment; therefore, research into creeping landslide stability trends based on the monitoring of landslide data is of considerable practical value. We investigated the Jinpingzi landslide area II using strength subtraction to analyze the relationship between stress and strain at important points and the stability of the landslide. The results confirm the relationship between the internal failure pattern, safety factor, and key point displacement of creeping landslides. Furthermore, the results confirm the change rules of displacement, in addition to changes in the safety factor. By combining the surface displacement monitoring data of Jinpingzi landslide area II, its stability trend was analyzed based on the established relationship model between deformation displacement and internal failure characteristics of creeping landslides. The results demonstrate that the Jinpingzi landslide area II is in a stable damage deformation. The sliding surface formed in the landslide and the results obtained using the model of the Jinpingzi landslide area II are consistent with the actual situation determined by analysis in the field and exploring the geology.
Landslides are categorized as creeping, slow-speed, medium-speed, or high-speed landslides based on their sliding speed. Among them, creeping landslides have wide coverage, are large scale, and have an extended damage time. Generally, they undergo a long process of development and evolution and exhibit physical characteristics that can be monitored and recorded, such as surface displacement, deep displacement, internal stress, and rock and soil pressure (Ye, 2016). Therefore, it is of considerable importance to scientifically guide disaster prevention and mitigation activities by continuously monitoring a landslide, analyzing accurate data, and studying in depth the processes of landslide occurrence, development, and the resulting destruction, to master the laws of landslide development and evolution.
Many researchers have proposed landslide prediction and forecasting methods with landslide velocity and displacement as objective functions, among which landslide displacement prediction is the most common (Chen and Duan-you, 2006; Dong et al., 2007; Du et al., 2009; Li and Zhang, 2009; Ma, 2009; Liu et al., 2010; Xu et al., 2011). Miao et al. (2016) reported a prediction model of resurrection rate and surface displacement to describe the intermittent resurrection process of old slope bank landslides. Li et al. (2016) proposed a landslide displacement prediction method called WA, along with an extreme learning machine (ELM) and an online sequential (OS)-ELM. Zhou et al. proposed a wavelet analysis-extreme learning machine (WA-ELM) landslide displacement prediction model based on chaotic time series (Zhou et al., 2015). Huang et al. (2016) proposed a variable screening method based on SVR-MIV. The variables screened by this method theoretically conform to the analysis results of the corresponding landslide deformation influence mechanism, as well as improving the actual prediction accuracy of the landslide displacement (Huang et al., 2016). Zhang et al. demonstrated that the prediction accuracy of landslide displacement based on time series and a PSO-SVR coupling model is significantly higher than that of BP neural network and support vector machine (SVM) models optimized using the network search method. This prediction method has a good theoretical basis and performance prospects for landslide displacement prediction applications (Zhang et al., 2015). Huang et al. (2014) demonstrated that smooth prior analysis is suitable for determining the slope range, which can be used as the initial search range for parameter optimization of the SVM model of landslide displacement prediction (Huang et al., 2014). Meng et al. used the H-P filtering method to decompose the trend and period terms from landslide displacement. They used the differential autoregressive moving average model (ARIMA) to smooth the trend term and calculate the displacement decomposition method for displacement prediction. In addition to the prior analysis of the landslide deformation mechanism, a more reasonable displacement decomposition result can be obtained, and the prediction accuracy of the landslide displacement can be improved (Meng et al., 2016). Huang et al. (2015) established the parameter values for SVM displacement decomposition prediction of typical reservoir landslides and recommended the trend item prediction value. They used the vector autoregressive (VAR) model to calculate the period item prediction value. The addition of the trend and period item prediction values yields the predicted value of the landslide displacement (Huang et al., 2015). Lian et al. (2016) proposed the ANNS prediction method and confirmed the effectiveness of the method via three examples of landslides in the Three Gorges region of China (Lian et al., 2016). Du et al. pointed out that the slopes of sliding beds with distributed soft and hard rock strata should be the focus of attention in risk identification for translational landslides and established a new mechanical model that evaluates the stability of creeping landslides (Du et al., 2020a; Du et al., 2020b; Du et al., 2022). Simeoni et al. proposed an operative framework based on redundancy and introduced coherence tests to validate the obtained data and results (Simeoni et al., 2020).
In summary, four types of methods enable landslide disaster prediction. The first method is the classical limit equilibrium method, which cannot consider the long-term behavior of stable rock and soil mass. Therefore, it is not always effective in dealing with large and complex rock and soil mass landslides (Crosta and Agliardi, 2003). The second method calculates the safety factor (SF), plastic strain, and deformation displacement of slope stability via the strength reduction method in numerical simulations. However, its basic idea is similar to the traditional limit equilibrium method. The third method involves studying the mechanism of slope instability via tests and mechanical analyses and uses the results to predict landslide disasters (Qin et al., 2002). However, because of the complexity of slope geometric conditions, geological conditions, and the climatic environment, it is difficult to apply the dynamic equation describing the landslide evolution process and determine its parameters (Geller et al., 1997). The fourth method is based on the observation and analysis of a large quantity of test and monitoring data, in addition to experience and a statistical model to predict the landslide time (Federico et al., 2012). For example, Saito predicted the slope failure time as per the third stage (accelerated) creep and successfully predicted a landslide on the Ooigawa railway line in Japan (Saito, 1969).
Landslide displacement prediction accurately forecasts landslide displacement trends within a certain range. However, because of the uniqueness and complexity of landslides, there is currently no established stability stage criterion method to predict displacement and deformation characteristics for a particular type of a landslide.
This study proposes a method to determine the stability stage of creeping landslides as per their displacement characteristics. For this purpose, we establish the relationship between deformation displacement and internal failure characteristics of creeping landslides, as well as examining the surface deformation characteristics and internal failure mechanism of creeping landslides. The typical displacement–time curve of the landslide was adopted as the theoretical basis, using the strength reduction method; furthermore, a typical homogeneous landslide was used as the research object to determine the theoretical model. The research process included the theoretical model research, experimental verification, and landslide case analysis. The relationship between the deformation and instability characteristics of the deformed landslide and internal failure characteristics is examined, and a corresponding model is established. A stability stage criterion method aimed for use with creeping landslides is formed based on this relationship model.
To obtain the relationship between the slope displacement and the SF, an imaginary homogeneous slope is considered as an example for analysis. After establishing the model, the bottom boundary of the slope is constrained by fixed constraints; however, the left and right boundaries are horizontally constrained. The Mohr–Coulomb model is used in the calculation, and its geometric model is illustrated in Figure 1. In the figure, the soil density is ρ; the bulk modulus is K; the shear modulus is G; the cohesion is c, the internal friction angle is ϕ; the tensile strength is σt; and the dilatancy angle is Ψ.
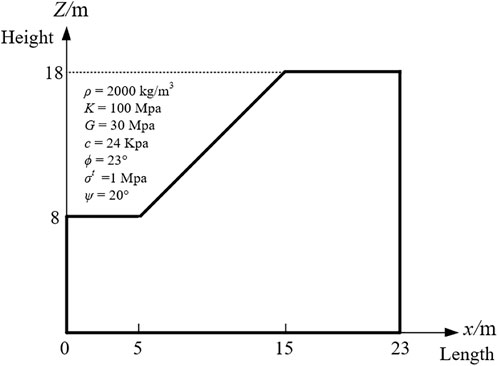
FIGURE 1. Simplified landslide size diagram.
Fast Lagrangian Analysis of Continua (FLAC3D) can simulate the two-dimensional (2D) structural stress characteristics and plastic flow analysis of soil, rock, and other materials. By applying FLAC3D, the slope SF calculated via the reduction analysis is 1.54. Figures 2A,B show the shear strain incremental cloud and plastic zone figures, respectively.
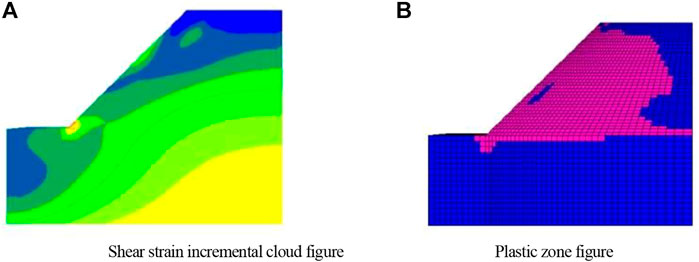
FIGURE 2. (A) Shear strain incremental cloud figure and (B) plastic zone figure.
To study the change in the displacement of simple landslides and internal stress in the strength degradation process, displacement monitoring must be set up, and a stress observation point must be established on the slope. Five displacement monitoring coefficients, ID1, ID2, ID3, ID4, and ID5, were then selected from the top to the bottom of the landslide, as shown in Figure 3A. The section to go through point (0, 5, 0) and in parallel with the XY plane was selected, and subsequently three stress monitoring coefficients, ID6, ID7, and ID8, were selected from the top to the bottom of the section, as shown in Figure 3B.
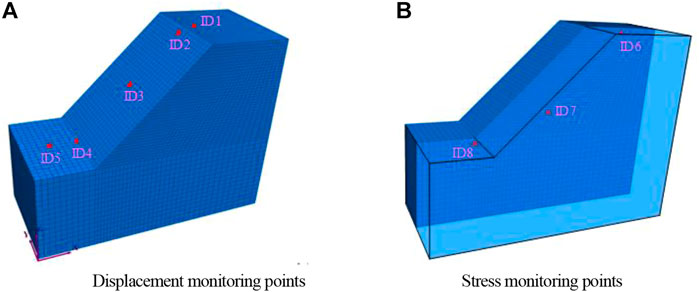
FIGURE 3. Monitoring point arrangement plan. (A) Displacement monitoring points (B) Stress monitoring points.
The relationship between the displacement and development process of the plastic zone is obtained by establishing a model analysis, as shown in Figures 4, 5. The X-axis is the SF, and the Y-axis is the displacement, as shown in Figure 4. There are two points marking a changing trend in almost all displacement and safety coefficient curves. In this study, the first turning point is defined as a and the second turning point is defined as b. Consequently, the displacement is divided into three stages: 1) when the SF > 1, the displacement essentially does not change with the change in SF, and the slope is zero; 2) when the safety factor 0.95 < SF < 1, the displacement slowly increases, and the slope is no longer zero; 3) when the SF < 0.95, the displacement increases sharply, indicating large-scale sliding of the landslide, and measures to evacuate people must be considered.
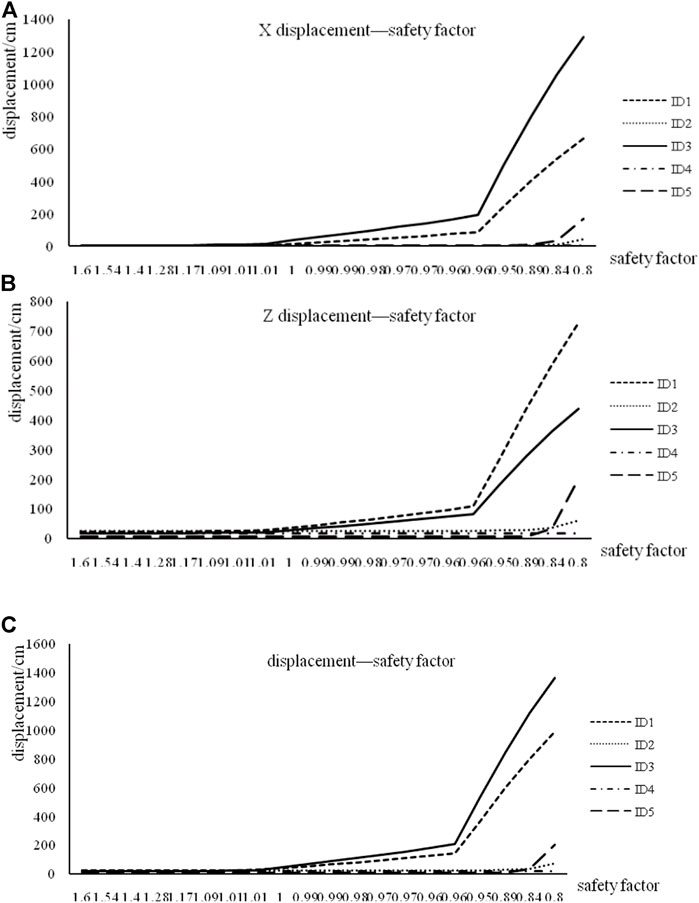
FIGURE 4. Displacement–safety factor graph. (A) X displacement–safety factor. (B) Z displacement–safety factor. (C) The total displacement–safety factor.
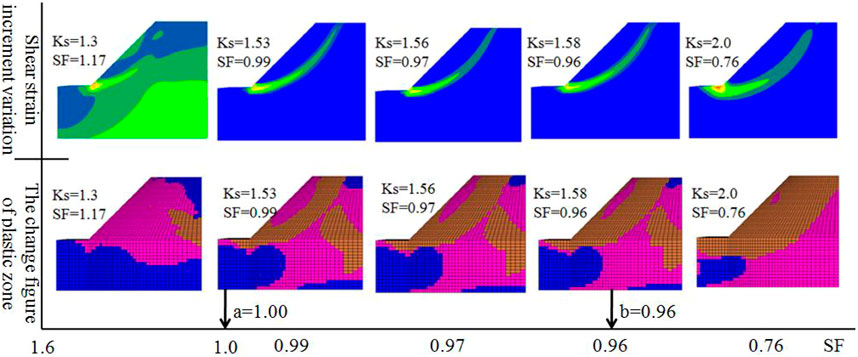
FIGURE 5. Shear strain increment variation and plastic zone development process.
The shear strain cloud and plastic zone maps of the slope during the reduction process are simultaneously recorded to assist in the analysis of apparent displacements. To highlight the changing characteristics of these maps during the occurrence and development of the slope, the initial state, occurrence, development to failure, and post-destruction maps of the slope are compared and analyzed. Changes in stress and strain can determine failure characteristics inside the slope. Figure 5 shows that with the continuous increase in the reduction factor (i.e., with the gradual decrease of the SF), the cloud map of the shear strain increment clearly shows the development trend of the sliding surface in the slope body, and the sliding surface develops from the toe of the slope and gradually extends upward to the top of the slope, thus forming an arc-shaped sliding surface. The plastic zone map shows that the first failure area is located at the toe of the slope, after which the plastic zone develops and gradually extends to the upper part of the landslide. When the SF is 1.00, the plastic zone develops to the through state. Subsequently, the sliding zone widens and increases along the sliding surface in the slope body. The plastic zone of the sliding body gradually increases, and eventually the sliding body slides down along the through slide surface and becomes unstable. When the reduction factor KS is 1.53, the SF is 1.00, which is close to a in the above displacement–reduction factor relationship diagram analysis. When the reduction factor KS is 1.59, the SF is 0.96, which is similar to b in the displacement–reduction factor relationship analysis.
We observed the changing characteristics of the internal principal stress of the slope during the strength reduction process, as shown in Figure 6. Figure 6A shows that the tensile failure primarily occurs at the top of the slope, and the compression shear failure occurs in the middle and toe of the slope. Figure 6B shows that the slope shows compression shear failure because the maximum principal stress value in the slope is larger, and the maximum principal stress value at the top of the slope is smaller. Furthermore, the minimum and maximum principal stresses do not significantly change as the SF decreases. The stress level inside the slope is primarily attributed to gravity; because the weight of the slope remains unchanged during the analysis, its stress does not significantly change. Therefore, analyzing the stability of creeping landslides by monitoring stress changes is not an appropriate solution.
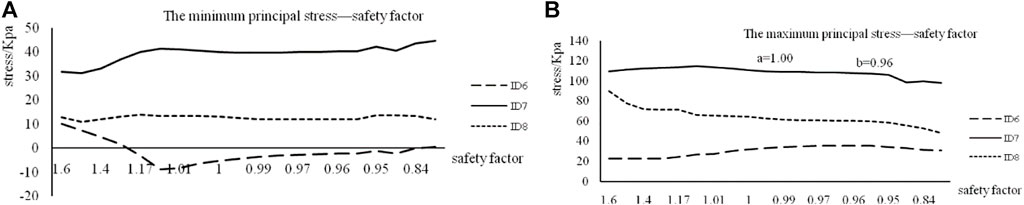
FIGURE 6. Stress–safety factor graph. (A) The minimum principal stress–safety factor. (B) The maximum principal stress–safety factor.
Using the strength reduction method with the increase or decrease in the reduction of SFs, we analyzed the characteristics of the slope surface deformation and displacement, internal shear strain increment cloud map, internal plastic zone map, and internal maximum and minimum principal stress variation. Combining all these analyses, the following conclusions were obtained:
(1) There is a clear correspondence between the slope SF and slope surface displacement. The reduction factor–displacement curve undergoes a sudden change when the SF is a and b, respectively, and after each sudden change, the displacement increases at different rates.
(2) The internal failure characteristics shown by the internal shear strain increment cloud map and plastic zone map of the slope show the reasons behind the sudden change in the slope displacement–reduction coefficient curve at a and b.
(3) The minimum and maximum principal stresses on the sliding surface inside the slope fail to demonstrate evident changes with the slope failure, indicating that monitoring creeping landslides by monitoring stress changes does not yield results that are as clear as those obtained by displacement monitoring.
Based on these conclusions, this study establishes a relationship model between deformation displacement and the internal failure characteristics of creeping landslides based on the analysis of slope surface displacement characteristics, as shown in Table 1.
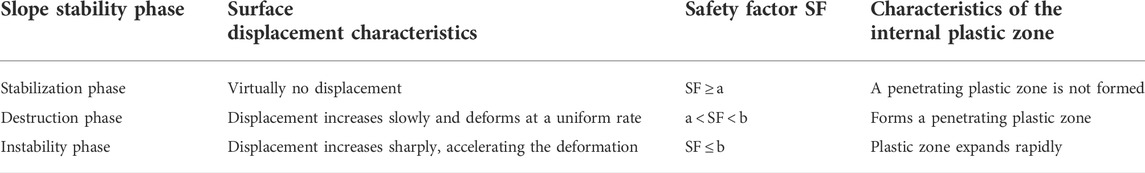
TABLE 1. Stability of the relational model based on the displacement characteristics of the slope surface.
The Jinpingzi landslide is located at the Wudongde cascade on the right bank of the Jinsha River, approximately 90 m downstream of the Wudongde dam site. Its volume, estimated by remote sensing, is approximately 620 million m3. Its stability status, deformation trends, possible causes of instability, and scale are related to the establishment of the Wudongde hydropower cascade development and the selection of a dam site. Consequently, it received attention from various researchers (Li, 2008). The Jinpingzi landslide can be roughly divided into five areas. Because Jinpingzi landslide area II has a massive volume (approximately 27 million m3) and its deformation is still under development, opinions on the effects on the Wudongde project vary. Thus, it is necessary to accurately predict possible causes of instability in the area and the scale of a putative landslide. In this manner, we can accurately evaluate the project’s effect and consider effective measures to ensure construction safety.
The geological map of the study area is shown in Figure 7. AutoCAD 3D modeling, ANSYS meshing, and FLAC3D strata division were used to establish the model of the Jinpingzi landslide area II. The final model is shown in Figure 8. The physical and mechanical parameters of rock strata are listed in Table 2.
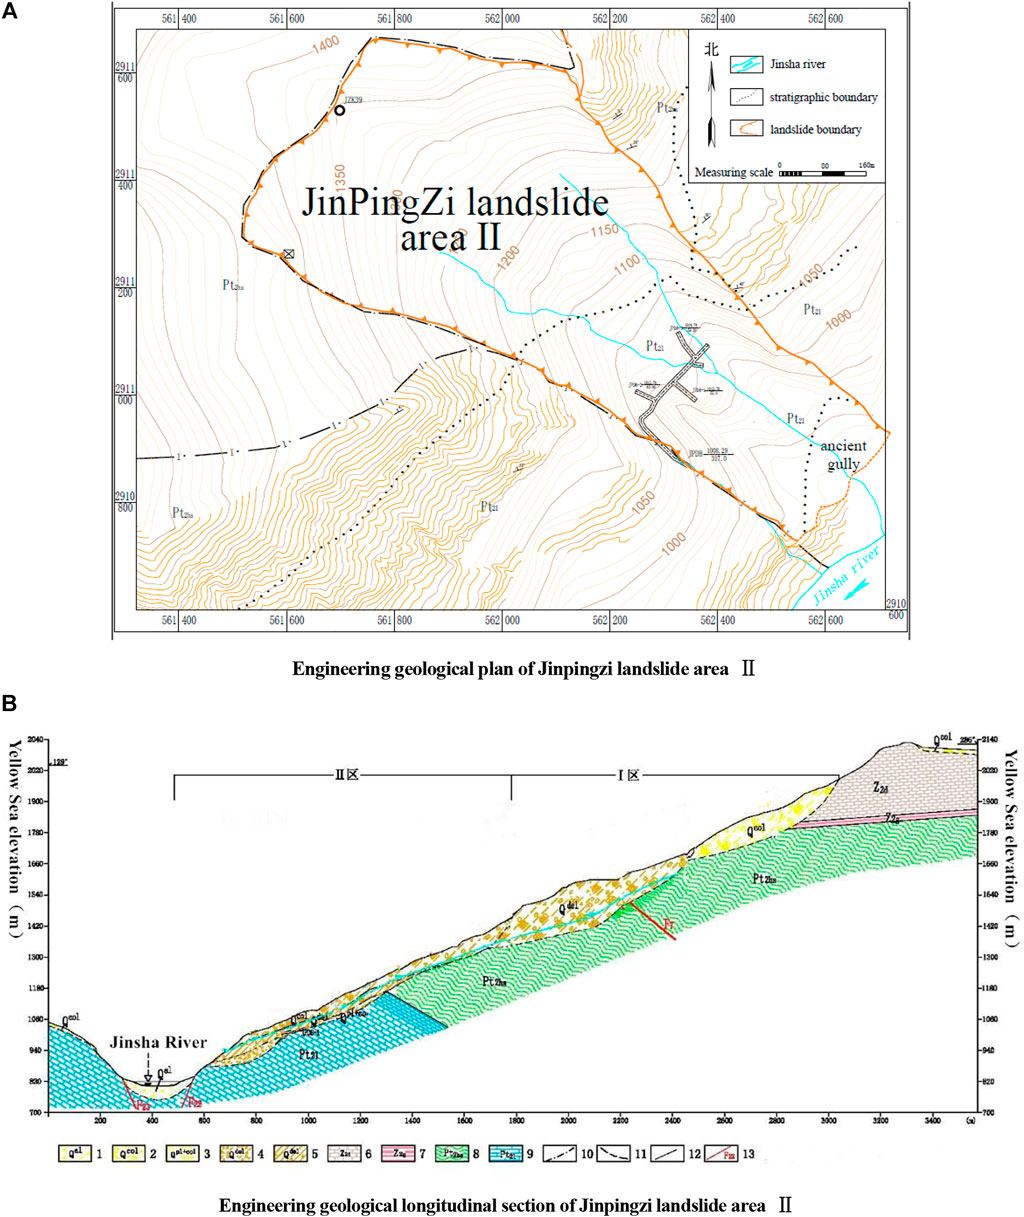
FIGURE 7. Geological map of the study area. (A) Engineering geological plan of Jinpingzi landslide area II. (B) Engineering geological longitudinal section of Jinpingzi landslide area II.
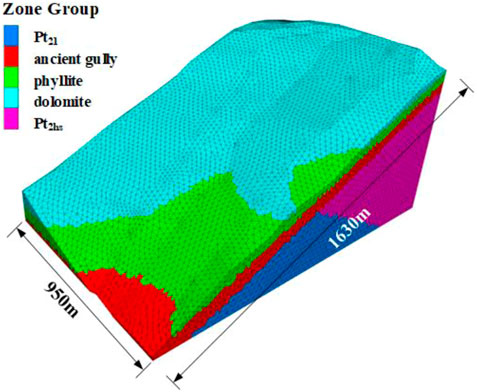
FIGURE 8. Model of Jinpingzi landslide area II diagram.
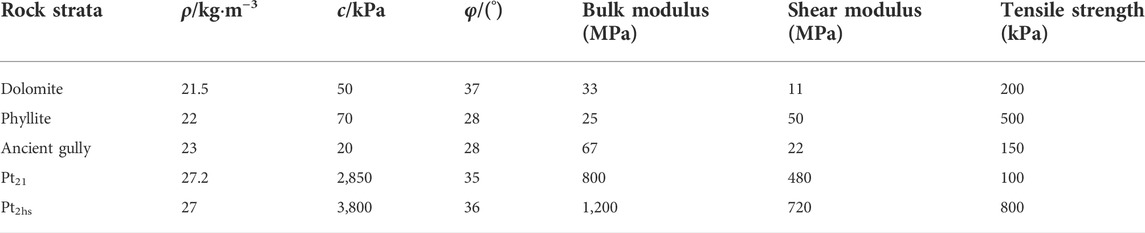
TABLE 2. Jinpingzi area II rock mechanical parameters.
To investigate the changes in the displacement and internal stress of the model, eight displacement monitoring points were selected based on the actual displacement monitoring point, as shown in Figure 9A. Five points (A–E) on the section with the passing point (0, 950, 0) and the normal direction (0, 1, 0) were selected, and the shear force of the Jinpingzi landslide in the process of strength reduction was calculated. The shear strain increment and plastic zone changes were then recorded.
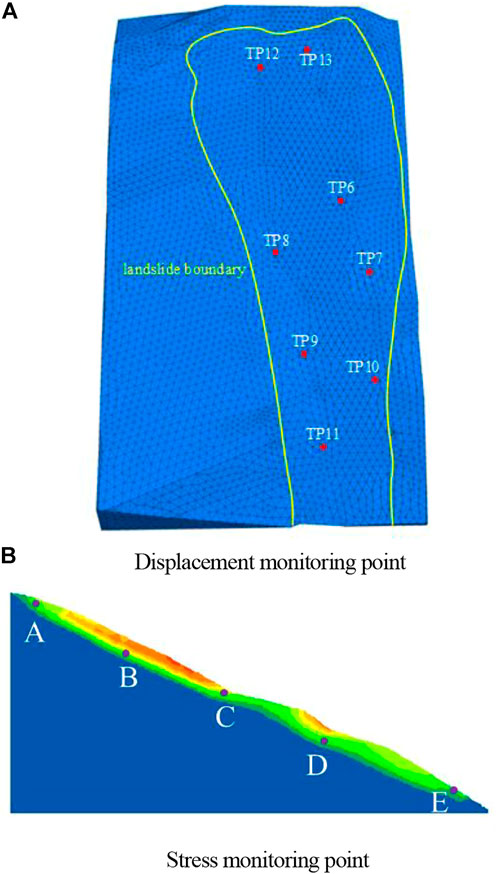
FIGURE 9. Monitoring points of Jinpingzi landslide area II. (A) Displacement monitoring point. (B) Stress monitoring point.
The relationship between the reduction coefficient and development of the displacement and the plastic zone are obtained via the reduction analysis of the model. The line chart of the displacement value and the SF under each reduction parameter is drawn. The X-axis is the SF, while the Y-axis is the displacement, as shown in Figure 10. There are two points marking a changing trend in almost all displacement and safety coefficient curves. The first point occurs at about SF = 1 and the second at SF = 0.83. Consequently, the displacement has three stages: 1) when the SF > 1, all displacement remains constant with the reduction of the safety factor, and the slope is zero; 2) when the safety factor 0.83 < SF < 1, the displacement increases slowly, and the gradient is no longer zero; 3) when the SF < 0.83, the displacement increases sharply, which demonstrates that the landslide experiences large-scale movements and that measures to evacuate people must be considered.
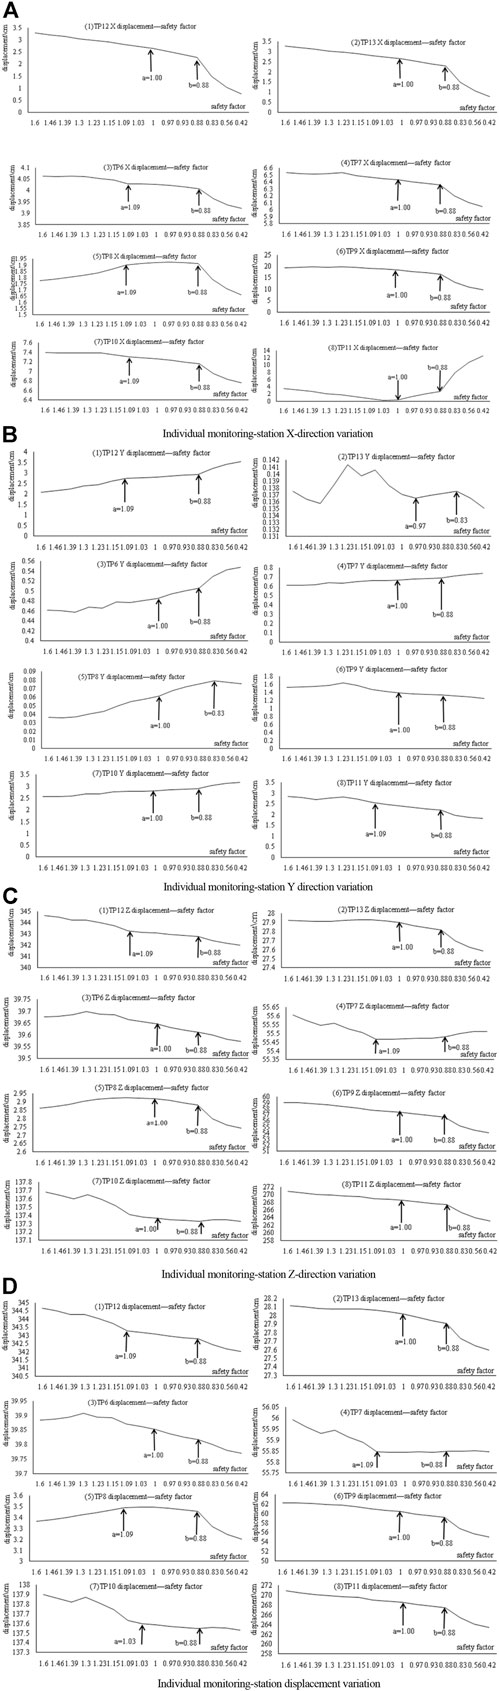
FIGURE 10. Displacement–safety factor graph of Jinpingzi landslide area II. (A) Individual monitoring-station X-direction variation. (B) Individual monitoring-station Y-direction variation. (C) Individual monitoring-station Z-direction variation. (D) Individual monitoring-station displacement variation. (continued)
The section passing through (0, 950, 0) and the normal direction (0, 1, 0) were selected. The shear strain increment of variation and the variation of the plastic zone are shown in Figure 11.
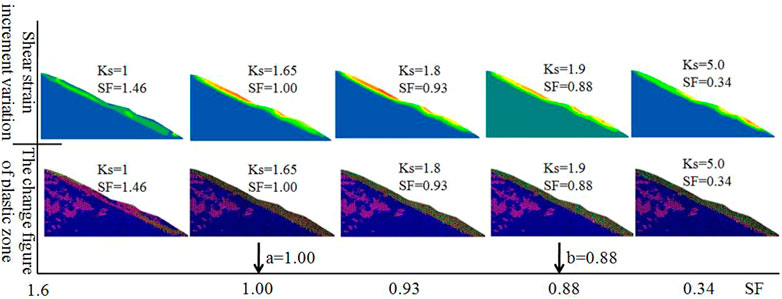
FIGURE 11. Shear strain increment variation and changes in the plastic zone.
When the reduction coefficient Ks is 1.65, the green band in the shear strain increment diagram is connected, indicating that the Jinpingzi landslide area II already fulfills the conditions for sliding, i.e., the plastic zone passes through from the top of the landslide to the bottom. As shown in Figure 12, c and φ continue to decrease with the increasing reduction coefficient, and the first plastic failure occurs at the trailing edge and toe of the landslide, after which it gradually extends to the upper part, when the plastic zone penetrates through. Subsequently, the plastic zone widens and increases along with the interior of the sliding body; however, the plastic zone increases and finally the Jinpingzi II zone slides down. The map depicting the changes in the plastic zone demonstrates that the rock layer with the sliding zone is composed of the phyllite overburden.
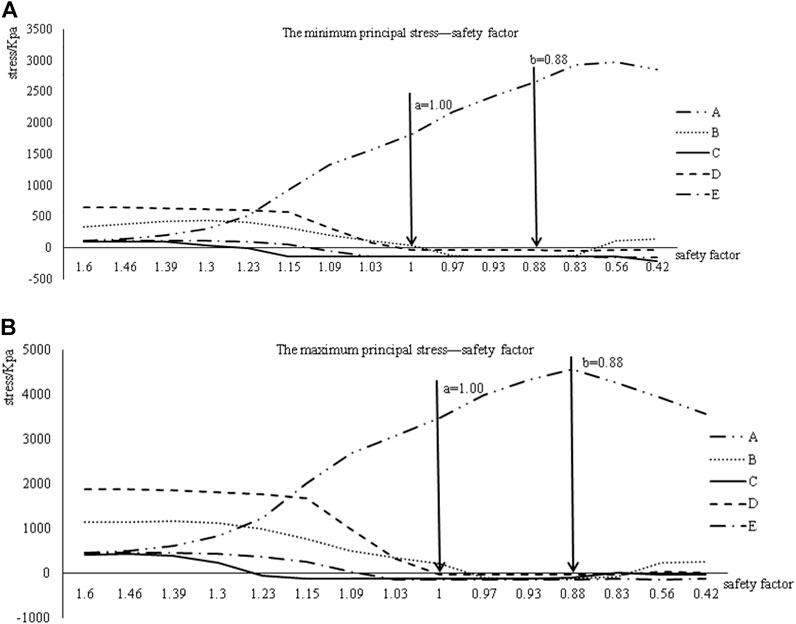
FIGURE 12. Stress–safety factor graph. (A) The minimum principal stress–safety factor. (B) The maximum principal stress–safety factor.
Figure 10C shows the Z-direction displacement-SF and (d) resultant displacement diagram-SF graphs: in addition to the point TP12 at the top of the landslide, the order of the remaining seven monitoring displacement sizes (absolute values) ordered from large to small is TP11 > TP10 > TP9 > TP7 > TP6 > TP13 > TP8; another position of TP11, TP10, TP9, TP7, TP6, and TP8 ranges the lower to the upper of the slope. Thus, the displacement from the lower to the upper part of Jinpingzi landslide area II decreases, i.e., the displacement at the lower parts is the largest, which conforms to the characteristics of a pull-type landslide.
The line chart of the stress and SF under each reduction parameter is drawn. The X-axis is the SF, while the Y-axis is the stress value, as shown in Figure 12. After the SF < 1, no stress variation trend is evident with the decreasing SF. This shows that the sensitivity of the displacement is larger than the stress sensitivity, such that it is more reliable to perform displacement monitoring than stress monitoring.
From a comparative analysis of a simple landslide and the Jinpingzi landslide area II, we conclude the following:
(1) c and ϕ decrease with increasing reduction factor. The rear and toe of the landslide are damaged first, after which the plastic zone gradually develops to the upper landslide. When the SF is close to 1, the plastic zone is interconnected. Subsequently, the sliding face begins to widen along with the internal landslide, and the plastic area of the sliding body likewise gradually increases until the landslide takes place.
(2) For creep landslides, the stress does not show certain laws with the reduction of the SF, such as displacement of the landslide surface. Therefore, when the SF of a creeping landslide is < 1, the sensitivity of the displacement is larger than the stress sensitivity, indicating that displacement monitoring is more reliable than stress monitoring.
(3) There are two points that mark a changing trend in the displacement and safety coefficient curve as the SF changes. The first occurs at about SF = 1, and the second changes with the landslide change; however, its possible range is 0.8 to 0.95. Consequently, the displacement has three stages: a) when the SF > 1, the landslide is in the security state; b) when the safety factor 0.8–0.95 < SF < 1, although landslides begin to slip, there is no danger, and yellow warning signs can be initiated to adopt prevention measures or to reinforce the area; c) when the SF < 0.8–0.95, the landslide has undergone considerable sliding, and the red warning for emergency measures can be initiated.
For the creeping landslide, 17 monitoring points were installed at Jinpingzi landslide area II. As per the simulation results of a simple landslide and Jinpingzi landslide area II, as well as the measured displacement data, we selected three monitoring stations from the toe to the top of the landslide to analyze the changing trends of Jinpingzi landslide area II. These three monitoring points were TP11 (toe), TP6 (slope), and TP12 (top). The displacement data of individual monitoring stations were recorded from 3rd January 2006 to 31st July 2010. The resulting curves show the actual displacements of the three points, where the X-axis represents time, and the vertical axis represents displacement, as shown in Figure 13.
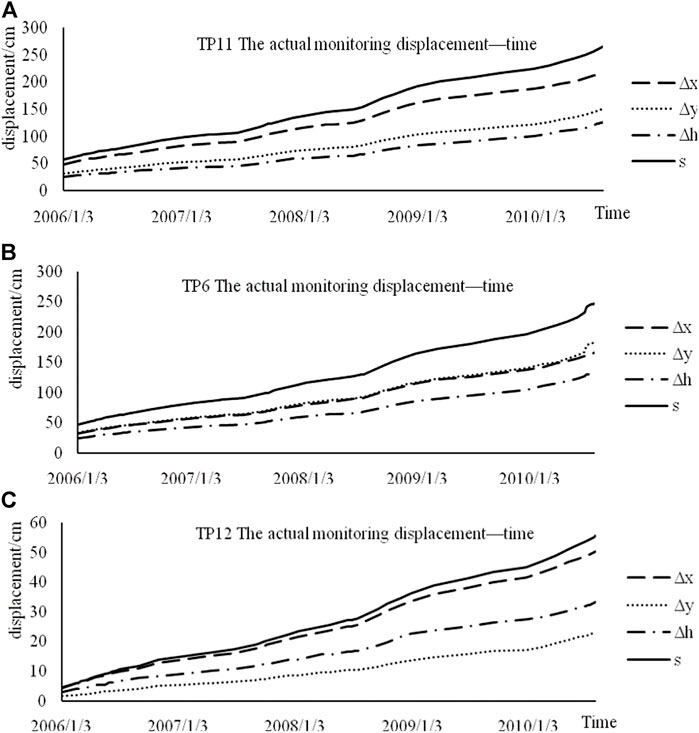
FIGURE 13. Monitored displacement–time graph. (A) TP11, the actual monitored displacement–time. (B) TP6, the actual monitored displacement–time. (C) TP12, the actual monitored displacement–time.
The actual monitored displacement of the three points gradually increased, and there was no period of the displacement being zero. This shows that the SF of Jinpingzi landslide area II is <1. From 2006 to 2010, the displacement in the three directions x, y, and h showed no evident change in trends, which indicates that it is stable. Therefore, we can predict that it is currently in the stage of yellow warning, and it will remain there for a long period of time.
The deformation in this area is synchronous, therefore the displacement curve of any monitoring point agrees with that of other monitoring points. Considering the monitoring data from point TP10 as an example for detailed analysis, in Figures 14–16, we conclude that: a) during the monitoring period, the combined displacement of monitoring point TP10 demonstrates a linear growth trend, the displacement value increases slowly, and there is no abrupt change point; b) up to 171 days (4th November 2005), the displacement rate changes in a disorderly manner, generally exhibiting an increasing trend. After this time, the change is more regular, and the displacement rate gradually decreases and tends to stabilize, indicating that the area is in the stage of constant velocity deformation; c) up to 83 days (8th August 2005), the displacement acceleration changes significantly and exhibits an overall decreasing trend. After this time point, the change is regular, and the displacement acceleration gradually decreases and stabilizes, which is reflected in the area being in the stage of a uniform creep.
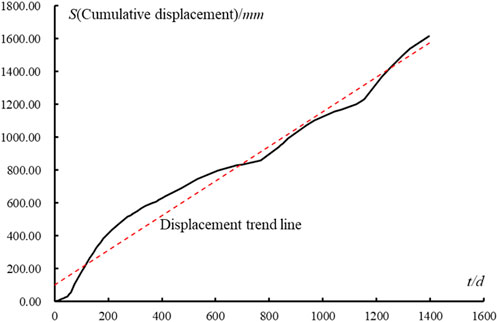
FIGURE 14. Plane resultant displacement–time curve of monitoring point TP10.

FIGURE 15. Displacement rate time curve of monitoring point TP10.
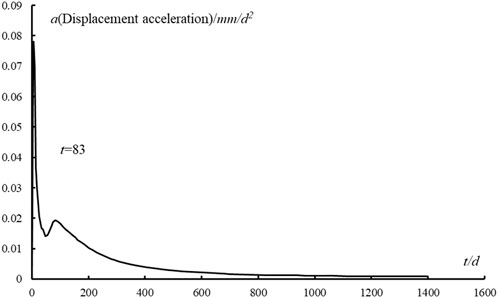
FIGURE 16. Displacement acceleration time relation curve of monitoring point TP10.
Based on the stability of the relational model, which in turn was based on the displacement characteristics of the slope surface proposed in this paper, it is suggested to continue strengthening the monitoring of landslide surface displacement. As the displacement of a landslide is related to rainfall (Wang et al., 2014), rainfall monitoring should be focused upon while monitoring landslide displacement. Landslide monitoring is only a means; the real purpose is to achieve accurate early warning of landslide disasters. Thus, attention should be paid not only to landslide monitoring but also to the early warning of a disaster; regional meteorological early warning systems should be simultaneously strengthened. The early warning of landslide disaster is mainly based on the statistical analysis of historical data, groundwater level, rainfall, and other key indicators, so this method could help to improve the accuracy and practicality of landslide early warning, as described in Table 3.
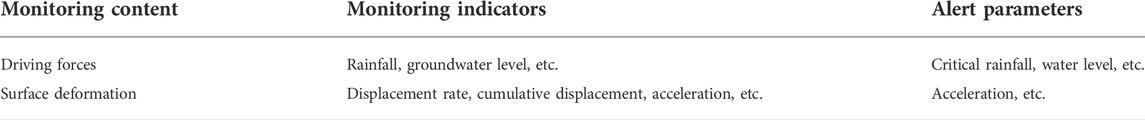
TABLE 3. Main monitoring methods and alert parameters of creeping landslide.
In this study, a homogeneous landslide was analyzed by FLAC3D, and a stability judgment model of the landslide based on displacement characteristics was established. In addition to the FLAC3D numerical simulation and using the landslide stability judgment model established in this study, a stability analysis of Jinpingzi landslide area II was performed. It was concluded that this research area is in the stability stage, which is consistent with the conclusion obtained from the actual monitoring data. The primary conclusions are as follows:
(1) With the development of a landslide, the rear and toe of the landslide are damaged first and then the plastic zone gradually develops to the upper landslide. When the SF is close to a, the plastic zone passes through from the top of the landslide to the bottom. Subsequently, the sliding face begins to widen along with the internal landslide, and the plastic area of the sliding body gradually increases until the landslide occurs.
(2) For a creeping landslide, when the SF of the creeping landslide is less than 1, the sensitivity of the displacement is larger than the stress sensitivity. Hence, it is more reliable to monitor the displacement than the stress.
(3) There are two points marking a change in the trend of the displacement and safety coefficient curve with respect to the SF. The first occurs at about SF = 1, whereas the second is in the range of 0.8–0.95. Consequently, the displacement comprises three stages: (1) when the
(4) The Jinpingzi landslide area II is stable. Therefore, we can predict that it is currently in the yellow warning stage and will remain there for a rather long period.
The original contributions presented in the study are included in the article/supplementary material, and further inquiries can be directed to the corresponding author.
BX and QH were responsible for the work concept and design; BX and QH were responsible for data collection; YQ was responsible for drafting the manuscript; BX was responsible for making important revisions to the manuscript; QH and YQ were responsible for approving the final version of the manuscript for publication.
This work was supported by the Natural Science Foundation granted by the Department of Education, Anhui Province (KJ2020A0235), Natural Science Foundation of Anhui Province (No. 2008085QE221), and Postdoctoral Researchers Research Activities Foundation of Anhui Province (Nos. 2021B550 and 2021B551).
Author QY was employed by the MCC17 Group Co., Ltd.
The remaining authors declare that the research was conducted in the absence of any commercial or financial relationships that could be construed as a potential conflict of interest.
All claims expressed in this article are solely those of the authors and do not necessarily represent those of their affiliated organizations, or those of the publisher, the editors, and the reviewers. Any product that may be evaluated in this article, or claim that may be made by its manufacturer, is not guaranteed or endorsed by the publisher.
Chen, W.-b., and Duan-you, L. (2006). Prediction of Displacement in Landslide Based on Nonlinear Dynamics. J. Yangtze River Sci. Res. Inst. 23 (2), 28–30. doi:10.3969/j.issn.1001-5485.2006.02.008
Crosta, G. B., and Agliardi, F. (2003). Failure Forecast for Large Rock Slides by Surface Displacement Measurements. Can. Geotech. J. 40 (1), 176–191. doi:10.1139/t02-085
Dong, H., Fu, H.-L., Leng, W.-M., and Long, W.-X. (2007). Boosting Ensemble of Support Vector Regression for Landslide Prediction. J. Hunan Univ. Nat. Sci. 34 (9), 6–10.
Du, J., Yin, K.-l., and Chai, B. (2009). Study of Displacement Prediction Model of Landslide Based on Response Analysis of Inducing Factors. Chin. J. Rock Mech. Eng. 28 (9), 1783–1789. doi:10.3321/j.issn:1000-6915.2009.09.007
Du, Y., Li, H., Chicas, S. D., and Huo, L. (2022). Progress and Perspectives of Geotechnical Anchor Bolts on Slope Engineering in China. Front. Environ. Sci. 10, 928064. doi:10.3389/fenvs.2022.928064
Du, Y., Lu, Y.-D., Xie, M.-W., Jia, J.-L., Cong, X.-M., and Wu, Y.-Q. (2020a). Stability Evaluation of Creeping Landslide Considering Variation of Initial Conditions. Chin. J. Rock Mech. Eng. 39 (S01), 2828–2836. doi:10.13722/j.cnki.jrme.2019.1079
Du, Y., Xie, M.-W., and Jia, J.-L. (2020b). Stepped Settlement: A Possible Mechanism for Translational Landslides. Catena 187, 104365. doi:10.1016/j.catena.2019.104365
Federico, A., Popescu, M., Elia, G., Fidelibus, C., Interno, G., and Murianni, A. (2012). Prediction of Time to Slope Failure: a General Framework. Environ. Earth Sci. 66 (1), 245–256. doi:10.1007/s12665-011-1231-5
Geller, R. J., Jackson, D. D., Kagan, Y. Y., and Mulargia, F. (1997). Earthquakes Cannot Be Predicted. Science 275, 1616. doi:10.1126/science.275.5306.1616
Huang, H.-F., Song, K., Yi, Q.-L., Yi, W., and Zhang, G.-D. (2015). Study on Parameter Value Selection of Support Vector Machine for Displacement Prediction of Landslides. Chin. J. Undergr. Space Eng. 11 (4), 1053–1059.
Huang, H.-F., Yi, W., Yi, Q.-L., Lu, S.-Q., and Wang, S.-M. (2014). Smoothness Priors Approach in Displacement Decomposition and Prediction of Landslides. Hydrogeology Eng. Geol. 41 (5), 95–100. doi:10.16030/j.cnki.issn.1000-3665.2014.05.043
Huang, H.-F., Yi, W., Liu, Y.-L., Wang, H., and Lin, H.-Y. (2016). Study on Variables Selection Using SVR-MIV Method in Displacement Prediction of Landslides. Chin. J. Undergr. Space Eng. 12 (1), 213–219.
Li, H.-J., Xu, Q., He, Y.-S., and Wei, Y. (2016). Predictive Modeling of Landslide Displacement by Wavelet Analysis and Multiple Extreme Learning Machines. J. Eng. Geol. 24 (5), 721–731. doi:10.13544/j.cnki.jeg.2016.05.001
Li, K.-G., and Zhang, C.-Q. (2009). Neural Network Modeling and Slope Displacement Prediction Based on Time Series. Chin. J. Undergr. Space Eng. 5 (S1), 1418–1421. doi:10.3969/j.issn.1673-0836.2009.z1.028
Lian, C., Zeng, Z., Yao, W., Tang, H., and Philip Chen, C. L. (2016). Landslide Displacement Prediction with Uncertainty Based on Neural Networks with Random Hidden Weights. IEEE Trans. Neural Netw. Learn. Syst. 27 (12), 2683–2695. doi:10.1109/TNNLS.2015.2512283
Liu, X.-P., Xie, X.-B., and Luo, Y.-Z. (2010). Self-menorization Model of Dynamic System for Predicting Nonlinear Displacement of Slopes. Chin. J. Geotechnical Eng. 32 (10), 1535–1542. doi:10.1016/S1876-3804(11)60004-9
Ma, W.-T. (2009). Prediction of Slope Displacement Based on Wavelet Transform and Genetic Algorithm-Least Square Support Vector Machine. Rock Soil Mech. 30 (S2), 394–398. doi:10.16285/j.rsm.2009.s2.081
Meng, M., Chen, Z.-Q., Huang, D., Zeng, B., and Chen, C.-J. (2016). Displacement Prediction of Landslide in Three Gorges Reservoir Area Based on H-P Filter, ARIMA and VAR Models. Rock Soil Mech. 37 (S02), 552–560.
Miao, H.-B., Yin, K.-L., and Zhang, X.-W. (2016). Prediction of Ground Displacement of Reservoir Ancient Landslide with Intermittent Reactivation. Geol. Sci. Technol. Inf. 35 (5), 208–213.
Qin, S. Q., Jiao, J. J., and Wang, S. J. (2002). A Nonlinear Dynamical Model of Landslide Evolution. Geomorphology 43 (1), 77–85. doi:10.1016/s0169-555x(01)00122-2
Saito, M. Forecasting Time of Slope Failure by Tertiary Creep[C]. Proceedings of the 7th International Conference on Soil Mechanics and Foundation Engineering. Mexico, 1969.
Simeoni, L., Ronchetti, F., Costa, C., Joris, P., and Corsini, A. (2020). Redundancy and Coherence of Multi-Method Displacement Monitoring Data as Key Issues for the Analysis of Extremely Slow Landslides (Isarco Valley, Eastern Alps, Italy). Eng. Geol. 267, 105504. doi:10.1016/j.enggeo.2020.105504
Wang, L.-W., Xie, M.-W., and Chai, X.-Q. (2014). Research on Method of Displacement Speed Ratio for Spatial Evaluation of Landslide Deformation. Rock Soil Mech. 35 (2), 519–528. doi:10.16285/j.rsm.2014.02.019
Xu, F., Wang, Y., Du, J., and Ye, J. (2011). Study of Displacement Prediction Model of Landslide Based on Time Series Analysis. Chin. J. Rock Mech. Eng. 30 (4), 746–751. doi:10.1007/s12182-011-0118-0
Ye, Q. (2016). Is the "5. 8" Geological Hazard in Taining a Landslide or a Debris Flow? . Xiamen Sci. Technol. (4), 46–49.
Zhang, J., Yin, K.-L., Wang, J.-J., and Huang, F.-M. (2015). Displacement Prediction of Baishuihe Landslide Based on Time Series and Pso-Svr Model. Chin. J. Rock Mech. Eng. 34 (2), 382–391. doi:10.13722/j.cnki.jrme.2015.02.017
Keywords: creep landslide, stability trend, stress and strain, displacement, safety factor
Citation: Xu B, Huang Q and Qian Y (2022) Stability trends of Jinpingzi landslide: A numerical study. Front. Earth Sci. 10:940438. doi: 10.3389/feart.2022.940438
Received: 10 May 2022; Accepted: 26 July 2022;
Published: 30 August 2022.
Edited by:
Yan Du, University of Science and Technology Beijing, ChinaReviewed by:
Yanbin Yu, Shandong University of Science and Technology, ChinaCopyright © 2022 Xu, Huang and Qian. This is an open-access article distributed under the terms of the Creative Commons Attribution License (CC BY). The use, distribution or reproduction in other forums is permitted, provided the original author(s) and the copyright owner(s) are credited and that the original publication in this journal is cited, in accordance with accepted academic practice. No use, distribution or reproduction is permitted which does not comply with these terms.
*Correspondence: Qisong Huang, aHVhbmdxaXNvbmcxMjNAMTI2LmNvbQ==
Disclaimer: All claims expressed in this article are solely those of the authors and do not necessarily represent those of their affiliated organizations, or those of the publisher, the editors and the reviewers. Any product that may be evaluated in this article or claim that may be made by its manufacturer is not guaranteed or endorsed by the publisher.
Research integrity at Frontiers
Learn more about the work of our research integrity team to safeguard the quality of each article we publish.