 Xue Rui
 Bo Li
Bo Li Tim J. Cohen
94% of researchers rate our articles as excellent or good
Learn more about the work of our research integrity team to safeguard the quality of each article we publish.
Find out more
POLICY BRIEF article
Front. Earth Sci. , 12 September 2022
Sec. Quaternary Science, Geomorphology and Paleoenvironment
Volume 10 - 2022 | https://doi.org/10.3389/feart.2022.939964
This article is part of the Research Topic Trapped Charge Dating and Its Application in Geomorphological, Geological and Archaeological Studies in East Asia View all 15 articles
Using continental SGCs built by Fu et al. (2020) can save significant machine time for constructing SGCs when compared to traditional SGC methods, which need significantly more time for building sample-specific or regional SGCs. In this study, the reliability of continental SGCs is tested using coarse quartz grains (180–212 µm) from Lake Woods in Northern Australia. De values obtained by continental SGCs are consistent with De values obtained by regional SGCs and by the SAR procedures.
Optically stimulated luminescence (OSL) emissions from quartz grains have been widely used for dating sediments in the Quaternary period since the development of the single-aliquot regenerative-dose (SAR) protocol (e.g., Galbraith et al., 1999; Murray and Wintle, 2000; Wintle and Murray, 2006). In the SAR protocol, a dose-response curve (DRC) is constructed for each aliquot using a series of regenerative doses and their corresponding luminescence signals, and the equivalent dose (De) is obtained by projecting the natural luminescence signal onto the DRC. However, when there are many samples or the ages of samples are too high, large regenerative doses and long irradiation times are necessary for building a DRC, and the time required for the measurements can be a major impediment of the SAR protocol applications.
To reduce the amount of machine time required, Roberts and Duller (2004) proposed that Tx not only corrects within-aliquot sensitivity changes but can also act as a between-aliquot normalization step. This assumption offers a potential means of creating a standardized growth curve (SGC), from which the De can be estimated by projecting the sensitivity-corrected natural OSL signal re-scaled by the corresponding test dose (i.e., Ln/Tn*Dt) onto the SGC, established using a number of re-scaled DRCs obtained from an SAR protocol. This SGC method has been applied to single aliquots of quartz from different regions (e.g., Burbidge et al., 2006; Lai, 2006; Lai et al., 2007; Stevens et al., 2007; Telfer et al., 2008; Long et al., 2010; Yang et al., 2011; Chen et al., 2013; Wang et al., 2022).
To further reduce the inter-aliquot variation of DRCs for quartz OSL from same or different samples, Li et al. (2015) suggested a new method for establishing SGCs by dividing the Lx/Tx data by one of the regenerative dose signals (Lr1/Tr1). This improved method was called regenerative-dose normalization (re-normalization). By applying this method for a range of quartz samples from different regions of Asia, Africa, Europe, and North America, they constructed a common re-normalized DRC (global standardized growth curve, gSGC) for single aliquots of quartz. With numerical simulation, Peng et al. (2016) showed that the gSGC method is intrinsically more precise than the conventional SGC method.
With the development of the re-normalization method, a similar but improved normalized method was proposed by Li et al. (2016), i.e., the least-squares normalization (LS-normalization). This uses an iterative scaling and fitting procedure that takes all of the Lx/Tx ratios into consideration when constructing the SGC. In addition, Fu et al. (2020) have observed that the DRCs for quartz OSL signals of single grains diverge significantly over ∼50 Gy, and a set of continental standardized growth curves (cSGCs) were established for single grains of Australian quartz. With cSGC, a De can be determined by measuring the natural signal (Ln), two regenerative-dose signals (L1 and L2), and the corresponding test-dose signals (Tn, T1, and T2). Significant machine time can be saved for constructing SGCs when compared to traditional SGC methods, which need significantly more time for building sample-specific or regional SGCs (rSGCs). In this study, the reliability of cSGC is tested using coarse quartz grains from Lake Woods in Northern Australia, and the cSGC Des are compared with the De results obtained by the full SAR procedure and also with the results obtained by rSGC.
Lake Woods is an ephemeral freshwater lake in the Northern Territory of Australia (Supplementary Figure S1). One beach sample and four lacustrine samples from three pits of Lake Woods were used to establish rSGC. The deposit type, grain size, and De ranges for each sample are summarized in Supplementary Table S1. Each sample was collected from cleaned profile walls using stainless steel tubes. After the tubes were removed, they were immediately wrapped in light-proof plastic and transported to the Luminescence Dating Laboratory at the University of Wollongong for analysis. Quartz grains 180–212 μm in diameter were isolated for OSL dating and purified using the standard procedure (e.g., Wintle, 1997). The measurement was performed on a Risø TL/OSL-DA-20 reader equipped with 90Sr/90Y beta sources and green (532 nm) laser for single-grain stimulation. OSL signals were detected by an Electron Tubes 9235B photo-multiplier tube fitted with Hoya U-340 filters.
All single-grain quartz measurements were made using the SAR procedure, and experimental conditions are listed in Supplementary Table S2. The grains were stimulated by a green laser for 1.8 s at 125°C, and the net OSL signal was calculated using the first 0.18 s integral of the initial OSL signal minus a background estimated from the last 0.18 s. The value of the SAR De was estimated by interpolating the sensitivity-corrected signals (Ln/Tn) onto the corresponding DRC. Grains were rejected if the resulting OSL data failed to satisfy a series of well-established criteria similar to those proposed by Jacobs et al. (2006), namely, if 1) the initial Tn signal was less than 3σ above its corresponding background or its relative standard error is >25%; 2) the recycling ratio or OSL IR depletion ratio differed from unity by more than 2σ; 3) the recuperation ratio (i.e., the ratio of the Lx/Tx value for the 0 Gy and maximum regenerative dose) is >5%; 4) the figure-of-merit (FOM) value is >10% (Peng and Li, 2017); 5) the reduced chi-square (RCS) value for the DRC is >5 (Peng and Li, 2017); 6) the Ln/Tn ratio is statistically consistent with, or higher than, the saturation level of the corresponding DRC; 7) the De value is obtained by extrapolation of the fitted DRC, rather than interpolation among the regenerative-dose signals; and 8) the relative standard error (RSE) of De exceeds 50%. It should be noted that full criteria (i.e., all eight criteria) would only be applied for SAR De estimation (see below).
A total of 45 aliquots (4,500 grains) from five samples were measured by the SAR procedure, and we rejected grains with poor DRCs based on criteria 1)‒5) before building rSGCs (Li et al., 2016; Fu et al., 2020). Within SGC determination, 1) we fitted the measured Lx/Tx data for individual grains using a general-order kinetic (GOK) function, i.e.,
The SGRs for all the investigated grains are shown in Figure 1A. A large range of SGRs from ∼1 to ∼3 was observed, indicating that grains have a wide range of saturation doses. For example, the grains with SGRs close to 1.08 (marked by black circle in Figure 1A) correspond to early saturated grains (i.e., there was a negligible increase in the OSL signal beyond 50 Gy). In contrast, grains with Lx/Tx ratios close to 2.85 (marked by yellow triangle in Figure 1A) have a large saturation dose level (keep growing even after 400 Gy). Figure 1C displays the LS-normalized Lx/Tx ratios and common SGCs for all eight groups as a function of the dose. To test the validity of the groupings and establishment of the SGCs, we calculated the ratio between the individual LS-normalized Lx/Tx values and their expected values (based on the best-fit curve) for all the regenerative doses greater than zero. The ratios are plotted in radial plots in Supplementary Figure S2. Around 89–95% of the measured-to-SGC ratios for each group are consistent with unity at 2σ. We propose, therefore, that the DRCs of the Lake Woods quartz grains mentioned here can be represented by eight common SGCs; the best-fit GOK parameters for each SGC are summarized in Supplementary Table S3. Comparing with cSGC (k =6, Supplementary Table S3), our rSGCs have more group numbers and thus have different GOK parameters. When building cSGCs, Fu et al., (2020) assumed all groups have the same σb value (0.06). As a 6% overdispersion accounts for the between-grain differences in the DRCs, it may lead to a smaller group number for cSGCs. For a better comparison with the cSGCs, we repeated the building of the rSGC steps but with a fixed σb value (σb = 0.06), and the calculated optimal k is 5 (Figures 1D–F). As samples for rSGCs were from the same region (i.e., Lake Woods), the fewer groups (with σb value of 0.06) than cSGC may contribute to relatively similar OSL properties (e.g., inherent brightness or the shape of the OSL decay curve) of the individual quartz grains. About 90–93% of the measured-to-SGC ratios for each group from five group SGCs (σb = 0.06) are consistent with unity at 2σ (Supplementary Figure S3). The validation of these two sets of rSGCs is tested in Section 3.2.
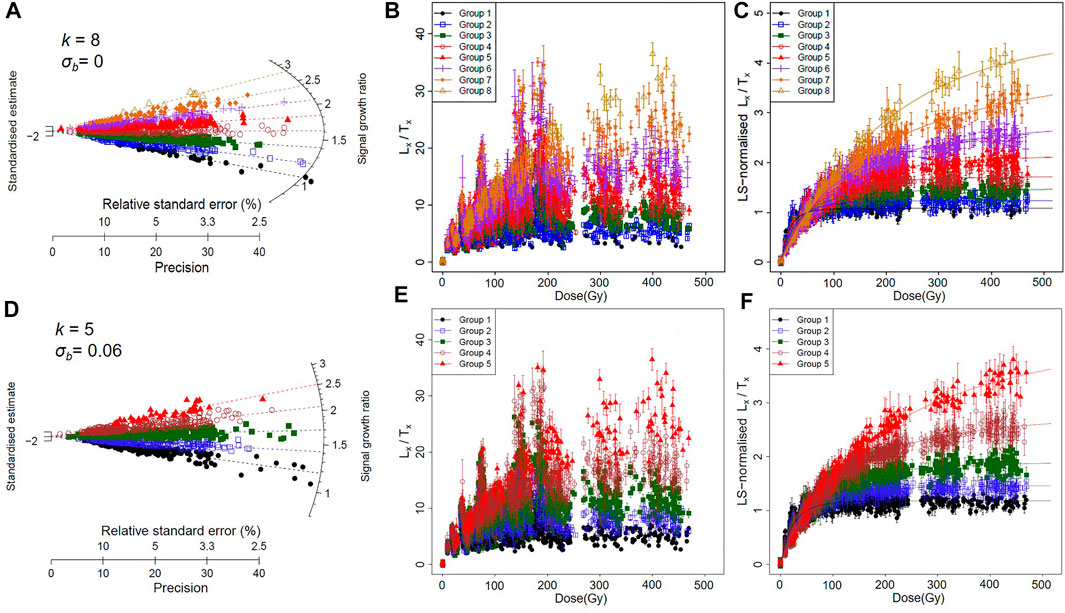
FIGURE 1. (A) Distribution of signal growth ratios for all accepted quartz grains (n = 1,438) from five Lake Woods samples. Different symbols denote the eight groups identified using the finite mixture model and a σb value of 0 for each group. (B) Single-grain Lx/Tx ratios for the eight groups, plotted as a function of laboratory dose. (C) LS-normalized Lx/Tx ratios for the eight groups, based on the data shown in (B). (D) Same data in (A) but divided into five groups by the FMM (σb = 0.06). (E) Single-grain Lx/Tx ratios for the five groups in (D). (F) LS-normalized Lx/Tx ratios for the five groups, based on the data shown in (E).
To validate De estimates generated by rSGCs, a practical test must demonstrate that the rSGC method can adequately generate the same results as a full SAR protocol. During building of the rSGCs, each grain was assigned to one of the eight groups (σb = 0) or to one of the five groups (σb = 0.06) (step 2), and the natural signal has been normalized when applying the LS-normalization procedure to each group to determine their group-specific SGCs (step 3). Thus, the normalized natural signal can directly project onto the corresponding SGC to estimate the De value for that grain. The obtained SGC De values for all non-rejected grains are compared to the SAR De values obtained from individual DRCs (Figure 2A and Supplementary Figure S4A). For the SGCs, De values were obtained by eight group SGCs (σb = 0), and the two sets of De values are in good agreement, with 96.4% of the ratios (rSGC De/SAR De) consistent with unity at 2σ (Figure 2B). Similarly, the ratios are with 94.4% consistency with unity at 2σ for rSGC De values obtained by five group SGCs (σb = 0.06) (Supplementary Figure S4B).
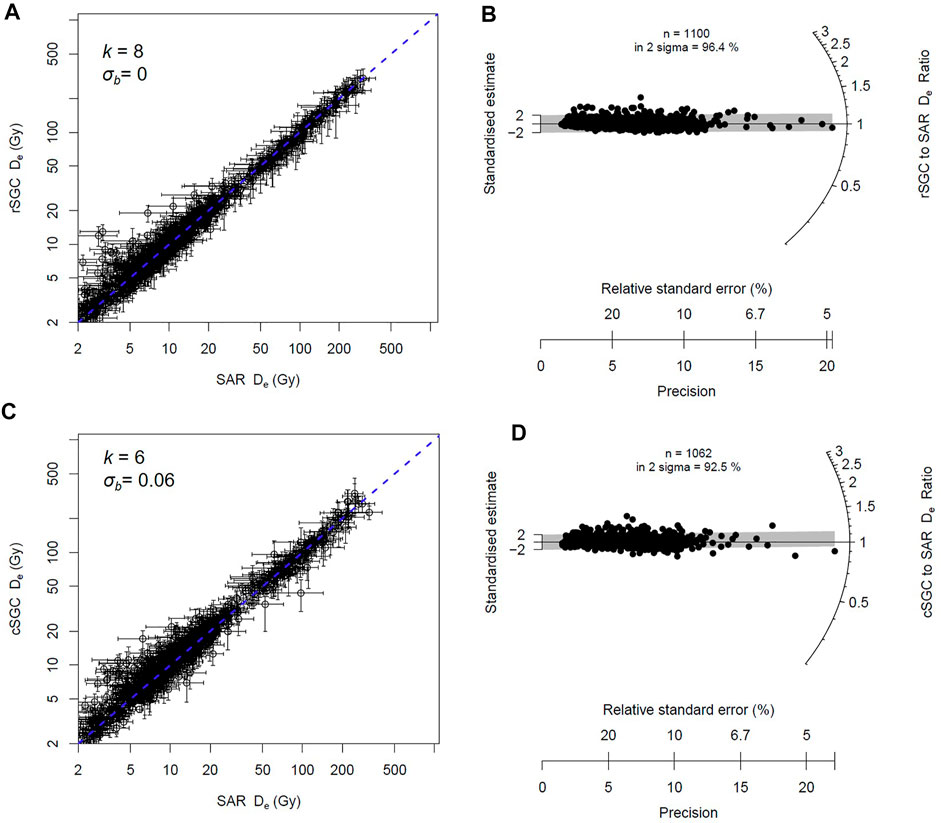
FIGURE 2. (A) Comparison of the SAR and rSGC De values (σb = 0). The dashed line represents the 1:1 ratio. The ratios of the rSGC and SAR De are radially plotted in (B). (C) Comparison of the SAR and cSGC De values, and the corresponding ratios are radially plotted in (D).
It should be noted that the comparisons between the SAR and rSGC De values shown in Figure 2A and Supplementary Figure S4A are only available for those grains that produce reliable results using both approaches. As shapes for DRCs and for rSGCs are different, the number of grains that pass criteria 6)–8) is also different (Supplementary Table S4). To further test the reliability of the rSGCs, we compared the De distributions of three representative Lake Woods samples (Pit5_1.5, Pit5_2.6, and Pit6_1.13) in Figure 3 and Supplementary Figure S5. For a well-bleached beach sample (Pit6_1.13), the SAR and rSGC De (σb = 0) distributions have overdispersion values of 20.0 ± 4.8 and 29.8 ± 2.9%, respectively, with most individual De values spread randomly about a weighted mean De of ∼0.98 Gy (Figure 3A). As the CAM Des are consistent at 2σ (Table 1), we suggest that this increased spread for rSGC Des does not affect the weighted mean De to a significant extent, and similar observations were previously stated by Fu et al. (2020). For lacustrine samples (Pit5_1.5 and Pit5_2.6), both of them showed broad and continuous distribution of De values (Figures 3B,C); the corresponding OD values are 94.9 and 106.0% for SAR Des and 93.3 and 113.1% for rSGC Des (σb = 0). The large spread in De may be due to heterogeneous bleaching prior to deposition and/or reworking by bioturbation. In addition to CAM De, the Minimum Age Model (MAM) was also applied to these samples to partly identify well-bleached grains. Except the CAM De value for Pit5_2.6, the weighted mean De values by different measurement methods (i.e., SAR and rSGC) for these samples are consistent at 2σ (Table 1). Sample Pit5_2.6 includes grains with large De values, and around 124 grains (account for 20% of accepted grains) were rejected for criteria 6) and 7) (Supplementary Table S4), which lead to truncation of the full De distribution. As the shape for DRCs is different from that of rSGCs, few grains (i.e., 66 grains, account for 10% of accepted grains) were rejected because of extrapolation or saturation. With reduced impact by truncation, the obtained CAM De increased from 17.2 ± 0.7 Gy (by SAR data) to 19.0 ± 0.8 Gy (by rSGC data) (Table 1). Regardless of the saturated grains, the general consistency between SAR and rSGC Des (σb = 0) supports that rSGCs perform well for Lake Woods samples. In addition, the OD and the De estimates by the CAM and MAM obtained by eight group SGCs are in agreement with those for Des obtained by five group SGCs (Table 1), and we suggest both rSGC sets are reliable for De estimation in Lake Woods.
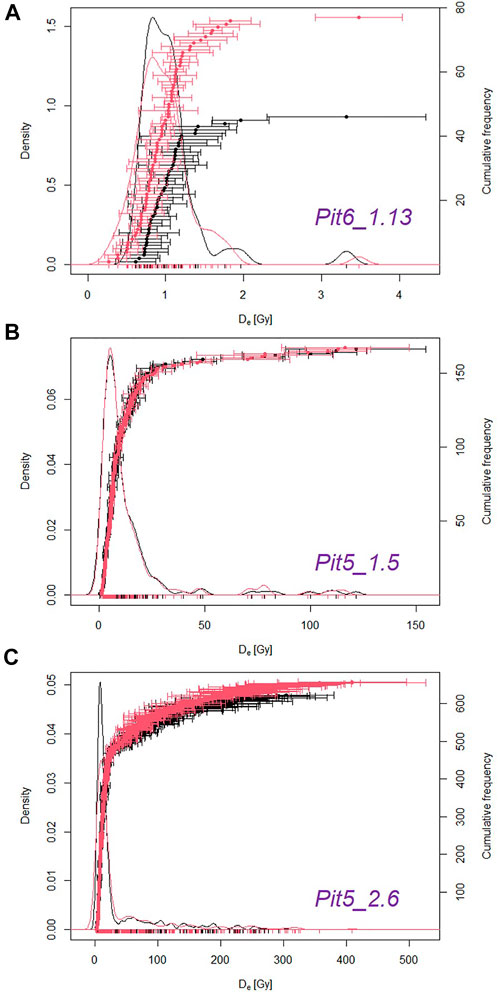
FIGURE 3. Comparison of the De values derived using SAR DRCs (black color) and those derived using rSGCs (σb =0, red color). (A) Sample Pit 6_1.13; (B) Sample Pit5_1.15; (C) Sample Pit5_2.6.
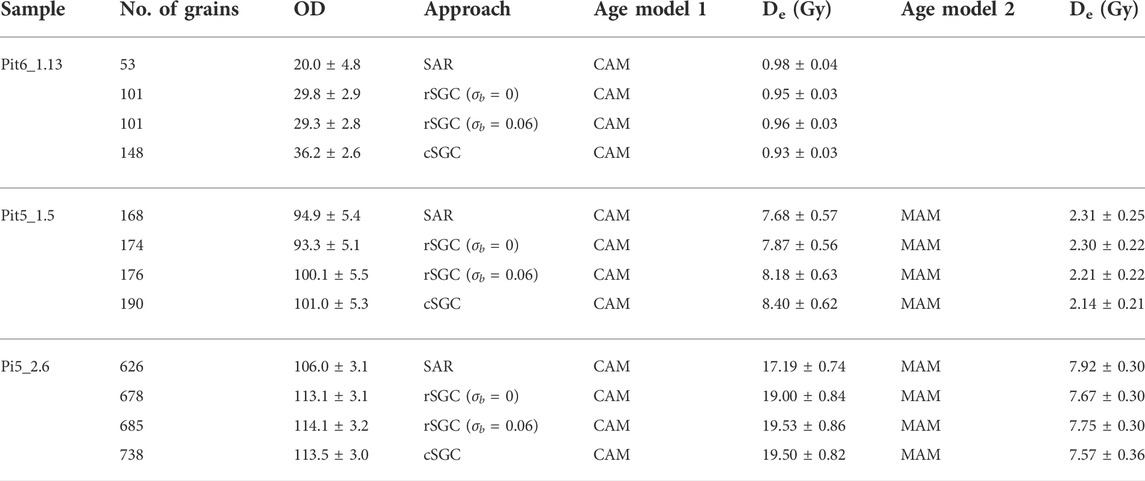
TABLE 1. Weighted mean De values for SAR, rSGC, and cSGC. A σb value of 0.3 was applied for MAM De estimation.
In an ideal situation (i.e., the cSGC is reliable for samples from Lake Woods), only three SAR cycles are necessary for cSGC De estimation, which involves one cycle for the natural signal and two for regenerative doses, and rejection criteria 1), 4), 6), 7), and 8) can be applied to them. Thus, for each grain, we selected the natural signal, the signal for the second lowest regenerative dose (the lowest being 0 Gy), which lies in the linear portion of the DRC, and the signal for the largest or second largest regenerative dose (which lies beyond the linear region) for cSGC De calculation. Using this approach, more grains are accepted than that for SAR or rSGC analysis (Supplementary Table S4). The two selected regenerative doses were referred as Dr1 and Dr2, respectively. The ratio between the Lx/Tx values of Dr1 and Dr2 for each accepted grain is calculated, and the obtained ratio is compared with the corresponding ratio for each of the six cSGCs; the latter ratios were calculated by dividing the SGC values at Dr2 by those at Dr1. As the Lx/Tx ratio can quantify the saturation characteristics (e.g., shape of DRC or SGC) of different grains or different group SGCs (Li et al., 2016), this comparison can help us select the specific SGC with similar saturation characteristics to the studied grain. Based on this step, each grain was assigned to one of the six groups from Fu et al., (2020). To normalize the natural signal, the Lr1/Tr1 and Lr2/Tr2 for each grain are multiplied by a scaling factor, such that the sum of squared residuals is minimized. With the scaling factor, the normalized Ln/Tn value can be projected onto the relevant cSGCs to get cSGC De, and the obtained cSGC De show excellent statistical consistency with the SAR De (Figure 2C) and with the rSGC De estimates (Supplementary Figure S6A). Around 92.5% of the cSGC-to-SAR De ratios (Figure 2D) and 93.9% of the cSGC-to-rSGC De ratios (Supplementary Figure S6B) are within 2σ, which validate the use of cSGCs for rapid and robust De estimation for quartz grains from Lake Woods.
De distributions for the three representative samples (discussed in Section 3.2) are visualized using probability density plots in Figure 4, and the patterns of De distributions are generally consistent between the cSGC and rSGC datasets. The OD and the De estimates by the CAM and MAM for Des obtained by cSGC are in agreement with those for Des obtained by rSGC (Table 1), which further prove the reliability of cSGCs.
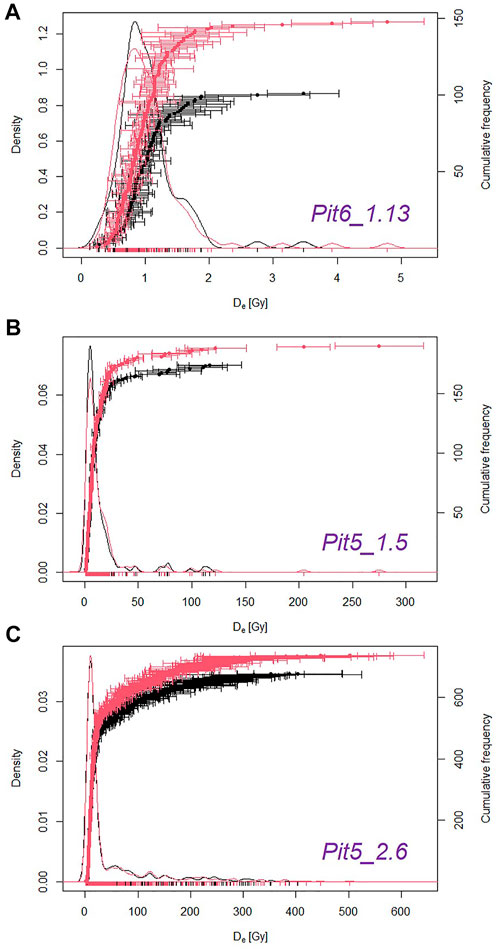
FIGURE 4. Comparison of the De values derived using rSGCs (σb =0, black color) and those derived using cSGCs (red color). (A) Sample Pit 6_1.13; (B) Sample Pit5_1.15; (C) Sample Pit5_2.6.
The application of the cSGC (following Fu et al., 2020) has been successfully verified for coarse-grained quartz samples from Lake Woods. For samples without saturated grains, the De values obtained by the cSGC are consistent with the De values obtained by the rSGCs and by the SAR procedures. With the verification of the cSGCs, at least 50% of instrument time can be saved comparing the traditional SAR procedure (three SAR cycles for cSGC De vs. around seven cycles for SAR De measurement), and large instrument time for building rSGC can also be saved (∼440 h in this study).
TC conducted the field investigation and collected all samples. XR and TC carried out all the laboratory work. XR, BL, and TC conducted the data analysis and manuscript writing.
This study was supported by an Australian Research Council (ARC) Future Fellowship to Bo Li (FT140100384), a Foundation for Outstanding Young Teachers in Jilin University to Xue Rui (Grant No. 419080520486), and the ARC Centres of Excellence scheme (Project Number CE170100015) and the ARC Future Fellowship scheme (FT180100524) to Tim Cohen.
We thank Richard G. Roberts, Zenobia Jacobs, Yasaman Jafar, and Terry Lachlan for essential support in the luminescence dating laboratory. The open-access publication fee will be provided by Jilin University.
The authors declare that the research was conducted in the absence of any commercial or financial relationships that could be construed as a potential conflict of interest.
All claims expressed in this article are solely those of the authors and do not necessarily represent those of their affiliated organizations, or those of the publisher, the editors, and the reviewers. Any product that may be evaluated in this article, or claim that may be made by its manufacturer, is not guaranteed or endorsed by the publisher.
The Supplementary Material for this article can be found online at: https://www.frontiersin.org/articles/10.3389/feart.2022.939964/full#supplementary-material
Burbidge, C., Duller, G., and Roberts, H. (2006). De determination for young samples using the standardised OSL response of coarse-grain quartz. Radiat. Meas. 41, 278–288. doi:10.1016/j.radmeas.2005.06.038
Chen, G. Q., Yi, L., Xu, X. Y., Yu, H. J., Cao, J. R., Su, Q., et al. (2013). Testing the standardized growth curve (SGC) to OSL dating coastal sediments from the south Bohai Sea, China. Geochronometria 40, 101–112. doi:10.2478/s13386-013-0103-z
Fu, X., Li, B., Jacobs, Z., Jankowski, N. R., Cohen, T. J., and Roberts, R. G. (2020). Establishing standardised growth curves (SGCs) for OSL signals from individual grains of quartz: A continental-scale case study. Quat. Geochronol. 60, 101107. doi:10.1016/j.quageo.2020.101107
Galbraith, R. F., Roberts, R. G., Laslett, G. M., Yoshida, H., and Olley, J. M. (1999). Optical dating of single and multiple grains of quartz from jinmium rock shelter, northern Australia: Part I, experimental design and statistical models. Archaeometry 41, 339–364. doi:10.1111/j.1475-4754.1999.tb00987.x
Guralnik, B., Li, B., Jain, M., Chen, R., Paris, R. B., Murray, A. S., et al. (2015). Radiation-induced growth and isothermal decay of infrared-stimulated luminescence from feldspar. Radiat. Meas. 81, 224–231. doi:10.1016/j.radmeas.2015.02.011
Hu, Y., Li, B., and Jacob, Z. (2019). Single-grain quartz OSL characteristics: Testing for correlations within and between sites in Asia, Europe and Africa. Methods Protoc. 3 (1), 2. doi:10.3390/mps3010002
Jacobs, Z., Duller, G. A. T., and Wintle, A. G. (2006). Interpretation of single grain distributions and calculation of. Radiat. Meas. 41, 264–277. doi:10.1016/j.radmeas.2005.07.027
Lai, Z.-P., Brückner, H., Zöller, L., and Fülling, A. (2007). Existence of a common growth curve for silt-sized quartz OSL of loess from different continents. Radiat. Meas. 42, 1432–1440. doi:10.1016/j.radmeas.2007.08.006
Lai, Z. (2006). Testing the use of an OSL standardised growth curve (SGC) for determination on quartz from the Chinese Loess Plateau. Radiat. Meas. 41, 9–16. doi:10.1016/j.radmeas.2005.06.031
Li, B., Jacobs, Z., and Roberts, R. G. (2016). Investigation of the applicability of standardised growth curves for OSL dating of quartz from Haua Fteah cave, Libya. Quat. Geochronol. 35, 1–15. doi:10.1016/j.quageo.2016.05.001
Li, B., Roberts, R. G., Jacobs, Z., and Li, S.-H. (2015). Potential of establishing a ‘global standardised growth curve’ (gSGC) for optical dating of quartz from sediments. Quat. Geochronol. 27, 94–104. doi:10.1016/j.quageo.2015.02.011
Long, H., Lai, Z., Fan, Q., Sun, Y., and Liu, X. (2010). Applicability of a quartz OSL standardised growth curve for De determination up to 400 Gy for lacustrine sediments from the Qaidam Basin of the Qinghai-Tibetan Plateau. Quat. Geochronol. 5, 212–217. doi:10.1016/j.quageo.2009.05.005
Murray, A. S., and Wintle, A. G. (2000). Luminescence dating of quartz using an improved single-aliquot regenerative-dose protocol. Radiat. Meas. 32, 57–73. doi:10.1016/s1350-4487(99)00253-x
Peng, J., and Li, B. (2017). Single-aliquot regenerative-dose (SAR) and standardised growth curve (SGC) equivalent dose determination in a batch model using the R package ‘numOSL. Anc. TL 35, 32–53. http://ancienttl.org/ATL_35-2_2017/ATL_35-2_Peng_p32-53.pdf.
Peng, J., Pagonis, V., and Li, B. (2016). On the intrinsic accuracy and precision of the standardised growth curve (SGC) and global-SGC (gSGC) methods for equivalent dose determination: A simulation study. Radiat. Meas. 94, 53–64. doi:10.1016/j.radmeas.2016.09.006
Roberts, H., and Duller, G. A. (2004). Standardised growth curves for optical dating of sediment using multiple-grain aliquots. Radiat. Meas. 38, 241–252. doi:10.1016/j.radmeas.2003.10.001
Roberts, R. G., Galbraith, R., Yoshida, H., Laslett, G., and Olley, J. M. (2000). Distinguishing dose populations in sediment mixtures: A test of single-grain optical dating procedures using mixtures of laboratory-dosed quartz. Radiat. Meas. 32, 459–465. doi:10.1016/s1350-4487(00)00104-9
Stevens, T., Armitage, S. J., Lu, H., and Thomas, D. S. (2007). Examining the potential of high sampling resolution OSL dating of Chinese loess. Quat. Geochronol. 2, 15–22. doi:10.1016/j.quageo.2006.03.004
Telfer, M., Bateman, M., Carr, A., and Chase, B. (2008). Testing the applicability of a standardized growth curve (SGC) for quartz OSL dating: Kalahari dunes, South African coastal dunes and Florida dune cordons. Quat. Geochronol. 3, 137–142. doi:10.1016/j.quageo.2007.08.001
Wang, X., Qiu, F., Nian, X., Liu, R., and Zhang, W. (2022). Testing the applicability of standardised growth curves (SGCs) for OSL signals of quartz grains from the Yangtze Delta, China. Quat. Geochronol. 72, 101348. doi:10.1016/j.quageo.2022.101348
Wintle, A. G. (1997). Luminescence dating: Laboratory procedures and protocols. Radiat. Meas. 27, 769–817. doi:10.1016/s1350-4487(97)00220-5
Wintle, A. G., and Murray, A. S. (2006). A review of quartz optically stimulated luminescence characteristics and their relevance in single-aliquot regeneration dating protocols. Radiat. Meas. 41, 369–391. doi:10.1016/j.radmeas.2005.11.001
Keywords: quartz, lake woods, regional application, luminescence dating, continental standardized growth curves
Citation: Rui X, Li B and Cohen TJ (2022) Testing the use of continental standardized growth curves (SGCs) for De estimation on coarse quartz grains from Lake Woods, Northern Australia. Front. Earth Sci. 10:939964. doi: 10.3389/feart.2022.939964
Received: 09 May 2022; Accepted: 15 August 2022;
Published: 12 September 2022.
Edited by:
Hema Achyuthan, Anna University, Chennai, IndiaReviewed by:
Yan Li, China University of Geosciences, ChinaCopyright © 2022 Rui, Li and Cohen. This is an open-access article distributed under the terms of the Creative Commons Attribution License (CC BY). The use, distribution or reproduction in other forums is permitted, provided the original author(s) and the copyright owner(s) are credited and that the original publication in this journal is cited, in accordance with accepted academic practice. No use, distribution or reproduction is permitted which does not comply with these terms.
*Correspondence: Xue Rui, eHIxNDVAamx1LmVkdS5jbg==
Disclaimer: All claims expressed in this article are solely those of the authors and do not necessarily represent those of their affiliated organizations, or those of the publisher, the editors and the reviewers. Any product that may be evaluated in this article or claim that may be made by its manufacturer is not guaranteed or endorsed by the publisher.
Research integrity at Frontiers
Learn more about the work of our research integrity team to safeguard the quality of each article we publish.