 Xiaojun Li
 Na Li
Na Li Mianshui Rong
 Qing Dong
95% of researchers rate our articles as excellent or good
Learn more about the work of our research integrity team to safeguard the quality of each article we publish.
Find out more
ORIGINAL RESEARCH article
Front. Earth Sci. , 22 June 2022
Sec. Structural Geology and Tectonics
Volume 10 - 2022 | https://doi.org/10.3389/feart.2022.938514
This article is part of the Research Topic Measuring, Modeling and Predicting the Seismic Site Effect View all 20 articles
The effect of local site conditions on the earthquake ground motion is a very important factor to be considered in engineering seismic fortification. Many methods, such as numerical simulation methods based on site analysis models and statistical empirical relation methods based on the earthquake ground motion observations and numerical simulation data, have been used to consider the site effects in actual engineering seismic fortification and earthquake disaster assessment. The statistical analysis to obtain characteristic parameters of site condition effect based on strong motion and microtremor records become an economical and practical method of determining the designed ground motion of engineering sites, especially for large survey areas and engineering sites where it is difficult to carry out a site survey. In this paper, a novel evaluation method for site effect on earthquake ground motion is proposed. The new method is based on the horizontal to vertical spectral ratio (HVSR) method, but the original HVSR is replaced by a modified HVSR considering the effect of the soil layer on the vertical ground motion. In order to build the model and determine the corresponding parameters of the modified HVSR, first, the ground motions in the bedrock below the soil layer are calculated using the one-dimensional equivalent linear method. These calculated records are independent of the influence of the downgoing wavefield, and the differences between the ground surface to bedrock spectral ratio (SBSR). The HVSR for the local sites of ground motion observation stations are analyzed using the strong ground motion records from the Kiban-Kyoshin network (KiK-net) in Japan. The statistical characteristics of the relationship between SBSR and HVSR are revealed, and then, a quantitative relationship between SBSR/HVSR and HVSR is established. The proposed evaluation method for the site effect has the advantage that the original HVSR method only requires ground motion records on the ground surface of the site, and it further considers the influence of the vertical seismic effect on the accuracy of the HVSR method. The proposed method can characterize the influence of the site conditions on ground motion more reasonably than the conventional method.
Surveys and investigations of earthquake disasters have shown that the spatial variations in the local site conditions are the main factor leading to the differences in earthquake disasters in local areas during large earthquakes (Wood, 1908; Liu, 2002). The conclusion that the important effect of local site conditions on the propagation of seismic waves has been repeatedly confirmed in large earthquakes and has been broadly studied and applied in practical engineering (Borcherdt et al., 1976; Seed et al., 1976a, 1976b, 1988; Li, 1992; Guo et al., 2013; Zhang et al., 2020). The “local site” conditions generally refer to the variations in the shallow engineering geological structures and surface topography within a region of tens to hundreds of meters. In studies of the effect of site conditions on ground motions, certain classification indicators are usually used to classify sites into different categories and to characterize the differences in the site conditions (Lee et al., 2001; Building Seismic Safety Council, 2004; Huang et al., 2009; Ministry of Housing and Urban-Rural, 2016; Li, 2013; Li et al., 2019). Based on the site classification in the statistical analysis of strong-motion records or numerical simulation methods of site models, the characteristic parameters and empirical relationships are obtained to characterize the effect of the site conditions on ground motions (Hwang et al., 1997; Li et al., 2001; Lu et al., 2008; Pitilakis et al., 2013). To provide a reference for engineering design under complex site conditions, a ground motion parameter adjustment model is used to account for the effects of the different site conditions on ground motions. A simple classification of sites is often insufficient when representing the effects of specific sites on ground motions. For this reason, it is necessary to carry out a drilling survey of the site conditions for important engineering projects and to perform site seismic response simulations for the specific site conditions to account for their impact on the ground motion. For sites that involve a large scope (such as new district construction planning and old city reconstruction) and for sites that pose difficulties to the execution of drilling survey (such as construction sites in alpine canyon areas or on islands and reefs), economical and practical methods need to be utilized for acquiring the characteristics of the site effects and to determine the seismic design of the engineering site, such as methods based on the analysis and statistics of strong-motion records and microtremors.
As early as 1970, Borcherdt (1970) proposed a transfer function spectral ratio method for calculating sedimentary site effects using records of strong motions observed by site stations and referencing bedrock stations. This type of method is the most direct method of site effect analysis and is referred to as the classical standard spectral ratio method. The surface to bedrock spectral ratio (SBSR) method is based on the records of borehole arrays (Wen et al., 1995; Régnier et al., 2013), and the ground motion records at the borehole bedrock are used as the reference ground motion. Compared with the standard spectral ratio method, the SBSR method can effectively solve the difficult problem of selecting a reference free-surface bedrock. In addition, since it is believed that the ground motion records of a vertical array on the ground surface and those of borehole bedrock contain the same source effect and propagation path effect, the SBSR can better characterize the effect of the site conditions on ground motions. Nevertheless, it is imperative to note that the records for the bedrock below the soil layers are disturbed by the downgoing wavefield (Bonilla et al., 2002; Régnier et al., 2013).
In the late 1980s, the Japanese scholar Nakamura proposed a method for estimating the influence of the characteristics of a site on ground motions based on the Fourier amplitude spectral ratio of the horizontal and vertical components of a microtremor (Nakamura, 1989), which later became known as the horizontal to vertical spectral ratio method (referred to as the HVSR method or the Nakamura method). The HVSR method includes the following basic assumptions: 1) for site microtremor observations in different periods, the spectral characteristics of the microtremors are basically the same, and the amplification effect is mainly related to the dynamic characteristics of the soil media; 2) the value of HVSR at the bedrock is 1; 3) the horizontal component of the microtremors is amplified by the soil layers, but the vertical component is basically not amplified.
The HVSR method derives from microtremor observations and analysis, and it was first used in the study of microearthquakes (Konno et al., 1998; Chen et al., 2009). It was later applied to the analysis of strong-motion observations and then, it was expanded into the research of site effects on ground motions (Lermo et al., 1993; Yamazaki et al., 1997; Zhao et al., 2006; Fukushima et al., 2007; Wen et al., 2010; Kawase, 2011; Nagashima et al., 2014; Rong et al., 2016). The validity and scope of the application of the HVSR method in the analysis of the site effect on ground motions have always been subject to some debate and controversy. This is mainly because the HVSR method assumes that the HVSR at the bedrock is one and the vertical component is basically not amplified. At present, there still is no consistent conclusion regarding these issues, but a common notion is that the HVSR method can effectively extract the predominant period of the site effects on ground motions. However, there can be large errors in the estimation of the site effect amplification (Rong et al., 2016).
In this study, we present our results of the study on the strong motion records of the Kiban-Kyoshin network (KiK-net) in Japan, and we examined the different characteristics of the SBSR and HVSR at the sites of strong-motion recording stations and the variations in the SBSR/HVSR with the spectral period. Then, a novel site effect evaluation method that uses seismic records was developed based on a modified HVSR and the statistical relationship between the SBSR and HVSR.
Theoretically, compared with the HVSR method, the SBSR method can more reasonably evaluate the effects of the site conditions under a seismic, but it needs to use the observed ground motion records on the ground surface of the site and the corresponding bedrock below soil layers, separately. Therefore, it is necessary to conduct site drilling and borehole observations, which is expensive and time-consuming. The HVSR method only requires ground motion records, but there are some unreasonable problems in the basic assumptions listed above. Therefore, the constructuion of an indirect evaluation method for the SBSR was developed in this study.
Based on the SBSR method the following relationship can be assumed,
where
where
If the Fourier amplitude spectrum transfer function of the horizontal motion from the bedrock to the ground surface (
According to the basic assumption of the HVSR method,
Then, based on Eq. 3,
Therefore,
where
Japan’s National Institute of Earth Science and Disaster Prevention (NIED) has established two strong motion observation networks, K-NET and KiK-net, with a total of more than 1,700 stations nationwide. The average distance between stations is less than 20 km. The stations in the KiK-net strong motion observation network are all multi-point borehole arrays (i.e., a vertical array). Each station is equipped with tri-axial strong motion observation instruments on the ground surface and at the bottom bedrock in the borehole. They can simultaneously observe ground motions on the ground surface and in the bedrock below the soil layers. The borehole depths of the KiK-net stations are all 100 m or greater. Except for a few individual station sites, the boreholes all reach the engineering bedrock surface (V S > 760 m/s). The KiK-net was put into service in 1997, and a large number of observation records have been obtained.
The focus of this study was analysis of the influence of the soil layers on the ground motion. Therefore, when selecting the KiK-net observation records for this study, it was necessary to examine whether the observation station site could be regarded as a layered site, i.e., whether it could be simplified to a one-dimensional site model. First, the stations used in this study were selected from the 662 stations in the KiK-net network that had obtained a certain number of strong-motion records. The selection criteria were as follows. 1) The number of records with a peak ground acceleration (PGA) of PGA > 100 gal was two or more. 2) The number of records with PGA > 10 gal was at least 100. Then, for the stations with ground motion records met the above criteria, their transfer functions of the horizontal ground motions were calculated according to the one-dimensional site models (referred to as the calculated transfer function
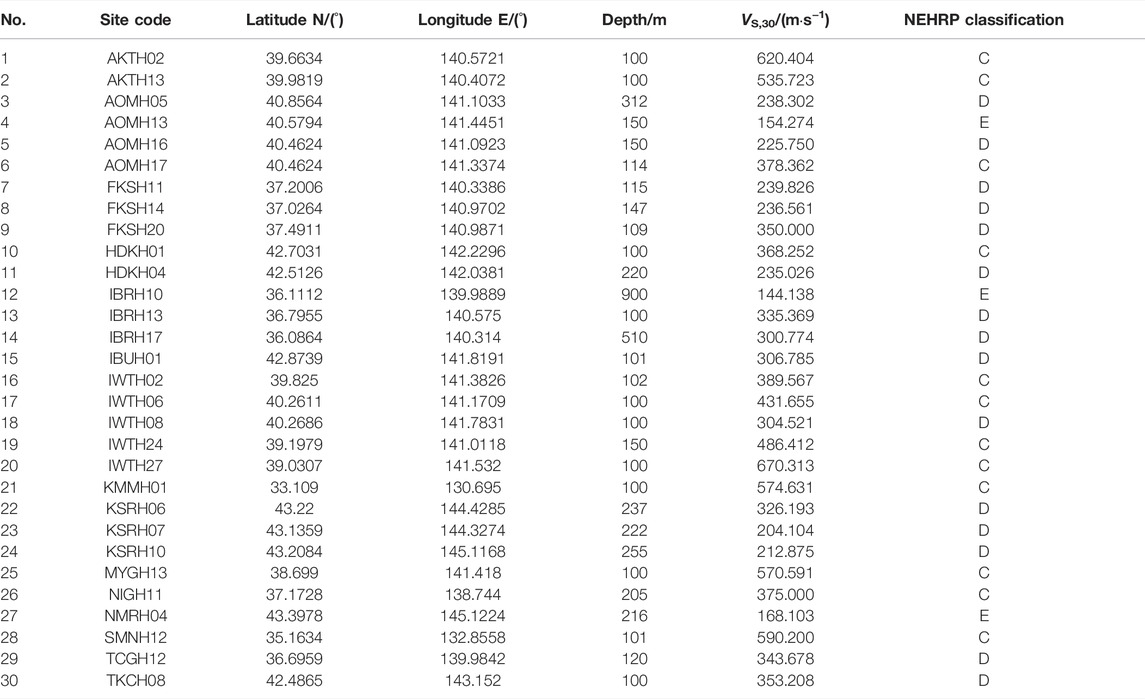
TABLE 1. Selected stations and related information in this study.
Based on a comparison of the site responses to the main shocks and aftershocks of large earthquakes, earlier researchers have speculated that the threshold for nonlinear site responses is 100–200 gal (Wen et al., 1994; 1995). However, recent studies have shown that a slight nonlinearity of site responses appears in records with medium-level intensities (PGA = 20–80 gal) (Baise, 2000; Régnier et al., 2013). Thus, we divided the 19,002 sets of three-component strong motion records obtained from the 30 stations into six groups, with peak ground accelerations of 10–20, 20–100, 100–200, 200–300, and >300 gal (Table 2). Since the records with PGAs of < 10 gal are of little engineering significance, they were not considered in this study.
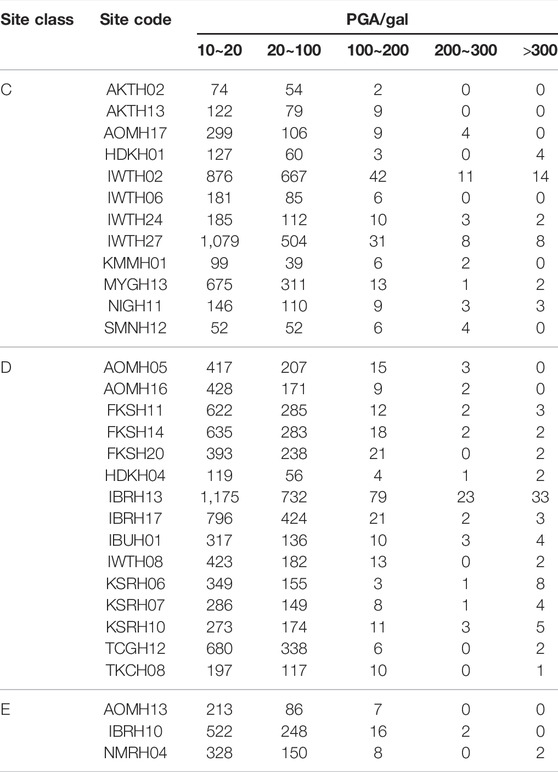
TABLE 2. The number of strong-motion records in the different PGA groups.
In studies of site condition effects using strong motion records, as much attention as possible should be given to the recorded S-wave time section. Therefore, before calculating the Fourier amplitude of the ground motion, a time window with a reasonable length should be chosen. The time window should not only contain the main energy of the shear waves, but it should also avoid the influence of the surface waves on the amplitude spectrum. For this reason, the time window for the ground motion record was chosen to be from the first arrival of the P wave to the time when the seismic wave energy reached 80% of the total energy (the cut-off time). In the specific analysis, the cut-off time was calculated using the ground motion energy by the Arias intensity formula (Eq. 7), and the signal-to-noise ratio (SNR) was calculated using Eq. 8. The first 15 s of the record were treated as noise to eliminate the records with an SNR of less than 5 dB in the 0.05–20 Hz frequency, to reduce the dispersion of the results caused by unreasonable statistical data, and to improve the accuracy of the analysis results. The ground motion energy I a is defined as
where T e is the ground motion duration. The SNR is defined as
where A signal (f) is the Fourier amplitude spectrum of the ground motion record, and A noise (f) is the Fourier amplitude spectrum of the noise signal.
To calculate
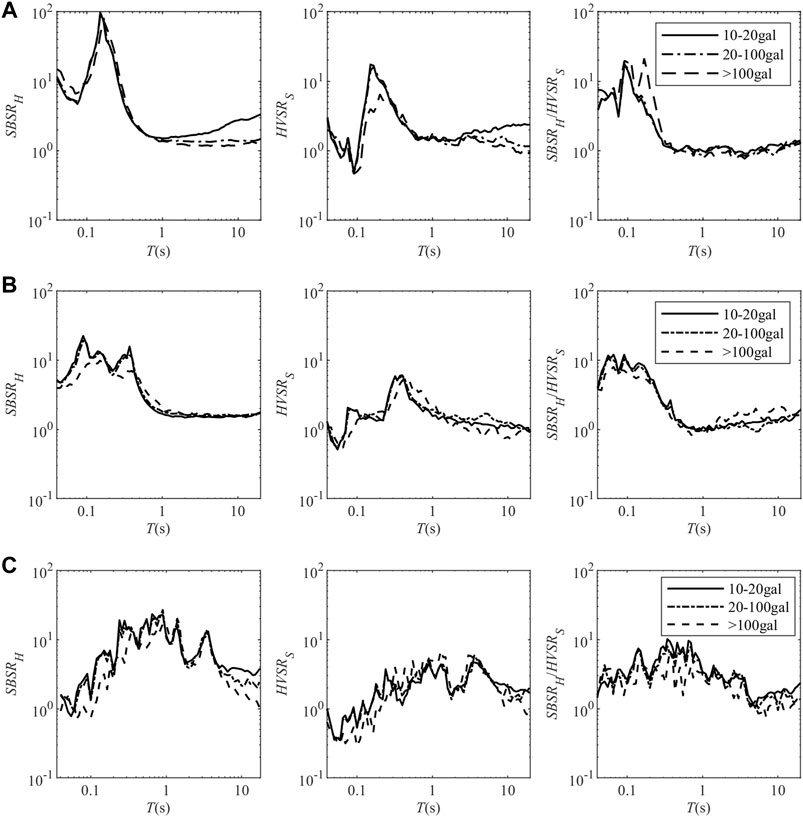
FIGURE 1. The average values of
The data presented in Figures 1A–C show that the mean values of
Figure 2 shows the average
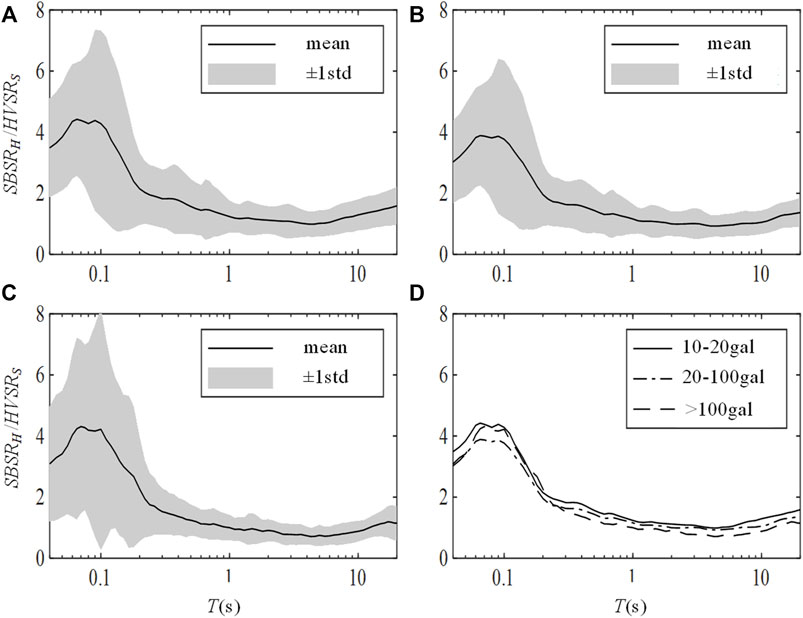
FIGURE 2. Variations in
Figure 3 shows the variations in
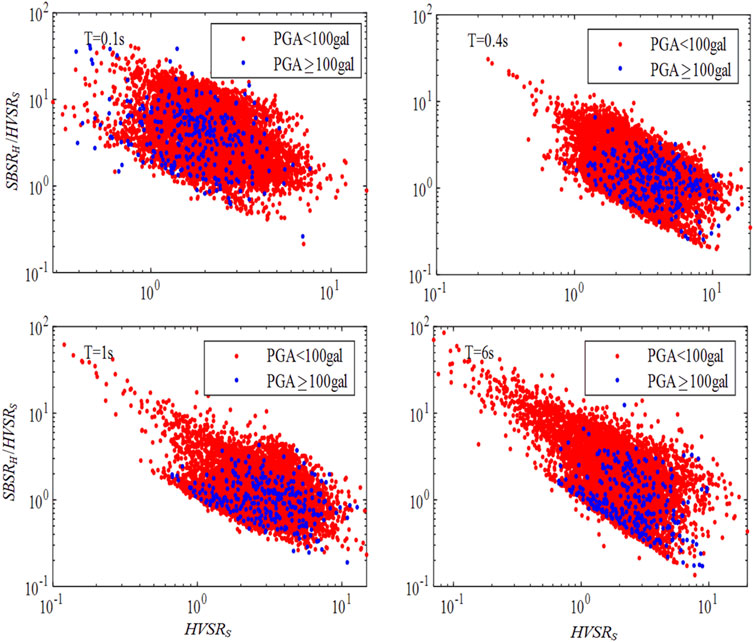
FIGURE 3. Variations in
Based on the above calculation and analysis results and using the logarithmic coordinate linear fitting method, we obtained the following quantitative relationship between the HVSR and SBSR under different ground motion levels in the period range of 0.04–20 s:
where T is the period, and a and b are statistical constants.
Based on previous studies, the statistical values of a and b were obtained, and the results of their changes with the period T are shown in Figure 4. These values vary significantly with T and fluctuate up and down, especially the values of a. For this reason, we used the following parametric model to fit the curves of a and b in the period ranges.
where Y represents a or b, x represents the base-10 logarithmic period, and
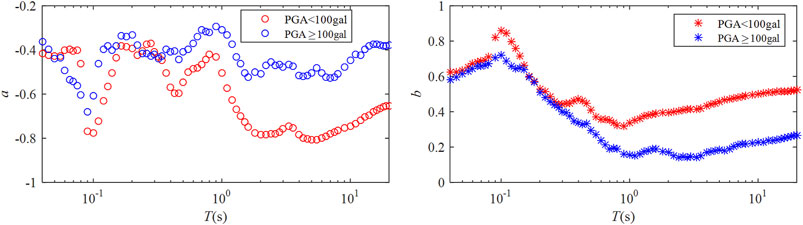
FIGURE 4. Variations in the statistical values of parameters a and b with period T.
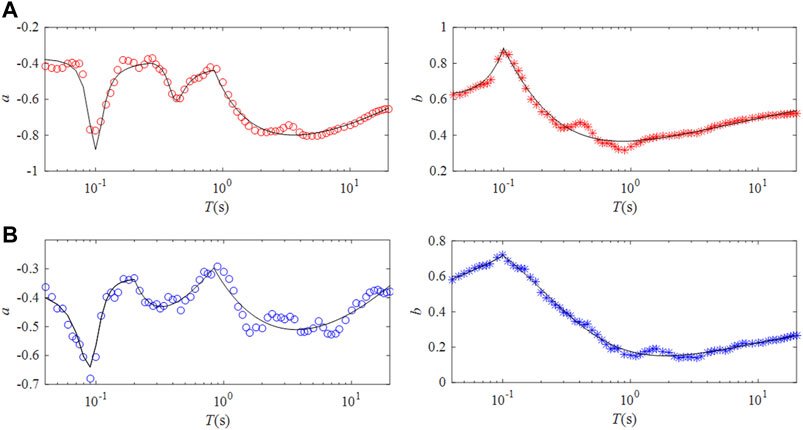
FIGURE 5. Regression curves of the parameters a and b under different ground motion intensities. (A) under weak motions (PGA < 100 gal). (B) under strong motions (PGA > 100 gal).

TABLE 3. Coefficients for the relationships between parameters a and b and the period T.
Through comprehensive consideration of Eqs 6, 9, 10, we obtained the following equations for a novel method of evaluating the site effect:
where
Using 19,002 sets of acceleration record data from 30 strong motion observation stations in Japan’s KiK-net, we performed statistical analysis of the relationship between the SBSR and HVSR of the station sites and obtained a log-linear correlation between the SBSR/HVSR and HVSR. We also obtained a quantitative statistical relationship. Based on the statistical analysis results, we developed a novel evaluation method for site effect using a modified HVSR formula to characterize the influence of the soil layers on the ground motion. The modified HVSR formula accounts for the influence of the vertical ground motion effect of the site and the nonlinear characteristics of the soil layers. The proposed method can more accurately evaluate the effects of the soil layers on the ground motions.
The SBSR is similar as the transfer function of the ground motions from the bedrock to the surface, but it cannot be regarded as the complete amplification function of the site effect on the ground motion. The incident wave at the bedrock below the soil layers was obtained using a one-dimensional equivalent linearization method, which yields the recording for the reference bedrock site. Although this operation can eliminate the influence of the downgoing wavefield on the ground motion record of the bedrock below the soil layers, it also introduces errors into the calculation of the ground motion record at the reference bedrock. Improving the accuracy of the reference bedrock record will to be studied in the future.
Publicly available datasets were analyzed in this study. This data can be found here: https://www.kyoshin.bosai.go.jp/kyoshin/data/index_en.html.
XL and NL contributed to conception and design of the study. NL performed the statistical analysis and wrote the first draft of the manuscript. XL, NL, and MR wrote sections of the manuscript. All authors contributed to manuscript revision, read, and approved the submitted version.
This study is supported by the Natural Science Foundation of China (U1839202, 51421005, 51878625).
The authors declare that the research was conducted in the absence of any commercial or financial relationships that could be construed as a potential conflict of interest.
All claims expressed in this article are solely those of the authors and do not necessarily represent those of their affiliated organizations, or those of the publisher, the editors and the reviewers. Any product that may be evaluated in this article, or claim that may be made by its manufacturer, is not guaranteed or endorsed by the publisher.
We thank the editors and reviewers for their helpful comments and suggestions for improving the manuscript.
The Supplementary Material for this article can be found online at: https://www.frontiersin.org/articles/10.3389/feart.2022.938514/full#supplementary-material
Afshari, K., and Stewart, J. P. (2021). Effectiveness of 1D Ground Response Analyses at Predicting Site Response at California Vertical Array Sites. Los Angeles.University of California.
Baise, L. G. (2000). Investigations in Site Response from Ground Motion Observations in Vertical Arrays. Berkeley: University of California.
Bonilla, L. F., Steidl, J. H., Gariel, J., and Archuleta, R. J. (2002). Borehole Response Studies at the Garner Valley Downhole Array, Southern California. Bull. Seismol. Soc. Am. 92 (8), 3165–3179. doi:10.1785/0120010235
Borcherdt, R. D. (1970). Effects of Local Geology on Ground Motion Near San Francisco Bay. Bull. Seismol. Soc. Am. 60 (1), 29–61. doi:10.1785/BSSA0600010029
Borcherdt, R. D., and Gibbs, J. F. (1976). Effects of Local Geological Conditions in the San Francisco Bay Region on Ground Motions and the Intensities of the 1906 Earthquake. Bull. Seismol. Soc. Am. 66 (2), 467–500. doi:10.1785/bssa0660020467
Building Seismic Safety Council (2003). NEHPR Recommended Provisions for Seismic Regulations for New Buildings and Other Structures (FEMA 450), Part 1 (Provisions). Washington D C: Building Seismic Safety Council, National Institute of Building Sciences, 19.
Chen, Q. F., Liu, L. B., Wang, W. J., and Rohrbach, E. (2009). Site Effects on Earthquake Ground Motion Based on Microtremor Measurements for Metropolitan Beijing. Chin. Sci. Bull. 54 (2), 280–287. doi:10.1007/s11434-008-0422-2
Fukushima, Y., Bonilla, L. F., Scotti, O., and Douglas, J. (2007). Site Classification Using Horizontal-To-Vertical Response Spectral Ratios and its Impact when Deriving Empirical Ground-Motion Prediction Equations. J. Earthq. Eng. 11 (5), 712–724. doi:10.1080/13632460701457116
Guo, M. Z., Zhao, F., and Zhao, F. X. (2013). A Review of the Effect of Small-Scale Surface Topography on Ground Motions. Technol. Earthq. Disaster Prev. 8 (3), 311.
Huang, Y. H., Lu, Y. J., and Peng, Y. J. (2009). Study on the Relations of Site Classification Methods in Seismic Design Standards between china and Abroad. Technol. Earthq. Disaster Prev. 4 (1), 80.
Hwang, H. H. M., Lin, H. J., and Huo, J. R. (1997). Site Coefficients for Design of Buildings in Eastern United States. Soil Dyn. Earthq. Eng. 16 (1), 29–40. doi:10.1016/s0267-7261(96)00031-0
Kawase, H., Sánchez-Sesma, F. J., and Matsushima, S. (2011). The Optimal Use of Horizontal-To-Vertical Spectral Ratios of Earthquake Motions for Velocity Inversions Based on Diffuse-Field Theory for Plane Waves. Bull. Seismol. Soc. Am. 101 (5), 2001–2004. doi:10.1785/0120100263
Konno, K., and Ohmachi, T. (1998). Ground-motion Characteristics Estimated from Spectral Ratio between Horizontal and Vertical Components of Microtremor. Bull. Seismol. Soc. Am. 88 (1), 228–241. doi:10.1785/bssa0880010228
Lee, C. T., Cheng, C. T., Liao, C. W., and Tsai, Y. B. (2001). Site Classification of Taiwan Free-Field Strong-Motion Stations. Bull. Seismol. Soc. Am. 91 (5), 1283–1297. doi:10.1785/0120000736
Lermo, J., and Chávez-García, F. J. (1993). Site Effect Evaluation Using Spectral Ratios with Only One Station. Bull. Seismol. Soc. Am. 83 (5), 1574–1594. doi:10.1785/bssa0830051574
Li, X. J. (2013). Adjustment of Seismic Ground Motion Parameters Considering Site Effects in Seismic Zonation Map. Chin. J. Geotechnical Eng. 35 (S2), 21.
Li, X. J. (1992). An Analysis Method of the Influence of Site Soil Layer on Earthquake Ground Motion. World Earthq. Eng. 8 (2), 49.
Li, X. J., Jing, B. B., Liu, C., and Yin, J. (2019). Site Classification Method Based on Geomorphological and Geological Characteristics and its Application in China. Bull. Seismol. Soc. Am. 109 (5), 1843–1854. doi:10.1785/0120190058
Li, X. J., and Pen, Q. (2001). Calculation and Analysis of Earthquake Ground Motion Parameters for Different Site Categories. Earthq. Eng. Eng. Motion 21 (1), 29.
Liu, H. X. (2002). The Great Tangshan Earthquake of 1976. California: Earthquake Engineering Research Laboratory, California Institute of Technology, 171.
Lu, Y. J., Peng, Y. J., and Lan, J. Y. (2008). Some Key Problems about Site Effects on Seismic Ground Motion Parameters. Technol. Earthq. Disaster Prev. 3 (2), 126.
Ministry of Housing and Urban-Rural (2016). Development of the People’s Republic of China, General Administration of Quality Supervision, Inspection and Quarantine of the People's Republic of China. GB 50011-2010 Code for Seismic Design of Buildings. Edition. Beijing: China Architecture and Building Press.
Nagashima, F., Matsushima, S., Kawase, H., and Sanchez-Sesma, F. J. (2014). Application of Horizontal-To-Vertical Spectral Ratios of Earthquake Ground Motions to Identify Subsurface Structures at and Around the K‐NET Site in Tohoku, Japan. Bull. Seismol. Soc. Am. 104 (5), 2288–2302. doi:10.1785/0120130219
Nakamura, Y. (1989). A Method for Dynamic Characteristics Estimation of Subsurface Using Microtremor on the Ground Surface. Q. Rep. Railw. Tech. Res. Inst. 30 (1), 25.
Pitilakis, K., Riga, E., and Anastasiadis, A. (2013). New Code Site Classification, Amplification Factors and Normalized Response Spectra Based on a Worldwide Ground-Motion Database. Bull. Earthq. Eng. 11 (4), 925–966. doi:10.1007/s10518-013-9429-4
Régnier, J., Cadet, H., Bonilla, L. F., Bertrand, E., and Semblat, J. F. (2013). Assessing Nonlinear Behavior of Soils in Seismic Site Response: Statistical Analysis on KiK-Net Strong-Motion Data. Bull. Seismol. Soc. Am. 103 (3), 1750–1770. doi:10.1785/0120120240
Rong, M. S., Li, X. J., Wang, Z. M., and Lv, Y. J. (2016). Applicability of HVSR in Analysis of Site-Effects Caused by Earthquakes. Chin. J. Geophys. 59 (8), 2878–2891. doi:10.1002/cjg2.30008
Seed, H. B., Murarka, R., Lysmer, J., and Idriss, I. M. (1976). Relationships of Maximum Acceleration, Maximum Velocity, Distance from Source, and Local Site Conditions for Moderately Strong Earthquakes. Bull. Seismol. Soc. Am. 66 (4), 1323–1342. doi:10.1785/BSSA0660041323
Seed, H. B., Romo, M. P., Sun, J. I., Jaime, A., and Lysmer, J. (1988). The Mexico Earthquake of September 19, 1985—relationships between Soil Conditions and Earthquake Ground Motions. Earthq. Spectra 4 (4), 687–729. doi:10.1193/1.1585498
Seed, H. B., Ugas, C., and Lysmer, J. (1976). Site-dependent Spectra for Earthquake-Resistant Design. Bull. Seismol. Soc. Am. 66 (1), 221–243. doi:10.1785/bssa0660010221
Shearer, P. M., and Orcutt, J. A. (1987). Surface and Near-Surface Effects on Seismic Waves-Theory and Borehole Seismometer Results. Bull. Seismol. Soc. Am. 77 (4), 1168–1196. doi:10.1785/bssa0770041168
Thompson, E. M., Baise, L. G., and Tanaka, Y. (2012). A Taxonomy of Site Response Complexity. Soil Dyn. Earthq. Eng. 41, 32.
Thompson, E. M., Baise, L. G., Kayen, R. E., and Guzina, B. B. (2009). Impediments to Predicting Site Response: Seismic Property Estimation and Modeling Simplifications. Bull. Seismol. Soc. Am. 99 (5), 2927–2949. doi:10.1785/0120080224
Wen, K. L., Beresnev, I. A., and Yeh, Y. T. (1995). Investigation of Non-linear Site Amplification at Two Bore Strong Ground Motion Arrays in Taiwan. Earthq. Eng. Struct. Dyn. 24 (3), 313–324. doi:10.1002/eqe.4290240302
Wen, K. L., Beresnev, I. A., and Yeh, Y. T. (1994). Nonlinear Soil Amplification Inferred from Downhole Strong Seismic Motion Data. Geophys. Res. Lett. 21 (24), 2625–2628. doi:10.1029/94gl02407
Wen, R. Z., Ren, Y. F., Zhou, Z. H., and Shi, D. (2010). Preliminary Site Classification of Free-Field Strong Motion Stations Based on Wenchuan Earthquake Records. Earthq. Sci. 23 (1), 101–110. doi:10.1007/s11589-009-0048-8
Wood, H. O. (1908). “Distribution of Apparent Intensity in San Francisco,” in The California Earthquake of April 18, 1906, Report of the State Earthquake Investigation Commission (Washington DC: Carnegie Institution of Washington).
Yamazaki, F., and Ansary, M. A. (1997). Horizontal-to-vertical Spectrum Ratio of Earthquake Ground Motion for Site Characterization. Earthq. Eng. Struct. Dyn. 26 (7), 671–689. doi:10.1002/(sici)1096-9845(199707)26:7<671:aid-eqe669>3.0.co;2-s
Zhang, X. L., Peng, X. B., Li, X. J., Zhou, Z., Mebarki, A., Dou, Z., et al. (2020). Seismic Effects of a Small Sedimentary Basin in the Eastern Tibetan Plateau Based on Numerical Simulation and Ground Motion Records from Aftershocks of the 2008 Mw7.9 Wenchuan, China Earthquake. J. Asian Earth Sci. 192, 104257. doi:10.1016/j.jseaes.2020.104257
Keywords: site condition, site effect, strong motion record, KiK-net, horizontal to vertical spectral ratio
Citation: Li X, Li N, Rong M and Dong Q (2022) Novel Evaluation Method for Site Effect on Earthquake Ground Motion Based on Modified Horizontal to Vertical Spectral Ratio. Front. Earth Sci. 10:938514. doi: 10.3389/feart.2022.938514
Received: 07 May 2022; Accepted: 23 May 2022;
Published: 22 June 2022.
Edited by:
Kun Ji, Hohai University, ChinaReviewed by:
Jinjun Hu, China Earthquake Administration, ChinaCopyright © 2022 Li, Li, Rong and Dong. This is an open-access article distributed under the terms of the Creative Commons Attribution License (CC BY). The use, distribution or reproduction in other forums is permitted, provided the original author(s) and the copyright owner(s) are credited and that the original publication in this journal is cited, in accordance with accepted academic practice. No use, distribution or reproduction is permitted which does not comply with these terms.
*Correspondence: Xiaojun Li, YmVlcmxpQHZpcC5zaW5hLmNvbQ==
Disclaimer: All claims expressed in this article are solely those of the authors and do not necessarily represent those of their affiliated organizations, or those of the publisher, the editors and the reviewers. Any product that may be evaluated in this article or claim that may be made by its manufacturer is not guaranteed or endorsed by the publisher.
Research integrity at Frontiers
Learn more about the work of our research integrity team to safeguard the quality of each article we publish.