 Ling Zhang
 Liuxian Song
 Shoupeng Zhu
 Zhun Guo3*
- 1Key Laboratory of Meteorology Disaster, Ministry of Education (KLME)/Joint International Research Laboratory of Climate and Environment Change (ILCEC)/Collaborative Innovation Center on Forecast and Evaluation of Meteorological Disasters (CIC-FEMD), Nanjing University of Information Science and Technology, Nanjing, China
- 2Key Laboratory of Transportation Meteorology of China Meteorological Administration, Nanjing Joint Institute for Atmospheric Sciences, Nanjing, China
- 3Climate Change Research Center, Institute of Atmospheric Physics, Chinese Academy of Sciences, Beijing, China
- 4Institute of Meteorology and Oceanography, National University of Defense Technology, Changsha, China
Based on the observational hourly precipitation data and the ERA5 reanalysis datasets, the short-term forecasts of the warm-sector heavy rainfall with warm-type shear line (WRWS) events over the coastal areas of the Yangtze–Huaihe River (YHR) are investigated in the regional business model Precision Weather Analysis and Forecasting System (PWAFS). Evaluations and diagnoses are carried out via objective estimations and composition analyses for the rainy season of 2017. Results show that the short-term forecasts of PWAFS are characterized by considerable skills for WRWS events in the coastal areas of YHR in view of the object-based diagnostic evaluation, which, however, tend to generate the rain belts with northeast shift phases and weaker intensities. Meantime, the threat score results for WRWS-associated processes show that the model forecasting skill declines sharply as the precipitation intensity increases. Moreover, composition differences of the synoptic-scale thermodynamic characteristics between observations and forecast results are diagnosed to reveal the possible mechanisms of the short-term forecast biases toward WRWS. The zonal westerlies are overestimated in the model, while the southerlies are underestimated in the lower troposphere over coastal areas of YHR, leading to the northeastward shifted shear line and the absent moisture channel associated with the East China Sea at the boundary layer. Attributed to these atmospheric circulation biases, the accumulated warm and moist energy is weaker at the boundary layer, and hence, the short-term forecasts of the rain-belt location for WRWS over the YHR coastal areas have northeast shifting phases with weaker intensities of precipitation in forecasts of the regional business model PWAFS.
1 Introduction
During the rainy season, a kind of heavy rainfall often occurs in the warm sector of cold front or takes place in the warm areas without cold air influenced (Huang and Coauthors, 1986; Ding et al., 2004; Luo et al., 2016), which is named as the warm-sector heavy rainfall (WSHR). There are extraordinary differences between the WSHR and frontal rainfall in the triggering and maintaining mechanisms, the dynamic and thermodynamic structures, and the interaction with large-scale systems and the meso-scale convective environmental fields (Zhao et al., 2007; Luo et al., 2016; Luo et al., 2017; Du and Chen, 2018). Compared with the frontal rainfall events, the WSHR events always feature more intensive precipitation in a smaller range, which, therefore, tend to emerge conspicuous risks on agriculture and daily life of human beings (Tao and Chen, 1987; Ni and Zhou, 2006; Xie et al., 2006; Zhao et al., 2007; Wu and Luo, 2016).
Generally, small- and meso-scale weather systems are the direct systems causing heavy rainfall. Meantime, the synoptic weather system provides necessary conditions or backgrounds for the smaller-scale weather system. Previous studies have shown that rainfall in South China is closely associated with synoptic weather systems such as low-level jet (Du et al., 2015; Chen et al., 2018; Du and chen, 2018), low vortex (Tao and Ding, 1981; Ninomiya and Akiyama, 1992; Huang and Meng, 2014; Zhong et al., 2014), and shear line (Chang et al., 1998; Ding and Chan, 2005).
Among the studies of heavy rainfall in East China, the most discussed topic is the Meiyu front rainstorm (Li H et al., 2019; Wang et al., 2019; Guan et al., 2020), whereas few of them have focused on WSHR. According to the synoptic weather analyses, WSHR events in the middle and lower reaches of the Yangtze River are summarized in three types: cold fronts, warm types of shear line, and edge of subtropical high. Also, warm-sector heavy rainfall with a warm-type shear line (WRWS) accounts for 68% of the total (Chen et al., 2018), which is an important part of WSHR in the Yangtze–Huaihe River (YHR) Basin in China. In addition, WRWS are both observed in the south of Yangtze River areas (Yao et al., 2020) and Yellow–Huaihe River areas (Lyu et al., 2017). The shear line over YHR is a unique weather system in eastern China. It often occurs in the Meiyu season and is an important weather scale system that triggers heavy rains over YHR. Therefore, for the WSHR analysis in the YHR Basin, it is worth paying enough attention to the characteristics of WRWS.
In fact, the characteristics and mechanisms of WSHR events in China have been researched for several decades. However, WSHR caused by complicated cloud-precipitation microphysical processes and boundary layer processes often occurs abruptly and locally, inducing difficulties in both numerical model predictions and subjective forecasts (Chen et al., 2019). Previous studies have shown that current global numerical weather prediction models normally have limited abilities to predict WSHR events, while the numerical predictability of regional models and ensemble forecasts have comparably higher performances (Wang et al., 2017; Chen et al., 2019). Based on the Advanced Research Weather and Research Forecasting (WRF-ARW) model (Skamarock et al., 2008), the Precision Weather Analysis and Forecasting System (PWAFS) has been developed by Jiangsu Meteorological Bureau, China, through involving three-dimensional variational data assimilations and localizing for East China, especially Jiangsu Province. The PWAFS model shows generally considerable performances in the prediction of convective systems (Shi et al., 2021), but the forecasting skills for WRWS have not been evaluated in detail yet.
In order to further understand the prediction performances of WRWS in PWAFS and make better use of the model in forecasting WRWS, the WRWS forecasts over coastal areas of YHR are evaluated and diagnosed toward the PWAFS model in this study. The article is structured as follows: the data, model, and methodology are briefly described in Section 2. Section 3 provides the objective determinations and forecast evaluations of WRWS over coastal areas of YHR in PWAFS. Afterward, the WRWS-associated thermodynamic differences between observations and PWAFS forecasts are investigated to diagnose possible mechanisms of the prediction biases in Section 4. A summary and discussion follow in Section 5.
2 Data, Model, and Methods
2.1 Observations
The hourly gauge-satellite precipitation data in China, with 0.1° × 0.1° resolution, are derived from the National Meteorology Information Center, China Meteorological Administration (Shen et al., 2014). These hourly precipitation data are merged by two-step algorithms of the probability density function and optimal interpolation through more than 30,000 automatic weather stations over China and Climate Precipitation Center Morphing (CMORPH) precipitation product. The hourly atmospheric circulation fields are taken from the European Center for Medium-Range Weather Forecasts ERA5 reanalysis datasets at 0.25° × 0.25° resolution for detailed analyses of forecast evaluations and diagnoses toward the PWAFS model.
In this study, WRWS events over the coastal areas of YHR (right bottom in Figure 1) are investigated for the rainy season (April–September, AMJJAS) in 2017. The rainstorm events associated with typhoon are removed from the precipitation data using typhoon path data of the Joint Typhoon Warning Center (JTWC).
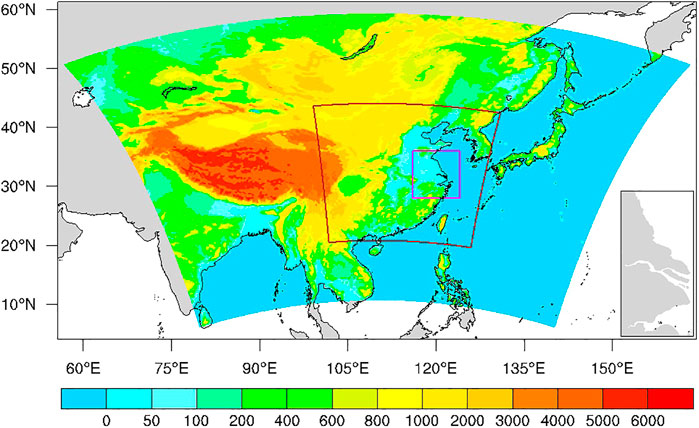
FIGURE 1. Domains in the PWAFS model and corresponding topography (m), with the 3 km nested domain marked by the inner brown box. The purple outline denotes the study area. The coastal areas of YHR are attached at the right bottom.
2.2 Model Description
The numerical forecast results are derived from the regional business forecast model Precision Weather Analysis and Forecasting System (PWAFS) of Jiangsu Meteorological Bureau, China. It is generally consisted of the WRF-ARW model version 3.5.1 and three-dimensional variational data assimilations including the Advanced Regional Prediction System (ARPS 3DVAR) and the Gridpoint Statistical Interpolation (GSI 3DVAR) localized for Jiangsu Province.
The system assimilates observations of the surface and upper air, multiple radar data, the Cross-track Infrared Sounder, and the Advanced Himawari Imager radiance as well as plenty of other sources (Li et al., 2016; Li X et al., 2019). The model physical schemes utilize the WRF Single-Moment 6-class Microphysics (Hong, 2006a), the Monin–Obukhov surface layer (Monin and Obukhov, 1954), the Noah land surface (Chen and Dudhia, 2001), the Yonsei University planetary boundary layer (Hong S. Y. et al., 2006), the rapid radiative transfer model longwave radiation (Mlawer et al., 1997), the Dudhia shortwave radiation (Dudhia, 1989), and the Kain–Fritsch cumulus parameterization (Kain and Fritsch, 1992; Kain, 2004).
The PWAFS model adopts the Lambert conformal conic projection, covering an area shown in Figure 1. In the beginning, the model is run using a 15 km resolution domain (480 × 360 grids) with 42 vertical levels up to 50 hPa. The analyses presented in the study, however, are produced with a 3 km resolution domain (840 × 840 grids) nested inside of the parent domain. The parent run is initialized four times per day and driven by the six-hourly National Center for Environmental Prediction Final (NCEP FNL) Operational Global Analysis data with a resolution of 1.0° × 1.0°, which provides the initial and boundary conditions for the three-hourly nested run with the final model output generated hourly.
2.3 Methods
Aiming at a more comprehensive evaluation of the PWAFS forecasts from different aspects, the threat score (TS) and the method for object-based diagnostic evaluation (MODE) are employed to assess the forecast performances of WRWS in the coastal areas of YHR.
The TS score is a primary operational forecast verification metric for business forecasts of precipitation. A strict point-to-point calculation is provided in Eq. (1):
where
Meantime, the MODE (Davis et al., 2006), a typical feature-based displacement approach for spatial diagnoses, is carried out to further evaluate more aspects of the precipitation forecasts. It allocates weight and confidence coefficients for predefined precipitation object attributes and calculates a total interest function based on a fuzzy logic approach, which quantifies the similarity between any two objects (Johnson and Wang, 2013). Four steps are involved in the MODE procedures, i.e., identifying objects, calculating object attributes, detecting matching objects between observations and predictions, and evaluating the similarity of the attributes, which are briefly introduced as follows and can be found in more detail in Ji et al. (2020).
(1) Identifying objects. To identify the spatial boundary of an object, the precipitation field is first smoothed with a convolution radius (two grid points in this study), which is associated with the precipitation scale. In addition, an intensity threshold (10 mm/6 h in this study) is used to define the boundaries of precipitation objects. The original precipitation field within these boundaries then determines the precipitation objects.
(2) Calculating object attributes. The overall location of a precipitating system, its size, and its shape are always concentrated during verifications of precipitation forecasts, especially when dealing with extreme weathers (Johnson and Wang 2013). Therefore, the specific attributes used in our study include the area coverage of precipitation objects, their aspect ratio and orientation angle, and their centroid location. For matched object pairs, attribute differences in the four object attributes can be calculated.
(3) Detecting matching objects. Object matching creates a pair consisting of one object in the forecasts and one object in the observations. Here, we follow Davis et al. (2006) and determine paired objects based on their centroid distance
with
(4) Evaluating attribute similarities. For a matched pair, the similarity of total interest is computed via Eq. (3):
where
3 Model Forecasts of the WRWS Over Coastal Areas of YHR
3.1 Objective Criteria of WRWS Over Coastal Areas of YHR
According to previous studies (Luo et al., 2016; Fu et al., 2020) and the definition of WSHR (Huang and Coauthors, 1986) and shear line (Ma and Yao, 2015), the determination criteria of WRWS used in this study are described as follows:
(1) The precipitation within 500 km of the typhoon center needs to be eliminated according to the JTWC typhoon path.
(2) The mesoscale rainstorm is defined as a continuous rainfall area (CRA): (a) where the average precipitation is larger than 5 mm/h with the peak being greater than 20 mm/h; and (b) whose long axis is larger than 100 km. Parameters such as the long axis and geometric center point of the CRA are determined through spatial attribute diagnosis.
(3) The front is defined by the sharp gradient of equivalent potential temperature at 850 hPa over (20°–40°N and 110°–130°; Fu et al., 2020) If a low-level front exists over (28°–40°N and 110°–130°E), the CRA must take place at 200 km away from the front; otherwise, the CRA must be dominated by the southerlies at low levels, and no surface northerlies exist within a 100 km distance from CRA (v < 0).
Accordingly, the precipitation satisfying the previously listed three criteria is defined as WSHR. Moreover, the following criterion (4) is necessary for a WRWS event:
(4) A shear line exists, and the shortest distance between the shear line and CRA of WSHR must be between the range of 100 and 300 km. The shear line over (28°–40°N and 110°–128°E) is defined by the meridional shear of zonal wind and relative vortex at 850 hPa: (a) ∂u/∂y<0; and (b) ζ>0. Also, all types of the wind direction shear for the warm shear line over YHR are considered during identification of the warm shear line, which are shown in Figure 2.

FIGURE 2. Schematic diagram of wind direction shear for the warm shear line over YHR.
According to the aforementioned criteria, 21 moments of WRWS are selected over coastal areas of YHR in the rainy season (April–September, AMJJAS) of 2017. The spatial distributions of accumulated precipitation and their associated atmospheric circulations during the moments of WRWS are shown in Figure 3. Red dots represent the center locations of CRA during the WRWS moments, which is generally located at the northwest boundary of the western Pacific subtropical high (WPSH, red contour in Figure 3B) and at the south side of the shear line (brown solid line in Figure 3B). Under these synoptic-scale atmospheric circulations, the coastal areas of YHR in the lower troposphere are mainly dominated by southwesterlies (arrows in Figure 3).
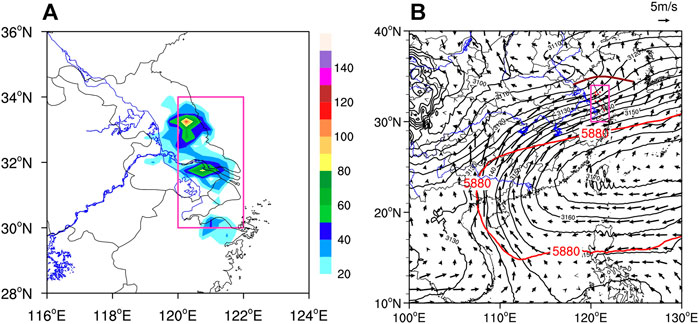
FIGURE 3. Spatial distributions of accumulated precipitation [mm, (A)] at WRWS occurrence moments and associated composites of synoptic-scale circulations (B). Red (black) solid lines are contours of geopotential height (gpm) at 500 hPa (700 hPa). Arrows represent horizontal wind at 850 hPa (m/s). Red dots represent the CRA centers of WRWS over coastal areas of YHR (pink box).
3.2 Model Forecast Evaluations
Considering the rainfall durations and intensities, 15 WRWS moments (Table 1) are selected in the four precipitation processes for forecast evaluations and diagnoses of the PWAFS model. The spatial distributions of accumulated precipitation during the four precipitation processes are displayed for the observations (the first column in Figure 4) and PWAFS forecasts (the second and third columns in Figure 4). Due to the three-hourly initialization of the model run, the short-term forecasts are separated as lead times of 1–3 h and 4–6 h, respectively, for a common evaluation on the hourly forecast results.
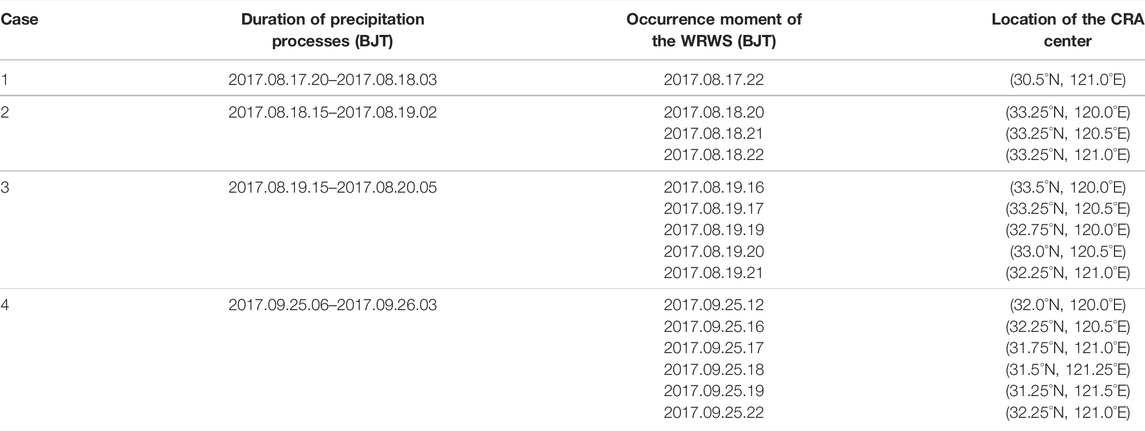
TABLE 1. Details of selected WRWS cases with durations of more than 6 h over coastal areas of YHR in 2017.
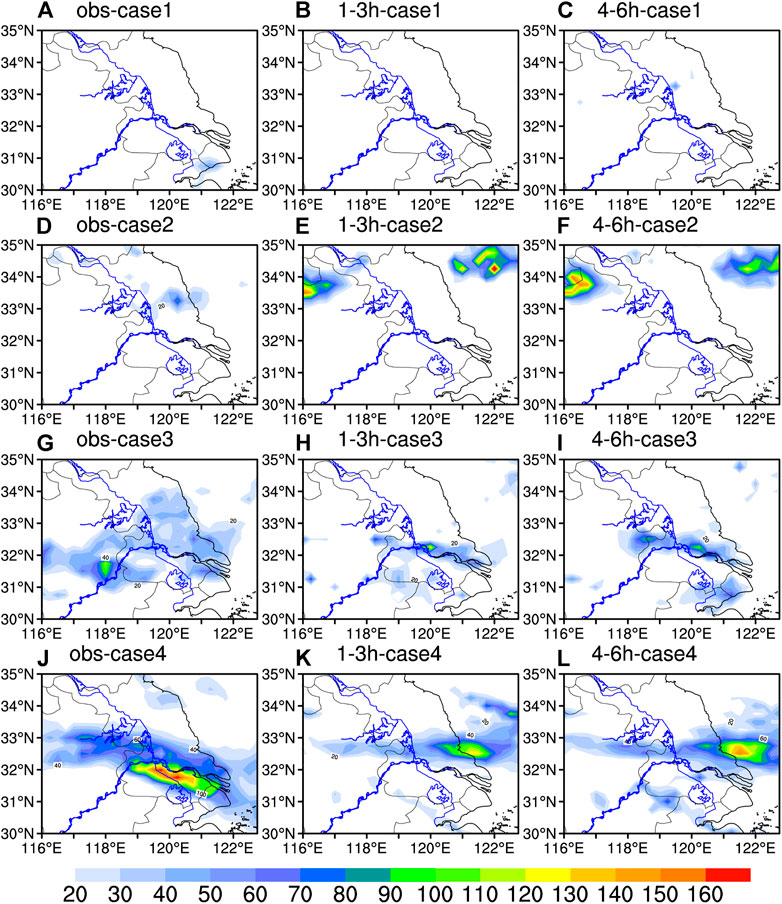
FIGURE 4. Spatial distributions of accumulated precipitation (mm) during WRWS cases in observations (A,D,G,J) and the PWAFS forecasts with different lead times: 1–3 h (B,E,H,K) and 4–6 h (C,F,I,L).
It is indicated that forecasts of the rain belt location and pattern do not show great differences between the two forecast lead time periods. However, for the intensity of the rain belt, forecasts of the 4–6 h lead times show higher skills for the WRWS events. Except for Case 1, the PWAFS model is generally capable of predicting the rain belt pattern but with the northeast shift in the forecasting location of the main rain belt. Furthermore, TS scores, which have strict requirements on the location and intensity forecasts of precipitation, are calculated in Table 2 for the 6 h accumulated precipitations with different intensities. During these four WRWS processes, the sunny-or-rainy accuracy (TS for 0.1 mm in Table 2) shows relatively good performance in the PWAFS forecasts. However, with the increasing precipitation thresholds, the TS decreases sharply.
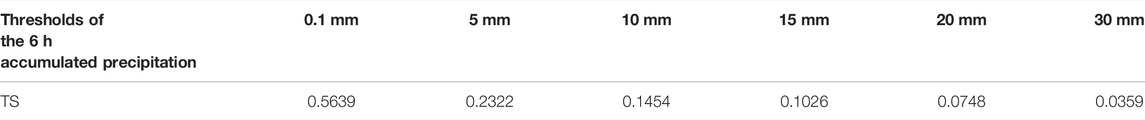
TABLE 2. Threat scores of accumulated precipitation forecasts in 6 h during four WRWS cases in 2017 over coastal areas of YHR (30°–35°N, 116°–122.75°E).
According to the point-to-point evaluations, the PWAFS model shows limited skills in strictly forecasting the WRWS-associated precipitation. On the other hand, it has good performances in forecasting the rainfall pattern of the rain belt with a similar location shift in Figure 4. Therefore, the MODE method is involved in this study to objectively assess the precipitation location, size, and shape of the four WRWS processes. The similarity of each WRWS process is obtained from the object attributes in Table 3 and (Table 4) with a threshold of 10 mm for the lead time of 1–3 h (4–6 h). In more detail, the similarity is calculated from the area ratio, centroid distance, intensity ratio, and orientation angle difference with weight 2:2:2:1. Among the four WRWS cases, Case 1 shows the worst forecast skill, representing the failure of the PWAFS model in the corresponding predictions of the process. The other three cases display generally higher similarities, with Case 3 characterized by the best performance for both lead times of 1–3 h and 4–6 h. Results are consistent to the spatial distribution features of precipitation (Figure 4). Therefore, both subjective and objective evaluations show that three of four WRWS events can be captured in the PWAFS forecasts, but the main rain belts generally shift to the northeast with weaker intensities of precipitation.
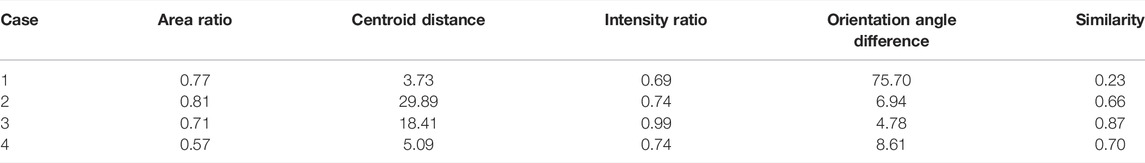
TABLE 3. Pair attributes of matched objects and the similarity from MODE for the 1–3 h lead time precipitation forecasts of four WRWS cases in 2017 over coastal areas of YHR.
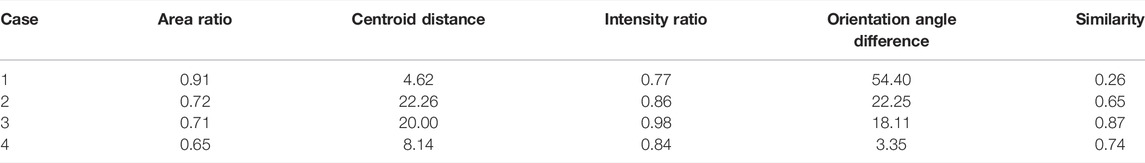
TABLE 4. Same as Table 3, but for the lead time of 4–6 h.
4 Diagnoses of the WRWS Forecasts in the Model
The location and pattern of the WRWS-associated rain belt can be reasonably predicted in the PWAFS model, but it shows significant shifting phases compared with the observations. Therefore, the composites of synoptic-scale circulation by 15 moments of WRWS are further accessed and diagnosed to reveal the possible mechanisms of the PWAFS biases.
Figure 5 shows the composites of synoptic-scale circulation at the WRWS occurring moment in the PWAFS results for 1–3 h and 4–6 h lead times. At the lower troposphere, the shear line (meridional shears of zonal wind) is observed over the northern part of Jiangsu Province and adjacent ocean region, which is located at the north side of the coastal areas of YHR. Under the background circulations, the coastal areas of YHR are controlled by the west-southwesterlies (arrows in Figure 5) and are dominated with zonal circulations in the PWAFS results. The differences of synoptic-scale circulation between PWAFS forecasts and observations are further checked in Figure 6. Comparing with observations, abnormal westerlies are observed in the study area, indicating that the PWAFS model overestimates the zonal wind in the lower troposphere. In addition, the northerly anomalies prevail over most of Jiangsu Province. Combined with the shear line location, it indicates weaker cyclonic anomalies of the shear line in the PWAFS forecasts. The different forecasting periods (Figures 6A, 7B) show the similar results. Therefore, only analyses of PWAFS forecasts with the 1–3 h lead time are illustrated in the following paragraphs to further discuss the rain belt anomalies and the associated physics.
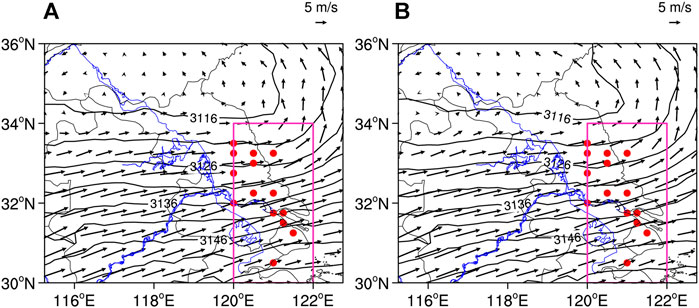
FIGURE 5. Composites of synoptic-scale circulations at WRWS occurrence moments in the PWAFS forecasts with different lead times: 1–3 h (A) and 4–6 h (B). Black contours are geopotential height (gpm) at 700 hPa. Arrows represent horizontal wind at 850 hPa (m/s). Red dots represent the CRA centers of WRWS over coastal areas of YHR (pink box).
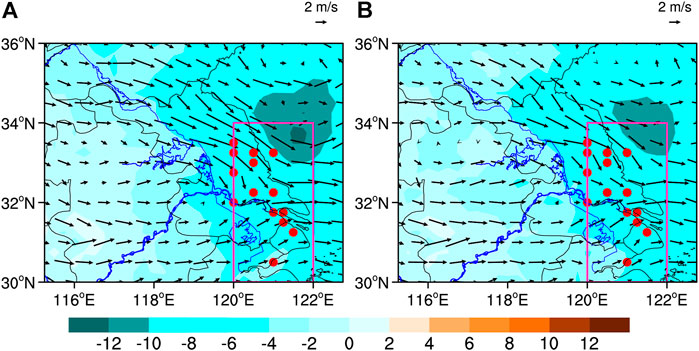
FIGURE 6. Composition differences of synoptic-scale circulations between the PWAFS forecasts and observations at WRWS occurrence moments with different lead times: 1–3 h (A) and 4–6 h (B). The shading areas are geopotential height (gpm) at 700 hPa. Arrows represent horizontal wind at 850 hPa (m/s). Red dots represent the CRA centers of WRWS over coastal areas of YHR (pink box).
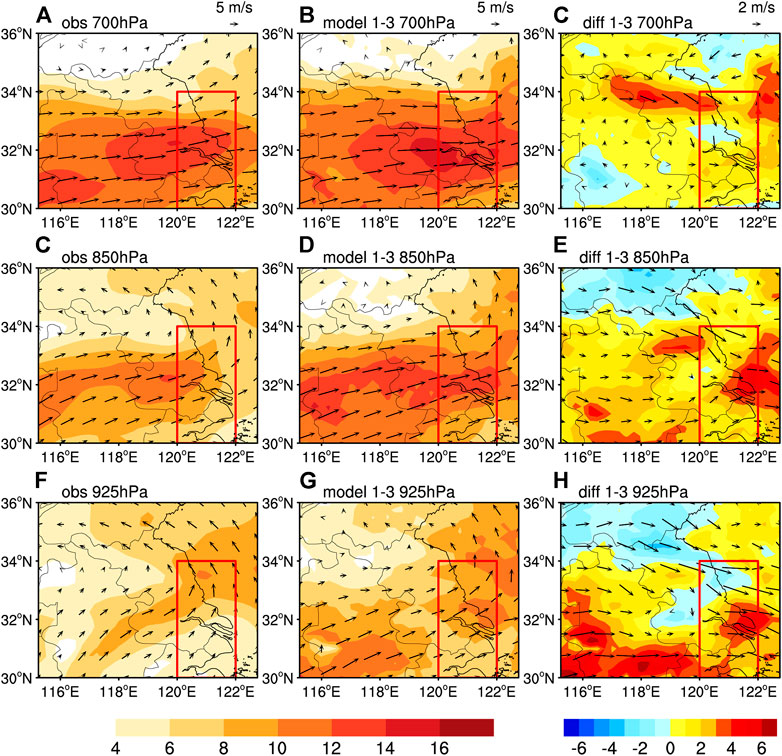
FIGURE 7. Composites of wind fields (arrow, m/s) during WRWS occurrence moments in observations (A,D,G) and the PWAFS forecasts (B,E,H), as well as their differences (C,F,I), at 700 hPa (A,B,C), 850 hPa (D,E,F), and 925 hPa (G,H,I). The shading represents the full wind velocity (m/s).
The composites of horizontal wind in the model forecasts and observations in the lower troposphere are shown in , as well as their differences are shown in Figure 7. From 925 hPa to 700hPa, the horizontal wind fields change from southwesterlies to westerlies, which turns clockwise with height, indicating the prevailing warm advection over coastal areas of YHR. Abnormal north westerlies turn to northerlies from the boundary layer to the lower levels of the troposphere, suggesting the well-predicted abnormal warm advection in the PWAFS model. In addition, comparing with the observations, zonal wind fields are stronger in the PWAFS short-term forecasts, especially at the boundary layer (Figure 7I). The zonal wind shear shows that the shear lines in PWAFS are located more northeasterly than in the observations. The transformation from southwesterlies to southeasterlies can be observed at 925 hPa in observations over coastal areas of YHR, but these wind direction changes can hardly be captured in the PWAFS predictions, which leads to their differences of moisture transportations (Figures 9C, 10E) at the boundary layer. Therefore, the conditions of moisture are subsequently analyzed.
The meridional-height section of longitude averages of water vapor flux along (31°N–33°N) during WRWS occurrence moments in observations and the PWAFS forecasts is shown in Figure 8. The vertical distributions of moisture flux shows that the abundant moisture is mainly concentrated at the lower troposphere in the mainland, while over coastal areas of YHR, the maximum moisture is centered at the boundary layer. Observations and the PWAFS short-term predictions show similar vertical distributions of the water vapor, but the intensity of moisture flux is stronger in the PWAFS model. Considering the vertical characteristics, the moisture flux with vertical integration from 1000 hPa to 925 hPa and integration from 925 hPa to 700 hPa is checked, respectively. At the boundary layer (Figure 9C), the water vapor transports from the south of China and the East China Sea through southerlies and southeasterlies to coastal areas of YHR and converges in the northern part of coastal areas of YHR in the observations. Results of the integration from 925 hPa to 700 hPa (Figure 9A) show that the water vapor transports from southwest to coastal areas of YHR and diverges in the northern part at 700 hPa. The sources of moisture for WRWS have differences at different levels, but this feature is not captured in the short-term predictions of PWAFS. From 1000 hPa to 700 hPa, the moisture is transported by the consistent southwesterlies in coastal areas of YHR in the PWAFS results (Figures 9B,D). The convergence and divergence regions are further shifted to the northeast, which corresponds to the shift locations of the shear line and rain belt.
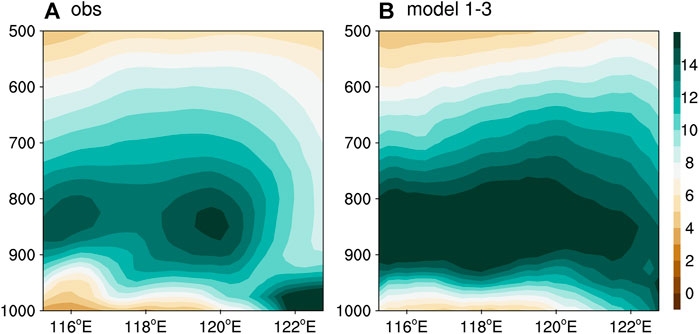
FIGURE 8. Composites of the meridional-height section of longitude mean of water vapor flux
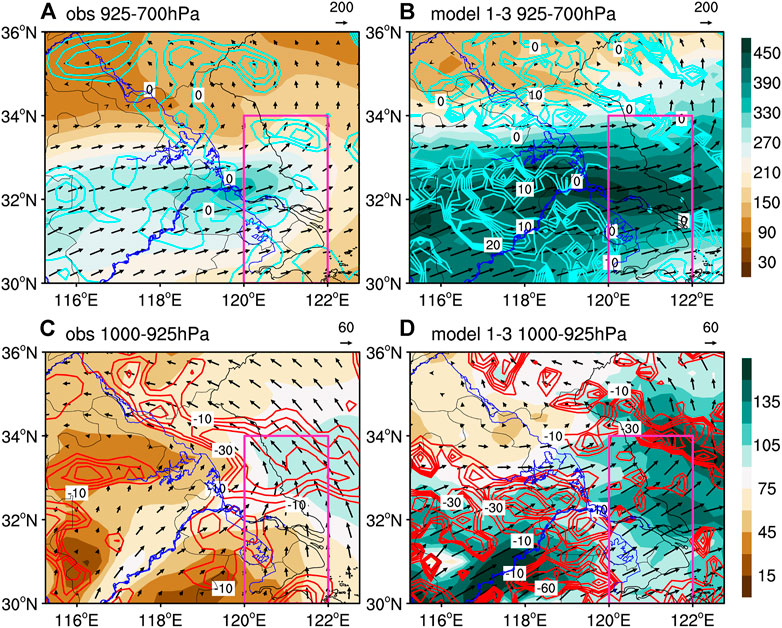
FIGURE 9. Composites of the vertical integrated water vapor flux
In addition, the composition differences of pseudo-equivalent potential temperature are studied in Figure 10. Although the PWAFS model tends to generate stronger warm advection and moisture transport, the accumulated warm and moist energy are predicted weaker at the boundary layer over coastal areas of YHR (Figures 10H,I), which leads to the underestimations of the precipitation intensity in the PWAFS results. The accurate prediction of warm and moist energy transportation from the East China Sea by southeasterlies along the coastal areas of YHR at the boundary layer is revealed fairly important for the WRWS event forecasts in the model.
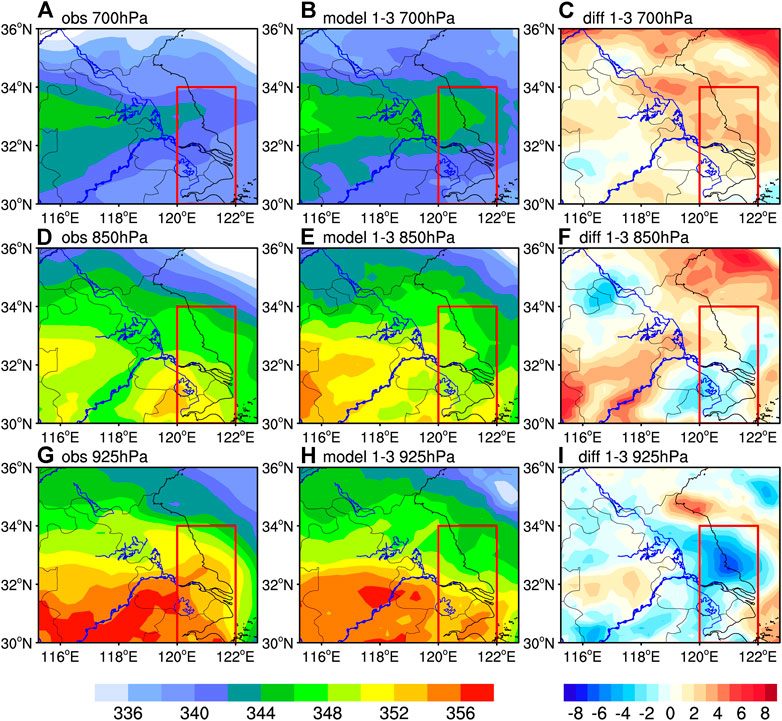
FIGURE 10. Composites of pseudo-equivalent potential temperature
In summary, for the short-term prediction of WRWS events in coastal areas of YHR in the regional business forecast model PWAFS, the horizontal winds are overestimated in the lower troposphere, especially for zonal westerlies. Meantime, the shear line shifts to the northeast, inducing that the moisture channel associated with the East China Sea is absent at the boundary layer, and the accumulated warm and moist energy is weaker over coastal areas of YHR. Finally, the short-term model prediction of the rain belt location for WRWS in coastal areas of YHR notably shifts to the northeast with weaker intensities of precipitation.
5 Conclusion and Discussion
Based on the short-term prediction results of the regional business forecast model Precision Weather Analysis and Forecasting System (PWAFS) of Jiangsu Meteorological Bureau, China, forecasts of the warm-sector heavy rainfall with warm-type shear line (WRWS) events in coastal areas of the Yangtze–Huaihe River (YHR) are evaluated and diagnosed via objective estimation methods and composition analysis. The observational hourly precipitation data of CMORPH and the ERA5 reanalysis datasets from ECMWF are employed as references to check the forecast skills of precipitation and associated atmospheric circulations in the model results. The obtained results are summarized as follows:
According to the objective identifications of WRWS events and the rainfall durations, 15 moments of WRWS in four precipitation processes are selected for investigations of the PWAFS forecasts. Both subjective and objective evaluations show that three of four WRWS events can be captured in the PWAFS forecasts, but the main rain belts generally shift to the northeast with weaker intensities of precipitation. The PWAFS model has considerable skills for short-term forecasts of WRWS events in coastal areas of YHR, but the prediction performances decrease sharply with the increasing precipitation thresholds.
Moreover, the differences of synoptic-scale thermodynamic characteristics are diagnosed to reveal the possible mechanisms of the short-term model forecast biases via analyzing the composition differences between the observations and the PWAFS forecasts during WRWS moments. For short-term forecasts of WRWS events in coastal areas of YHR, the zonal moisture transportation is stronger in the model due to the overestimation of westerlies, while the meridional moisture transportation is weaker due to the underestimation of southerlies along coastal areas of YHR. Meantime, the shear line is characterized by a notably northeast shifted phase. The aforementioned biases of horizontal wind fields in the model induce that the moisture channel associated with the East China Sea is absent and the accumulated warm and moist energy is weaker at the boundary layer in coastal areas of YHR. As a result, the short-term prediction of the rain belt location for WRWS in coastal areas of YHR notably shifts to the northeast with weaker intensities of precipitation in the model results.
Understanding the prediction attributes of WRWS events in coastal areas of YHR is crucial for investigations of local meteorological characteristics and would help the forecast agencies to improve the model applications more sufficiently. Furthermore, the rainfall biases can be effectively eliminated by the advanced statistical model. For instance, object attributes in MODE describe the location and pattern of the rain belt, which could be applied for further development of advanced statistical model constructions to improve the prediction performances of WRWS events in the forecast models (Ji et al., 2020; Lyu et al., 2021; and Zhu et al., 2021). The associated concerns are to be further studied in the future.
In addition, the cloud microphysics parameterization scheme plays an important role in the precipitation simulation. A cloud (Hong S. Y. et al., 2006; Morrison et al., 2009; and Luo et al., 2017) physical process is one of the most important non-adiabatic heating physical processes in mesoscale numerical models. The mutual transformation between water vapor and various hydrometeors in clouds, as well as their dynamic and thermodynamic effects, directly affects the weather processes. Then, the large-scale circulations would be reacted through sensible heat, latent heat, and momentum transport, leading to the vertical distribution changes of temperature and humidity. There are obvious differences in the simulation of the temperature and humidity structure of the atmosphere by different microphysical parameterization schemes. Therefore, selecting microphysical parameterization schemes suitable for the local area through a series of experiments, or using multi-parameterization schemes ensemble forecasting, is conducive to improving the forecast skills of convective precipitation in the model.
Data Availability Statement
The analyzed ECMWF ERA5 reanalysis dataset for this study can be found in the Copernicus Climate Data Store at https://cds.climate.copernicus.eu.
Author Contributions
LZ, SZ, GZ, and XZ contributed to the conception and design of the study. LS performed the analyses. LS, HW, and LZ organized the database. CC was involved in the scientific interpretation and discussion. All authors contributed to manuscript revision and read and approved the submitted version.
Funding
The study was jointly supported by the National Key R&D Program of China (Grant No. 2017YFC1502002), the Research Project of Jiangsu Meteorological Bureau (Grant No. KQ202209) and the Basic Research Fund of CAMS (Grant No. 2022Y027).
Conflict of Interest
The authors declare that the research was conducted in the absence of any commercial or financial relationships that could be construed as a potential conflict of interest.
Publisher’s Note
All claims expressed in this article are solely those of the authors and do not necessarily represent those of their affiliated organizations, or those of the publisher, the editors, and the reviewers. Any product that may be evaluated in this article, or claim that may be made by its manufacturer, is not guaranteed or endorsed by the publisher.
Acknowledgments
The authors are grateful to the Jiangsu Meteorological Bureau, China Meteorological Administration, China, and European Center for Medium-Range Weather Forecasts for their datasets.
References
Chang, C.-P., Hou, S. C., Kuo, H. C., and Chen, G. T. J. (1998). The Development of an Intense East Asian Summer Monsoon Disturbance with Strong Vertical Coupling. Mon. Wea. Rev. 126 (10), 2692–2712. doi:10.1175/1520-0493(1998)126<2692:TDOAIE>2.0.CO;2
Chen, F., and Dudhia, J. (2001). Coupling an Advanced Land Surface-Hydrology Model with the Penn State-NCAR MM5 Modeling System. Part I: Model Implementation and Sensitivity. Mon. Wea. Rev. 129 (4), 569–585. doi:10.1175/1520-0493(2001)129<0569:CAALSH>2.0.CO;2
Chen, G., Lan, R., Zeng, W., Pan, H., and Li, W. (2018). Diurnal Variations of Rainfall in Surface and Satellite Observations at the Monsoon Coast (South China). J. Clim. 31 (5), 1703–1724. doi:10.1175/JCLI-D-17-0373.1
Chen, Y., Chen, T., Wang, L. Y., Li, S. Q., and Xu, J. (2019). A Review of the Warm-Sector Rainstorms in China (In Chinese). Torrential Rain Disasters 38 (5), 483–493. doi:10.3969/j.issn.1004-9045.2019.05.010
Davis, C., Brown, B., and Bullock, R. (2006). Object-based Verification of Precipitation Forecasts. Part I: Methodology and Application to Mesoscale Rain Areas. Mon. Wea. Rev. 134, 1772–1784. doi:10.1175/MWR3145.1
Ding, Y. H., Li, C. Y., and Liu, Y. J. (2004). Overview of the South China Sea Monsoon Experiment. Adv. Atmos. Sci. 21, 343–360.
Du, Y., and Chen, G. (2018). Heavy Rainfall Associated with Double Low-Level Jets over Southern China. Part I: Ensemble-Based Analysis. Mon. Wea. Rev. 146 (11), 3827–3844. doi:10.1175/MWR-D-18-0101.1
Du, Y., Chen, Y.-L., and Zhang, Q. (2015). Numerical Simulations of the Boundary Layer Jet off the Southeastern Coast of China. Mon. Wea. Rev. 143 (4), 1212–1231. doi:10.1175/MWR-D-14-00348.1
Dudhia, J. (1989). Numerical Study of Convection Observed during the Winter Monsoon Experiment Using a Mesoscale Two-Dimensional Model. J. Atmos. Sci. 46 (20), 3077–3107. doi:10.1175/1520-0469(1989)046<3077:NSOCOD>2.0.CO;2
Fu, J., Zhang, F., and Hewson, T. D. (2020). Object-Oriented Composite Analysis of Warm-Sector Rainfall in North China. Mon. Wea. Rev. 148 (7), 2719–2735. doi:10.1175/MWR-D-19-0038.1
Guan, P., Chen, G., Zeng, W., and Liu, Q. (2020). Corridors of Mei-Yu-Season Rainfall over Eastern China. J. Clim. 33 (7), 2603–2626. doi:10.1175/JCLI-D-19-0649.1
Hong, S.-Y., Noh, Y., and Dudhia, J. (2006a). A New Vertical Diffusion Package with an Explicit Treatment of Entrainment Processes. Mon. Wea. Rev. 134 (9), 2318–2341. doi:10.1175/MWR3199.1
Hong, S. Y., Lim, K. S., Kim, J. H., Lim, J. O. J., and Dudhia, J. (2006b). The WRF Single-Moment 6-class Microphysics Scheme (WSM6). J. Korean Meteor. Soc. 42, 129–151.
Huang, L., and Meng, Z. (2014). Quality of the Target Area for Metrics with Different Nonlinearities in a Mesoscale Convective System. Mon. Wea. Rev. 142 (7), 2379–2397. doi:10.1175/MWR-D-13-00244.1
Huang, S., and Coauthors, S. (1986). Heavy Rainfall over Southern China in the Pre-Summer Rainy Season (In Chinese). Guangzhou: Guangdong Science and Technology Press, 212–244.
Ji, L., Zhi, X., Simmer, C., Zhu, S., and Ji, Y. (2020). Multimodel Ensemble Forecasts of Precipitation Based on an Object-Based Diagnostic Evaluation. Mon. Wea. Rev. 148 (6), 2591–2606. doi:10.1175/MWR-D-19-0266.1
Johnson, A., and Wang, X. (2013). Object-based Evaluation of a Storm-Scale Ensemble during the 2009 NOAA Hazardous Weather Testbed Spring Experiment. Mon. Wea. Rev. 141, 1079–1098. doi:10.1175/MWR-D-12-00140.1
Kain, J. S., and Fritsch, J. M. (1992). The Role of the Convective ?trigger Function? in Numerical Forecasts of Mesoscale Convective Systems. Meteorl. Atmos. Phys. 49 (1-4), 93–106. doi:10.1007/BF01025402
Kain, J. S. (2004). The Kain-Fritsch Convective Parameterization: An Update. J. Appl. Meteor. 43 (1), 170–181. doi:10.1175/1520-0450(2004)043<0170:TKCPAU>2.0.CO;2
Li, H., He, S., Fan, K., and Wang, H. (2019). Relationship between the Onset Date of the Meiyu and the South Asian Anticyclone in April and the Related Mechanisms. Clim. Dyn. 52 (1-2), 209–226. doi:10.1007/s00382-018-4131-5
Li, X., Zou, X., and Zeng, M. (2019). An Alternative Bias Correction Scheme for CrIS Data Assimilation in a Regional Model. Mon. Wea. Rev. 147 (3), 809–839. doi:10.1175/MWR-D-18-0044.1
Li, X., Zeng, M., Wang, Y., Wang, W., Wu, H., and Mei, H. (2016). Evaluation of Two Momentum Control Variable Schemes and Their Impact on the Variational Assimilation of Radarwind Data: Case Study of a Squall Line. Adv. Atmos. Sci. 33 (10), 1143–1157. doi:10.1007/s00376-016-5255-3
Luo, Y., Wu, M., Ren, F., Li, J., and Wong, W.-K. (2016). Synoptic Situations of Extreme Hourly Precipitation over China. J. Clim. 29 (24), 8703–8719. doi:10.1175/JCLI-D-16-0057.1
Lyu, W. Q., Chen, Y., Li, S. Q., and Xiao, T. G. (2017). Mesoscale Analysis on a Warm Sector Torrential Rain Event in Huang-Huai Area (In Chinese). J. Chengdu Univ. Inf. Technol. 32 (4), 391–401. doi:10.16836/j.cnki.jcuit.2017.04.009
Lyu, Y., Zhi, X., Zhu, S., Fan, Y., and Pan, M. (2021). Statistical Calibrations of Surface Air Temperature Forecasts over East Asia Using Pattern Projection Methods. Wea. Forecast. 36, 1661–1674. doi:10.1175/WAF-D-21-0043.1
Ma, J. L., and Yao, X. P. (2015). Statistical Analysis of the Shear Lines and Torrential Rains over the Yangtze-Huaihe River Region during June-July in 1981-2013(in Chinese). Acta Meteorol. Sin. 73 (5), 883–894. doi:10.11676/qxxb2015.065
Mlawer, E. J., Taubman, S. J., Brown, P. D., Iacono, M. J., and Clough, S. A. (1997). Radiative Transfer for Inhomogeneous Atmospheres: RRTM, a Validated Correlated-K Model for the Longwave. J. Geophys. Res. 102 (D14), 16663–16682. doi:10.1029/97JD00237
Monin, A. S., and Obukhov, A. M. (1954). Basic Laws of Turbulent Mixing in the Surface Layer of the Atmosphere. Tr. Akad. Nauk. SSSR Geophiz. Inst. 24 (151), 163–187.
Morrison, H., Thompson, G., and Tatarskii, V. (2009). Impact of Cloud Microphysics on the Development of Trailing Stratiform Precipitation in a Simulated Squall Line: Comparison of One- and Two-Moment Schemes. Mon. Wea. Rev. 137 (3), 991–1007. doi:10.1175/2008mwr2556.1
Ni, Y. Q., and Zhou, X. J. (2006). Study on Formation Mechanisms of Heavy Rainfall Within the Meiyu along the Mid-Lower Yangtze River and Theories and Methods of Their Detection and Prediction. Acta Meteorol. Sin., 20 (2), 191–208.
Ninomiya, K., and Akiyama, T. (1992). Multi-scale Features of Baiu, the Summer Monsoon over Japan and the East Asia. J. Meteorological Soc. Jpn. 70, 467–495. doi:10.2151/jmsj1965.70.1b_467
Shen, Y., Zhao, P., and Pan, Y. (2014). A High Spatiotemporal Gauge-Satellite Merged Precipitation Analysis Over China. J. Geophys. Res. Atmos. 119 (6), 3063–3075. doi:10.1002/2013JD020686
Shi, W. R., Li, X., Zeng, M. J., Zhang, B., Wang, H. B., Zhu, K. F., et al. (2021). Multi-model Comparison and High-Resolution Regional Model Forecast Analysis for the “7·20” Zhengzhou Severe Heavy Rain (In Chinese). Trans. Atmos. Sci. 44 (5), 688–702. doi:10.13878/j.cnki.dqkxxb.20210823001
Skamarock, W. C., Klemp, J. B., Dudhia, J., Gill, D. O., Barker, D. M., Duda, M. G., et al. (2008). A Description of the Advanced Research WRF Version 3. NCAR Tech. Note NCAR/TN-475+STR. Colorado, United States: University Corporation for Atmospheric Research, 113. doi:10.5065/D68S4MVH
Tao, S.-y., and Ding, Y.-h. (1981). Observational Evidence of the Influence of the Qinghai-Xizang (Tibet) Plateau on the Occurrence of Heavy Rain and Severe Convective Storms in China. Bull. Amer. Meteor. Soc. 62 (1), 23–30. doi:10.1175/1520-0477(1981)062<0023:OEOTIO>2.0.CO;2
Tao, S. Y., and Chen, L. X. (1987). “A Review of Recent Research on the East Asian Summer Monsoon in China,” in Monsoon Meteorology. Editors C. P. Chang, and T. N. Krishnamurti (New York: OU Press), 60–92.
Wan, Q., Wang, B., Wong, W. K., Hu, Z., Jou, B. J.-D., Lin, Y., et al. (2017). The Southern China Monsoon Rainfall Experiment (SCMREX). Bull. Am. Meteorol. Soc. 98 (5), 999–1013. doi:10.1175/BAMS-D-15-00235.1
Wang, X., Dong, X., Deng, Y., Cui, C., Wan, R., and Cui, W. (2019). Contrasting Pre-mei-Yu and Mei-Yu Extreme Precipitation in the Yangtze River Valley: Influencing Systems and Precipitation Mechanisms. J. Hydrometeorol. 20 (9), 1961–1980. doi:10.1175/JHM-D-18-0240.1
Wang, X. F., Xu, X. L., Xu, T., Yang, Y. H., and Zhang, Y. C. (2017). Verification of the Extreme Precipitation Forecast from SMS-WARMSV2.0 (In Chinese). Adv. Meteorol. 7 (6), 67–74. doi:10.3969/j.issn.2095-1973.2017.06.008
Wu, M., and Luo, Y. (2016). Mesoscale Observational Analysis of Lifting Mechanism of a Warm-Sector Convective System Producing the Maximal Daily Precipitation in China Mainland during Pre-summer Rainy Season of 2015. J. Meteorol. Res. 30 (5), 719–736. doi:10.1007/s13351-016-6089-8
Xie, S.-P., Xu, H., Saji, N. H., Wang, Y., and Liu, W. T. (2006). Role of Narrow Mountains in Large-Scale Organization of Asian Monsoon Convection*. J. Clim. 19 (14), 3420–3429. doi:10.1175/JCLI3777.1
Ding., Y., and Chan, J. C. L. (2005). The East Asian Summer Monsoon: an Overview. Meteorol. Atmos. Phys. 89 (1-4), 117–142. doi:10.1007/s00703-005-0125-z
Yao, X., Ma, J., Zhang, D.-L., and Yan, L. (2020). A 33-yr Mei-Yu-Season Climatology of Shear Lines over the Yangtze-Huai River Basin in Eastern China. J. Appl. Meteorol. Climatol. 59 (6), 1125–1137. doi:10.1175/JAMC-D-19-0229.1
Zhao, S., Bei, N., and Sun, J. (2007). Mesoscale Analysis of a Heavy Rainfall Event over Hong Kong during a Pre-rainy Season in South China. Adv. Atmos. Sci. 24 (4), 555–572. doi:10.1007/s00376-007-0555-2
Zhong, R., Zhong, L. H., Hua, L. J., and Feng, S. D. (2014). A Climatology of the Southwest Vortex during 1979-2008. Atmos. Ocean. Sci. Lett. 7 (6), 577–583. doi:10.3878/AOSL20140042
Keywords: warm-sector heavy rainfall, warm shear pattern, forecast evaluation, model diagnosis, coastal areas of Yangtze–Huaihe River
Citation: Zhang L, Song L, Zhu S, Guo Z, Wang H, Zhou L, Chen C and Zhi X (2022) Forecasts of the Warm-Sector Heavy Rainfall With a Warm Shear Pattern Over Coastal Areas of the Yangtze–Huaihe River in a Regional Business Forecast Model. Front. Earth Sci. 10:938336. doi: 10.3389/feart.2022.938336
Received: 07 May 2022; Accepted: 20 June 2022;
Published: 22 July 2022.
Edited by:
Jingyu Wang, Nanyang Technological University, SingaporeReviewed by:
Yangruixue Chen, Chengdu University of Information and Technology, ChinaZhuoqi He, South China Sea Institute of Oceanology (CAS), China
Copyright © 2022 Zhang, Song, Zhu, Guo, Wang, Zhou, Chen and Zhi. This is an open-access article distributed under the terms of the Creative Commons Attribution License (CC BY). The use, distribution or reproduction in other forums is permitted, provided the original author(s) and the copyright owner(s) are credited and that the original publication in this journal is cited, in accordance with accepted academic practice. No use, distribution or reproduction is permitted which does not comply with these terms.
*Correspondence: Shoupeng Zhu, enNwc2hvdXBlbmdAMTYzLmNvbQ==; Zhun Guo, Z3Vvemh1bkBtYWlsLmlhcC5hYy5jbg==