 Jing Xiao1*
 Åsa K. Rennermalm1
 Federico Covi2
 Regine Hock2,3
 Sasha Z. Leidman1
 Clément Miège1
 Michael J. MacFerrin4
 Samira Samimi5
- 1Department of Geography, Rutgers, The State University of New Jersey, New Brunswick, NJ, United States
- 2Geophysical Institute, University of Alaska Fairbanks, Fairbanks, AK, United States
- 3Department of Geoscience, University of Oslo, Oslo, Norway
- 4Cooperative Institute for Research in Environmental Sciences, University of Colorado Boulder, Boulder, CO, United States
- 5Department of Geography, University of Calgary, Calgary, AB, Canada
The increasing mass loss from the Greenland ice sheet is becoming growingly important to present-day global sea level rise. Meltwater export to the ocean may be amplified by near-surface ice layers in firn (i.e., snow that has survived at least one melt season) which prevent infiltration. Such ice layers have been documented at various sites in southwest Greenland, but little is known about the local-scale (less than 1 km) variability in firn and ice properties. Here we investigate the local variability in firn density and ice content (ice layer thickness fraction) by analyzing 45 shallow firn cores retrieved from 15 sites in southwest Greenland between 2012 and 2019. The core dataset contains groups of cores that were collected at the same site (1–632 m apart from each other) and in the same year (here referred to as same site/year cores). The two-sided Mann-Whitney U-tests suggest that most same site/year cores do not have statistically significant differences in median density or ice content over the upper 0–4.5, 4.5–9, and 9–13.5 m sections below the winter snow layer. That said, the same site/year cores still exhibit substantial density and ice content differences as well as variable ice layer stratigraphy (especially the distribution of centimeters-thick ice lenses) not explainable by measurement uncertainties. The local-scale variability in density and ice content (calculated from the same site/year cores) over the three 4.5-m sections is 4% and 19–29%, respectively. The variability is comparable to the regional gradient in our study area within an elevation difference of up to ∼200 m. The local variability is non-negligible particularly at mid- to high-elevation sites (>2,000 m a.s.l.), where firn structure changes such as ice layer formation are more recent phenomena compared to lower elevations. This study confirms that single cores can provide representative bulk statistics such as mean density and ice content of one site. However, these mean values mask substantial local variability which can compromise regional comparisons. Therefore, collection of same site/year cores and consideration of local variability are necessary for an in-depth analysis of regional variability.
1 Introduction
The Greenland ice sheet has experienced negative annual mass balances since the 1980s (Mouginot et al., 2019). Since the early 2000s, the mass loss rate increased substantially, reaching 286 ± 20 Gt yr−1 during 2010–2018 (Mouginot et al., 2019). Before 2006, the majority of the mass loss happened via dynamic losses (e.g., frontal ablation; Price et al., 2011). However, since the late 2010s, surface mass balance processes have gradually taken a more important role and contributed more than half of the total ablation (Mouginot et al., 2019; Shepherd et al., 2020). Surface meltwater either escapes to the ocean in the form of runoff, or infiltrates into the porous firn (i.e., snow that survived one or more melting seasons) where it then refreezes or is stored in firn aquifers (Forster et al., 2014; van den Broeke et al., 2016). Refreezing plays a particularly important role in the percolation zone (i.e., the part of the ice sheet where surface water percolates into the subsurface; Benson, 1962; Cogley et al., 2011), potentially acting as a buffer against net mass loss (Harper et al., 2012). However, after a succession of extreme melt seasons (e.g., 2010, 2012, 2016), the near-surface firn structure changed significantly, reducing the firn’s storage capacity for future refreezing (e.g., Machguth et al., 2016; MacFerrin et al., 2019; Miller et al., 2022). Understanding meltwater refreezing processes in firn is therefore of critical importance for better predicting the Greenland ice sheet’s future mass loss and its influence on global sea-level rise.
Previous firn core studies revealed an increase in firn density and firn ice content since the 1950s (de la Peña et al., 2015; Vandecrux et al., 2019). Researchers found increasing ice layer mass in near-surface firn (top 5–10 m) in the percolation zone after recent melt events such as in 2012 and 2016 (Machguth et al., 2016; MacFerrin et al., 2019). Firn ice content may also decrease after several consecutive years of low surface melting (Rennermalm et al., 2021a). A study from MacFerrin et al. (2019) suggested that meters-thick, low-permeability ‘ice slabs’ had the potential to block infiltration and increase runoff, contributing decimeters to global sea-level rise by 2100. The spatial pattern of ice layers in firn is primarily shaped by snow accumulation and surface melting, often resulting in a strong elevation trend (Machguth et al., 2016; Rennermalm et al., 2021a). However, these conclusions about spatial and temporal trends of firn properties were mostly drawn from studies using only one core sample from each study site. A rigorous understanding of the local-scale variability in firn properties is necessary to investigate whether one core can represent the conditions of a site.
Previous research examined the local variability (m- to km-scales) in snow and firn properties such as snow depth, snow and firn density, and layering in Greenland and nearby regions (e.g., Parry et al., 2007; Dunse et al., 2008; Brown et al., 2011; Marchenko et al., 2017; Heilig et al., 2020). For example, Parry et al. (2007) measured snow and firn densities in the percolation zone in west Greenland and found highly variable snowpack stratigraphy over short temporal-spatial scales. Dunse et al. (2008) compared ground penetrating radar data with snow pits and cores in the same area. They concluded that over the hundreds-of-meters-scale, the point measurements of snow accumulation were representative; yet over the km-scale, there was a local trend in accumulation which was stronger than the regional gradient and was likely affected by local topographic undulations. Brown et al. (2011) conducted ground penetrating radar grid surveys and collected firn cores at two sites in west Greenland. Their results showed that a single core was likely representative of the nearby area over km-scale at the low-elevation site (between percolation facies and soaked facies). In contrast, their study also suggested that at the high-elevation site (near the top of the percolation zone), a single core was not representative and lateral heterogeneity in stratigraphy existed over m-scale. Marchenko et al. (2017) analyzed the plot-scale variability in firn properties in Svalbard using three cores which were retrieved within 50 m apart in three consecutive years, together with other measurements such as ground penetrating radar data and firn temperatures. Their study suggested high variability in firn stratigraphy (depth and thickness of ice layers) and recommended multiple cores to be collected at the same location for a more reliable density profile and layer stratigraphy. In summary, previous studies revealed both local homogeneity and variability in snow and firn properties. However, only limited sites have been examined and more core samples can help us better answer the question: how representative a point measurement (e.g., a single core) is over different scales and at different locations? Little is known about the local variability in firn properties (e.g., density and ice content) as well as the extent to which the local variability may exceed regional spatial patterns.
In this study, we examined the local-scale (less than 1 km) spatial variability in firn density and ice content using 45 cores retrieved from 15 sites in southwest Greenland between 2012 and 2019. Our study builds upon Rennermalm et al. (2021a), which used similar cores to investigate the temporal evolution and regional trend of core density and ice layer thickness. Here, we extend their work and focus on the local-scale variability by comparing cores that were collected at the same site and in the same year. We first quantified the local-scale variability as the average difference in firn properties between the same site/year cores, and examined if the local variability is dependent on factors such as depth, elevation, and time (year). Then, we used the two-sided Mann-Whitney U-test to establish if the firn properties of these same site/year cores are statistically similar or not. Finally, we compared the local variability with the regional patterns and estimated at what elevation difference two core samples may have overlapping firn properties and at what elevation difference they become significantly different.
2 Data and methods
2.1 Firn cores
We used a total of 45 firn cores from 15 sites up to 128 km apart in horizontal distance and 510 m apart in elevation in the percolation zone in southwest Greenland (see the study area map in Figure 1, the list of all cores in Supplementary Table S1, and positive degree-day (PDD) sums and snow depths of this area in Figure 2; Supplementary Figure S1). The core and snow depth data are available at the NSF Arctic Data Center (https://arcticdata.io). In addition to the snow depths recorded from snow probe measurements or snow pits when the 45 cores were retrieved, we added three additional snow depth observations at KAN_U in 2018 and 2019, and EKT in 2019 when snow pits were dug for shorter-than-5-m cores (KAN_U) or for weather station (EKT) maintenance unrelated to this study. The snow depths were 0.93, 0.56, and 0.8 m, respectively. The PDD sum data were calculated from near-surface temperatures obtained from published automatic weather station datasets (KAN_U PROMICE AWS v03 station: Fausto et al., 2021, 2022; Dye-2 GC-net station: Steffen et al., 1996, Steffen and Box, 2001; EKT FirnCover station: MacFerrin et al., 2021, 2022).
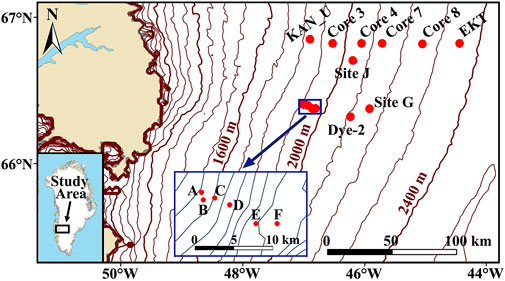
FIGURE 1. Study area map and location of the sites. Elevation contours (m a.s.l.) were estimated based on the ArcticDEM 1 km v3.0 data by Polar Geospatial Center (Porter et al., 2018) adjusted with the EGM2008 geoid offset (Pavlis et al., 2012). The contour intervals are 100 m in the main map and 10 m in the inset map showing Sites A to F. All sites are in the percolation zone (Vandecrux et al., 2019).
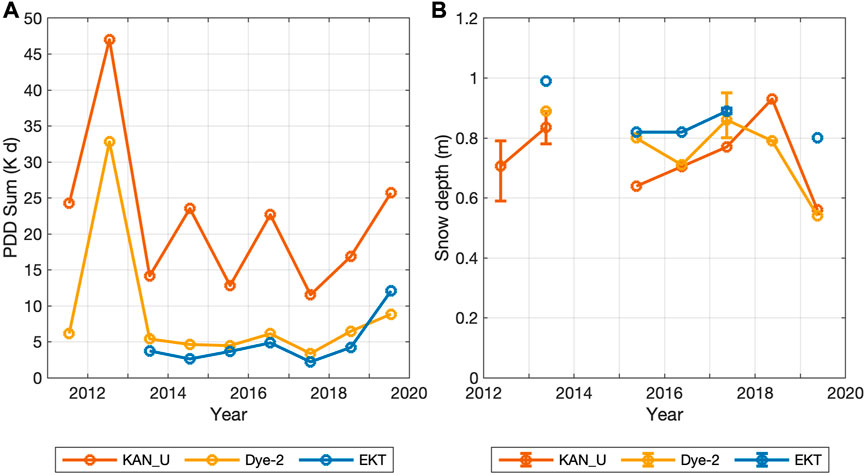
FIGURE 2. (A) Positive degree-day (PDD) sum in June–August (JJA) at KAN_U (1,850 m a.s.l.), Dye-2 (2,130 m a.s.l.) and EKT (2,360 m a.s.l.). The PDD sums were calculated using air temperature data from the KAN_U PROMICE AWS v03 station (Fausto et al., 2021, 2022), the Dye-2 GC-net station (Steffen et al., 1996; Steffen and Box, 2001), and the EKT FirnCover station (MacFerrin et al., 2021, 2022). (B) Average snow depth measured in April–May at KAN_U, Dye-2 and EKT. The error bars show the ranges of the snow depths when there are multiple measurements. The snow depth averages and ranges were calculated from field measurements between late April and late May. The year labels refer to January 1st in each year.
All cores have been presented in previous studies (Supplementary Table S1) except four ∼5 m cores collected in 2018 at Dye-2. The naming of the cores followed the same naming convention by Rennermalm et al. (2021a). The total length of the core ranges from 5.4 to 26.7 m, with an average of 15.8 ± 5.7 m (mean ± std. dev.). The cores were collected between 2012 and 2019. Four sites have more than one core collected in the same year(s), including KAN_U (three cores in 2012, two cores in 2013, and two cores in 2016), Dye-2 (two cores in 2013, four cores in 2017, and five cores in 2018), Core 7 (two cores in 2019), and EKT (two cores in 2017) (Figure 3; Table 1). Hereafter, we refer to the two or more cores collected at the same general site and in the same year as a group of same site/year cores. These cores were separated by a maximum of 632 m in horizontal distance and 7 m in elevation difference. In addition, to put the local-scale variability in a regional context we included 23 cores that were the only core collected at a certain site in a certain year (henceforth referred to as single cores).
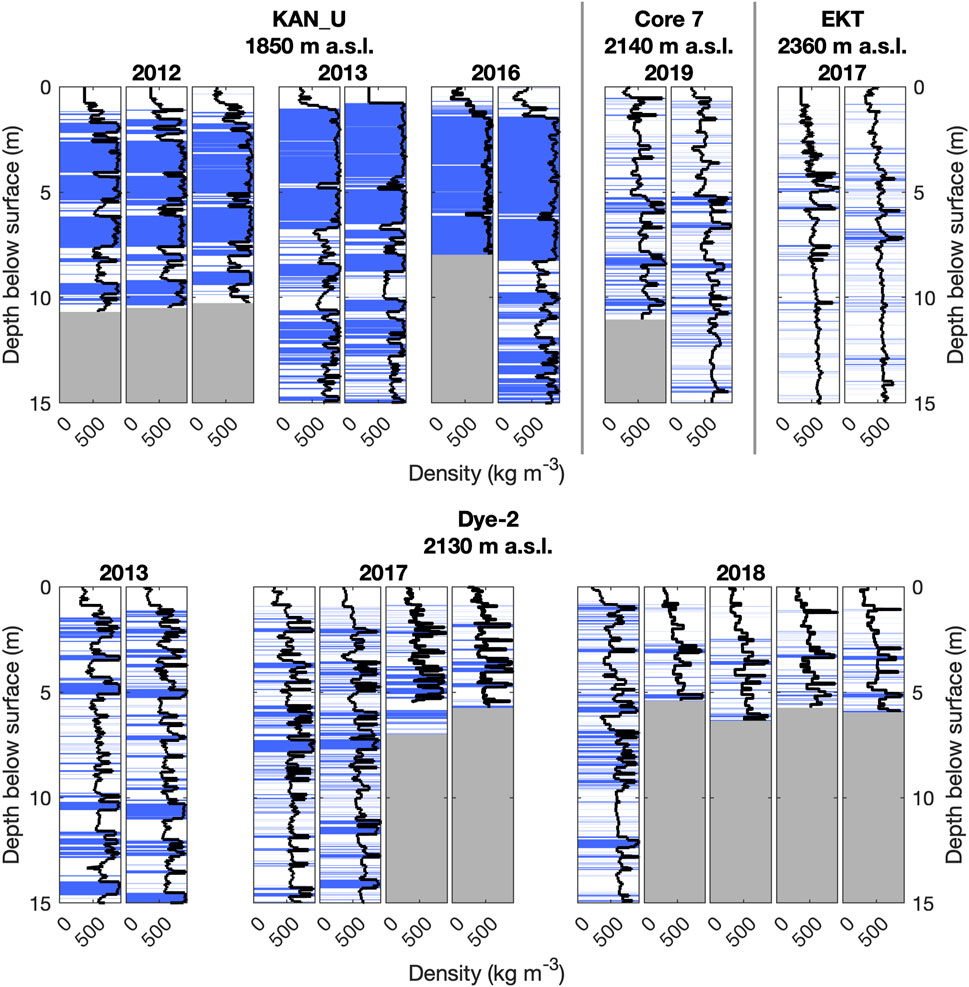
FIGURE 3. Firn density and ice layer stratigraphy of the 22 same site/year cores. The elevation of each site is listed below the site name. Core segment densities before resampling are shown with black lines. Ice layers are shown in blue and snow/firn layers are shown in white. Gray color refers to no data. Only the top 15 m of the cores (including the winter snow layer) are presented.
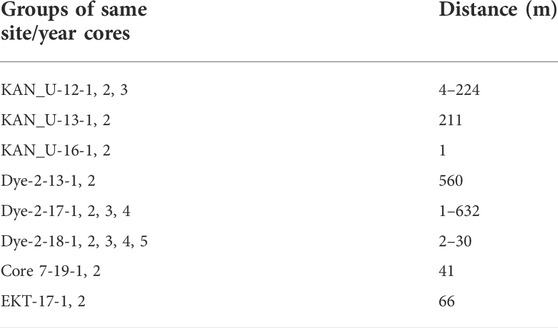
TABLE 1. Horizontal distances between the same site/year cores. The horizontal distances were calculated based on the core coordinates recorded in the field by handheld GPS.
During the drilling process, each core coming out of the drill barrel either naturally broke or was manually cut into multiple segments. For each segment, its length, diameter, weight and intactness were recorded, and a density was calculated based on these measurements. In addition, the segment’s stratigraphy was logged, including each layer’s type of material (i.e., snow, firn, or ice), position and thickness. In this study, we analyzed firn properties for selected depths of each core, e.g., the top 4.5 m. To obtain the density of a certain part of a core, we calculated the length-weighted average density of all the segments that fall within this part. We used ice layer thickness fraction (the percentage of ice layer thickness in the total thickness of a whole core or part of a core) to represent the ice content. Further details about the dataset, core collection, and post-processing are provided in Rennermalm et al. (2021a).
2.2 Firn density resampling
Many core segments contain both firn and ice layers which have distinctly different densities. However, the measured segment-averaged densities cannot capture these spatial density variations within segments. To acquire more precise density profiles for the following statistical analyses, we resampled the densities of all mixed ice-firn segments in all 45 cores. We assigned a density of 862 kg m−3 (estimated ice density by Rennermalm et al., 2021a, and close to the estimate of 873 ± 25 kg m−3 by Machguth et al., 2016) to all ice layers, and then derived a mean density for the remaining firn layer(s) so that the mean density of the entire segment was preserved. Unrealistically low (<70% of the density simulated by the Herron-Langway model; Rennermalm et al., 2021a) or high (>862 kg m−3; happened when a mixed ice-firn segment’s measured density was larger than 862 kg m−3) resampled firn densities were replaced with the average firn density of the nearest firn segments above and below (applied to 0–10.3% of the number of segments per core, 0–2.6% of total length of each core). The correction of unrealistic values caused the resampled and corrected segment density to be different from the measured density, thus violating mass conservation. Yet the differences are negligible: for the 4.5-m sections in each core, the mean density changed 0–3.0% (average: 0.4%) after resampling. The resampled densities were used for all the following analyses.
2.3 Statistical comparison of groups of same site/year cores using the Mann-Whitney U-test
To investigate the similarity of the same site/year cores in each group, we first examined the data distribution of both the density and the ice content of the cores, using the one-sample Kolmogorov-Smirnov test (Supplementary Figures S2, S3). Results show that for all cores, neither of the two variables comes from a normal distribution. Therefore, we then compared both the density and the ice content of these cores, using the two-sided Mann-Whitney U-test with a significance level of 0.05. The null hypothesis is that the two cores compared have equal medians.
The sampling frequency affects the Mann-Whitney U-test result. For example, comparing the average density of two 10-m cores (i.e., one sample from each core) vs. comparing the average density of every 0.05 m of the two 10-m cores (i.e., 200 samples from each core) can lead to different conclusions. For our data, the higher the sampling frequency (e.g., every 0.05 m), the more samples and details are considered in the Mann-Whitney U-test, increasing the likelihood that the null hypothesis is rejected (i.e., the two cores are not statistically similar). In contrast, the lower the sampling frequency (e.g., every 1 m), the fewer samples are used, increasing the likelihood that the null hypothesis cannot be rejected (i.e., the two cores are statistically similar). A suitable sampling frequency should be neither too high to increase unrealistic heterogeneity, nor too low to omit local-scale variability. We performed a sensitivity analysis and determined that 0.2 m is an appropriate sampling frequency to use (Supplementary Table S2).
2.4 Local-scale variability in core properties
Due to the temporal and spatial variation of seasonal snow depth, the winter snow layer was removed in all cores for the following analyses, except for stratigraphy visualization (Figure 3). We conducted analyses for three depth intervals: 0–4.5, 4.5–9, and 9–13.5 m below the winter snow layer (i.e., below the snow-firn interface), hereafter referred to as the top section, the middle section, and the bottom section, respectively. All 22 same site/year cores extended down to 4.5 m below the winter snow layer, 13 out of the 22 cores extended down to 9 m, and eight out of the 22 cores extended down to 13.5 m (Supplementary Table S1). Based on the depth-age relationships of five dated cores from our study area (Rennermalm et al., 2021a), the three depth sections were deposited approximately 1–7.7, 7.7–14.4, and 14.4–21.1 years before the core retrieval.
To investigate the local-scale variability in core density and ice content for each pair of same site/year cores, we calculated their absolute difference and percent difference (absolute density difference or ice content difference divided by the larger density or ice content of the two cores) in the three sections. We have 24 pairs of same site/year cores in the top section, eight core pairs in the middle section and four core pairs in the bottom section (Supplementary Table S3). We also examined if these core differences change as a function of other factors such as elevation, year, and depth. In particular, to analyze the relationship between core differences and depth, we used only the four core pairs reaching the depth of 13.5 m below the winter snow layer.
We conducted the two-sided Mann-Whitney U-test for each pair of same site/year cores to examine their statistical similarity/difference over the three sections. In addition, to compare the local variability with the regional variability, we performed the Mann-Whitney U-test for each pair of cores that were extracted from the same year but different sites as well. We then analyzed the relationship between the Mann-Whitney U-test result and the elevation difference in each core pair.
3 Results
3.1 Stratigraphy and properties of the same site/year cores
The cores were collected from an area with a strong elevation gradient in surface melting (i.e., see summer (June–August, JJA) PDD sums as a proxy for melt in Figure 2A), but where the snow depth variability between sites is relatively small compared to the snow depth and has no relationship with elevation (Figure 2B). As a result, the melt features (i.e., ice layers and very dense firn) show a strong elevation gradient with most features at the lowest elevations (Figure 3). Visual inspection of the core stratigraphy (Figure 3) suggests that the same site/year cores have similar ice content (blue-white ratio), especially when contrasting with cores from other sites. Yet there are visibly distinguishable differences in their ice layer distribution. For example, in the top 5 m of the two Dye-2-13 cores (in the bottom left in Figure 3), the core to the right has slightly thinner and more frequently occurring ice layers distribution than the core to the left, and it is difficult to trace the ice layers across the two Dye-2-13 cores. Bulk statistics (Figure 4) also reveal both similarities and differences among the same site/year cores. For example, there are two cores collected at KAN_U (elevation: 1,850 m a.s.l.) by the same team in 2013, and another two cores collected at Dye-2 (elevation: 2,130 m a.s.l.) also by the same team in 2017. The former two cores have relatively similar mean density (855 and 852 kg m−3) and ice content (92 and 95%) in the top section. In contrast, the latter two cores have discrepant mean density (574 and 546 kg m−3) and ice content (33 and 23%) in the same depth interval.
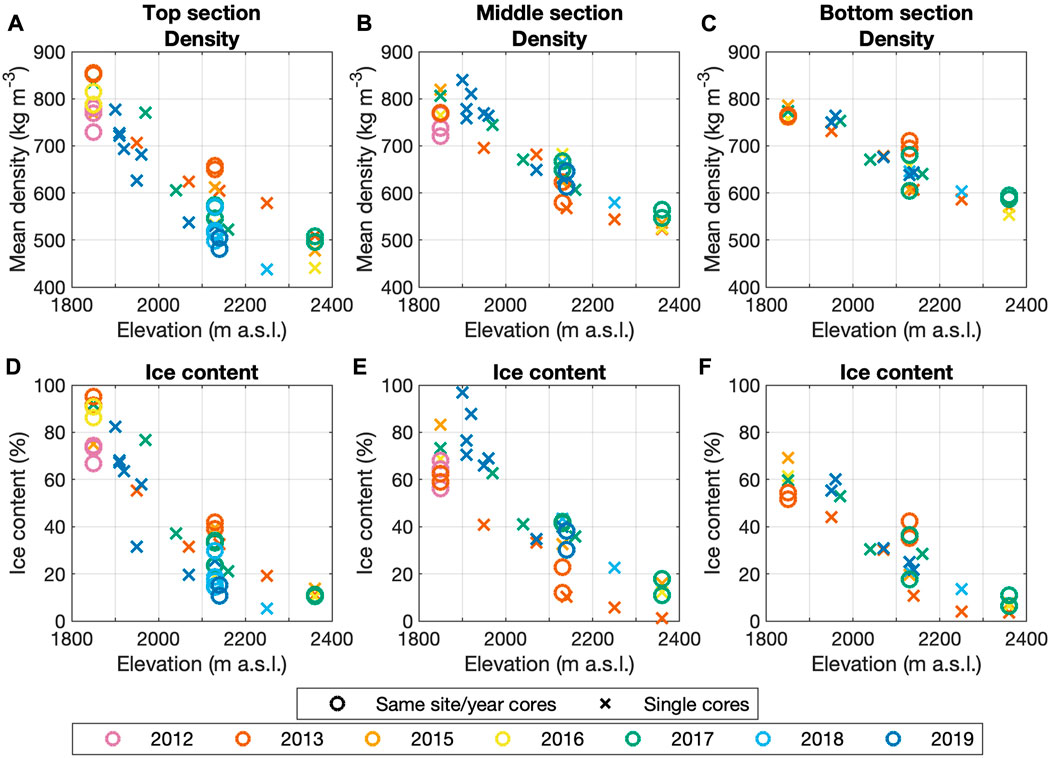
FIGURE 4. Mean density (A–C) and ice content (D–F) of the top (45 cores), middle (38 cores) and bottom (30 cores) sections as a function of elevation. The top, middle and bottom sections refer to the 0–4.5, 4.5–9 and 9–13.5 m below the winter snow layer, respectively.
3.2 Local variability of core density and ice content considered with other factors
To examine if the local variability of core density and ice content changes as a function of other factors, we compared the firn properties differences between the same site/year cores with depth, elevation, and time (year). First, we used four pairs of long same site/year cores to investigate the potential correlation between the firn properties differences and depth. For all four core pairs, their density difference and ice content difference show similar fluctuations (Figure 5A).
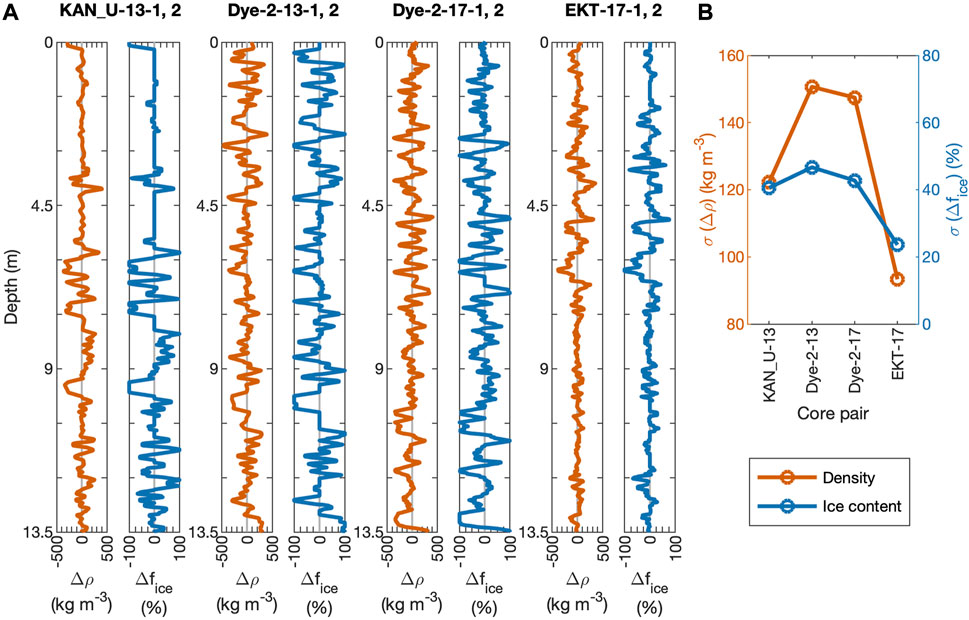
FIGURE 5. (A) Differences in density (Δρ) and ice content (Δfice) between four pairs of same site/year cores along the top 13.5 m below the winter snow layer. The firn properties and their differences were calculated in 0.01 m bins using a 0.1 m moving average. The zero difference references were marked with gray vertical lines. (B) Standard deviation of the eight difference profiles in (A). The sampling resolution (0.01 m) and the moving average (0.1 m), different from the resolution (0.2 m) used for the following statistical tests, were only used for this figure.
For the two KAN_U-13 cores, the density difference and the ice content difference are both small in the upper 5.4 m below the seasonal snow layer, except for several spikes at the top and around 3.5–4.2 m depth (Figure 5A). Below 5.4 m, the differences become larger with frequent spikes, especially between 5.4 and 10 m. The upper 5.4 m with small differences correspond to the depth interval between 0.9 and 6.3 m in KAN_U-13-1 and 0.8–6.2 m in KAN_U-13-2 in Figure 3, coinciding with the location of the thick ice slabs in these two cores. Based on the depth-age relationships of nearby cores (Rennermalm et al., 2021a), this 5.4-m section was deposited approximately between 2004 and 2012. This period covers several extreme melt seasons such as 2010 and 2012, which led to the formation of the thick ice slabs in this section. The two EKT-17 cores show an opposite trend where the density difference and the ice content difference are low in the deeper part of the cores (below 7.5 m), yet more variable in the upper sections. The upper 7.5 m of the two cores correspond to the depth interval between 0.9 and 8.4 m in Figure 3, which were deposited approximately 1–12 years before the core retrieval (2005–2016) based on the depth-age relationships of nearby cores (Rennermalm et al., 2021a). This time period witnessed increasing summer melting and several extreme melt seasons (e.g., 2010, 2012, 2016) in this region, including site EKT. At Dye-2, the differences between the two 2013 cores and the two 2017 cores are both relatively large along the whole 13.5 m, containing frequent spikes in density and ice content differences. These difference profiles (Figure 5A) and their standard deviations (Figure 5B) both suggest Dye-2 is the site with the most local-scale variability out of the three sites. Dye-2 has more summer melting and thus more refreezing in firn compared to EKT. The refreezing created mostly thin ice layers less than 0.1 m thick yet it was not enough to form thick ice slabs similar to those in KAN_U cores.
The bulk statistics confirm that Dye-2 is the site with the most pronounced local-scale variability in both density and ice content (Supplementary Figure S4). For the absolute and percent differences over the three sections, there is always at least one Dye-2 core pair with a difference exceeding the difference between the KAN_U core pair and between the EKT core pair, except for the top section where all core pairs have similar density differences. The two KAN_U-13 cores have small density and ice content differences in all three sections, despite the large discrepancies at deeper depths shown in Figure 5A. The two EKT-17 cores have slightly lower density difference in the bottom section compared to the upper two sections, yet the lowest ice content difference is in the top section. Overall, the core difference profiles (Figure 5A) show different trends with depth at different sites. Yet the bulk statistics (averaging over 4.5-m sections; Supplementary Figure S4) suggest no remarkable correlation between core differences and depth.
Second, we investigated if the core properties differences are dependent on elevation. Both KAN_U (1,850 m a.s.l.) and Dye-2 (2,130 m a.s.l.) have several pairs of same site/year cores, while Core 7 (2,140 m a.s.l.) and EKT (2,360 m a.s.l.) each has one core pair. In general, the core differences show no clear relationship with elevation (Figure 6). If only considering the average difference at each site, in the top section, three sites (KAN_U, Dye-2 and Core 7) have relatively similar average density difference (26, 23 and 24 kg m−3) and ice content difference (5, 7, and 4%), larger than the average differences at EKT (13 kg m−3 and 1%; Figures 6A,D). In the middle section, Dye-2 and Core 7 have larger density discrepancies (31 and 33 kg m−3) than KAN_U and EKT (23 and 17 kg m−3), while the ice content differences along the four sites are more consistent (6–8%; Figures 6B,E). In the bottom section, the differences between the two Dye-2-17 cores are substantially larger than the differences between the Dye-2-13 cores as well as the cores from the other sites (Figures 6C,F). Previous studies (e.g., Rennermalm et al., 2021a) show that both firn density and ice content have strong trends with elevation. However, our results do not show a consistent relationship between the local variability of these two properties and elevation. In addition to comparing the core sections covering the same depths, we also compared the core sections covering the same set of years (based on five nearby, dated cores; Rennermalm et al., 2021a). We did not find any spatial trend in local variability (Supplementary Figures S5, S6). Due to the limited depth-age relationships, using the core sections covering the same years is likely to induce more uncertainty than using the core sections with the same depths.
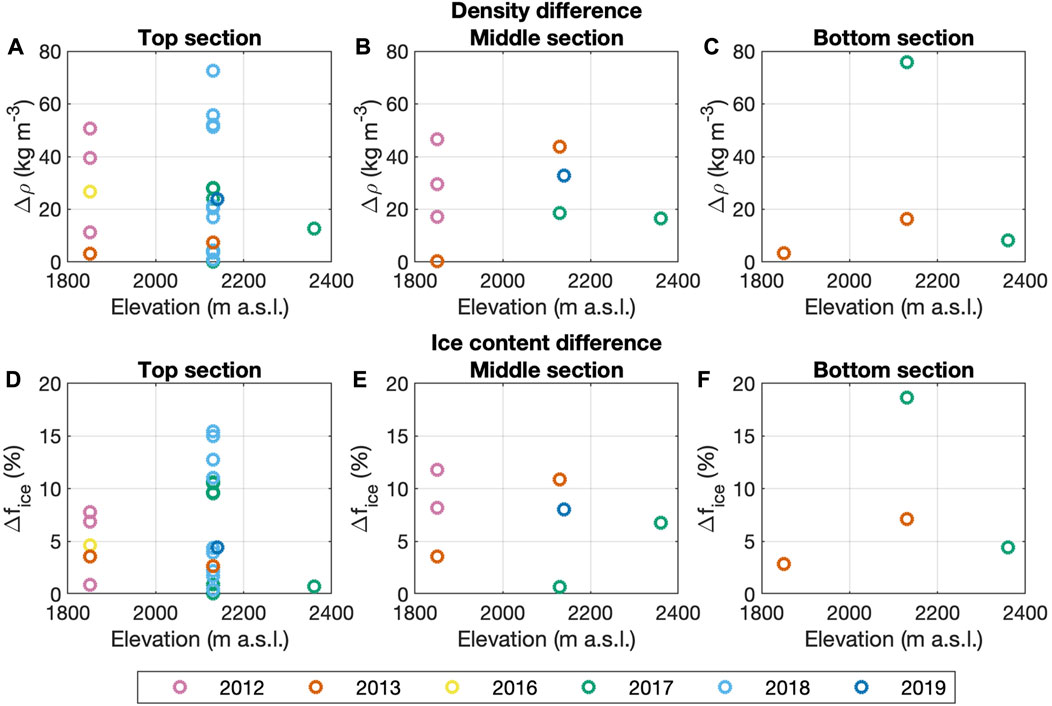
FIGURE 6. Absolute differences in mean density (Δρ; A–C) and ice content (Δfice; D–F) between every core pair from the same site and year in three depth sections. The top, middle and bottom sections refer to the 0–4.5, 4.5–9 and 9–13.5m below the winter snow layer, respectively.
Third, we examined whether the density and ice content differences have any temporal trend. There are groups of same site/year cores from several years at both KAN_U and Dye-2, allowing this temporal analysis. At KAN_U (1,850 m a.s.l.), the two 2013 cores have smaller density difference and ice content difference than the two 2016 cores in the top section (Figures 6A,D). The average differences calculated from the three 2012 cores are the largest out of the three years, yet the discrepancies among these three cores are not consistent, with the density difference ranging from 11 to 51 kg m−3 and the ice content difference ranging from 1 to 12% (pink dots in Figures 6A,B,D,E). At Dye-2 (2,130 m a.s.l.), in the top section, the average differences slightly increase from 2013, 2017 to 2018. However, similar to the KAN_U-12 cores, the density difference and the ice content difference of both the four Dye-2-17 cores and the five Dye-2-18 cores have wide ranges (Figures 6A,D), making it difficult to confirm the differences’ increasing trend with time. In the middle section, the two Dye-2-17 cores have smaller differences than the two Dye-2-13 cores (Figures 6B,E); while in the bottom section, the Dye-2-17 cores are more dissimilar than the Dye-2-13 cores. In summary, our results suggest that neither density variability nor ice content variability show any trend over time during our study period. Additionally, sample size (i.e., the number of same site/year cores in a group) may have potential impacts on the firn properties differences. Thus, we also compared the density difference and the ice content difference with the sample size yet found no correlation between them (Supplementary Figure S7).
Finally, we looked at the differences of all pairs of same site/year cores (see list of all core pairs in Supplementary Table S3). These core pairs exhibit absolute density differences up to 73, 47, and 76 kg m−3, and absolute ice content differences up to 15, 12, 19%, in the three sections; these equate to percent density differences up to 13, 7, 11%, and percent ice content discrepancies up to 52, 48, 51%, respectively (Figures 6, 7; Supplementary Tables S3, S4). The largest differences are mainly found between the Dye-2-18 cores (Dye-2-18-1 and the other Dye-2-18 cores) and the KAN_U-12 cores. The Dye-2 2013 cores and 2017 cores also show some wide discrepancies (e.g., the Dye-2-13 cores have very different density and ice content in the middle section; the Dye-2-17 cores have large ice content differences in the top section). The EKT-17 cores, despite their relatively similar densities, have some different ice content in deeper depths (middle and bottom sections). The most similar cores are the KAN_U-13 cores. In addition, the Dye-2-17 cores and the four Dye-2-18 cores (2–5) also have small density differences in the top section.
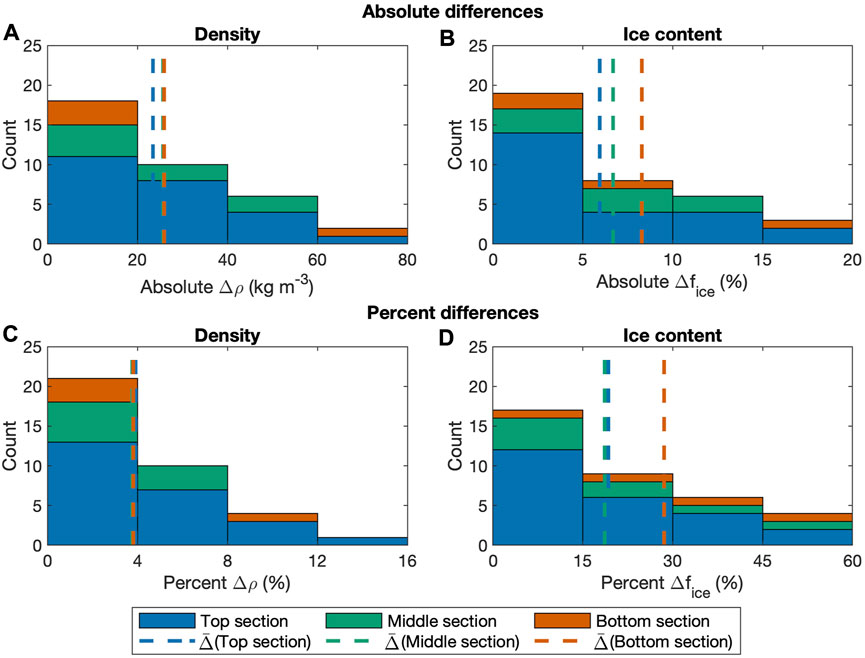
FIGURE 7. Histograms of the absolute (A,B) and percent (C,D) difference in density (Δρ) and ice content (Δfice) between core pairs from the same site and year in three depth sections. The differences were lumped together in the histogram regardless of year and site. The average differences are shown with dashed lines. The top, middle and bottom sections refer to the 0–4.5, 4.5–9 and 9–13.5 m below the winter snow layer, respectively.
Overall, examining the differences of all groups of same site/year cores in the three depth intervals confirms our previous analyses that Dye-2 stands out as having consistently large differences between the core pairs. In addition, our results suggest the KAN_U-12 group is also among the most dissimilar groups of cores and the KAN_U-13 group is the most similar one. This is likely affected by the extreme melt events in summer 2012, which resulted in an almost contiguous ice column in 2013 (Figure 3). Dye-2-18-1 is noticeably dissimilar to the other four Dye-2 2018 cores, while the other four cores are a lot more similar (Figures 3, 6). The EKT 2017 cores have similar densities, yet ice content disagreement at deeper depths.
3.3 Comparison of local and regional variability of the core properties
To examine the local-scale variability in the context of the regional-scale pattern, we selected the years that had core samples from the most sites: 2013, 2017, and 2019. For each year, we compared the firn properties (density and ice content) and the local variability at each site (for the top section). If there is more than one core available at a site in a certain year, an average density and ice content were calculated. As for local variability, due to its lack of trend with neither time nor elevation, we applied one value—the mean absolute difference in the top section calculated from the 24 pairs of same site/year cores—to all sites in all years. The mean variability in density and ice content is 23 kg m−3 and 6%, respectively (shown with blue dashed lines in Figures 7A,B). The figures for the two deeper sections are included in Supplementary Materials (Supplementary Figures S8, S9).
Our results show that the local variability can make the core density and ice content at one site indistinguishable from those at nearby sites (Figure 8). For example, at Dye-2 (the site at 2,130 m a.s.l. in Figure 8), its density range and ice content range overlap with those at several nearby sites, including Core 3 (1,950 m a.s.l.), Site J (2,040 m a.s.l.), Core 4 (2,070 m a.s.l.), Site G (2,160 m a.s.l.), and Core 7 (2,140 m a.s.l.). The largest elevation difference between Dye-2 and another site with overlapping firn property range is 90 m between Dye-2 and Site J (density), or 180 m between Dye-2 and Core 3 (ice content). At the site with the lowest elevation—KAN_U (1,850 m a.s.l.), where the core density and ice content are the largest among all 15 sites, its density range and ice content range have no overlap with any nearby sites in the selected years (2013, 2017). At the highest site EKT (2,360 m a.s.l.), its density range and ice content range overlap with those of Site G in 2017. In addition, EKT has an overlapping ice content range with Core 8 (2,250 m a.s.l.) in 2013. The largest elevation difference between EKT and another site with overlapping firn property ranges is 200 m between EKT and Site G.
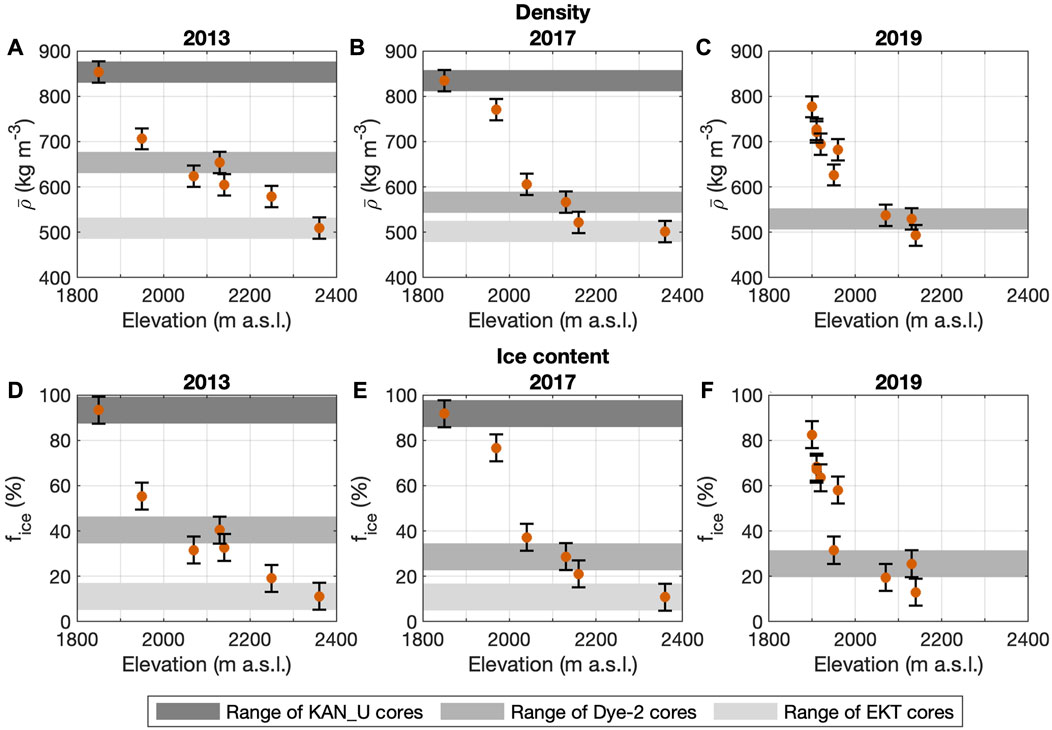
FIGURE 8. Core density and ice content over the top section in 2013 (A,D), 2017 (B,E) and 2019 (C,F). The average density and ice content were presented if there are several cores available at a certain site in a certain year. For the error bar (local variability), we used the average absolute difference of density and ice content in the top section shown in Figures 7A,B (23 kgm−3 and 6%). The ranges (density/ice content ± local variability) of KAN_U, Dye-2 and EKT were marked in different gray shades. The top section refers to the top 0–4.5 m below the winter snow layer.
The findings suggest that the values of density and ice content, and their changing rates with elevation all have strong impact on whether or not the local-scale variability can exceed the regional-scale pattern. Both density and ice content exhibit strong trends with elevation (Vandecrux et al., 2019; Rennermalm et al., 2021a) and their variations with elevation tend to be steeper at lower elevations, and flatter at higher elevations. The results suggest that in our study area, the local variability plays a more important role for sites at higher elevation, where it can make the firn properties at one site indistinguishable from those at sites as far as 200 m elevation higher/lower (for the top section). Based on the air temperature data between 2013 and 2019 from the automatic weather stations at KAN_U, Dye-2, and EKT (Steffen et al., 1996; Steffen and Box, 2001; Fausto et al., 2021, 2022; MacFerrin et al., 2021, 2022), the 200 m elevation increase in our study area translates to a JJA mean air temperature decrease of 1.3–1.8°C, or a JJA PDD sum decrease of 3.7–8.4 K d (see JJA PDD sums of the three sites in Figure 2A). The largest elevation difference with overlapping firn properties ranges is about 120–220 m for the middle section (Supplementary Figure S8) and 220–280 m for the bottom section (Supplementary Figure S9). In addition, compared with ice content, density has relatively smaller variability. This is likely a reflection of the fact that both ice layer formation and firn compaction result in a high density, while only the former increases the ice content.
3.4 Statistical significance of core differences
The Mann-Whitney U-tests (alpha = 0.05) results show that most of the core pairs collected from the same site and year do not have different medians (i.e., in 65 out of the 72 tests, the null hypothesis cannot be rejected). In the top section, out of the 24 core pairs, only one pair has different density medians and four pairs have different ice content medians (Figures 9A,D; see the full list of the 24 core pairs in Supplementary Table S3). In the middle section, all eight core pairs have equal medians (Figures 9B,E). In the bottom section, one out of the four core pairs has different medians of both firn properties (Figures 9C,F). In other words, the majority (>90%) of the differences calculated in Section 3.2 are not statistically significant.
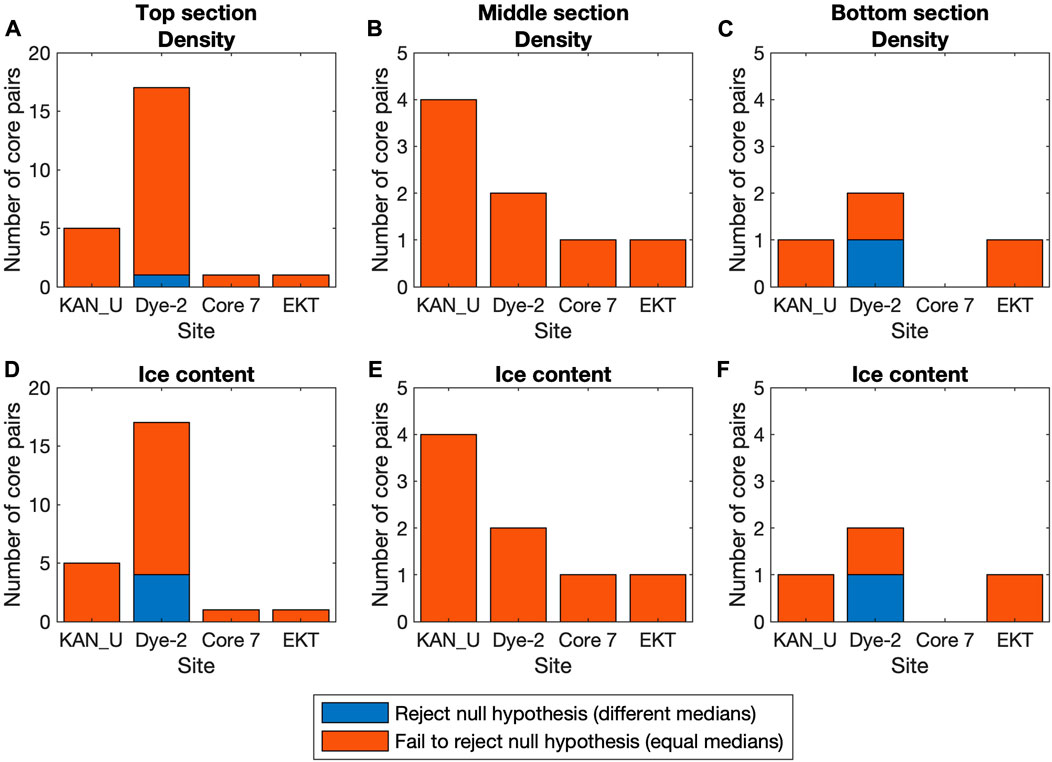
FIGURE 9. Results of the Mann-Whitney U-tests comparing density (A–C) and ice content (D–F) of every same site/year core pair in three depth sections. The top, middle and bottom sections refer to the 0–4.5, 4.5–9 and 9–13.5 m below the winter snow layer, respectively.
Given the large-scale elevation trend in density and ice content in our study area (Rennermalm et al., 2021a), we expect both density difference and ice content difference to increase with the elevation difference between any two cores. For example, the density difference between a Dye-2 core and a Core 7 core (elevation difference of 10 m) is very likely smaller than the density difference between a Dye-2 core and a EKT core (elevation difference of 230 m).
To examine the relationship between firn property difference and elevation difference, we analyzed the Mann-Whitney U-test results for every two cores from the same year, whether they were extracted from the same site or two different sites. For core pairs from the same site or sites with similar elevations (e.g., with an elevation difference no more than 50 m), the majority (>80%) do not have statistically different core properties. However, as the elevation difference between the core pair increases, it is more likely that they are statistically different from each other (Figure 10). Using this statistical analysis, we determined an elevation difference threshold at which two cores cease to be similar. For the top section, most (≥90%) core pairs have statistically different density or ice content if they are at least 190 m apart in elevation (vertical dotted lines in Figures 10A,D). The elevation difference thresholds are 90 m (density) and 100 m (ice content) for the middle section (Figures 10B,E), and 280 m (density) and 290 m (ice content) for the bottom section (Figures 10C,F). These are thresholds beyond which the two cores mostly have statistically different properties. This finding agrees with our analysis in Section 3.3 where we established that the local variability in firn properties has the potential to mask the regional trends within as far as ∼200 m elevation difference.
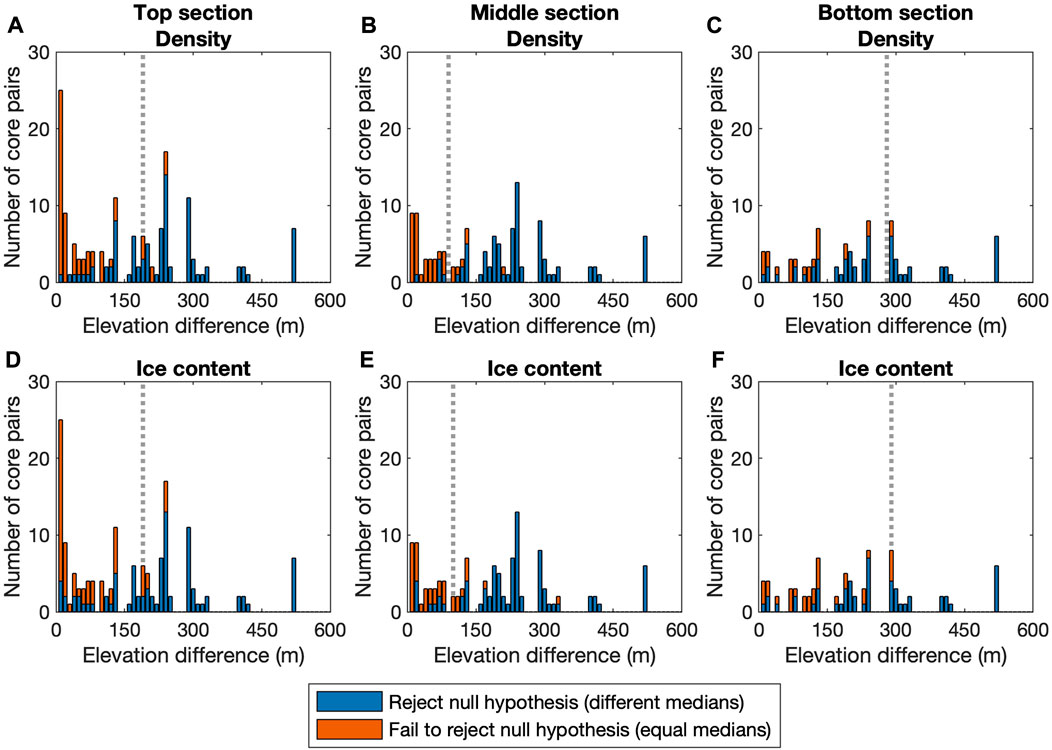
FIGURE 10. Results of the Mann-Whitney U-tests comparing density (A–C) and ice content (D–F) of every core pair from the same year grouped by the elevation difference between the two core locations. The elevation difference beyond which the core differences are of high possibility (≥90%) to be statistically significant is marked with gray dotted line. The top, middle and bottom sections refer to the 0–4.5, 4.5–9 and 9–13.5 m below the winter snow layer, respectively.
4 Discussion
4.1 Local variability in firn density and ice content
The Mann-Whitney U-tests show that for all three depth sections, most of the same site/year cores are statistically similar in both density and ice content. The only exceptions are the top section of the Dye-2 2018 cores, and the bottom section of the Dye-2 2017 cores. Additionally, when comparing the core pairs from nearby sites with elevation difference within 50 m, in the top section, 89% and 76% of the 153 core pairs are statistically similar in density and ice content, respectively; in the middle section, 96% and 79% of the 119 core pairs have statistically similar density and ice content; in the bottom section, 60% of the 81 core pairs are statistically similar. The results suggest that 1) cores collected at Dye-2 exhibit more local variability compared to cores collected at lower (KAN_U) or higher (EKT) sites; 2) density has relatively smaller variability compared to ice content.
Despite this statistical similarity, quantitative calculations reveal that the cores from the same site and year still show substantial difference in firn properties. The density difference and ice content difference can reach up to 73 kg m−3 and 15% in the top section, 47 kg m−3 and 12% in the middle section, and 76 kg m−3 and 19% in the bottom section. These differences translate to firn air content (calculated using the method in Ligtenberg et al., 2014) variability up to 0.37, 0.24, and 0.37 m in the three 4.5-m sections, respectively. Overall, the core differences do not show a correlation to either depth, retrieval year, elevation, or sample size, suggesting that the local variability we calculated has a broad applicability.
Our study also finds high variability in ice layer distribution among the same site/year cores (Figure 3), which agrees with the findings in Brown et al. (2011) and Marchenko et al. (2017). All three groups of same site/year cores collected from the lowest elevation site KAN_U (1,850 m a.s.l.) contain one or more thick ice slabs over 1 m (the thickest one is 4.59 m thick). The four groups of same site/year cores at Dye-2 (2,130 m a.s.l.) and Core 7 (2,140 m a.s.l.) have some thick ice layers up to 0.66 m, yet most (69–98% per core) of the layers are thin ice lenses less than 0.1 m thick. At the highest elevation site EKT (2,360 m a.s.l.), the cores consist of mostly (>95%) very thin ice layers less than 0.05 m thick. Based on the visual inspection of these groups of same site/year cores (Figure 3), we find that the thick ice slabs are often presented at similar depths within each group of cores; the thin ice layers, on the other hand, are rather discontinuous laterally. Some thin ice layers, however, tend to concentrate around similar depths across cores from the same site and year. This is also confirmed by the statistical comparison of the same site/year cores’ ice content (Figures 9D–F), which suggests that despite the variable ice layer distribution, the cores from the same site and year do not have statistically different ice content. Our results agree with previous studies (e.g., Parry et al., 2007; Dunse et al., 2008; Brown et al., 2011; Culberg et al., 2021), confirming that while thin ice layers are often locally discontinuous and are difficult to be traced individually, it is still possible to locate a cluster of thin ice layers over a depth range.
4.2 Local variability and measurement uncertainty
To account for measurement errors, we calculated the measurement uncertainties of the 22 same site/year cores based on the uncertainty estimation in Rennermalm et al. (2021a). We then compared the uncertainties with the local variability of these cores (Table 2). For core density, the local variability is generally comparable to the corresponding measurement uncertainties. Yet for ice content, the local variability is often larger than the measurement errors. Over the three depth sections, about 25–38% and 71–88% of the core pairs have density differences and ice content differences, respectively, exceeding the average uncertainty from measurement errors (Supplementary Tables S3, S4). The comparison suggests that while some core differences could possibly come from measurement errors, the other differences are too large to be explained by measurement uncertainty and are likely to reflect actual discrepancies between the same site/year cores.
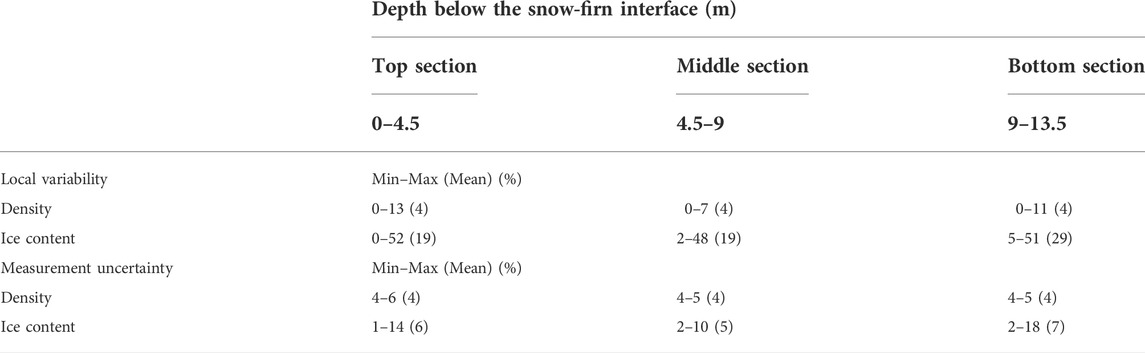
TABLE 2. Local variability and measurement uncertainty of the 22 same site/year cores. The local variability was calculated as the percent difference between each pair of cores from the same site and year. The measurement uncertainty was estimated using the measurement errors and calculation methods provided in Rennermalm et al. (2021a).
4.3 Local and regional variability
Though local variability is often not large enough to cause significant differences among the same site/year cores, it could still affect the assessment of regional variability, especially if only one core from each site is used and the local variability is not considered. In our study area, the possibility of the local variability surpassing the regional trend depends on the values of both and is more remarkable at higher elevations (>2,000 m a.s.l.). For example, the local-scale variability makes the firn properties at sites such as Dye-2 (2,130 m a.s.l.) and EKT (2,360 m a.s.l.) have overlapping value ranges with those at sites within elevation difference up to about 200 m. However, at lower-elevation sites such as KAN_U (1,850 m a.s.l.) and Site A (1,900 m a.s.l.), due to the greater spatial variability, it is often possible to distinguish between the firn properties of nearby sites despite some local variability. The statistical analyses (Section 3.4) suggest that two cores are very likely (>90%) to have statistically different density and ice content if they are more than approximately 200 m in elevation apart. Yet in other occasions (e.g., when the cores are close, or when the cores are from high elevations), the local variability could possibly mask the regional differences. The connection between local and regional variability is likely related to the elevation gradient of the firn processes. For example, we see slightly less local variability and less impact on regional variability at low-elevation sites such as KAN_U where thick ice slabs have already formed during the past decade. Yet we see more influence of local variability on regional variability at higher elevations, particularly Dye-2. At Dye-2 and other mid- to high-elevation sites, ice layer formation in firn is a more recent phenomenon compared to lower elevations. While ice layers form at Dye-2, these layers are thinner and rarely aggregate into thick ice slabs observed at lower-elevation sites (e.g., KAN_U). At the same time, Dye-2 experiences more melting than higher-elevation sites (e.g., EKT) where thicker firn segments are more likely. In other words, the higher variability at Dye-2 can partly be traced to the fact that cores at Dye-2 are unlikely to develop thick ice slabs as in lower elevations or maintain thick firn segments as in higher elevations. In summary, we recommend multiple cores to be collected from each site in the same year (especially sites with non-saturated firn and ongoing meltwater refreezing process) to capture the local variability.
4.4 Limitations
Our findings are based on shallow firn cores over the depth down to 13.5 m below the winter snow layer. The local-scale variability may present different characteristics for longer cores. For example, our analyses suggest that the density difference and the ice content difference between cores from the same site and year do not have strong correlation to neither depth, time (year), location (elevation) nor sample size. However, for cores that extend deeper (e.g., >100 m), the local variability may trend with depth because of the varying firn compaction rates and the increasingly different depth-age relationships with depth. The different mass balances at different elevations (sites) and the measurement uncertainty of depth (about 0.09 m for 4.5-m section; estimated based on Rennermalm et al., 2021a) may also affect our results. Additionally, though our study uses an extensive dataset of cores compared to previous studies, the sample size is still limited, with only two same site/year cores in most groups, potentially causing bias in the results. For example, the fact that we have several groups of same site/year cores at KAN_U and Dye-2, yet only one pair of same site/year cores at both Core 7 and EKT may have an impact on our findings—such as seeing more differences at Dye-2. More same site/year cores collected in future fieldwork can improve the quantification and promote our understanding of the local-scale variability.
5 Conclusion
This study investigates and provides quantitative estimates of the local-scale variability in firn properties in southwest Greenland using 22 cores from four sites where two or more cores were retrieved in the same year, and 23 additional single cores for spatial context. Statistical analyses (the two-sided Mann-Whitney U-tests) suggest that for most same site/year cores, there is no significant difference between their core median properties (density and ice content) over the 0–4.5, 4.5–9 and 9–13.5 m sections below the winter snow layer. Despite the statistical similarity, the same site/year cores still exhibit density and ice content differences up to 47–76 kg m−3 and 12–19% over the three 4.5-m sections, which translate to firn air content range up to 0.24–0.37 m.
As for the distribution of ice layers, the thick ice slabs (with thickness of tens of centimeters to several meters) can be easily tracked across cores from the same site and year (or even through consecutive years). However, most cores in our dataset consist of mostly (≥ 90%) thinner ice lenses (with thickness of less than 1 cm to several centimeters), which are rather discontinuous laterally. While the ice layers do not have consistent stratigraphy, they still provide a comparable picture. For example, there are certain depths (likely buried from the time of extreme melt seasons) where some thin ice lenses tend to concentrate. Also, the ice content bulk statistics of the same site/year cores show little significant differences.
Overall, the local variability (calculated as the average percent difference between same site/year cores) of density and that of ice content are 4% and 19–29% over the three sections. Density has relatively smaller local variability compared to ice content, likely impacted by the compaction of firn. The same site/year cores from Dye-2 exhibit slightly larger differences than the cores retrieved from lower sites (e.g., KAN_U, where thick ice slabs formed from previous extreme melt events) or higher sites (e.g., EKT, where less melt happened compared to other sites, creating primarily thin ice lenses). Yet in general, neither density nor ice content difference shows strong correlation to depth, year, elevation, or sample size, suggesting that the local variability we calculated is applicable to shallow cores from our study area as well as nearby regions with similar elevations.
The percent local variability of density is comparable to the measurement uncertainty. Yet for ice content, the local variability is often larger than the uncertainties from measurement errors. The comparison suggests that some differences (especially density differences) between the same site/year cores could possibly be attributed to measurement errors. But the large differences between some core pairs greatly exceed the measurement uncertainty and are very likely the reflection of actual discrepancies. The local-scale variability can sometimes surpass the regional variability (primarily elevation trend), particularly for sites at high elevations (>2,000 m a.s.l. in our study area). But it cannot explain the differences between sites from more than ∼200 m elevation apart.
This study confirms that single cores can provide representative bulk statistics (mean density and ice content) of one site. However, the same site/year cores also show substantial local variability. Compared to low elevations, we see slightly larger local variability at middle to high elevations (>2,000 m a.s.l.) in our study area, which can potentially mask the regional trend. This is particularly a problem at Dye-2 where ongoing firn processes such as meltwater percolation and refreezing are creating ice layers in firn. Therefore, we suggest that multiple cores are collected from each site in the same year and local variability is considered when analyzing regional spatial patterns.
Data availability statement
The core datasets analyzed in this study can be accessed through the Arctic Data Center: http://doi.org/10.18739/A2125Q994 (Koenig and Montgomery, 2020) and http://doi.org/10.18739/A2Q52FD98 (Rennermalm et al., 2021b). The resampled firn core dataset is available on the Arctic Data Center: http://doi.org/10.18739/A2CZ3263B (Xiao et al., 2022).
Author contributions
JX designed the research, conducted the analyses, and wrote the paper with significant contributions from AR. Major contributions to research design and paper writing were also provided by FC, RH, and SL. All authors conducted the fieldwork and collected the cores. All authors commented on the paper and improved the writing.
Funding
Funding for this work was provided by the US National Science Foundations (NSF) (Grants OPP-1604058 and OPP-1603815). The United States Ice Drilling Program provided support through NSF Cooperative Agreement 1836328.
Acknowledgments
The authors acknowledge the logistic support from Polar Field Services and UNAVCO. We thank Steven Munsell, Kierin Rogers, Iva Radivojević, Patrick Smith, and Max Stevens for their contributions to the fieldwork, and Rohi Muthyala, Kyle Mattingly and Isatis Cintrón for constructive feedback on the manuscript. Data from the Programme for Monitoring of the Greenland Ice Sheet (PROMICE) and the Greenland Analogue Project (GAP) were provided by the Geological Survey of Denmark and Greenland (GEUS) at http://www.promice.dk.
Conflict of interest
The authors declare that the research was conducted in the absence of any commercial or financial relationships that could be construed as a potential conflict of interest.
Publisher’s note
All claims expressed in this article are solely those of the authors and do not necessarily represent those of their affiliated organizations, or those of the publisher, the editors and the reviewers. Any product that may be evaluated in this article, or claim that may be made by its manufacturer, is not guaranteed or endorsed by the publisher.
Supplementary material
The Supplementary Material for this article can be found online at: https://www.frontiersin.org/articles/10.3389/feart.2022.938246/full#supplementary-material
References
Benson, C. S. (1962). Stratigraphic studies in the snow and firn of the Greenland ice sheet. Hanover: Cold Regions Research and Engineering Lab. Research Report 70.
Brown, J., Harper, J., Pfeffer, W. T., Humphrey, N., and Bradford, J. (2011). High-resolution study of layering within the percolation and soaked facies of the Greenland ice sheet. Ann. Glaciol. 52, 35–42. doi:10.3189/172756411799096286
Cogley, J. G., Hock, R., Rasmussen, L. A., Arendt, A. A., Bauder, A., Braithwaite, R. J., et al. (2011). Glossary of glacier mass balance and related terms. Paris: UNESCO-IHP. IHP-VII Technical Documents in Hydrology No. 86, IACS Contribution No. 2.
Culberg, R., Schroeder, D. M., and Chu, W. (2021). Extreme melt season ice layers reduce firn permeability across Greenland. Nat. Commun. 12, 2336. doi:10.1038/s41467-021-22656-5
de la Peña, S., Howat, I. M., Nienow, P. W., van den Broeke, M. R., Mosley-Thompson, E., Price, S. F., et al. (2015). Changes in the firn structure of the Western Greenland Ice Sheet caused by recent warming. Cryosphere 9, 1203–1211. doi:10.5194/tc-9-1203-2015
Dunse, T., Eisen, O., Helm, V., Rack, W., Steinhage, D., and Parry, V. (2008). Characteristics and small-scale variability of GPR signals and their relation to snow accumulation in Greenland’s percolation zone. J. Glaciol. 54, 333–342. doi:10.3189/002214308784886207
Fausto, R. S., van As, D., Mankoff, K. D., Vandecrux, B., Citterio, M., Ahlstrøm, A. P., et al. (2021). Programme for Monitoring of the Greenland Ice Sheet (PROMICE) automatic weather station data. Earth Syst. Sci. Data 13, 3819–3845. doi:10.5194/essd-13-3819-2021
Fausto, R. S., van As, D., and Mankoff, K. D. (2022). Data from: AWS one boom tripod v03. GEUS Dataverse, V2. doi:10.22008/FK2/8SS7EW
Forster, R. R., Box, J. E., van den Broeke, M. R., Miège, C., Burgess, E. W., van Angelen, J. H., et al. (2014). Extensive liquid meltwater storage in firn within the Greenland ice sheet. Nat. Geosci. 7, 95–98. doi:10.1038/ngeo2043
Harper, J., Humphrey, N., Pfeffer, W. T., Brown, J., and Fettweis, X. (2012). Greenland ice-sheet contribution to sea-level rise buffered by meltwater storage in firn. Nature 491, 240–243. doi:10.1038/nature11566
Heilig, A., Eisen, O., Schneebeli, M., MacFerrin, M., Stevens, C. M., Vandecrux, B., et al. (2020). Relating regional and point measurements of accumulation in southwest Greenland. Cryosphere 14, 385–402. doi:10.5194/tc-14-385-2020
Koenig, L., and Montgomery, L. (2020). Data from: Surface Mass Balance and Snow Depth on Sea Ice Working Group (SUMup) snow density subdataset, Greenland and Antarctica, 1950–2018. Arctic Data Center. doi:10.18739/A2125Q994
Ligtenberg, S. R. M., Kuipers Munneke, P., and van den Broeke, M. R. (2014). Present and future variations in Antarctic firn air content. Cryosphere 8, 1711–1723. doi:10.5194/tc-8-1711-2014
MacFerrin, M., Machguth, H., van As, D., Charalampidis, C., Stevens, C. M., Heilig, A., et al. (2019). Rapid expansion of Greenland’s low-permeability ice slabs. Nature 573, 403–407. doi:10.1038/s41586-019-1550-3
MacFerrin, M., Stevens, C. M., and Vandecrux, B. (2021). Data from: The Greenland Firn Compaction Verification and Reconnaissance (FirnCover) dataset, 2013–2019. Arctic Data Center. doi:10.18739/A25X25D7M
MacFerrin, M. J., Stevens, C. M., Vandecrux, B., Waddington, E. D., and Abdalati, W. (2022). The Greenland firn compaction verification and reconnaissance (FirnCover) dataset, 2013–2019. Earth Syst. Sci. Data 14, 955–971. doi:10.5194/essd-14-955-2022
Machguth, H., MacFerrin, M., van As, D., Box, J. E., Charalampidis, C., Colgan, W., et al. (2016). Greenland meltwater storage in firn limited by near-surface ice formation. Nat. Clim. Chang. 6, 390–393. doi:10.1038/nclimate2899
Marchenko, S., Pohjola, V. A., Pettersson, R., van Pelt, W. J. J., Vega, C. P., Machguth, H., et al. (2017). A plot-scale study of firn stratigraphy at Lomonosovfonna, Svalbard, using ice cores, borehole video and GPR surveys in 2012–14. J. Glaciol. 63, 67–78. doi:10.1017/jog.2016.118
Miller, J. Z., Culberg, R., Long, D. G., Shuman, C. A., Schroeder, D. M., and Brodzik, M. J. (2022). An empirical algorithm to map perennial firn aquifers and ice slabs within the Greenland Ice Sheet using satellite L-band microwave radiometry. Cryosphere 16, 103–125. doi:10.5194/tc-16-103-2022
Mouginot, J., Rignot, E., Bjørk, A. A., van den Broeke, M., Millan, R., Morlighem, M., et al. (2019). Forty-six years of Greenland Ice Sheet mass balance from 1972 to 2018. Proc. Natl. Acad. Sci. U. S. A. 116, 9239–9244. doi:10.1073/pnas.1904242116
Parry, V., Nienow, P., Mair, D., Scott, J., Hubbard, B., Steffen, K., et al. (2007). Investigations of meltwater refreezing and density variations in the snowpack and firn within the percolation zone of the Greenland ice sheet. Ann. Glaciol. 46, 61–68. doi:10.3189/172756407782871332
Pavlis, N. K., Holmes, S. A., Kenyon, S. C., and Factor, J. K. (2012). The development and evaluation of the Earth gravitational model 2008 (EGM2008). J. Geophys. Res. 117, B04406. doi:10.1029/2011JB008916
Porter, C., Morin, P., Howat, I., Noh, M. J., Bates, B., Peterman, K., et al. (2018). Data from: ArcticDEM, Version 3. Harvard Dataverse, V1. doi:10.7910/DVN/OHHUKH
Price, S. F., Payne, A. J., Howat, I. M., and Smith, B. E. (2011). Committed sea-level rise for the next century from Greenland ice sheet dynamics during the past decade. Proc. Natl. Acad. Sci. U. S. A. 108, 8978–8983. doi:10.1073/pnas.1017313108
Rennermalm, Å. K., Hock, R., Covi, F., Xiao, J., Corti, G., Kingslake, J., et al. (2021a). Shallow firn cores 1989–2019 in southwest Greenland's percolation zone reveal decreasing density and ice layer thickness after 2012. J. Glaciol. 68, 431–442. doi:10.1017/jog.2021.102
Rennermalm, Å. K., Hock, R., Covi, F., Xiao, J., Corti, G., Leidman, S. Z., et al. (2021b). Data from: Density and ice layer stratigraphy in 24 shallow firn cores from Southwest Greenland, 2017–2019. Arctic Data Center. doi:10.18739/A2Q52FD98
Shepherd, A., Ivins, E., Rignot, E., Smith, B., van den Broeke, M., Velicogna, I., et al. (2020). Mass balance of the Greenland ice sheet from 1992 to 2018. Nature 579, 233–239. doi:10.1038/s41586-019-1855-2
Steffen, K., Box, J. E., and Abdalati, W. (1996). “Greenland Climate Network: GC-Net,” in CRREL 96-27 Special Report on Glaciers, Ice Sheets and Volcanos. Editor S. C. Colbeck, 98–103. US Army Cold Regions Research and Engineering Laboratory.
Steffen, K., and Box, J. (2001). Surface climatology of the Greenland ice sheet: Greenland climate network 1995-1999. J. Geophys. Res. 106, 33951–33964. doi:10.1029/2001JD900161
van den Broeke, M. R., Enderlin, E. M., Howat, I. M., Kuipers Munneke, P., Noël, B. P. Y., van de Berg, W. J., et al. (2016). On the recent contribution of the Greenland ice sheet to sea level change. Cryosphere 10, 1933–1946. doi:10.5194/tc-10-1933-2016
Vandecrux, B., MacFerrin, M., Machguth, H., Colgan, W. T., van As, D., Heilig, A., et al. (2019). Firn data compilation reveals widespread decrease of firn air content in Western Greenland. Cryosphere 13, 845–859. doi:10.5194/tc-13-845-2019
Keywords: ice and climate, ice core, ice-sheet mass balance, polar firn, Greenland, local-scale variability
Citation: Xiao J, Rennermalm ÅK, Covi F, Hock R, Leidman SZ, Miège C, MacFerrin MJ and Samimi S (2022) Local-scale spatial variability in firn properties in Southwest Greenland. Front. Earth Sci. 10:938246. doi: 10.3389/feart.2022.938246
Received: 07 May 2022; Accepted: 26 September 2022;
Published: 21 October 2022.
Edited by:
Zoe Courville, Cold Regions Research and Engineering Laboratory, United StatesReviewed by:
Riley Culberg, Princeton University, United StatesKaitlin Keegan, University of Nevada, Reno, United States
Copyright © 2022 Xiao, Rennermalm, Covi, Hock, Leidman, Miège, MacFerrin and Samimi. This is an open-access article distributed under the terms of the Creative Commons Attribution License (CC BY). The use, distribution or reproduction in other forums is permitted, provided the original author(s) and the copyright owner(s) are credited and that the original publication in this journal is cited, in accordance with accepted academic practice. No use, distribution or reproduction is permitted which does not comply with these terms.
*Correspondence: Jing Xiao, ai54aWFvQHJ1dGdlcnMuZWR1