
95% of researchers rate our articles as excellent or good
Learn more about the work of our research integrity team to safeguard the quality of each article we publish.
Find out more
ORIGINAL RESEARCH article
Front. Earth Sci. , 25 August 2022
Sec. Geohazards and Georisks
Volume 10 - 2022 | https://doi.org/10.3389/feart.2022.938068
This article is part of the Research Topic Developments of Remote Sensing and Numerical Modeling Applications for Landslide Analysis View all 9 articles
 Andrea Wolter1*
 Caleb Gasston2
 Regine Morgenstern3
 Jason Farr1Brenda Rosser1
 Chris Massey1Dougal Townsend4Jon Tunnicliffe2
Landslide dams have been recognised as significant components of multi-hazard cascading systems, linking slopes and rivers. Despite the potential for catastrophic consequences, landslide dam breaching and evolution remain under-researched and poorly understood, often due to the remoteness of large volume, valley-blocking landslides and the general lack of high resolution pre- and post-failure survey data. The Hapuku Rock Avalanche presents a unique opportunity to study landslide dam evolution and breaching timelines due to the accessibility of the site and the availability and resolution of pre- and post-failure remote sensing data. Field observations and mapping, sampling, geophysical surveying, and 27 remote sensing surveys from 2016 to 2022 have provided detailed data on the dam. The Hapuku landslide was the largest rock avalanche triggered by the 2016 Mw 7.8 Kaikōura earthquake sequence, occurring ∼9 km upstream of the main highway and rail corridor on the South Island of New Zealand. It dammed the Hapuku River, which rapidly formed a lake behind the 80 m-high deposit. Four major erosion events and three significant partial breach events, identified through observations and remote sensing data differencing, resulted in water outflow from the lake, significant erosion of the dam and deposition of sediment into the river. The partial breaches correspond with less than 1 in 10-year rainfall events in 2017 and 2018, and the first occurred 141 days after dam formation. Seepage and internal erosion of the dam were observed to be progressing upstream before the partial breaches, in which water overtopped the dam. The third partial breach event, 2 years after dam formation, was the most significant erosional event in the last 6 years. The dam has eroded episodically and more locally since 2018, and the degree of erosion appears to be decreasing with time, despite more intense storms. A small lake remains. The evolution of the Hapuku Rock Avalanche dam emphasises the complexity of dam and breaching evolution, which are often oversimplified.
As components of cascading hazard systems, landslide dams present potentially catastrophic consequences for populations and infrastructure downstream (Costa and Schuster 1988; Fan et al., 2020; Morgenstern et al., 2021). Commonly occurring in remote mountain catchments, emergency managers may not be aware that a landslide dam has formed, let alone whether it will breach imminently or not. Breaching has frequently been simplified, as a paucity of data has not allowed for detailed studies. For example, numerical modelling of dam breaching requires key parameters such as peak breach flow, breach width, and failure time, but commonly does not include dam material properties and assumes a simplified hydrograph (see Davies et al., 2007; Peng and Zhang 2012; Okeke and Wang 2016; Zhong et al., 2018; Fan et al., 2021). Nonetheless, the increasing frequency of, and access to, high spatiotemporal resolution remote sensing data has allowed for more in-depth landslide dam case studies, such as the Hattian Bala landslide dam (Konagai and Sattar 2012), Yigong landslide (Delaney and Evans 2015), and Baige landslide dams (Zhang et al., 2019) (see also Frigerio Porta et al., 2020; Fan et al., 2021).
As part of a larger research programme (Earthquake-Induced Landscape Dynamics, see https://slidenz.net/theme-3) we are investigating the formation, longevity, and breaching of landslide dams in Aotearoa New Zealand to be able to better support decision-makers on this critical hazard. We are compiling a national landslide dam database, including detailed investigation of five case studies that were triggered by the 14 November 2016 Mw 7.8 Kaikōura earthquake (Dellow et al., 2017; Kaiser et al., 2017; Massey et al., 2018; Massey et al., 2019). Using one of these landslides, the Hapuku Rock Avalanche (HRA) near Kaikōura, as a case study, we showcase the importance of high spatiotemporal resolution remote sensing datasets in improving understanding of the longevity, breaching mechanisms, and evolution of landslide dams. Combining 22 epochs of satellite and unmanned aerial vehicle (UAV) photogrammetric, terrestrial laser scanning (TLS), and aerial light detection and ranging (LiDAR) data from 2016 to 2022 with field observations, particle size distribution (PSD) analysis, and electrical resistivity tomography (ERT) surveying, we present a detailed timeline of how the Hapuku landslide dam has evolved over the past 6 years. This high-resolution case study demonstrates the complexity of landslide dam evolution in the landscape and the interconnections between landslide source and deposit materials, as well as landslide deposits and fluvial systems. It contributes to the relatively sparse literature on landslide dam materials and detailed breaching timelines.
The Hapuku Rock Avalanche (HRA) is located in the upper reaches of the Hapuku River, 18 km from Kaikōura in Canterbury, New Zealand (Figure 1). State Highway 1 and the South Island Main Trunk Railway, critical infrastructure connecting the South Island, cross the river near its mouth approximately 9 km downstream of the HRA. With a source volume of ∼17 M m3, it was the largest rock avalanche of thousands triggered by the 2016 Kaikōura earthquake (Dellow et al., 2017; Massey et al., 2018; Massey et al., 2019). The landslide material comprises metasedimentary protolith of the early Cretaceous Pahau Terrane, so-called greywacke, and the landslide is located in a tectonically complex and active zone within the Australian-Pacific plate boundary (see Gasston 2018).
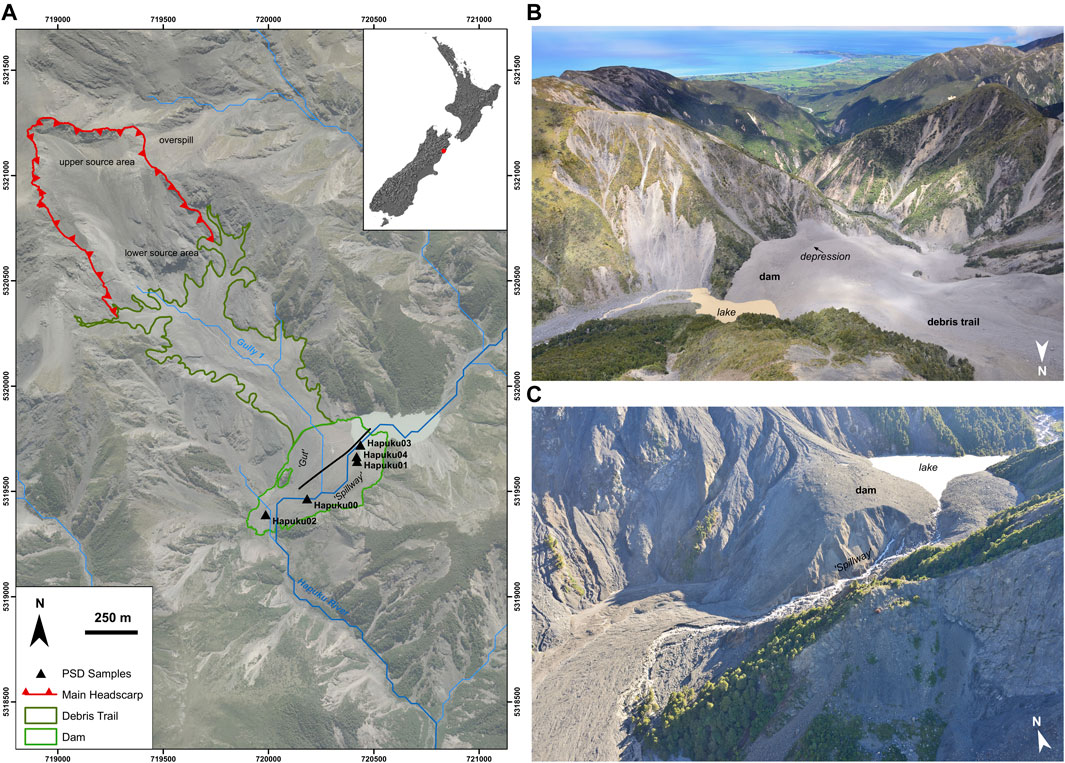
FIGURE 1. (A) The Hapuku Rock Avalanche (HRA), located in Canterbury, New Zealand. Main headscarp, two main source areas (labelled) and landslide dam are shown, as well as locations of particle size distribution (PSD) samples and the electrical resistivity tomography (ERT) survey (black transect). Note that debris spilled to the East during the HRA (labelled as “overspill”) and significant amounts of debris remain in the source area. The Hapuku River is shown in dark blue, and its tributaries in light blue (streams provided by NIWA). Coordinates shown are in UTM 59 G. Imagery: 2017 30 cm aerial imagery (LINZ 2017). (B) Shortly after the HRA emplacement and dam formation. Arrow points to semicircular depression discussed in text. (C) Shortly after the second major erosion event (see below), showing piping, overtopping, and headward erosion in the Spillway.
When the HRA occurred, it dammed the Hapuku River (catchment area above the dam of 8.8 km2) and an unnamed tributary (labelled Gully 1 in Figure 1A). The volume of the overall deposit, much of which remained in the source areas and Gully 1 (see red source polyline, upper and lower source area labels and dark green debris trail polygon in Figure 1A), has been estimated to be about 21 M m3 (Gasston, 2018). A lake quickly formed behind the ∼80 m-high deposit, and subsequently increased and decreased in size during storms and partial breach events, respectively (see below). Risk to the highway and railway line from a possible dam breach prompted Waka Kotahi (New Zealand Transport Agency) and Environment Canterbury to install a camera and lake level monitoring equipment shortly after the lake formed. A small lake remains today but is being infilled with sediment.
Several field visits to HRA have allowed for the characterisation of the source and dam material, observation of erosional and depositional events after storms, and description of the dam stratigraphy. Geomorphology mapping of the deposit, including identification of materials and lineations such as tension cracks and contacts between deposits, was completed at the beginning of 2017, before any significant erosion of the landslide deposit had occurred.
To quantify dam material particle size, particle size distribution (PSD) analysis was conducted using bulk sieve analysis of the dam subsurface material (Standards New Zealand 1986; Bunte and Abt 2001). Particle size sampling in the field was conducted using a sieve system where the sample was split at 16 mm (see Figure 2D). The PSD of the coarse fraction (>16 mm in diameter) was determined at half-phi intervals in the field using a combination of sieves, a gravelometer handheld template and measurements of particle b-axes. The PSD of the fine fraction (<16 mm) was determined using dry sieve analysis in the laboratory (at University of Auckland). Five samples were taken at different locations along the incised channel within the dam study area (the “Spillway”—see below) (locations indicated in Figure 1). We sieved between 200 and 470 kg of material at each site to ensure the mass of the largest particle in the sample was <10% of the overall sample mass, and thus that the samples were representative of the landslide dam material at that elevation (Standards New Zealand 1986; Bunte and Abt 2001).
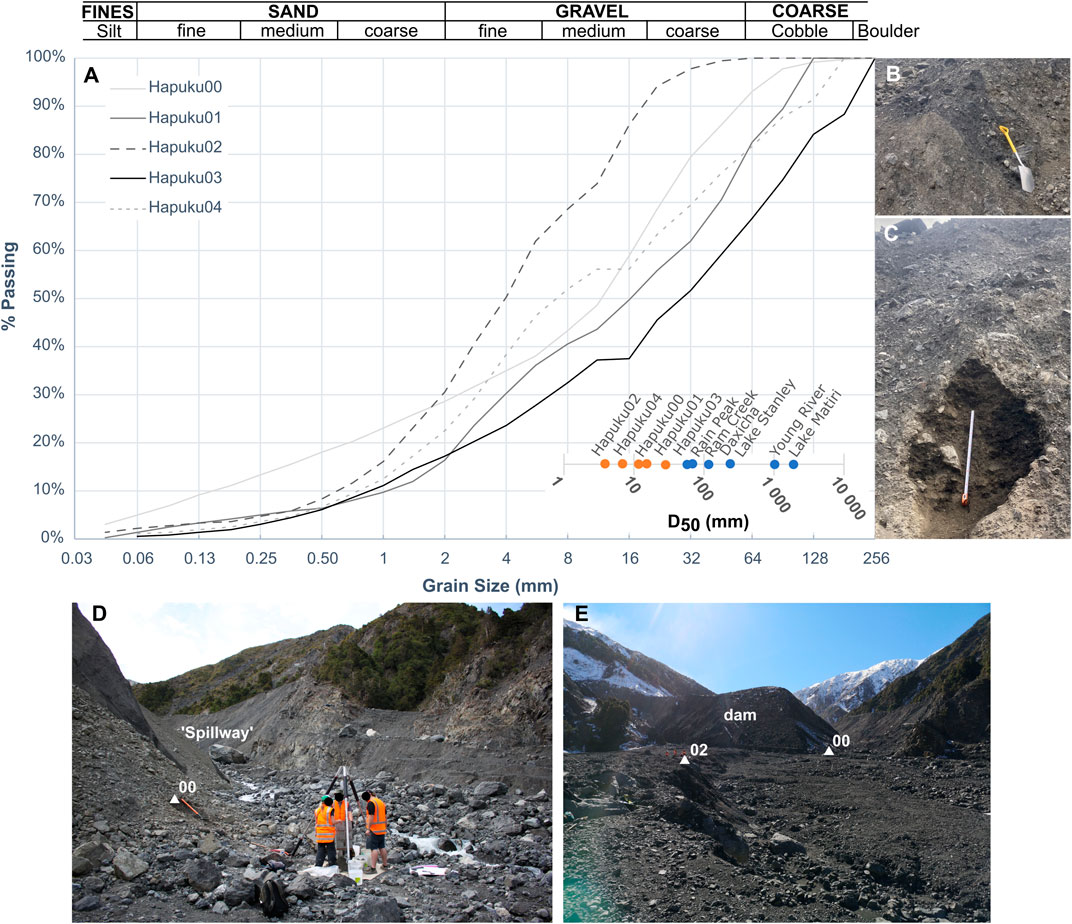
FIGURE 2. (A) Particle size distribution (PSD) curves for the five samples analysed at the HRA. Inset indicates the D50 (in mm), from left to right, of the Hapuku 02, 04, 00, 01, 03 (orange dots) and Rain Peak, Ram Creek, Daxicha, Lake Stanley, Young River, and Lake Matiri (blue dots) sites discussed in the text. Detailed view of (B) Hapuku03 and (C) Hapuku04 materials and sampling locations. (D) Hapuku 00 sampling location. Also shown is the field sieving apparatus used to sieve the >16 mm fraction. (E) Hapuku02 and Hapuku00 sampling locations (white triangles and shortened labels), and scale of deposits.
Dam face mapping was undertaken for two incised exposures at the HRA dam deposit, here called the “Spillway” and the “Gut” (Figure 1). The Spillway is an incised channel that formed in the main Hapuku River valley after the dam eroded, which is the main outflow channel. The Spillway dissects the dam deposit along an approximately NE-SW axis, i.e., approximately orthogonal to the direction of landslide debris transport and subparallel to the main river axis. The Gut is a deeply incised, highly active channel that has eroded in a headward direction during subsequent rain events and has remobilised material from the source areas (labelled and outlined with the red polyline in Figure 1A) and Gully 1 below the source. The Gut is located below the SW wall of Gully 1, with the mouth of the channel opening near the downstream toe of the dam deposit into the main river.
Electrical resistivity tomography (ERT) measures changes in the electrical properties of the subsurface to produce 2D or 3D images of the distribution of electrical resistivity (Perrone et al., 2014). Here, ERT was used to image the internal structure and basal contact of the main body of the deposit that dammed the Hapuku River valley. A single line was laid across the deposit, parallel to the axis of the Hapuku River valley (see Figure 1A). An Iris Syscal Pro resistivity meter was used to record resistivity measurements across 96 steel electrodes at 5 m separation, connected with multi-core cabling. Dipole-Dipole and Wenner-Schlumberger configurations were used to record resistivity data. To ensure good electrical connection between the electrodes and the ground surface, contact resistances were measured for each electrode pair. Where the contact resistance at an electrode was found to exceed 30 kΩ, electrodes were repositioned, or additional electrodes were added. ERT data were initially processed in SurferTM to sort the measurements and remove any noisy data. The raw data were plotted as pseudosections to visualize the spatial variations. The edited data were then inverted in Res2DInv™ to produce resistivity models of the subsurface with varying smoothness constraints and misfit tolerances (Loke and Dahlin 2002). The 2D inversion model shown in Figure 6 was generated from the data collected using the Dipole-Dipole protocol; the inversion model utilised 4,031 data points, with an absolute error between the data and the model of 5.8%.
To capture significant changes in the HRA and surrounding landscape, 22 separate survey periods (epochs) of the HRA were completed between 2016 and 2022. In total, 27 different ground models were captured using four survey methods:
1) Regional digital surface models (DSMs): regional aerial photogrammetric surveys producing 30 cm enhanced compression wavelet (ECW) mosaics and 1–2 m resolution DSMs (see Massey et al., 2020 for detailed processing methodology).
2) UAV DSMs: site-specific UAV photogrammetric surveys generating cm-resolution orthomosaics and DSMs, captured using a Phantom 4 and/or Phantom 4 RTK UAV with ground control provided by a Leica GS14 or GS16 Global Navigation Satellite System (GNSS) antenna. Propeller AeroPoints were used as ground targets for surveys captured with the Phantom 4 RTK and these images were additionally post-processed using KlauPPK software. All models were generated using Agisoft Metashape software, and exported at 1 m resolution.
3) TLS digital elevation models (DEMs): site-specific TLS surveys producing high-resolution point clouds and post-processed to 10 cm resolution using Riegl’s RiSCAN Pro. Surveys captured pre-2019 were completed with a Riegl LMS-Z420i TLS, while post-2019 surveys were captured with a Riegl VZ-2000i TLS and point clouds were colorised using a Nikon D850 camera. For each TLS epoch, the scans were registered in RiSCAN Pro using GNSS positions. Fine multistation adjustments were then completed to correct any errors in the GNSS positions and orientations and ensure close positional matching between scans. Vegetation was filtered out and/or manually removed. From these processed point clouds, 1 m resolution DEMs were generated using an inverse distance weighting (IDW) spatial interpolation method within GeoCue’s LP360.
4) Aerial LiDAR DEMs: targeted regional aerial LiDAR surveys flown by AAM, Aerial Surveys and LandPro generating 10–25 cm ECW mosaics and 1 m resolution DEMs of the Hapuku River valley.
The capture date(s) and average spatial resolution of each data type are presented in Table 1 (see also Figure 7).
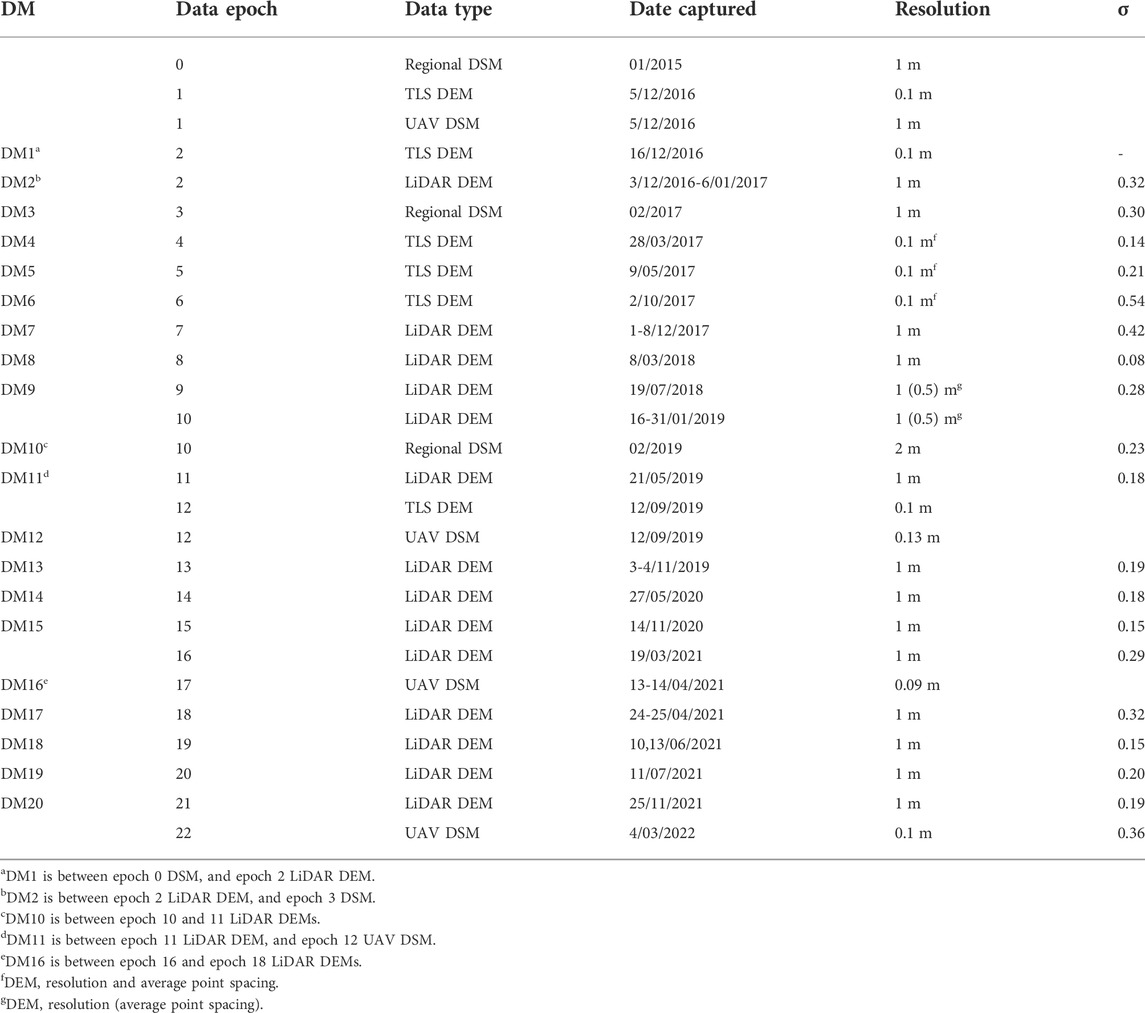
TABLE 1. Dates captured and resolutions of datasets covering the HRA landslide dam. Average point spacing is listed for the datasets used to complete 3D differencing and volume calculation. DM, difference model numbers between data epochs as indicated, and σ, standard deviation from bootstrapping (adjusted means were all 0).
All available datasets were compiled into a geographic information system (GIS) in ESRI’s ArcMap. Where necessary, aerial LiDAR DEM and regional photogrammetry DSM datasets were resampled to 1 m resolution using a bilinear spatial interpolation method to ensure rasters had the same spatial resolution and grid centres. Each dataset was then clipped to a consistent spatial extent (shown as the outline of the triangulated irregular network (TIN) model in Figure 9A). Two-dimensional change detection analyses were completed between epochs by differencing subsequent surveys, using the ArcGIS “Minus” tool. In addition, all ECW mosaics were visually assessed to detect change between each epoch, which, in combination with the difference models, allowed partial breach events to be identified and analysed, as well as changes in the dam front and lake to be mapped. “Stable” areas where no change seems to have occurred were also identified.
Bootstrapping (Efron and Tibshirani 1993) was used to estimate the statistical variance of each difference model. This was completed following the method described in Massey et al. (2020), by creating samples from each difference model (from the stable areas), with each sample containing 1,000 points, and the statistics calculated for each bootstrap sample. The bootstrap mean (μ) and standard deviation (1σ) were then determined for each difference model (see Table 1). Where μ was >0.1 m, the systematic offsets were adjusted on the most recent of each survey epoch pair, after which bootstrapping was repeated to ensure μ was zero on the subsequent iteration of the difference model. The 1σ was then used to estimate the uncertainty of each difference model. The effects of vegetation in DSMs generated from UAV and aerial photography were negligible, as the Hapuku landslide dam remained unvegetated throughout all epochs. The generated DSMs therefore provided an accurate position of the dam surface.
In addition to the differencing in ArcGIS, we used the pre-event, InSAR-adjusted 2015 DSM (Massey et al., 2020) and post-event aerial LiDAR and TLS datasets bracketing pre- and post-dam formation as well as each inferred or known significant partial breach event (see below) to difference point clouds in 3D and obtain accurate volume estimates for the original dam deposit and main erosion events (Table 1; see Figure 9A for survey epoch extents).
Point clouds from all sources (DSM, aerial LiDAR and TLS) were then imported into Leica Cyclone 3DR to check alignment and complete volume change analysis. To obtain volume changes between data epochs, two tools were used: 1) a mesh-to-mesh comparison tool, which uses meshes derived from the point clouds, produces a heat map indicating change between the point clouds, and 2) a cut/fill tool, which uses DSMs to calculate the volumetric gain or loss of material between two datasets using a vertical reference (see Farr et al., 2022 for mesh creation procedure). The volume calculations were computed using the extents of the smaller of the two datasets in each pair bracketing each significant partial breach event, as well as for each pair of datasets for the maximum overlap among all datasets analysed (black outline in Figure 9A).
To qualitatively evaluate changes in the study area between the targeted and regional remote sensing survey campaigns, we analysed 3 m-resolution Planet satellite imagery and ad hoc aerial photographic surveys. This allowed us to better constrain dam erosion events, lake level fluctuations, and other changes.
The protolith material comprises “greywacke”—metamorphosed and deformed argillite and sandstone–that varies from completely crushed to pseudo-intact rock mass with structures preserved (see below). The HRA source areas comprise sheared and folded greywacke. The dam material is generally well-graded (poorly sorted) and matrix-supported, with particle sizes ranging from silt and clay to boulders. The largest boulders observed had a-axes of ∼6–8 m (longest dimension of clast). Samples Hapuku01, 03, and 04 were taken in Facies 3 (see below for facies descriptions), Hapuku00 was taken in Facies 2, and Hapuku02 downstream of the dam toe in the Hapuku River alluvium (Figures 1, 2).
Particle size distribution analysis from the five samples indicates that most material (>50%) is gravel-sized; the D50, the particle diameter at which 50% of the sample is finer, ranges from 4 to 30 mm (fine to coarse gravel) (Figure 2; Table 2). The coefficients of uniformity (Cu) indicate that Hapuku00 is the most well-graded and Hapuku02 the most well-sorted (poorly graded) of the five samples. The coefficients of curvature (Cc) for Hapuku00, Hapuku02, and Hapuku03 are between 1 and 3, suggesting smooth and relatively flat curves (indicative of well-graded samples). Hapuku01 and Hapuku04 have Cc < 1, indicating steep, uneven curves (and less well-graded samples). The two downstream-most samples (Hapuku00 and Hapuku02) do not contain much coarse material, and the coarsest sample (D60 of coarse gravel) is Hapuku03. Hapuku03 was sampled in the upper Spillway that formed in 2018, where fines were washed out and boulders armour the current channel.
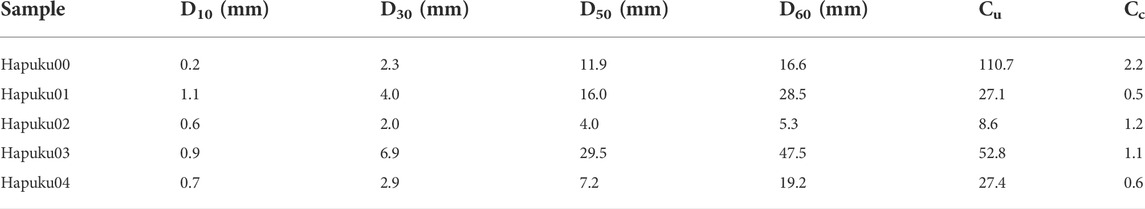
TABLE 2. Summary of PSD curves for the five samples analysed at the HRA. DXX is the particle diameter at which XX% of the sample is finer. Cu is the coefficient of uniformity and Cc is the coefficient of curvature.
Most existing literature on dams discussing particle size refers to deriving laboratory-scale equivalent samples to test in flumes (see Zhou et al., 2013; Shi et al., 2015; Wang et al., 2018; Zhu et al., 2019). These tests on scaled samples aim to simulate breaching to investigate dam failure mechanisms and timing. Nonetheless, there is debate as to how representative these scaled samples are of the dam-forming materials.
Only few studies have analysed particle size in the field. For example, Zhao et al. (2013) tested the effect of sample size on volumetric sampling within 1 × 1 × 1 m cubes excavated from the surface at Donghekou Landslide, China, which was triggered by the 2008 Mw 7.9 Wenchuan earthquake and comprises Cambrian dolomitic limestone protolith with coal laminae. They determined D50 ranging from ∼15 to ∼190 mm, and most material (25–74%) was found to be gravel-sized for four distinct landslide facies. Average Cu values were >10, indicating poor sorting. Other studies on landslide dams in New Zealand cite mean surface particle sizes between 60 and 2000 mm (Nash 2003; Massey et al., 2013).
Our results show that the HRA dam material is finer-grained than other landslide deposits reported in the literature. This may be due to the sampling location–within the core of the landslide deposit, rather than at the surface. Mean surface particle size may be affected by armouring or lag deposits. It could also reflect other factors, such as the fractured nature of the source rock, the distance travelled (almost 2 km), and the sediment transport mechanisms within the rock avalanche.
We noted several morphological and hydrological features within the dam deposit shortly after dam emplacement (Figures 1B, 3). Several secondary flows had travelled in ephemeral channels from the slope above the dam onto the deposit. Tension cracks within the main HRA deposit were observed in the field and indicated secondary slumping. Distally, pressure ridges formed, and possible boundaries between coarser and finer grained deposits were identified (“possible contacts” in Figure 3). An approximately semi-circular depression had formed on top of the deposit during emplacement (Figure 1B). An outflow channel would later develop in this location as internal erosion occurred and overland flows took advantage of the relative topographic low (Figures 1B,C). The depression formed perpendicular to the direction of emplacement and corresponds closely with the pre-event river channel location. Several seepage outlets showed signs of migrating toward the lake.
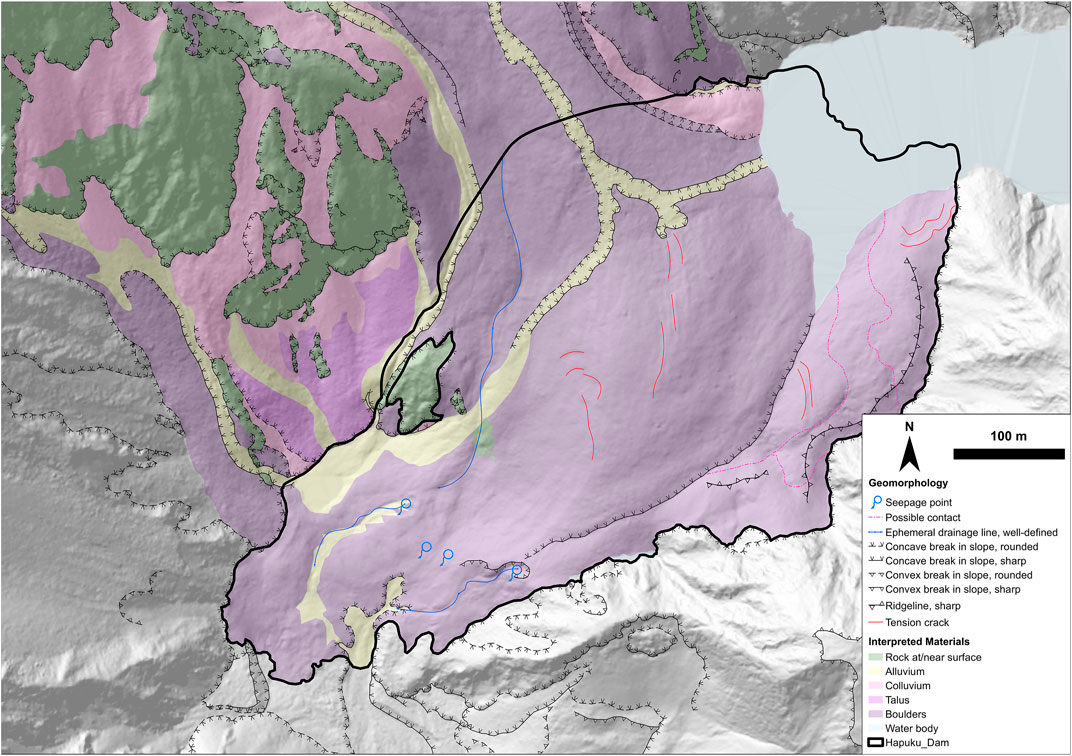
FIGURE 3. Morphological map of the HRA dam deposit, showing materials, lineations, and seepage points within the dam that were mapped shortly after it formed. (Epoch 2 LiDAR DEM as base layer.)
Dam face mapping of the true right of the Spillway and true left of the Gut exposures (Figures 1, 4), completed after major erosion events that exposed the dam interior, indicate five facies in the dam stratigraphy (Figure 5):
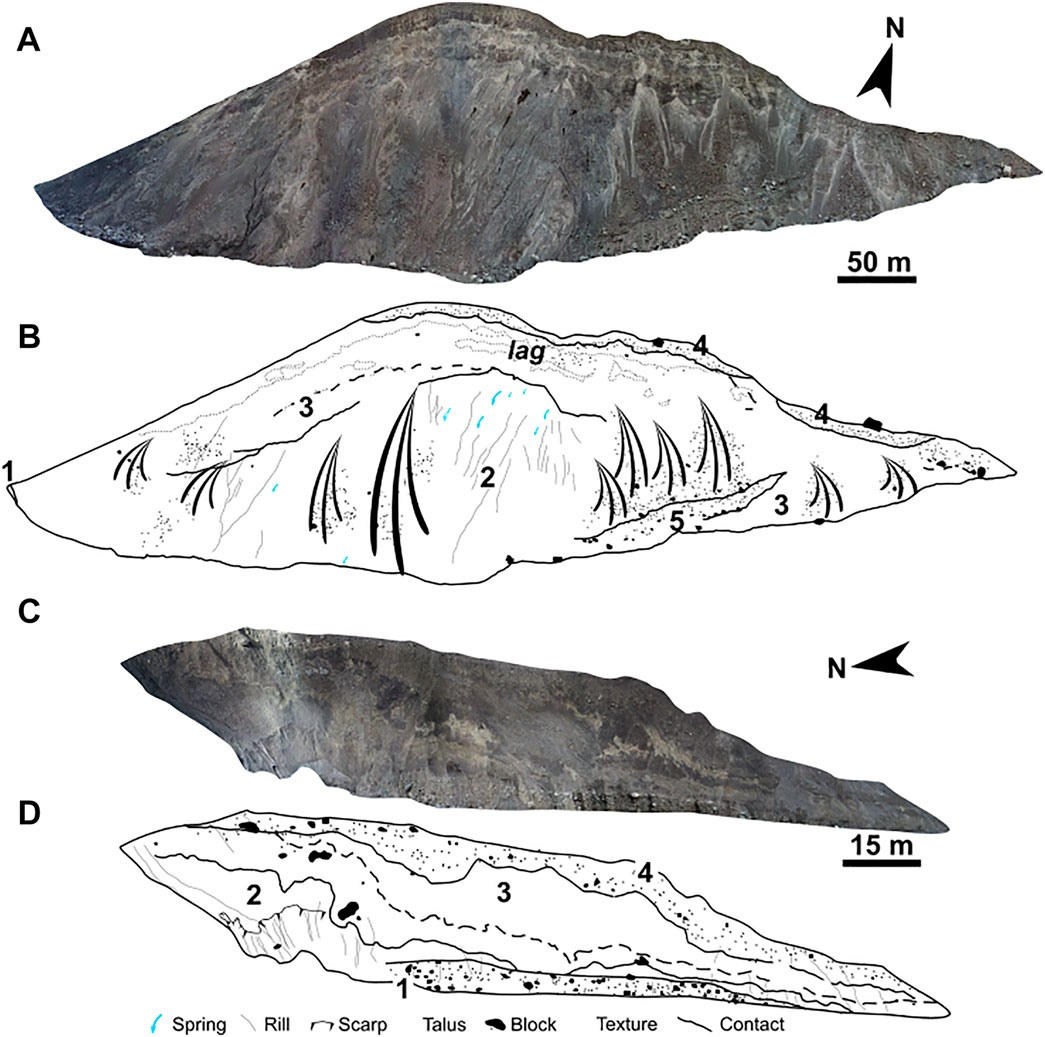
FIGURE 4. UAV photogrammetric models (captured in April 2021) and digitised dam face maps of the true right of the Spillway (A) and (B) (representing a lateral cross-section of the dam) and true left of the Gut (C) and (D) (representing a longitudinal cross-section of the dam). Rills include small gullies in deposit and talus, and scarps indicate secondary movement of dam debris. Texture includes flame structures, internal shears, etc. Numbers correspond to facies described in text and Figure 5.
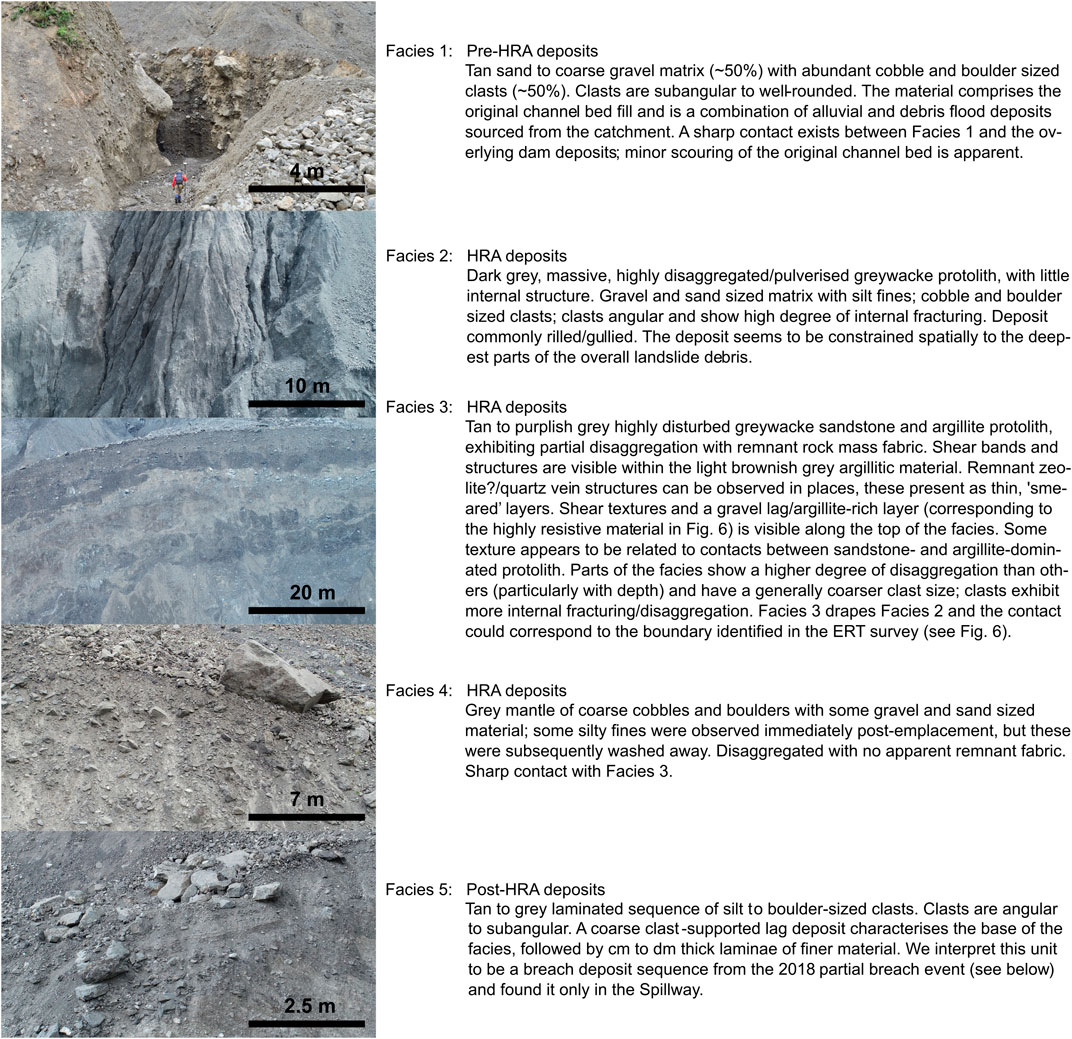
FIGURE 5. Examples and descriptions of facies identified from dam face mapping of the HRA dam.
Facies 1 predates the HRA and includes existing alluvium and colluvium that is significantly coarser than the facies overlying it. Facies 2, 3 and 4 are part of the HRA emplacement sequence. Facies 2 is similar to in situ rock low in the source area–a massive sandstone. Facies 3 is similar to in situ rock much higher in the source area, near the crest of the slope. Hence, it is possible that these two facies represent two landslide sources. Ongoing work is investigating this hypothesis. Facies 4 could have occurred as another rock avalanche, the extent of which corresponds to the distal-most possible contact on Figure 3. This coarser “mantle” of the deposit does not reach the full extent of the HRA deposit, suggesting it is a secondary, smaller failure with lower runout distance. Facies 5, as observed in the field, was deposited during the 2018 partial breach event as a flood deposit and is only preserved in isolated locations along the Spillway channel. Other debris flood deposits related to other significant partial breaches may be buried (see next section).
The electrical resistivity of the interior of the dam is mainly a function of porosity, ground water saturation, grain size, and mineralogy of the clasts and matrix (Archie 1942; Glover 2015). The 2D inversion model shows a layered structure comprising four main resistivity units (Figure 6). The layering is approximately parallel to the dam surface with some variations at the ends of the section and at depth. Values of resistivity within the dam deposit range from 50 Ω.m to 7,500 Ω.m, with mean and median values of 430 Ω.m and 290 Ω.m, respectively.
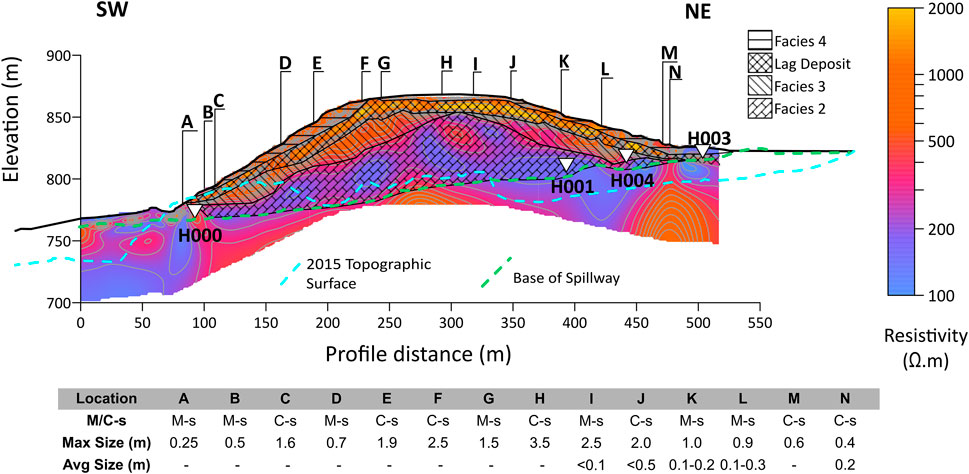
FIGURE 6. ERT results from the NE-SW profile across the HRA dam. Hashed areas show facies (including the lag deposit at the boundary between Facies 3 and 4) identified in the dam face mapping (see Figure 4). Green dashed line is the base of the Spillway, blue dashed line is the pre-event 2015 topography at the Spillway. White triangles represent the PSD sample locations, projected onto the profile. Letters and table refer to a clast size profile taken along the ERT line on the surface of the dam. M-s, matrix-supported, C-s, clast-supported, max size, maximum particle size observed at surface along profile, avg size, average particle size observed at surface along profile. See Figure 1A for survey line location.
The highest values of resistivity are observed down to a depth of 30–40 m from 80 to 300 m along profile and to a depth of around 15 m from 300 m along profile to the NE extent. Here, resistivity typically ranges from 500 Ω.m to 2,000 Ω.m. Within this zone, at a depth of approximately 10 m is a discrete, semi-continuous zone of high resistivity (1,500 Ω.m to 7,500 Ω.m). Referring to the facies map of the “Spillway” (Figure 4), we infer that the upper portion (to a depth of ∼10 m) corresponds with Facies 4 and the discrete high resistivity zone relates to a “lag deposit” (labelled lag on Figure 4B and hashed in Figure 6) within Facies 3 at the contact with Facies 4. The surface grain size is coarsest where the resistivity values are highest along the profile.
Below this, resistivity decreases with increasing depth down to around 60–100 m depth, where values of resistivity are around 150 Ω.m. Below 60–100 m depth, resistivity increases again. The decreased resistivity in the area of Facies 2 compared to the area corresponding to Facies 3 may relate to increased hydraulic conductivity or changes in grain size. The ERT data indicate that the area coinciding with Facies 2 is a reasonably homogeneous mass, correlating well with field observations of the massive, comminuted Facies 2 deposits. The PSD samples also corroborate the ERT interpretations, as Hapuku00 (sampled in Facies 2) is finer-grained and more well-graded than Hapuku01, Hapuku03, and Hapuku04 (sampled in Facies 3).
The area below Facies 2 exhibits moderate to high resistivity (400–1,500 Ω.m), which generally increases with depth. This zone likely corresponds to the remnant pre-failure material, either channel fill materials or highly weathered greywacke. Hence, in some parts at least, the base of Facies 2 may represent the base of the deposit. A significant grain size change was observed across the boundary between Facies 1 and the overlying deposit, Facies 1 being much coarser than the overlying materials. Significant change in the electrical properties of the materials is thus expected (Archie 1942). Additionally, the resistivity data may show that the pre-failure material was scoured when the HRA was emplaced (see 2015 pre-vs. post-emplacement topographic profiles on Figure 6).
Immediately downstream of the lake (500 m along profile in Figure 6), a zone of lower resistivity values, like those in the zone of Facies 2, form a halo around a segment of the high resistivity zone within Facies 3. At the surface here, fine silt- and sand-sized sediment can be observed. The fine-grained materials were deposited by the lake when its level was much higher. The fine sediment may have been transported into void spaces as water percolated down through the deposit from the lake. The lower section of the halo likely relates to present day infiltration of water from the lake, transporting fine lake sediment. Additionally, at the SW end of the profile (<70 m) a thin zone of lower resistivity, a few metres thick, can be seen overlying a zone of moderate resistivity (elevation ∼760 m), followed by another zone of lower resistivity at depth (elevation ∼755 m). Here again, fine-grained material has been deposited at the surface as a result of post-breach debris floods (Facies 5). The interlayering here could represent deposition from different partial breach events.
The 2D and 3D differencing shows substantial changes within the HRA dam study area from 2016 to 2022 (Table 3; Figures 7, 8). The original dam volume (light green outline, Figure 1A) was approximately 6.6 M m3, based on 3D differencing between the pre-event, InSAR-adjusted 2015 DSM (Massey et al., 2020) and post-event epoch 2 LiDAR DEM. Comparing the epoch 2 DEM to the March 2022 UAV data (epoch 22) indicates a net erosion of −1.7 M m3 within the dam deposit. Using the debris trail and dam polygons in Figure 1A to outline the debris, at least 6.2 M m3 of the 21 M m3 deposited has been eroded (from 2017 until 2021). Most of the erosion has occurred in the midslope along Gully 1 (∼4.5 M3) and in the Spillway. Roughly 2 M m3 of pre-event material has been eroded from Gully 1. This means that 30% of the original deposit formed the dam (6.6/21 M m3) and up to 9 M m3 of material remains above the Hapuku River valley, upslope of the dam, 5 M m3 of which is in the source area and ∼4 M m3 in Gully 1. Some of the eroded material has been transported downstream. Periodic rockfalls on the true right slopes 200 m downstream of the dam have deposited material at the slope toe on existing talus, particularly evident in DMs 2-9, 18, and 20 (Figures 8, 9).
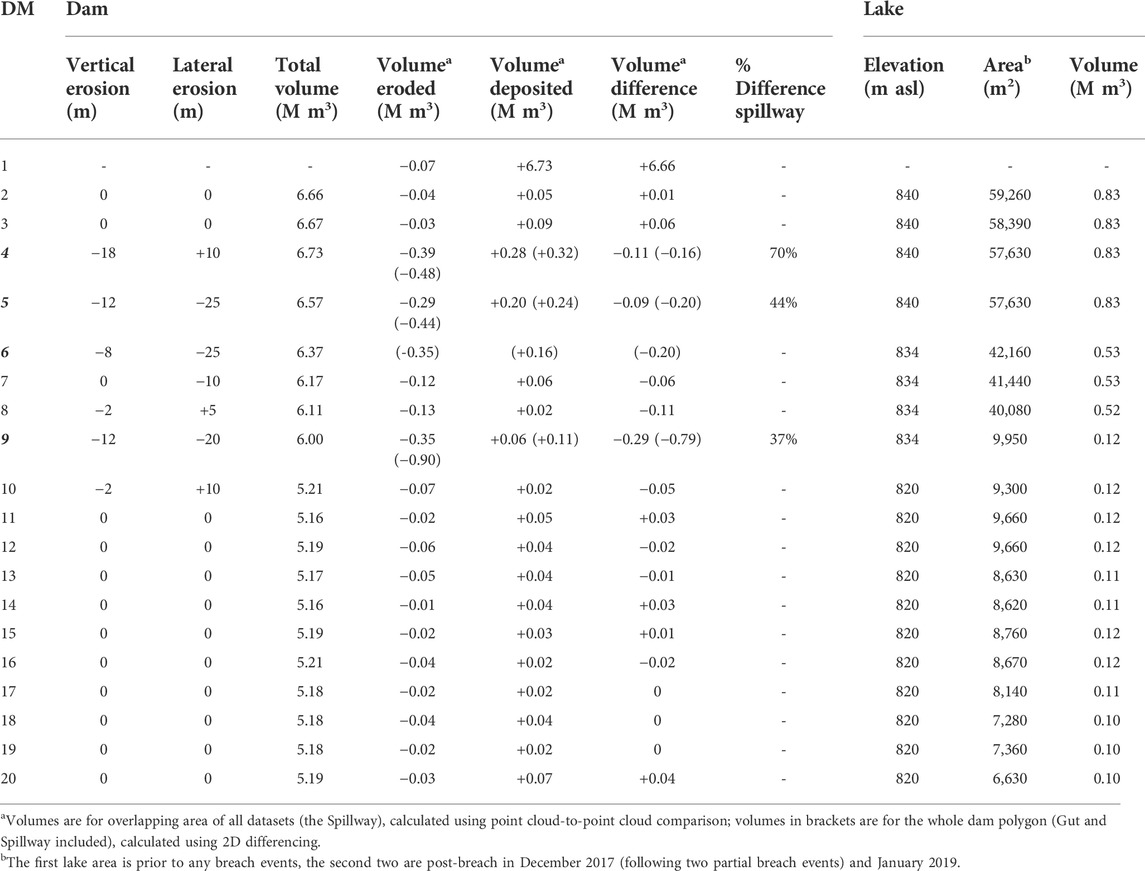
TABLE 3. Changes to the HRA dam and lake documented in the remote sensing datasets (see also Figure 7, Table 1). DM, difference model, and bold italicised numbers represent major erosion events (see text). Vertical and lateral erosion of the dam refer to incremental changes in profile B-B’ (Error! Reference source not found.), measured from the lowest point in each epoch (corresponding to stream thalweg after erosion of the Spillway). Volume changes are derived from 3D point cloud-to-point cloud and 2D raster comparison bracketing each of the four major erosion events. The % difference is how much of the volume difference in each erosion event occurred in the Spillway. Lake elevation is approximate.
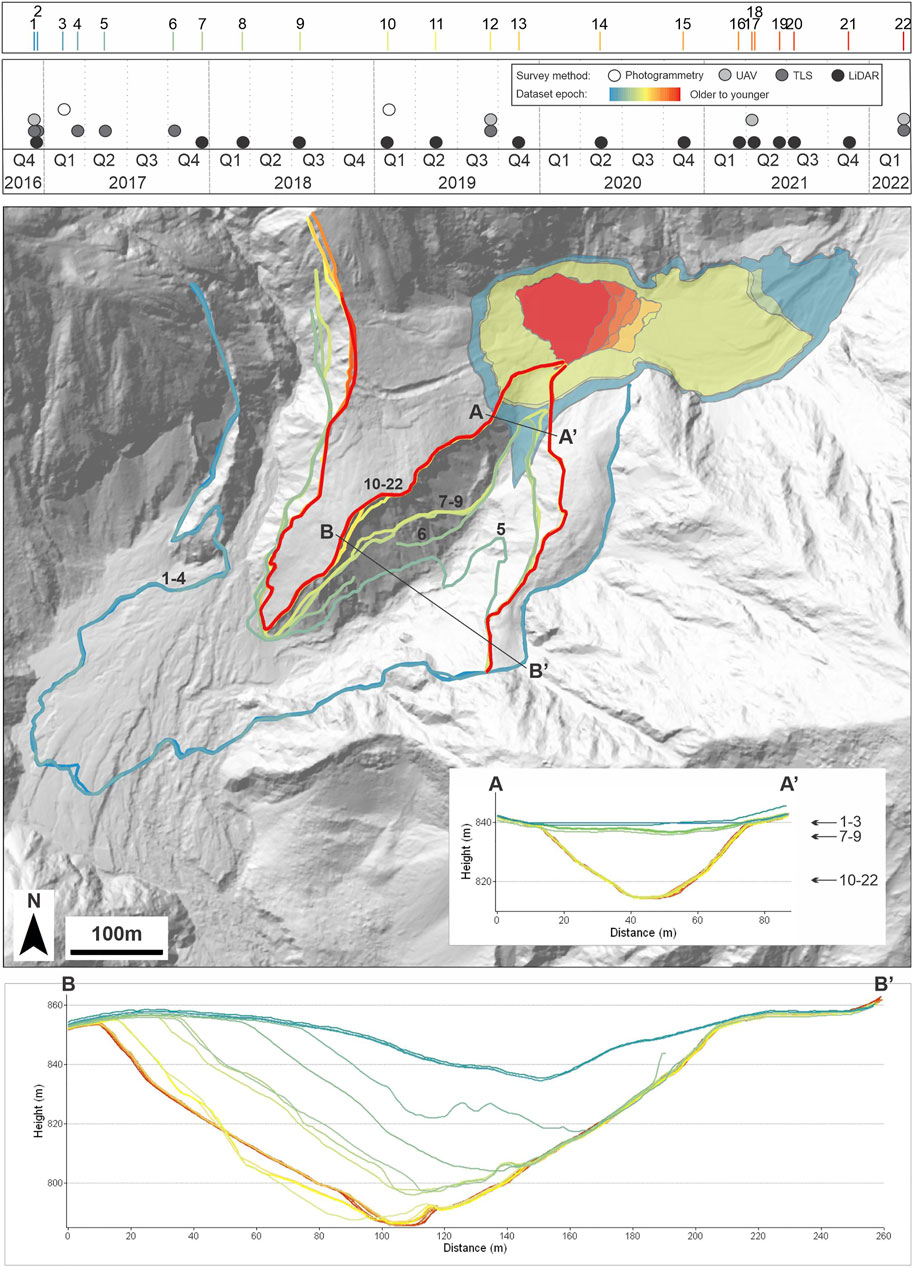
FIGURE 7. Evolution of the HRA dam deposit and lake from 2016 to 2022, mapped as lines and polygons corresponding to the dam and lake extents, respectively, over time. Colours correspond to the data epochs in Table 1, and the warmer the colour, the more recent the dataset. Epochs and types of remote sensing data used in analysing the HRA are represented in the top panel. Two profiles along the Spillway, with lake level change indicated in A-A′, are also shown. Numbers correspond to dataset epochs.
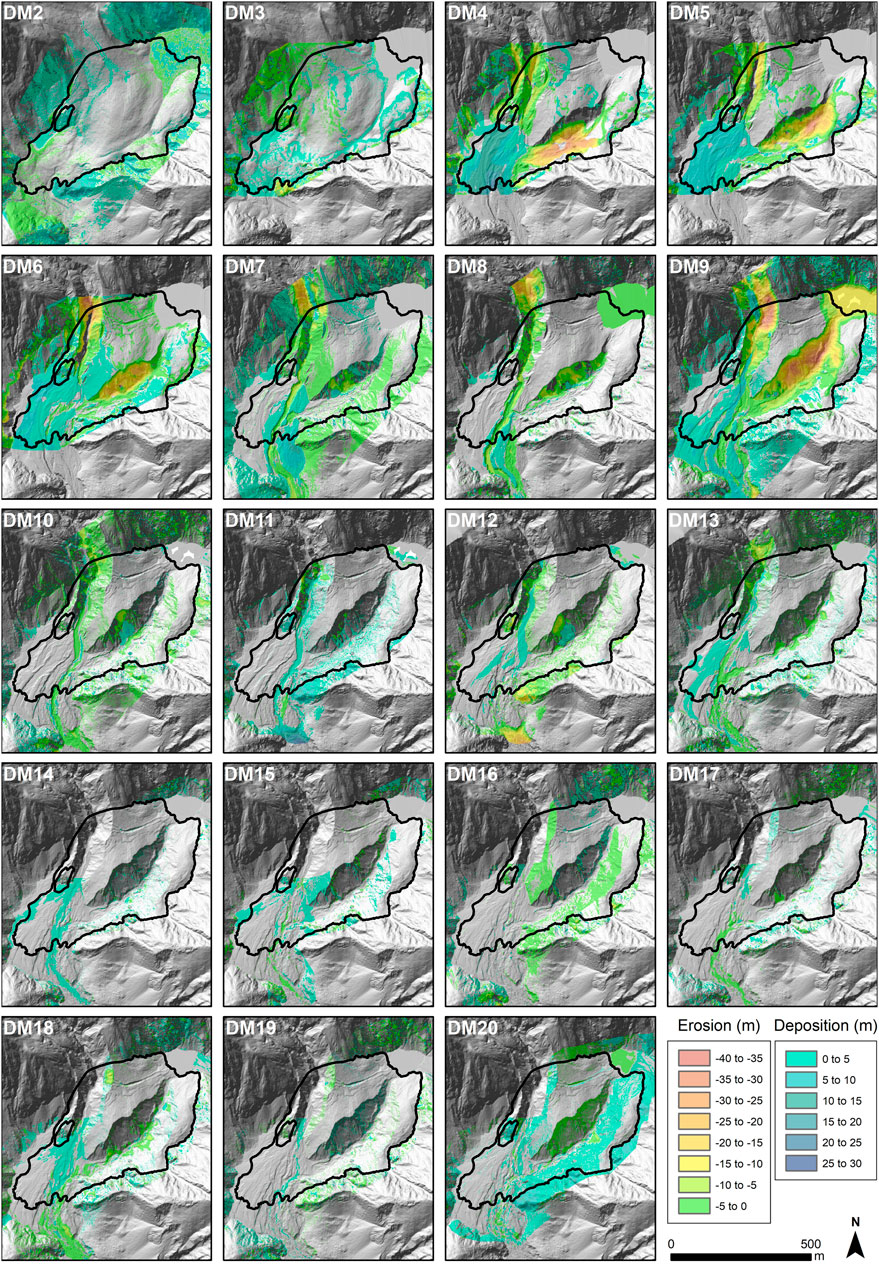
FIGURE 8. 2D differencing of all epochs post emplacement (DM = difference model number). See Table 1 for details. Base data are: 2016 epoch 2 LiDAR DEM (DM2-3), 2017 epoch 7 LiDAR DEM (DM4-6), 2018 epoch 8 LiDAR DEM (DM7), 2018 epoch 9 LiDAR DEM (DM8), 2019 epoch 11 LiDAR DEM (DM9-11), 2020 epoch 14 LiDAR DEM (DM12-13), and 2021 epoch 16 LiDAR DEM (DM14-20).
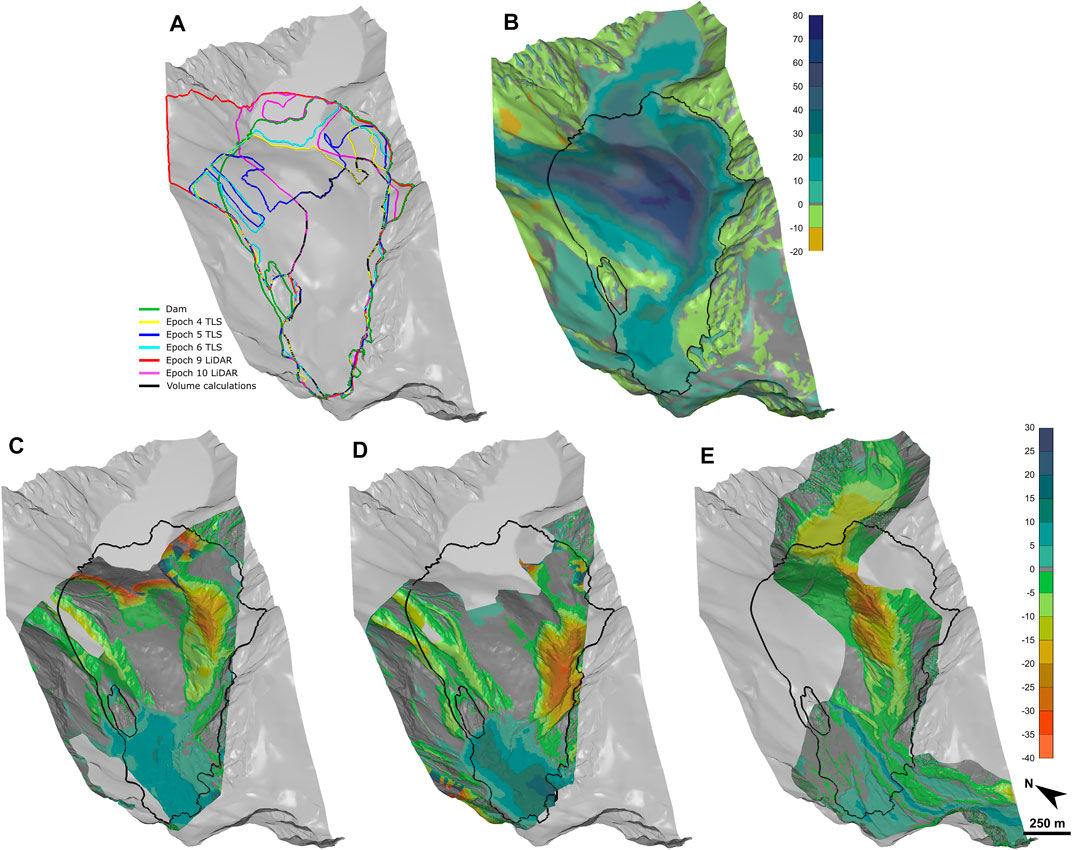
FIGURE 9. 3D differencing of selected epochs. (A) Extents of TLS and aerial LiDAR datasets used for 3D point cloud differencing and volume change calculations. The maximum extent analysed is indicated by the outline of the TIN model. The green polygon represents the mapped dam deposit extent. The area used for volume change calculations (black outline) is the overlapping extent of all datasets, which is limited by the TLS coverage. (B) 3D point cloud-to-point cloud differencing conducted on the 2015 InSAR-adjusted DSM and 2016 epoch 2 LiDAR DEM), and (C–E) the TLS DEM and aerial LiDAR DEM datasets bracketing the two 2017 (C–D) and one 2018 (E) significant partial breach events (see Table 3 for details). This view is looking upstream at the dam (black outline).
The dam has eroded significantly since its formation in 2016, particularly in 2017 and 2018 during the first moderately high-intensity rainfall events post-earthquake and dam emplacement. Four main erosion events, three in 2017 and one in 2018, have been identified from the differencing. Tens of metres of material were eroded vertically and laterally (A-A′ and B-B′ in Figure 7 and Table 3). Proximal to the lake, the Spillway channel has widened to 50 m (measured from dam deposit inflection point to inflection point) and the channel shape has been relatively stable since the start of 2019 (epoch 10; A-A′). At the downstream end of the Spillway channel, however, the channel has widened to ∼190 m and has migrated to the NW, cutting into the main dam deposit (B-B′). It has eroded below the pre-earthquake channel base level.
The 3D differencing of the major erosion events mentioned above indicates up to 40 m of vertical erosion within the dam during each event (Figures 9B–D). The first major erosive event, which occurred between 28 March and 20 April 2017 (during the period that Cyclone Debbie and Cook occurred, Figure 9B), eroded more than 30 m in the downstream part of what is now the Spillway, and two ∼10 m deep supra-deposit channels began to form in the Gut area. Up to 25 vertical m of material reworked from erosion of the dam was deposited in the active channel just downstream of the dam (Figure 8 DM4). Erosion and deposition volumes for the dam and Spillway are indicated in Table 3. Most (70%) of the volume change during this event occurred in the Spillway.
During the second major erosion event, which occurred between 12–19 September 2017, the Spillway channel propagated upstream toward the lake and NW into the dam, eroding a further 30 m maximum (Figure 8 DM5, Figure 9C). The Gut eroded a further ∼15 m vertically, and the true left supra-deposit channel became the dominant transport channel. Up to 10 m of material was deposited just downstream of the dam, forming an alluvial fan in the active channel. Erosion and deposition volumes are ∼435,000 m3 and ∼240,000 m3 (Table 3), respectively, and 44% of the volume change occurred in the Spillway.
Significant erosion and deposition continued to December 2017 (third erosive event), particularly in the Gut, with a further 30 m (maximum) of material eroded vertically in the Gut and 20 m lost in the Spillway, contributing to downcutting and widening of both the Gut and Spillway channels (Figure 8 DM6). During this period, deposition in the active channel just downstream of the dam was a maximum thickness of 6 m. Roughly 355,000 m3 of material was eroded and 155,000 m3 deposited (Table 3).
The fourth major erosive event, which occurred between 17 November and 3 December 2018, resulted in ∼40 m of vertical erosion within the Spillway, again undercutting the true right dam material and propagating upstream (Figure 8 DM9, Figure 9D). The deposition of the debris flood material (Facies 5) is not obvious in the remote sensing data. The Gut shows up to 35 m of vertical erosion in the sidewalls of the channel, due to secondary mass movements cutting into the main dam deposit. Up to 12 m of material was deposited in the channel at the base of the valley slope. Up to 8 m of material was deposited in the two main channels downstream of the dam, originating from the Spillway and Gut. Based on the volume calculations and differencing, the fourth major erosion event was the most significant erosional event in the vicinity of the dam, resulting in a loss of 12% of the dam volume (∼790,000 out of 6,600 000 m3). The fourth event also eroded a significant portion of the Spillway area but deposited relatively little material downstream. Most of the erosion (>60%) occurred outside the Spillway. It resulted in the greatest change in the lake size and level.
Overall, 25% of the dam has been eroded, primarily due to the four major erosive events, a total eroded volume of ∼1.7 M m3 for the four events. More than 500,000 m3 of material has been deposited in the river system immediately downstream of the dam in the area investigated. Additional material likely bypassed the immediate downstream area and was transported into the lower reaches of the Hapuku River valley, outside the extents of this study.
The lake area (and volume) also decreased significantly between its maximum in 2016 and the start of 2019. The first of two main lake decreases was related to the first and second dam erosion events in 2017. Planet imagery constrains the timing of the second main lake decreases to between 17 November 2018 and 3 December 2018 (i.e., during the fourth major erosion event). The lake area changed from an initial ∼60,000 m2 in 2016 to ∼6,500 m2 in March 2022, just 10% of its original extent. The lake level seems to have risen during storms, then dropped suddenly (within a few days) during major erosion events, gradually lowering to an equilibrium point over the months following each erosion event (see next section). Although the dam has eroded comparatively little since 2019, the lake continues to reduce in area. This is now due to sedimentation at the upstream end of the lake, forming a small delta.
Secondary failures (e.g., Figure 8 DM12 and DM18) have contributed to the continued loss of dam material, which is input into the Hapuku River system. These secondary failures form up to 10 m thick deposits, with volumes on the order of 10,000 m3. The major erosion events and continuing erosion of the dam material have resulted in boulder lags in both the Spillway and Gut channels, as well as an episodic decrease in the dam deposit size. The lag or armour may have slowed channel downcutting.
The Gut has continued to erode significantly on the slope above the Hapuku River valley, depositing material into the active Hapuku channel below the dam. This channel, sourced from Gully 1, has avulsed across the floodplain, variably undercutting Facies 1 on the true left of the channel (e.g., Figure 4) and spreading to the true right (Figures 8, 9). Since 2018, the stream originating from Gully 1 has become more channelised, flowing in discrete, braided channels rather than as wide, distributed flow. The main Hapuku River channel through the Spillway has remained comparatively stable since the start of 2019, migrating to the true right of the river (towards the NW) consistently (Figure 7) with minor incision.
According to field observations and our analysis of the 27 remote sensing datasets and lake level data provided by HARVEST, the complex evolution of the HRA dam system can be discretised into three main partial breach events, corresponding to the first, second, and fourth major erosion events above, along the main river channel (“Spillway” in the dam area; Figure 10). Here, we define (partial) breaching as any failure of the dam to retain the lake water and maintain storage capacity, including overtopping (any lake water flowing over the dam) and dam material erosion. A complete breach, where all lake water is evacuated, has not occurred at HRA. Partial breaching at HRA has occurred multiple times, and could occur rapidly, within minutes, or over several months, under this definition. The evidence of significant partial breaching at HRA includes:
• A sudden and dramatic increase in lake level of several metres, followed by a rapid drop of a few metres in less than a day and then a gradual decrease over several months (Figure 10)
• Significant reduction in lake area (Figure 7), and
• Significant erosion of the dam material (Figures 8, 9).
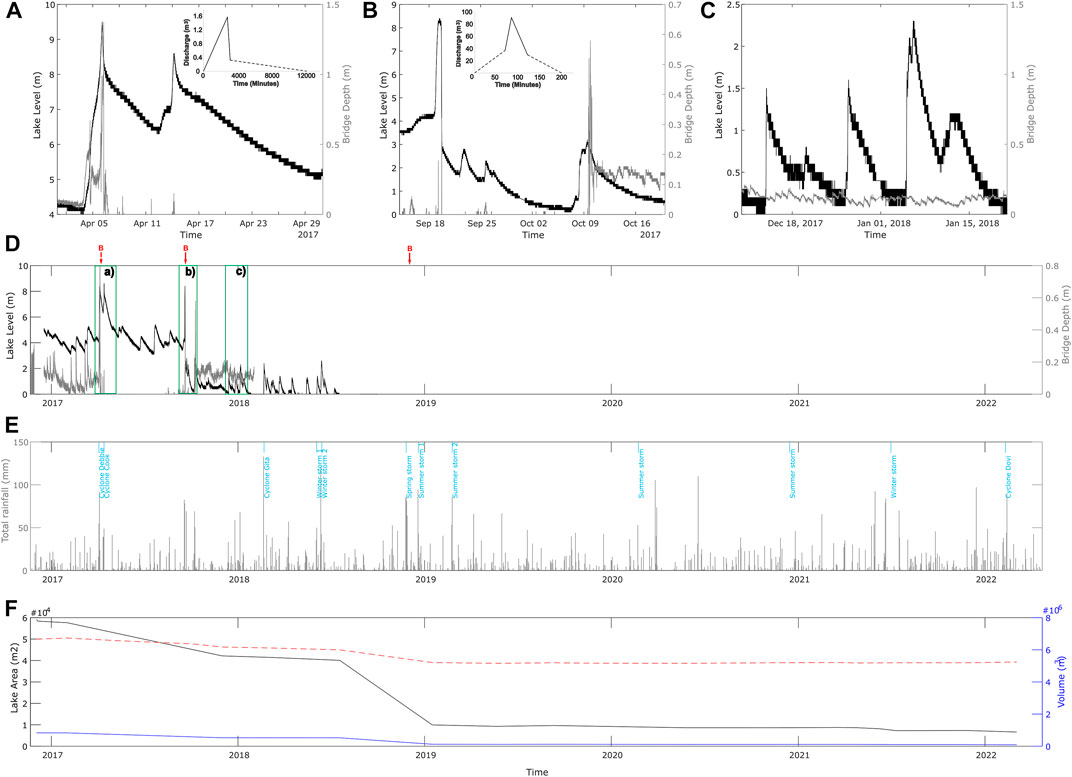
FIGURE 10. Breaching data for the HRA. (A) First and (B) second partial breach event lake level and river level at highway bridge ∼9 km downstream of HRA. Insets show estimated peak (solid) and average (dashed) simple hydrographs for each event. (C) Example of later lake fluctuations. (D) HRA lake level (left axis) versus river level at highway bridge (right axis). (E) Daily rainfall data and storm events. (F) Lake area (black, left axis) and lake volume (blue) and dam volume (red dashed) (right axis) changes from 2016 to 2022. Lake and river level data were provided by HARVEST, and rainfall (data provided by ECAN) is from the closest weather station at Clinton Ridge (roughly 4 km to the SE of the study site). Storms are indicated in blue, and significant partial breach events in red (“B”).
Based on the lake level and remote sensing data, as well as field observations, overtopping and internal erosion are the most likely breaching mechanisms during each event. Overtopping is the most common mechanism for dam breaching worldwide (Costa and Schuster 1988; Peng and Zhang 2012; Fan et al., 2021). In the days and weeks after dam emplacement, piping, as evidenced by springs in the dam sourced from the lake (see Figure 3), migrated upstream, and the downstream end of the dam slumped, raising concern that piping and erosion would cause the dam to fail suddenly. However, the first moderately high-intensity rainfall in April 2017 pre-empted this mechanism by raising the lake level and triggering overtopping at the lowest point in the dam crest. This resulted in the erosion of ∼400,000 m3 from the dam (Table 3), which formed an outflow channel. The outflow channel appears to have formed between two pressure ridges in the deposit. The depression (see Figure 1B) followed the course of the pre-event river channel closely, and its morphology was likely influenced by the pre-event topography. Between each of the significant partial breaches, we observed continued seepage and internal erosion (slumping, forming scarps).
The first significant partial breach developed over 9 days during Cyclones Debbie and Cook from 6–14 April 2017. During Cyclone Debbie, the first part of the partial breach led to the development of a debris flood that was measured at the State Highway 1 bridge (HARVEST/ECAN stage gauge), approximately 9 km downstream, 40 min after the peak in lake water level. The Hapuku River was already in flood from Cyclone Debbie rainfall, and river levels at the bridge were high before the Cyclone Debbie partial breach occurred. According to HARVEST lake level data, the lake level continued to drop at a decreased rate until Cyclone Cook caused another rapid increase and subsequent decrease in lake level in the second part of the partial breach (Figure 10). The bridge gauge downstream indicates a minor response to the second part of the partial breach, with river level increasing to maximum 0.15 m above base level 20 min after the peak in lake water level (corresponding to a flow velocity of 7.5 m/s).
The second significant partial breaching event occurred between 18 and 19–22 September 2017 (Figure 10). The lake rose rapidly on 18 and 19 September, dropping suddenly from 9.5 m above base level to <3 m on 19 September. The peak discharge reached the highway bridge about an hour after the lake level started to decrease rapidly, resulting in an increase in river level of 0.32 m. The simplified breach hydrograph indicates a peak discharge of ∼90 m3/s, significantly higher than the first partial breaching event (compare Figures 10A,B insets). We will discuss breach hydrographs more in a future paper.
Less than a month later, on 8 October 2017, the lake level increased suddenly again from <1 to 3.1 m above base level, in response to a high rainfall event (Figure 10B). The level of the river at the bridge rose to 0.6 m above base level on the evening of 9 October. The lake very gradually drained over the next few days, reaching base level on 19 October. We do not classify this as a significant partial breach, given the protracted period of draining and slow response downstream. However, it could have contributed to erosion of the dam during the third erosion event mentioned above.
The third significant partial breach event is indicated in the remote sensing data by a decrease in dam volume (from ∼6 M m3 to 5.2 M m3) and a significant decrease in lake level, area (Figure 7), and volume (from 0.53 M m3 to 0.12 M m3). This is the single largest decrease in lake volume from 2016 to 2022. It corresponds to significant erosion of the Spillway, which likely indicates a shift in reservoir storage capacity. Note that the 4 months preceding the third significant partial breach (July-October 2018) was the driest period between 2017 and 2022, with the lowest cumulative rainfall (196.5 mm over the quarter). From Planet imagery, the lake level could have dropped slightly during this dry period, but would have risen and fallen rapidly between 17 November and 3 December 2018 during the rainfall event.
The first and third partial breaches occurred during autumn (Cyclones Debbie and Cook) and spring storms, respectively (Figure 10; Table 4). No storms per se were identified at the time of the second partial breach, but rainfall during this period—between 18 and 19 September 2017—was higher (>75 mm each day) than the mean daily rainfall of 4.8 mm recorded at the closest weather station (Clinton Ridge, ECAN). The Annual Recurrence Intervals (ARI) for all four rainfall events were less than 10 years based on HIRDS data from NIWA (https://hirds.niwa.co.nz). The total and average rainfall between remote sensing data acquisitions is listed in Table 4. The average rainfall was highest for the first major erosion period and lowest for the second. The total rainfall over the storm and epoch were highest for the fourth major erosion period. This correlates well with the amount of erosion and deposition during each major erosion event.
TABLE 4. Rainfall at Clinton Ridge weather station (data provided by ECAN) for the storms correlating with the three significant partial breach events. 1a and 1b are Cyclones Debbie and Cook, respectively.
Considering other high rainfall periods at Clinton Ridge station between 2016 and 2022 (Figures 10C–E), it seems major erosion and deposition events in the dam system have decreased and become more localised, despite similar rainfall intensities. For example, the 17–19 July 2021 winter storm and 12–13 February 2022 Cyclone Dovi rainfall events, two of the more significant storms after 2018, had similar storm totals to those in the first and second significant partial breach events (112- and 133-mm storm total rainfall, respectively), but only resulted in minor erosion of the steep Gut and Spillway slopes within the dam and 5,000–7,000 m3 loss in lake volume.
Surprisingly, Cyclone Gita (20–21 February 2018) does not seem to have resulted in significant dam erosion or lake level changes. Between 1/12/2017 and 8/03/2018, the maximum daily rainfall was 133 mm (on 20/02/2018, Cyclone Gita), and total and average rainfall over the period were 600.5 and 6.1 mm, respectively. During this period, localised erosion (up to ∼20 m vertical) of the Gut channel and deposition downstream of the dam up to ∼10 m occurred. Secondary landsliding (up to ∼5,000 m3 in volume) occurred on the walls of the main Spillway channel. The Planet imagery does not show significant changes to the lake or dam after Cyclone Gita; the lake is sediment-laden (brown), but no significant dam erosion or change in lake size occur between 14 and 28 February 2018.
Only the third significant partial breach deposited flood material that was preserved within the Spillway (Facies 5). This suggests that the erosive action of the river through the Spillway has decreased over time. The decrease in dam volume loss and lake area loss over time supports this (Figure 10F). Each subsequent partial breach eroded more material vertically and laterally to the NW. None of the partial breaches resulted in complete evacuation of the lake, and a remnant lake still exists in August 2022.
The breaching timeline of the HRA dam is complex. In cases without high spatiotemporal resolution pre- and post-event surveys, the breaching mechanisms and timeline are usually unknown. Breaching is commonly simplified to be sudden and complete, occurring in a single event. Nonetheless, as this study and others (e.g., Konagai and Sattar 2012; Delaney and Evans 2015; Zhang et al., 2019) show, breaching appears to occur more episodically, as several partial breaches, in reality. The first partial breach is also not necessarily the most significant, nor does breaching necessarily correspond to highest rainfall intensity or longest duration.
The Hapuku Rock Avalanche and dam, as well as the wider Hapuku catchment, have been studied in detail, including multiple field visits, particle size distribution analysis, a geophysical survey, and an unprecedented 27 remote sensing epochs over 6 years. These detailed datasets and investigations have allowed us to characterise the complex evolution of the HRA dam (see Table 5 for a summary of the landslide, dam and lake). Notably:
• the stratigraphy within the dam reflects a complex emplacement mechanism with the emplaced material being sourced from more than one area; lithological differences between the source areas and different travel distances of the rock masses have contributed to the textures and layering observed in the dam deposit,
• the dam comprises three main facies (Facies 2-4) of differing texture and degree of fragmentation, with Facies 2 and 3 representing the main HRA events that may link to different source regions, and Facies 4 a possible secondary rock avalanche,
• ERT results indicate four layers, corresponding well with the facies identified from dam face mapping, and highlight the highly resistive lag within Facies 3,
• seepage and headward erosion occurred in the days and weeks following emplacement,
• a total of four main erosion events and three significant partial breach events were recognised, resulting in significant changes to the dam and river system below the dam, including both vertical and lateral erosion,
• the first significant partial breach event, occurring 141 days (∼4.5 months) after dam formation, coincided with the first moderate intensity rainfall period (ARI <2 years) within the timeframe analysed (2016–2022),
• the third significant partial breach event, occurring 2 years after dam formation, was the most significant event, both in volume eroded from the dam and lake level change; it seems the erosion of the dam decreased the reservoir storage capacity significantly and permanently,
• overtopping and erosion along the outflow channel during the three partial breach events seem to be the most likely breach mechanisms, although piping and internal erosion may have led to breaching if no significant rain events had occurred beforehand,
• lateral and vertical erosion of the dam and deposition of material into the river are episodic events commonly linked to periods of increased rainfall, and have decreased with time and become more localised, and
• significant amounts of material have accumulated just downstream of the dam within the Hapuku River active channel, affecting river dynamics.
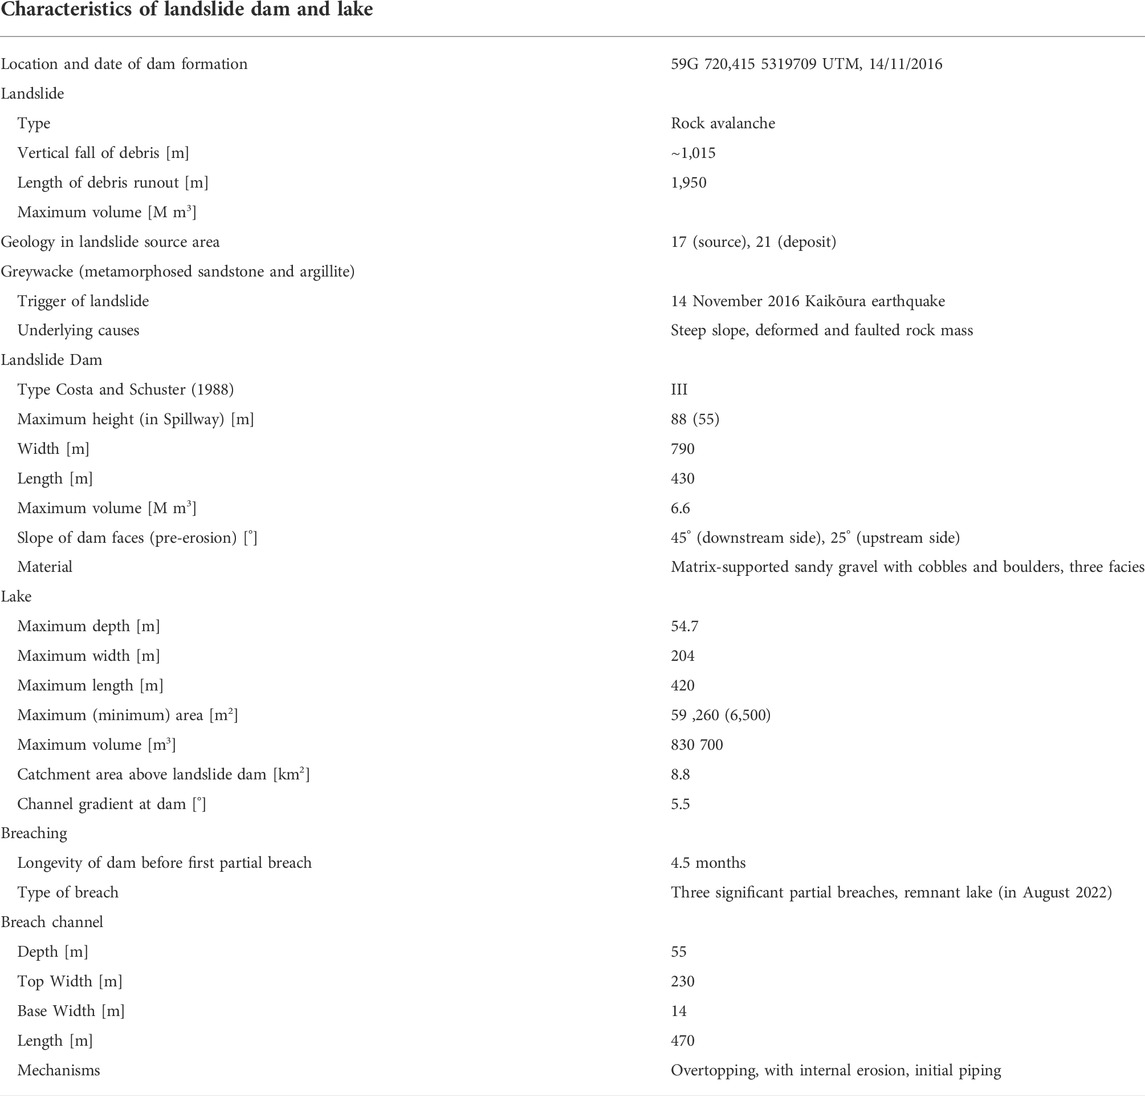
TABLE 5. Summary of the Hapuku Rock Avalanche, dam and lake.
In most literature on landslide dam breaching, dam failure is typically assumed to be sudden and complete, involving mainly erosion along the axis of the channel. Our study has shown that dam evolution is anything but simple, and can involve episodic movement of material, several erosion and partial breach events, and significant changes to the landslide deposit and river system within the first few years of dam formation.
The raw data supporting the conclusion of this article will be made available upon request, without undue reservation.
AW wrote the manuscript, undertook the PSD analyses and analysed results of all methods. CG wrote ERT sections the manuscript, completed the ERT inversion. RM wrote methods, completed 2D differencing. JF wrote methods, completed 3D differencing. BR completed field PSD sieving. CM leads the research programme, completed field investigations. DT completed field investigations and geomorphology mapping. JT completed field PSD sieving. All co-authors reviewed manuscript.
Funding came from an MBIE Endeavour grant. Data collection and analysis was funded as part of a larger research programme, the Earthquake-Induced Landscape Dynamics project, through an MBIE Endeavour grant.
We gratefully acknowledge the assistance of our colleagues at GNS (Garth Archibald, Andrew Boyes, Thomas Brakenrig, Dave Heron, Katie Jones, Richard Kellett, Biljana Lukovic, Giovanni Pradel), the University of Auckland (Niraj Bal Tamang, Joshua Symons and team), and the University of Canterbury (Corinne Singeisen). HARVEST provided the lake level data, and ECAN provided rainfall data. Shaun McCracken and Nick Griffiths (ECAN) were instrumental in the installation of the lake and bridge level sensors and camera. DoC and landowners graciously provided access to their land and UAV concession, as well as sample permits.
The authors declare that the research was conducted in the absence of any commercial or financial relationships that could be construed as a potential conflict of interest.
All claims expressed in this article are solely those of the authors and do not necessarily represent those of their affiliated organizations, or those of the publisher, the editors and the reviewers. Any product that may be evaluated in this article, or claim that may be made by its manufacturer, is not guaranteed or endorsed by the publisher.
Archie, G. E. (1942). The electrical resistivity log as an aid in determining some reservoir characteristics. Trans. AIME 146, 54–62. doi:10.2118/942054-g
Bunte, K., and Abt, S. R. (2001). Sampling surface and subsurface particle-size distributions in wadable gravel- and cobble-bed streams for analyses in sediment transport, hydraulics, and streambed monitoring. RMRS-GTR-74. Fort Collins, CO: United States Department of Agriculture, Forest Service, 451.
Costa, J. E., and Schuster, R. L. (1988). The formation and failure of natural dams. Geol. Soc. Am. Bull. 100 (7), 1054–1068. doi:10.1130/0016-7606(1988)100<1054:tfafon>2.3.co;2
Davies, T. R., Manville, V., Kunz, M., and Donadini, L. (2007). Modeling landslide dambreak flood magnitudes: Case study. J. Hydraul. Eng. 133 (7), 713–720. doi:10.1061/(asce)0733-9429(2007)133:7(713)
Delaney, K. B., and Evans, S. G. (2015). The 2000 Yigong landslide (Tibetan Plateau), rockslide-dammed lake and outburst flood: Review, remote sensing analysis, and process modelling. Geomorphology 246, 377–393. doi:10.1016/j.geomorph.2015.06.020
Dellow, S., Massey, C., Cox, S., Archibald, G., Begg, J., Bruce, Z., et al. (2017). Landslides caused by the Mw7.8 Kaikōura earthquake and the immediate response. Bull. New Zealand Soc. Earthquake Eng. 50 (2), 106–116. doi:10.5459/bnzsee.50.2.106-116
Efron, B., and Tibshirani, R. (1993). An introduction to the bootstrap. New York: Chapman&Hall/CRC, 436.
Fan, X., Dufresne, A., Siva Subramanian, S., Strom, A., Hermanns, R., Tacconi Stefanelli, C., et al. (2020). The formation and impact of landslide dams – State of the art. Earth. Sci. Rev. 203, 103116. doi:10.1016/j.earscirev.2020.103116
Fan, X., Dufresne, A., Whiteley, J., Yunus, A. P., Subramanian, S. S., Okeke, C. A., et al. (2021). Recent technological and methodological advances for the investigation of landslide dams. Earth-Science Rev. 218, 103646. doi:10.1016/j.earscirev.2021.103646
Farr, J., Eiken, T., Odegrad, R. S., and Sollid, J. L. (2022). Measuring coastal cliff retreat in a changing climate. New Zealand, GNS: Lower Hutt.
Frigerio Porta, G., Bebbington, M., Xiao, X., and Jones, G. (2020). Bayesian lifetime analysis for landslide dams. Landslides 17 (8), 1835–1848. doi:10.1007/s10346-020-01388-5
Gasston, C., (2018). "The Hapuku rock avalanches triggerd by the 14 november 2016 kaikoura earthquake, New Zealand: Structural controls and failure mechanisms."
Glover, P. W. J. (2015). Geophysical properties of the near surface Earth: Electrical properties. Treatise Geophys. 11, 89–137. doi:10.1016/b978-0-444-53802-4.00189-5
Kaiser, A., Balfour, N., Fry, B., Holden, C., Litchfield, N., Gerstenberger, M., et al. (2017). The 2016 Kaikōura, New Zealand, earthquake: Preliminary seismological report. Seismol. Res. Lett. 88 (3), 727–739. doi:10.1785/0220170018
Konagai, K., and Sattar, A. (2012). Partial breaching of hattian Bala landslide dam formed in the 8th october 2005 kashmir earthquake, Pakistan. Landslides 9 (1), 1–11. doi:10.1007/s10346-011-0280-x
Loke, M. H., and Dahlin, T. (2002). A comparison of the Gauss–Newton and quasi-Newton methods in resistivity imaging inversion. J. Appl. Geophys. 49 (3), 149–162. doi:10.1016/s0926-9851(01)00106-9
Massey, C. I., Townsend, D. B., Dellow, G. D., Lukovic, B., Rosser, B. J., Archibald, G. C., et al. (2019). Kaikoura earthquake short-term project : landslide inventory and landslide dam assessments. Lower Hutt, New Zealand: GNS Science, Vol. 43. GNS Science report 2018/19. doi:10.21420/G2FP82
Massey, C. I., Townsend, D., Jones, K., Lukovic, B., Rhoades, D., Morgenstern, R., et al. (2020). Volume characteristics of landslides triggered by the M W 7.8 2016 Kaikōura earthquake, New Zealand, derived from digital surface difference modeling. JGR. Earth Surf. 125 (7), e2019JF005163. doi:10.1029/2019jf005163
Massey, C., McSaveney, M., and Davies, T. (2013). “Evolution of an overflow channel across the Young River landslide dam, New Zealand,” in Landslide science and practice (Berlin: Springer).
Massey, C., Townsend, D., Rathje, E., Allstadt, K. E., Lukovic, B., Kaneko, Y., et al. (2018). Landslides triggered by the 14 november 2016 Mw 7.8 Kaikōura earthquake, New Zealand. Bull. Seismol. Soc. Am. 108 (3B), 1630–1648. doi:10.1785/0120170305
Morgenstern, R., Massey, C., Rosser, B., and Archibald, B. (2021). “Landslide dam hazards: Assessing their formation, failure modes, longevity and downstream impacts,” in World landslide forum (Kyoto Japan: Springer Nature Switzerland AG), 117–123.
Nash, T. R. (2003). Engineering geological assessment of selected landslide dams formed from the 1929 murchison and 1968 inangahua earthquakes. Engineering geology. Christchurch: University of Canterbury. Masters of Science, 246. Theses/Dissertations.
Okeke, A. C.-U., and Wang, F. (2016). Hydromechanical constraints on piping failure of landslide dams: An experimental investigation. Geoenvironmental Disasters 3 (1), 4. doi:10.1186/s40677-016-0038-9
Peng, M., and Zhang, L. (2012). Analysis of human risks due to dam break floods—part 2: Application to tangjiashan landslide dam failure. Nat. Hazards (Dordr). 64 (2), 1899–1923. doi:10.1007/s11069-012-0336-9
Perrone, A., Lapenna, V., and Piscitelli, S. (2014). Electrical resistivity tomography technique for landslide investigation: A review. Earth. Sci. Rev. 135, 65–82. doi:10.1016/j.earscirev.2014.04.002
Shi, Z., Guan, S., Peng, M., and Xiong, X. (2015). “Research on the influence of material permeability to landslide dam seepage susceptibility,” in 10th Asian Regional Conference of IAEG, Kyoto Japan, September 26–29, 2015 (IAEG).
Standards New Zealand (1986). Methods of testing soils for civil engineering purposes 19.120 Particle size analysis. Wellington: Standards New Zealand, 4402.
Wang, F., Dai, Z., Okeke, C. A. U., Mitani, Y., and Yang, H. (2018). Experimental study to identify premonitory factors of landslide dam failures. Eng. Geol. 232, 123–134. doi:10.1016/j.enggeo.2017.11.020
Zhang, L., Xiao, T., and Chen, C. (2019). Erosion-based analysis of breaching of Baige landslide dams on the Jinsha River, China, in 2018. Landslides 16 (10), 1965–1979. doi:10.1007/s10346-019-01247-y
Zhao, H. F., Zhang, L., Xu, Y., and Chang, D. (2013). Variability of geotechnical properties of a fresh landslide soil deposit. Eng. Geol. 166, 1–10. doi:10.1016/j.enggeo.2013.08.006
Zhong, Q., Chen, S. S., Mei, S. A., and Cao, W. (2018). Numerical simulation of landslide dam breaching due to overtopping. Landslides 15 (6), 1183–1192. doi:10.1007/s10346-017-0935-3
Zhou, G. G. D., Cui, P., Chen, H. Y., Zhu, X. H., Tang, J. B., and Sun, Q. C. (2013). Experimental study on cascading landslide dam failures by upstream flows. Landslides 10, 633–643. doi:10.1007/s10346-012-0352-6
Keywords: Hapuku Rock Avalanche, Kaikōura, landslide dam breaching and evolution, remote sensing, differencing, particle size analysis, electrical resistivity tomography, facies mapping
Citation: Wolter A, Gasston C, Morgenstern R, Farr J, Rosser B, Massey C, Townsend D and Tunnicliffe J (2022) The Hapuku Rock Avalanche: Breaching and evolution of the landslide dam and outflow channel revealed using high spatiotemporal resolution datasets. Front. Earth Sci. 10:938068. doi: 10.3389/feart.2022.938068
Received: 06 May 2022; Accepted: 29 June 2022;
Published: 25 August 2022.
Edited by:
Davide Donati, University of Bologna, ItalyReviewed by:
Marten Geertsema, British Columbia Ministry of Forests, Lands, Natural Resource Operations Rural Development, CanadaCopyright © 2022 Wolter, Gasston, Morgenstern, Farr, Rosser, Massey, Townsend and Tunnicliffe. This is an open-access article distributed under the terms of the Creative Commons Attribution License (CC BY). The use, distribution or reproduction in other forums is permitted, provided the original author(s) and the copyright owner(s) are credited and that the original publication in this journal is cited, in accordance with accepted academic practice. No use, distribution or reproduction is permitted which does not comply with these terms.
*Correspondence: Andrea Wolter, YS53b2x0ZXJAZ25zLmNyaS5ueg==
Disclaimer: All claims expressed in this article are solely those of the authors and do not necessarily represent those of their affiliated organizations, or those of the publisher, the editors and the reviewers. Any product that may be evaluated in this article or claim that may be made by its manufacturer is not guaranteed or endorsed by the publisher.
Research integrity at Frontiers
Learn more about the work of our research integrity team to safeguard the quality of each article we publish.