
95% of researchers rate our articles as excellent or good
Learn more about the work of our research integrity team to safeguard the quality of each article we publish.
Find out more
ORIGINAL RESEARCH article
Front. Earth Sci. , 08 July 2022
Sec. Structural Geology and Tectonics
Volume 10 - 2022 | https://doi.org/10.3389/feart.2022.937393
This article is part of the Research Topic Unconventional Reservoir Geomechanics View all 16 articles
 Ke Xu1*
 Hui Zhang1
 Ruixia Dong1
 Wei Ju2Yani Xie1Deyu Cui3Lu Fang1Fang Yuan1Shujun Lai1Jingrui Liang1Wei Zhang1Bin Zhao1
The Kuqa Depression boasts rich cretaceous ultra-deep hydrocarbon resources. However, it is in complex geological conditions. At present, sufficient understandings on the in situ stress distribution and influencing factors are lacking, which restricts the process of hydrocarbon exploitation. Therefore, in this study, the Bozi gas field is selected as an example, and a 1D mechanical earth model (1D MEM) is established with the drilling data and logging data through the geomechanical method to clarify the in situ stress distribution of the wellbore. A 3D heterogeneous geomechanical model (3D HGM) is established with the constraint of 1D HEM to clarify the distribution characteristics of the 3D in situ stress field in the Bozi gas field and discuss its influencing factors. The results show that: 1) the Bozi gas field is in an extremely strong in situ stress condition with high stress values. The minimum horizontal principal stress (Sh) of the cretaceous system is 153∼180 MPa, and the maximum horizontal principal stress (SH) is nearly 200 MPa; 2) the in situ stress in the Bozi gas field has obvious vertical stratification characteristics, which can be divided into three stress sequences of “low–high–low”, with great differences in interlayer stress; 3) the in situ stress distribution of the Bozi gas field is greatly affected by the types of faulted anticline. Different types indicate different stress distribution; 4) within the influence range of overthrusts, the in situ stress in the footwall is lower than that of the hanging wall. The greater the fault offset, the greater the in situ stress difference between the hanging wall and footwall. Moreover, the lower the stress in the footwall, the higher is the degree of overthrust, and the larger is the range of footwall stress area; and 5) the means of highly deviated wells is more helpful to the Bozi gas field for hydrocarbon exploitation.
At present, with the rapid development of the world economy, shallow resources are gradually exhausted, and the resource development is moving toward deep and ultra-deep layers, which have great exploration potential. The deep and ultra-deep hydrocarbon resources are an important replacement field and have become a research hotspot in the global oil and gas field (Bloch et al., 2002; Dutton and Loucks, 2010; Jia and Pang, 2015; Li et al., 2019). In recent years, important progress has been made in global deep and ultra-deep hydrocarbon exploitation. By the end of 2018, 68 oil and gas reservoirs with a depth of more than 8,000 m had been found worldwide (Li et al., 2020), with the new oil and gas reserves and production showing an obvious growth momentum (Bloch et al., 2002; Hu et al., 2013; Bai and Cao, 2014; Cao et al., 2022).
As for the boundary depth of deep and ultra-deep reservoirs in petroliferous basins, different countries, institutions, and scholars have different understandings (Glasmann, 1992; Girard et al., 2002; Hu et al., 2013; Pang et al., 2015; Hu et al., 2019). Cao et al. (2022) proposed a division by considering burial depth, geothermal gradient, burial history, thermal evolution history, and diagenetic history, which is found in cold basins with low geothermal gradient (<2.5°C/100 m); 4,500 ∼ 6,000 m is defined as deep layer and more than 6,000 m is defined as ultra-deep layer; in medium warm basins with a geothermal gradient of 2.5 ∼ 3.5°C/100 m, 3,500 ∼ 4,500 m is defined as the deep layer, and more than 4500 m is defined as the ultra-deep layer; and in the thermal basin with a high geothermal gradient (>3.5°C/100 m), 3,000 ∼ 4,000 m is defined as the deep layer, and more than 4,000 m is defined as the ultra-deep layer.
At present, the deepest large-scale clastic rock oil and gas reservoir found abroad is the Jack/St Malo deep-water turbidite oilfield of Lower Tertiary Trend in the Gulf of Mexico, with a maximum burial depth of 8,839 m, and its oil and gas reserves are 6821 × 104t (oil equivalent) at 7,620 m (25,000 ft) with a water depth of 2,133 m (7,000 ft) of Well Jack-2, and the production is 818 t/d (Meyer et al., 2007; Rains et al., 2007; He et al., 2017).
Currently, the deepest borehole in China is Well Luntan 1 in Tarim Basin (8,882 m in 2019), where high-yield industrial oil and gas flow is obtained in the Cambrian below a burial depth of 8,200 m (Yang et al., 2020). The deepest clastic rock gas field is the Kelasu gas field in Tarim Basin (Yang et al., 2018, 2019; Zeng LB. et al., 2020; Tian et al., 2020). At Well Dabei 4, high-yield natural gas flow is obtained in the year of 2022 at 8,200 m in the cretaceous sandstones.
Theoretically, in such ultra-deep background, the reservoir rocks become extremely dense due to strong diagenetic compaction and cementation. The matrix porosity is generally not more than 10%, and the permeability is even less than 1mD, making it difficult to form an efficient seepage system. However, such ultra-deep reservoirs often develop fractures and are present in strong in situ stress environment. The exploration and development practice of many ultra-deep fractured reservoirs shows that the high-quality fractures under the control of in situ stress are the optimum point of ultra-deep hydrocarbon exploitation (Zeng et al., 2008; Jiang et al., 2020). Under the control of in situ stress field, fractures can increase the reservoir permeability by orders of magnitude (Wang et al., 2018; Zeng QL. et al., 2020; Liu J. et al., 2022), which is an important guarantee for the existence of wells with high and stable production in ultra-deep reservoirs. In situ stress greatly influences the quality of ultra-deep reservoir and hydrocarbon production capacity by affecting the fracture activity and hydraulic fracturing effect (Zhang et al., 2018; Xu et al., 2022). Therefore, it is necessary to carry out systematic research on the in situ stress in ultra-deep reservoirs, clarifying the orientation and magnitude of in situ stress, and finding the main factors affecting its distribution. The results are expected to provide suggestions and supports for well location deployment and optimization fracturing scheme.
This study takes the Bozi gas field in Tarim Basin as an example to study the in situ stress. The Bozi gas field is a typical ultra-deep gas field with a burial depth of 6,000 ∼ 8,000 m. At present, the existing research of the Bozi gas field mainly focuses on sedimentation, structure, and petroleum geological conditions (Yang et al., 2019; Wang et al., 2022) and understandings on the in situ stress distribution characteristics and influencing factors are lacking, which restricts the hydrocarbon exploitation in this area. Therefore, a one-dimensional mechanical earth model (1D MEM) and a three-dimensional heterogeneous geomechanical model (3D HGM) were conducted and analyzed. It plays an important role in better understanding the geomechanical properties and provides references for the efficient development of natural gas.
The Kuqa Depression is located in the north of Tarim Basin. It is connected with the South Tianshan fault fold belt by the thrust fault in the north, Tabei Uplift in the south, Yangxia sag in the east, and Wushi sag in the West. It is a superimposed foreland basin dominated by Mesozoic and Cenozoic sedimentation and can be divided into seven secondary structural units (Figure 1A). Among them, the Kelasu tectonic belt is a typical deep and ultra-deep natural gas resource enrichment area. From west to east, it can be divided into Awate segment, Bozi segment, Dabei segment, and Keshen–Kela segment. The Kelasu tectonic belt develops four first-order faults from north to south, which are divided into Bozi–Kela fault tectonic belt, Keshen fault tectonic belt, Baicheng fault tectonic belt, and Baicheng South fault tectonic belt. Multiple secondary thrust faults are developed between the faults.
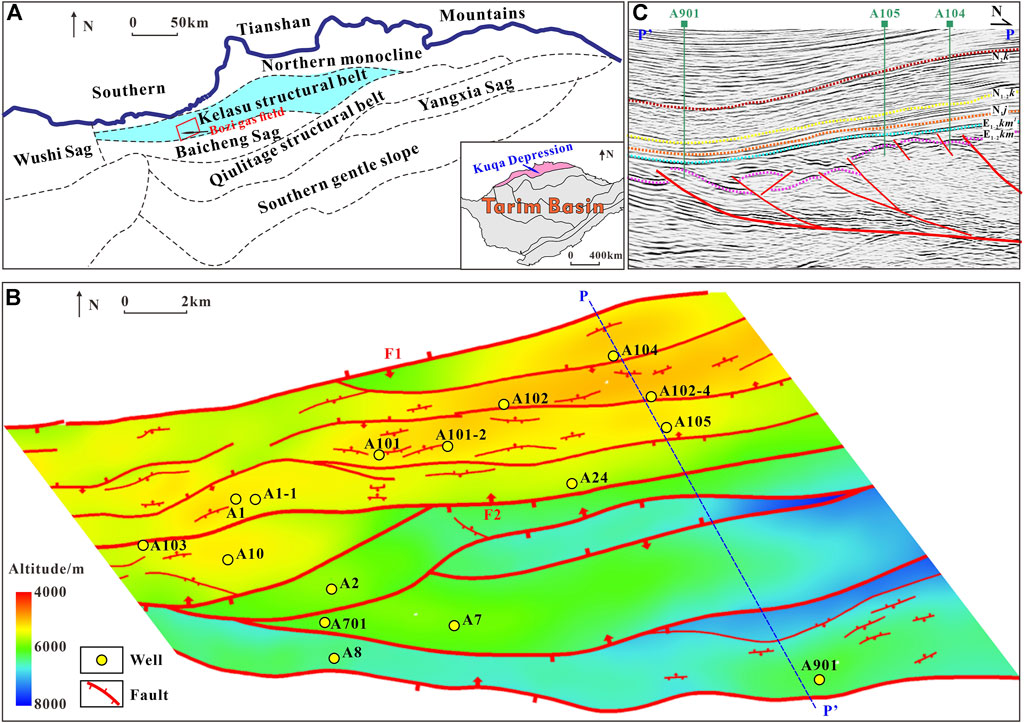
FIGURE 1. Field location, seismic profile, and top structure of the target layer in the Bozi gas field. (A) The Kuqa Depression is the northernmost first level unit in Tarim Basin. The Kuqa depression can be further divided into seven secondary tectonic units. The Kelasu tectonic belt is located in the second-row structure from the north, and the Bozi gas field is located in the west of the Kelasu tectonic belt; (B) the Cretaceous top structure map of the Bozi gas field comprises several rows of faulted anticline structures divided by thrust faults. The strike of the anticline structure is basically the same, which is in the NE–SW direction; and (C) the typical thrust imbricate structure and pop-up structure of the Bozi gas field can be seen through the seismic section of PP’.
The Bozi gas field is located in the west of Kelasu tectonic belt and is characterized by rows of faulted anticlines. The strike of anticline is generally the same, which is in the NE–SW direction. The northern Bozi gas field is a pop-up structure sandwiched by two thrust faults F1 and F2, and the southern part is a series of imbricate structures, with gradually increasing burial depth (Figures 1B,C). From east to west, the overlapping degree of the imbricate structure increases gradually.
The drilling of the Bozi gas field shows that the drilling strata from the top to bottom are: Quaternary Xiyu Formation (Q1x), Neogene Kuqa Formation (N2k), Kangcun Formation (N1-2k), Jidike Formation (N1j), Paleogene Suweiyi Formation (E2-3s), Kumugeliemu Group (E1-2km), Cretaceous Bashijiqike Formation (K1bs), and Baxigai Formation (K1bx). Among them, The E1-2km is a set of gypsolith rock formation with great thickness distribution and plastic flow characteristics. In the process of compression deformation, layered shrinkage deformation occurs, and the strata above this plastic stratum folds, thrusts, and rises sharply, forming a “roof like” structure. Under the control of “roof” structure, salt rock flow results in the characteristics of abovementioned salt Kelasu tectonic belt, salt body, and subsalt differential structural deformation.
The target strata of the study are the Cretaceous K1bs and K1bx. The K1bs can be divided into three lithologic segments. The first lithologic segment is missing due to the influence of paleosedimentary environment. The second lithologic segment mainly comprises medium thick ∼ super thick layered brown and grayish brown medium sandstone and fine sandstone, which is deposited at the front of braided river delta. The third lithologic segment mainly comprises medium thick ∼ thick layered brown fine sandstone, thin ∼ medium thick layered siltstone, and argillaceous siltstone, which are deposited at the front of fan delta. The K1bx comprises thin medium thick brown mudstone and medium thick layered brownish gray, grayish brown fine sandstone, siltstone, and argillaceous siltstone, which are interbedded in an isopachous-slight isopachous manner and are deposited at the front of braided river delta (Figure 2).
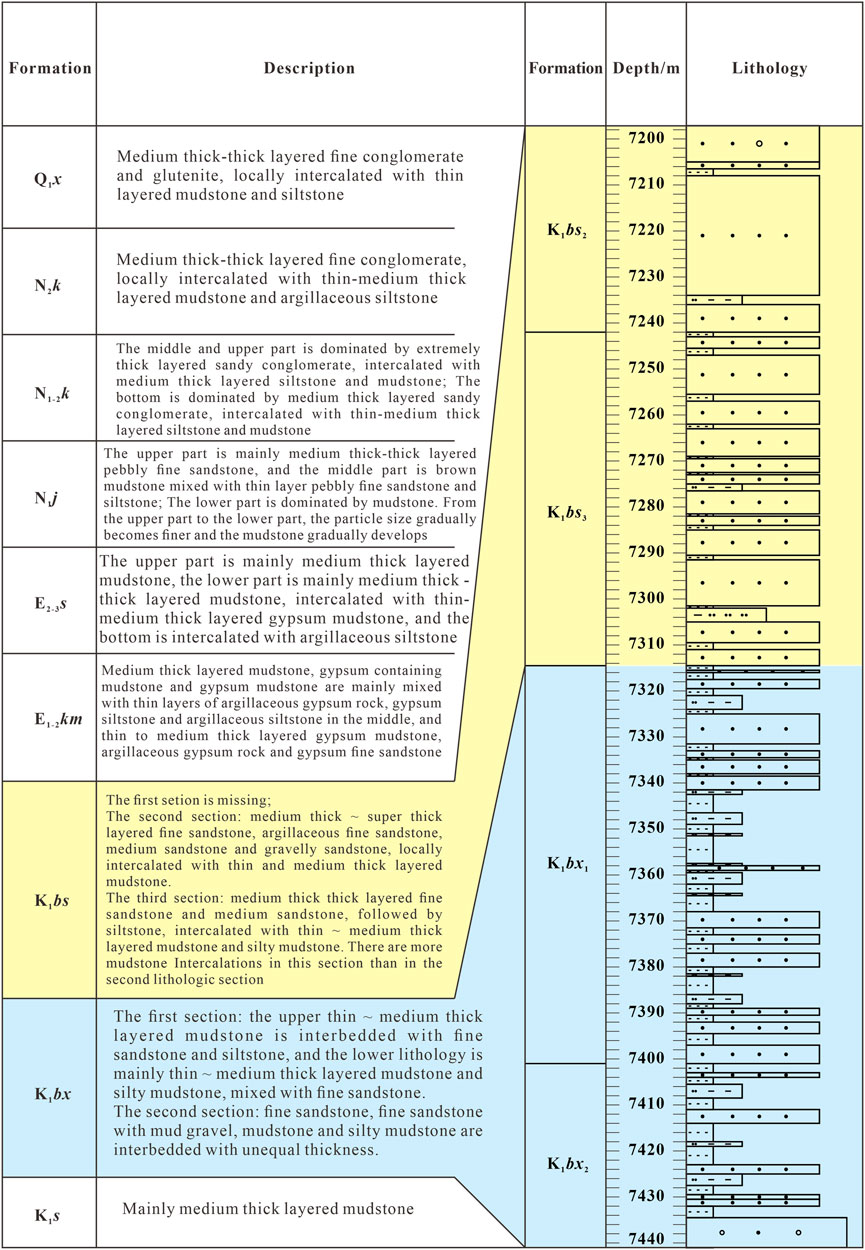
FIGURE 2. Stratigraphic histogram and lithology description in the Bozi gas field.
Reservoir pore types in the Bozi gas field are mainly primary intergranular pores, with a small amount of microfractures and micropores. The porosity of Bashijiqike formation mainly ranges between 4% and 10.0%, with an average of 6.30%, and the permeability mainly ranges between 0.1 and 0.5 mD, with an average of 0.256 mD. The porosity of Baxigai formation sandstone ranges between 4 and 9%, with an average porosity of 6.06%, and the permeability mainly ranges between 0.035 and 0.1 mD, with an average permeability of 0.067 mD. The reservoir fractures are relatively developed, mostly being partially filled—unfilled, high angle, and shear fractures. The fracture strike is mainly near E–W, and the fracture density ranges between 0.2/m and 0.4/m.
At present, there are many methods to measure and test in situ stress, including the drill-based borehole collapse method, relaxation strain measurement, stress relief technique, acoustic emission, and differential strain method (Zang and Stephansson, 2010). The Bozi gas field is deep buried and has high bottom hole temperature and high pressure. Hence, the measuring instrument has poor applicability, and there is no constraint of confining pressure after core removal, causing rapid stress relief. In mild cases, it may lead to inaccurate measurement, and in serious cases, it may lead to possible core fracture. Therefore, it is not suitable to use downhole measurement and core testing to obtain the in situ stress state.
This article utilizes the drilling and logging data to obtain the in situ stress state. Different basins are in different states, and scholars have put forward a variety of in situ stress calculation models considering more comprehensive factors. As a result, the accuracy of the calculation has gradually improved, and the applicability has become more extensive. At present, there is little dispute about the calculation of vertical stress (Sv). It is considered that its magnitude is equal to the gravity of the overlying rock mass, which can be obtained by integrating the density curve from the ground to the target depth such as Eq. 1:
where g is the gravitational acceleration (m/s2), ρ(z) is the density as a function of burial depth (kg/m3), and z is the burial depth (m).
There are many calculation models for obtaining horizontal principal stress magnitudes, including the uniaxial strain model, Mohr–Coulomb failure model, Coulomb–Navier failure model, Huang’s model, combined spring model, porous elastic strain model, and biaxial strain model (Li and Zhang, 1997; Liu and Luo, 1999; Rasouli and Sutherland, 2014; Li et al., 2017). In this article, the calculation model is as follows (Li et al., 1997):
where SH is the maximum horizontal principal stress, MPa; Sh is the minimum horizontal principal stress, MPa; SV is the vertical principal stress, MPa; PP is the pore pressure, MPa;
The method of calculating the mechanical parameters with the logging data is as follow (Lu et al., 2015):
where ρb is the rock density, kg/m3, and Δtp and Δts are the P-wave time difference and S-wave time difference, respectively, μs/ft.
Generally, we may determine Sh at a specific location through the hydraulic fracturing construction data, which can be used as the constraint and scale basis to determine the value of
Because wells in different structural locations have different stress distributions (stress concentration and tensile range) around the well in different lithologic sections, and with the increase of radial depth, the stress effect will decrease and the degree of borehole wall collapse will also vary. Therefore, it is a more intuitive method to distinguish the direction of in situ stress by analyzing the changes of formation characteristics around the borehole from the scanning images of formation micro resistivity (FMI). The collapse width of the borehole wall can be judged from FMI, and the collapse width has the following mathematical calculation relationship with rock uniaxial compressive strength and in situ stress state (Zoback, 2007):
where C0 is the uniaxial compressive strength, Pp is the pore pressure,
Therefore, the gradient of the maximum horizontal principal stress and the minimum horizontal principal stress can be inverted according to the collapse width WBO and the uniaxial compressive strength (C0) of the borehole wall collapse position.
The distribution of in situ stress field was predicted using a popular finite element method (Liu et al., 2017a; Liu et al., 2017b; Ju et al., 2021). To begin with, the geological mass was discretized into several finite units that were connected to each other by nodes. Rock mechanical parameters were assigned to the corresponding units. The primary variables of the field functions for the study area included displacement, stress, and strain. The equation set where the node displacement served as the unknown quantity and the total stiffness matrix as the coefficient was solved based on the boundary stress condition and the node balance condition. The displacement at each node was then obtained. Finally, the stress and strain of each unit were calculated.
Generally, based on elastic mechanics, the relationship between strain and displacement follows Eq. 6 (Ju et al., 2021):
where εxx, εyy, and εzz are the linear strain components and γxy, γyz, and γzx are the shear strain components.
The matrix form can be derived as follows:
where [δ] is the nodal displacement matrix and [B] is the geometric matrix.
From the physical equation, stress and strain can be expressed as follows:
where [D] is the elasticity matrix.
The Bozi gas field is featured by fault developed and complex fault intersection. This article adopts the volume element based (VBM) structural framework modeling method. The grid established is continuously distributed, but it is discontinuous at the fault. Compared with the traditional corner grid modeling, the established complex structure model is more realistic and has higher accuracy. In order to consider the heterogeneity of rock, the “logging + seismic” combination method is used to establish the 3D heterogeneous rock mechanics field (Xu et al., 2018a; Xu et al., 2018b; Ju et al., 2021).
The surface of the Bozi gas field is relatively flat and mostly covered by vegetation and Gobi. However, due to the complex lithology, the shallow Kuqa and Kangcun Formations gravel layer and the plastic Kumugeliemu group gypsolith rock have a certain impact on the distribution of in situ stress in the target layer. Therefore, when establishing the model, this article considers the surface fluctuation morphology and different rock mechanical properties of the surrounding rock, rather than just treat the rock body above the target layer as a homogeneous cube. As shown in Figure 3, an outer frame is established outside the Bozi gas field model as the surrounding rock. The surrounding rock is divided into five layers, representing loose rock on the surface, shallow gravel, mudstone layer, gypsum salt rock, and Cretaceous rock layer, which are given by the rock mechanical parameters of different lithology, respectively. The rock mechanical parameters of each layer are obtained according to the mechanical test of field samples in Kuqa Depression and corrected according to the vertical stress calculated by density logging of the target layer (Xu et al., 2020). The target layer model is assigned with 3D heterogeneous rock mechanical parameters, among which the elastic modulus mostly ranges between 20 and 30 GPa, locally as high as 40 GPa; the Poisson’s ratio is mainly concentrated in 0.24 ∼ 0.27; and the value of rock density in 3D space is mainly between 2.3 and 2.6 g/cm3 (Figure 3). Using the distance scanning method (that is, calculate the distance between a unit and its surrounding rock mechanical parameters one by one and select the rock mechanical parameters with the smallest distance to load on the unit), this article assigns the heterogeneous rock mechanical parameters in the constructed 3D rock mechanical field to each finite element grid of the target layer model.
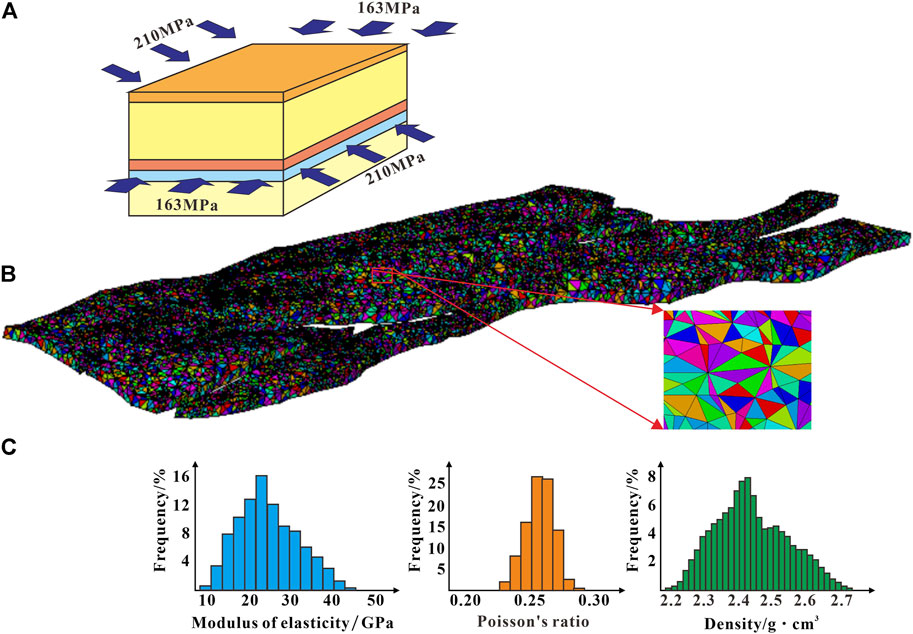
FIGURE 3. (A) Outer frame established outside the Bozi gas field model as the surrounding rock. The surrounding rock is divided into five layers. A compression magnitude of 210 MPa is applied in the N–S direction and 163 MPa is applied in the E–W direction of the model; (B) Target layer model is assigned with 3D heterogeneous rock mechanical parameters, and the heterogeneous rock mechanical parameters are assigned to each grid of the finite element model. Each triangular grid represents a material, including an array comprising elastic modulus, Poisson’s ratio, density, and other parameters. Different colors represent different numbers of materials, and the grid color does not represent the distribution of rock mechanical parameters; (C) Distribution histogram of rock mechanical parameters.
With the in situ stress state of seven wells in the Bozi gas field as the constraints, the iterative optimization process is carried out for the stress boundary loading to optimize and determine the reasonable boundary conditions. Through repeated attempts, the following boundary conditions are finally determined (Figure 3): a compression magnitude of 210 MPa is applied in the N–S direction and 163 MPa is applied in the E–W direction of the model.
In this article, a 1D mechanical earth modeling has been carried out in the Bozi gas field. Figure 4 shows the 1D MEM result along the well section of A2–A101-2–A102-4–A105, which indicates the distribution and changes of Cretaceous geomechanical parameters in one dimension of the wellbore.
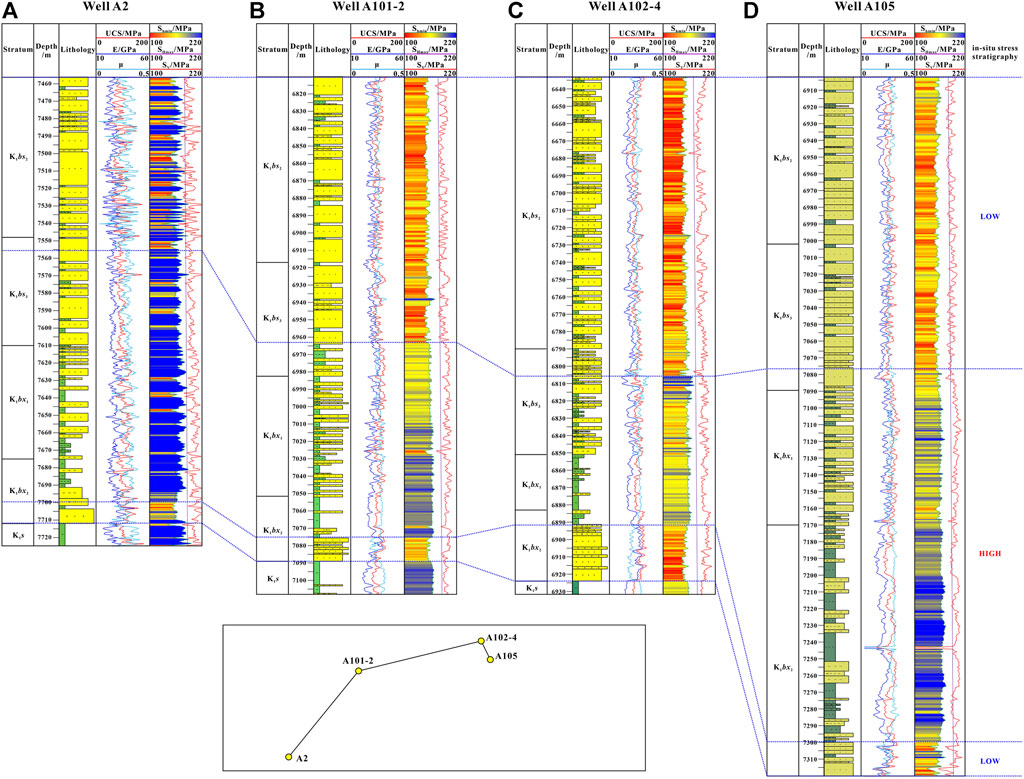
FIGURE 4. 1D MEM of well A2–well A101-2–well A102-4–well 105.
Taking Well A2 as an example, Young’s modulus is 20 ∼ 30 GPa, the average uniaxial compressive strength is approximately 100 MPa, and Poisson’s ratio changes little, at 0.25 ∼ 0.30. The minimum horizontal, maximum horizontal, and vertical principal stress gradients are 2.11 ∼ 2.18 MPa/100 m, 2.55 ∼ 2.72 MPa/100 m, and 2.45 MPa/100 m, respectively, which are in strike–slip stress regime (SH>SV>Sh). For a better comparison, the Sh is filled with colors, with warm color representing low value and cold color for high value. It can be seen that the in situ stress shows obvious stratification vertically. The stress in the upper part of K1bs2 and K1bs3, that is, 7456 ∼ 7555 m is low, and the Sh magnitude is approximately 165 MPa. The stress in the lower part of K1bs3, the upper part of K1bx1 and K1bx2, that is, 7555 ∼ 7700 m is high, and the Sh magnitude is approximately 175 MPa, and local areas can reach 180 MPa. The stress in the lower part of K1bx2 decreases, and the Sh magnitude is approximately 170 MPa. This shows the distribution characteristics of “low–high–low”.
The in situ stress of single wells in the Bozi gas field has certain similar characteristics. The stress has the distribution characteristics of “low–high–low ” in the Cretaceous system. That is, the stress in the upper part of K1bs2 and K1bs3 is low, the stress in the lower part of K1bs3, and the upper part of K1bx1 and K1bx2 is high, and the stress in the lower part of K1bx2 is reduced. In addition, compared with the Baxigai Formation, the stress characteristics of Bashijiqike Formation are lower, and stress difference between the layers is relatively small. The interlaminar stress difference in the Baxigai Formation is large, resulting in a stronger interlaminar property.
The 3D distribution of the in situ stress in the Cretaceous layes of Bozi gas field is shown in Figure 5. The distributions of three principal stresses are similar, showing a trend of low in the north and high in the south. The Sh is mainly 153 ∼ 180 MPa, and SH is 180 ∼ 200 Pa, and SV is 175 ∼ 200 MPa, which is a strike slip stress state. There are great differences in stress distribution among the different fault blocks. The Sh in A104 and A102 fault blocks is 153 ∼ 160 MPa and the SH is approximately 180 ∼ 188 MPa, while the Sh in A8 and A9 fault blocks is as high as 175 MPa and the SH even exceeds 200 MPa.
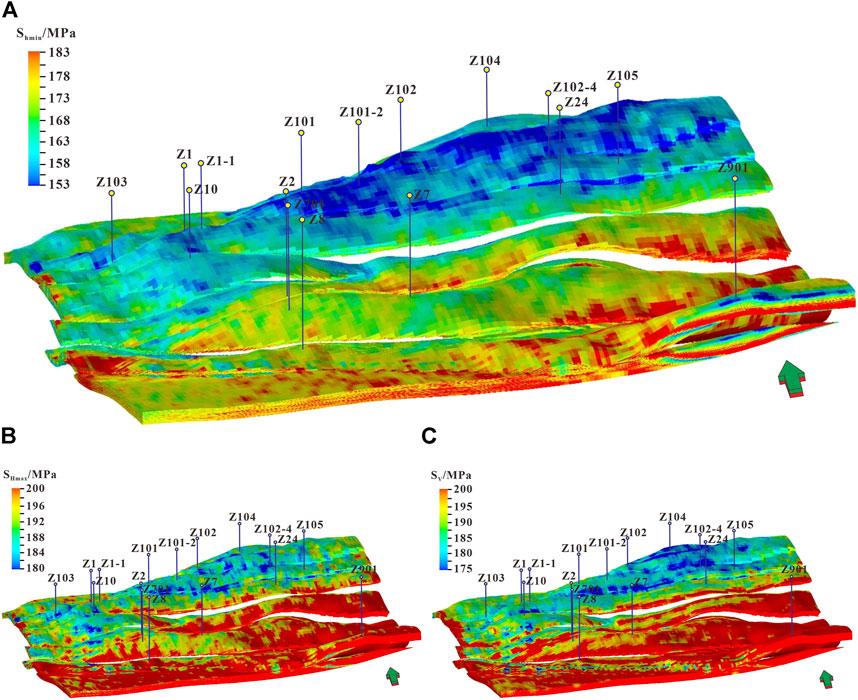
FIGURE 5. 3D heterogenous in situ stress field in the Bozi gas field. (A) Sh; (B) SH; and (C) Sv.
Figure 6 shows the in situ stress distribution of five typical sections in the Bozi gas field. It can be seen that the in situ stress distribution is evidently related to the tectonic form. Each fault block in the Bozi gas field is basically a fault anticline structure, and different structural styles vary in terms of stress distribution. Figure 7 summarizes the structural style of the fault anticline in the Bozi gas field and the corresponding in situ stress distribution mode. The structural style of the fault anticline is divided into five categories: north steep and south gentle type (A8 and A10), north gentle and south steep type (A7), symmetrical imbricate type (A104), complete pop-up structure (A7), and semi complete pop-up structure (A1). Generally, the in situ stress distribution of symmetrical imbricate faulted anticline and pop-up structure is regular and symmetrical. The stress is low at the top of the anticline and high at the wings. In north steep and south gentle type, the stress is high in the north wing and low in the south wing. In the north gentle and south steep type, the stress in low in the north wing and high in the south wing.
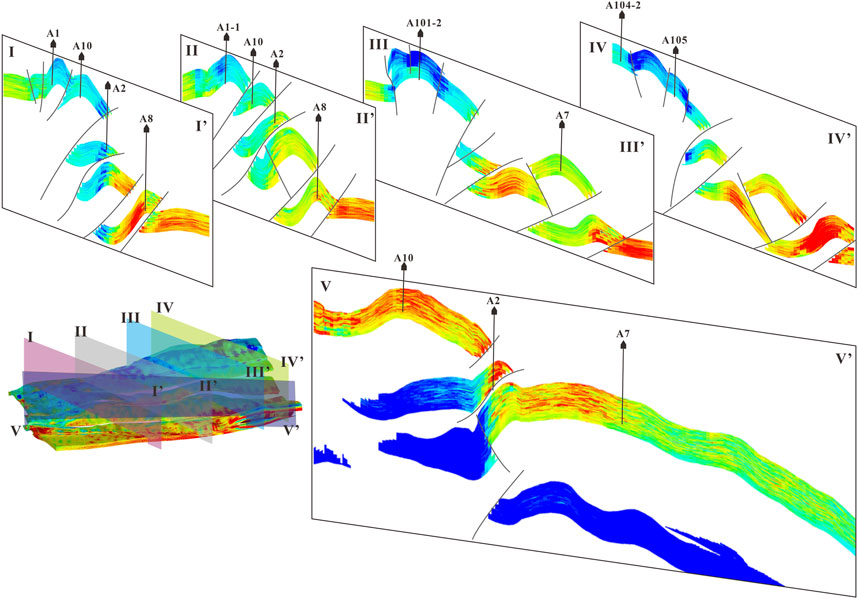
FIGURE 6. In situ stress distribution in a typical section of the Bozi gas field.
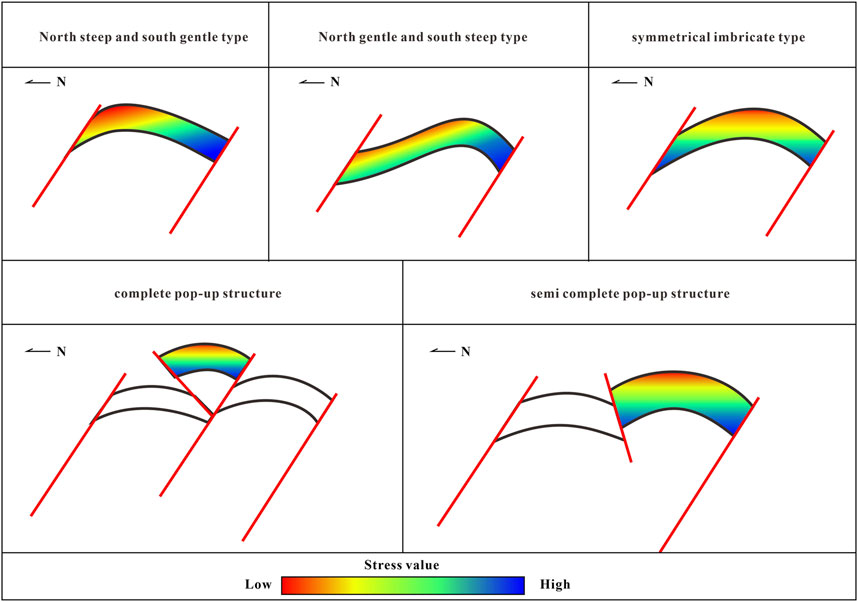
FIGURE 7. Structural style and corresponding in situ stress distribution mode.
The in situ stress prediction results of seven wells in different fault blocks of the Bozi gas field are compared with the logging calculation results (Table 1). The calculation method of error (r) is as follows:
where Sm is the in situ stress value actually calculated, MPa and Sc is the in situ stress predicted by numerical simulation, MPa. It can be seen that the average error of the SH value is 6.5 MPa, and the average error of the Sh value is 6.3 MPa. Both the errors are within 10%, indicating that the in situ stress simulation results have high reliability.
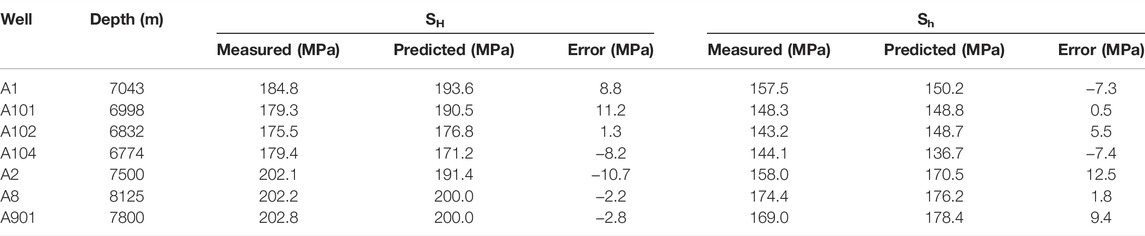
TABLE 1. Analysis of numerical simulation results of in situ stress.
The in situ stress distribution of the thrust imbricate structure is complex, especially the disturbance effect of the fault on the in situ stress (Meyer et al., 2007; Rasouli and Sutherland, 2014). In this study, the in situ stress shows a special distribution feature in the thrust imbricate structure (Figure 6). In the area around a fault, the in situ stress in the footwall is lower than that of the hanging wall, even if the footwall is buried deeper. Moreover, the greater the fault offset, the greater is the stress difference between the hanging wall and footwall, that is, the in situ stress value within the control range of the footwall is lower. According to the statistics of stress values from the hanging wall and the footwall of 20 faults (Figure 8), when the fault offset is less than 50 m, the stress difference is less than 5 MPa, and while it exceeds 500 m, the stress difference exceeds 15MPa, and there is a good correlation between the fault distance and stress difference between the hanging wall and footwall. In addition, the footwall of the overthrust generally shows low stress value. The higher the degree of overthrust, the larger is the range of low stress area of the footwall.
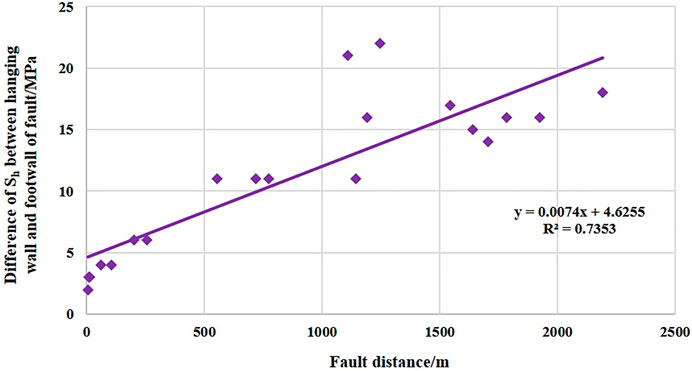
FIGURE 8. Relationship between thrust fault distance and the difference of minimum horizontal principal stress between the hanging wall and footwall.
Previous studies (Liu et al., 2004; Li et al., 2012; Liu JS. et al., 2022) indicate that the wellbore trajectory is the most stable along the direction of the SH under the strike–slip stress regime. The practice of Tarim Oilfield also confirms that under the ultra-deep strike–slip stress regime, highly deviated wells have fewer complex drilling accidents and shorter drilling cycle compared with the vertical wells (Xu et al., 2020; Cai et al., 2022). Therefore, in the Bozi gas field, highly deviated wells or horizontal wells have better wellbore stability.
The in situ stress field in the Bozi gas field is heterogeneous, and the in situ stress distributes in the belt horizontally and stratified vertically. The directional wells (inclined or horizontal wells) are more likely to drill in favorable low-stress zones than the vertical wells, and the directional trajectory or sidetrack drilling may be adjusted during the drilling based on in situ stress field.
Due to the high degree of overthrust in the Bozi gas field and the favorable low-stress area is often in the footwall, the vertical well method cannot meet the drilling conditions, while the directional well method can avoid the obstacles of nontarget layer and drill into the favorable area of target layer. The existing practice in Tarim Oilfield also proves that the production of directional wells is higher than that of the vertical wells. Therefore, it is considered that the highly deviated wells are more suitable for hydrocarbon exploitation in the Bozi gas field.
1) The Bozi reservoir is in extremely strong in situ stress environment, which is featured by high in situ stress and horizontal minimum principal stress (Sh) of the Cretaceous reservoir ranging between 153 and 180 MPa, and horizontal maximum principal stress generally exceeds 200 MPa. It is dominant by the strike–slip stress regime.
2) The in situ stress of the Bozi gas field has obvious stratification characteristics vertically, and it can be divided into three stress sequences of “low–high–low ”. The upper part of K1bs2 and K1bs3 is a low-stress segment, the lower part of K1bs3, K1bx1, and K1bx2 are high-stress segments, and the lower part of K1bx2 is a low-stress segment, resulting in great difference in interlayer stress.
3) The in situ stress distribution of the Bozi gas field is greatly affected by the structural style of the fault anticline. The symmetrical imbricate faulted anticline and pop-up structure show regular and symmetrical in situ stress distribution, with low stress at the top of anticline and high stress at the wings. The stress is low at the top of anticline and high at the wings. In the north steep and south gentle type, the stress is high in the north wing and low in the south wing. In the north gentle and south steep type, the stress is low in the north wing and high in the south wing.
4) The overthrust structure has an obvious influence on the in situ stress distribution. In the area around a fault, in situ stress in the footwall is lower than that of the hanging wall. The greater the fault offset, the greater is the stress difference between the hanging wall and footwall. The footwall of the overthrust generally shows low stress value. The higher the degree of overthrust, the larger is the range of low stress area of footwall.
5) In the Bozi gas field, under the strike–slip stress regime, the directional wells have multiple advantages such as safety and stability, crossing more favorable parts and avoiding nontarget formation obstacles. The highly deviated wells are more suitable for the Bozi gas field to carry out hydrocarbon exploitation.
The original contributions presented in the study are included in the article/Supplementary Material. Further inquiries can be directed to the corresponding author.
KX, Conceptualization, Investigation, Writing—Original Draft; HZ, Supervision, Methodology, Validation; RD, Software, Visualization; WJ, Formal Analysis; YX, Data Curation; DC, Writing—revised manuscript; LF, Formal Analysis; FY, Formal Analysis; SL, Software; JL, Software; WZ, Software; BZ, Software.
This study is funded by the Major National Science and Technology Project (2016ZX05051), the Major Science and Technology Project of PetroChina Company Limited (2018E-1803), and the Natural Science Foundation of Jiangsu Province, China (No. BK20201349).
KX, HZ, RD, YX, DC, LF, FY, SL, JL, WZ, and BZ were employed by Tarim Oilfield Company, PetroChina.
The remaining author declares that the research was conducted in the absence of any commercial or financial relationships that could be construed as a potential conflict of interest.
All claims expressed in this article are solely those of the authors and do not necessarily represent those of their affiliated organizations, or those of the publisher, the editors, and the reviewers. Any product that may be evaluated in this article, or claim that may be made by its manufacturer, is not guaranteed or endorsed by the publisher.
Anderson, E. M. (1951). The Dynamics of Faulting and Dyke Formation with Applications to Britain. second ed. Edinburgh: Oliver, 206.
Bai, G. P., and Cao, B. F. (2014). Characteristics and Distribution Patterns of Deep Petroleum Accumulations in the World. Oil Gas Geol. 35 (1), 19–25. doi:10.11743/ogg20140103
Bell, J. S., and Gough, D. I. (1979). Northeast-southwest Compressive Stress in Alberta Evidence from Oil Wells. Earth Planet. Sci. Lett. 45, 475–482. doi:10.1016/0012-821X(79)90146-8
Bloch, S., Lander, R. H., and Bonnell, L. (2002). Anomalously High Porosity and Permeability in Deeply Buried Sandstone Reservoirs: Origin and Predictability. AAPG Bull. 86 (2), 301–328. doi:10.1306/61eedabc-173e-11d7-8645000102c1865d
Cai, Z. Z., Xu, K., Zhang, H., Wang, Z. M., Yin, G. Q., and Liu, X. Y. (2022). ROP Improvement and Production Enhancement for Ultra⁃Deep Wells Based on Geology⁃Engineering Integration: A Case in Kuqa Depression, Tarim Basin. Xinjiang Pet. Geol. 43 (2), 206–213. doi:10.7657/XJPG20220212
Cao, Y. C., Yuan, G. H., Yang, H. J., Wang, Y. Z., Liu, K. Y., Zan, N. M., et al. (2022). Current Situation of Oil and Gas Exploration and Research Progress of the Origin of High-Quality Reservoirs in Deep-Ultra-Deep Clastic Reservoirs of Petroliferous Basins. Acta Pet. Sin. 43 (1), 112–140. doi:10.7623/syxb202201010
Dutton, S. P., and Loucks, R. G. (2010). Diagenetic Controls on Evolution of Porosity and Permeability in Lower Tertiary Wilcox Sandstones from Shallow to Ultradeep (200-6700m) Burial, Gulf of Mexico Basin, U.S.A. Mar. Petroleum Geol. 27 (1), 69–81. doi:10.1016/j.marpetgeo.2009.08.008
Girard, J.-P., Munz, I. A., Johansen, H., Lacharpagne, J.-C., and Sommer, F. (2002). Diagenesis of the Hild Brent Sandstones, Northern North Sea: Isotopic Evidence for the Prevailing Influence of Deep Basinal Water. J. Sediment. Res. 72 (6), 746–759. doi:10.1306/040102720746
Glasmann, J. R. (1992). The Fate of Feldspar in Brent Group Reservoirs, North Sea: A Regional Synthesis of Diagenesis in Shallow, Intermediate, and Deep Burial Environments. Geol. Soc. Lond. Spec. Publ. 61 (1), 329–350. doi:10.1144/GSL.SP.1992.061.01.17
He, Z. L., Zhang, J. T., Ding, Q., You, D. H., Peng, S. T., Zhu, D. Y., et al. (2017). Factors Controlling the Formation of High-Quality Deep to Ultra-deep Carbonate Reservoirs. Oil Gas Geol. 38 (4), 633–644. doi:10.11743/ogg20170401
Hickman, S. H. (1983). “The Interpretation of Hydraulic Fracturing Pressure-Time Data for In-Situ Stress Determination,” in Proc. Of Workshop on Hydraulic Fracturing Stress Measurements. Editors D.C. Washington, and B.C. Zoback (Monterey: National Academy Press).
Hu, S. B., Long, Z. L., Zhu, J. Z., Hu, D., Huang, Y. P., Shi, Y. L., et al. (2019). Characteristics of Geothermal Field and the Tectonic-Thermal Evolution in Pearl River Mouth Basin. Acta Pet. Sin. 40 (S1), 178–187. doi:10.7623/syxb2019S1015
Hu, W., Bao, J., and Hu, B. (2013). Trend and Progress in Global Oil and Gas Exploration. Petroleum Explor. Dev. 40 (4), 439–443. doi:10.1016/s1876-3804(13)60055-5
Jia, C. Z., and Pang, X. Q. (2015). Research Processes and Main Development Directions of Deep Hydrocarbon Geological Theories. Acta Pet. Sin. 36 (12), 1457–1469. doi:10.7623/syxb201512001
Jia, C. Z., Zheng, M., and Zhang, Y. F. (2012). Unconventional Hydrocarbon Resources in China and the Prospect of Exploration and Development. Petroleum Explor. Dev. 39 (2), 129–136. doi:10.1016/s1876-3804(12)60026-3
Jiang, T. W., Zhang, H., Xu, K., Wang, Z. M., and Wang, H. Y. (2020). Reservoir Geomechanical Characteristics and the Influence on Development in Keshen Gas Field. J. Southwest Petroleum Univ. (Science&Technology Ed. 42 (04), 1–12. 10.11885j.issn.1674-5086.2020.04.09.01
Ju, W., Shen, J., Qin, Y., Wang, G., Xu, K., Li, G., et al. (2021). Stress Distribution in the Upper Shihezi Formation from 1D Mechanical Earth Model and 3D Heterogeneous Geomechanical Model, Linxing Region, Eastern Ordos Basin, Central China. Acta Geol. Sin. ‐ Engl. Ed. 95 (03), 976–987. doi:10.1111/1755-6724.14411
Li, C. L., Zhu, S. Y., Wang, F. L., Du, Q. L., You, C. M., Zhu, L. H., et al. (2017). Some Topics about Reservoir Sensitivity Evaluation. Xinjiang Pet. Geol. 38, 488–491. doi:10.7657/XJPG20170419
Li, J., She, Y. Q., Gao, Y., Yang, G. R., Li, M. P., and Yang, S. (2019). Onshore Deep and Ultra-deep Natural Gas Exploration Fields and Potentials in China. China Pet. Explor. 24 (04), 403–417. doi:10.3969/j.issn.1672-7703.2019.04.001
Li, Y., Xue, Z. J., Cheng, Z., Jiang, H. J., and Wang, R. Y. (2020). Progress and Development Directions of Deep Oil and Gas Exploration and Development in China. China Pet. Explor. 25 (1), 45–57. doi:10.3969/j.issn.1672-7703.2020.01.005
Li, Y. F., Fu, Y. Q., Tang, G., She, C. Y., and Zhang, J. Y. (2012). Laws of the Effects of Earth Stress Patterns on Wellbore Stability in a Directional Well. Nat. Gas. Ind. 32 (3), 78–80. doi:10.3787/j.issn.1000-0976.2012.03.018
Li, Z. M., and Zhang, J. Z. (1997). In-situ Stress and Exploration and Development of Oil and Gas. Beijing: Petroleum Industry Press.
Liu, J., Ding, W., Wang, R., Yin, S., Yang, H., and Gu, Y. (2017a). Simulation of Paleotectonic Stress Fields and Quantitative Prediction of Multi-Period Fractures in Shale Reservoirs: A Case Study of the Niutitang Formation in the Lower Cambrian in the Cen'gong Block, South China. Mar. Petroleum Geol. 84, 289–310. doi:10.1016/j.marpetgeo.2017.04.004
Liu, J., Ding, W., Yang, H., Wang, R., Yin, S., Li, A., et al. (2017b). 3D Geomechanical Modeling and Numerical Simulation of In-Situ Stress Fields in Shale Reservoirs: A Case Study of the Lower Cambrian Niutitang Formation in the Cen'gong Block, South China. Tectonophysics 712-713, 663–683. doi:10.1016/j.tecto.2017.06.030
Liu, J. S., Mei, L. F., Ding, W. L., Xu, K., Yang, H. M., and Liu, Y. (2022b). Asymmetric Propagation Mechanism of Hydraulic Fracture Networks in Continental Reservoirs. GSA Bull. doi:10.1130/B36358.1
Liu, J., Yang, H., Xu, K., Wang, Z., Liu, X., Cui, L., et al. (2022a). Genetic Mechanism of Transfer Zones in Rift Basins: Insights from Geomechanical Models. GSA Bull. doi:10.1130/B36151.1
Liu, X. J., Luo, P. Y., and Meng, Y. F. (2004). Influence of Ground Stress Field on Borehole Trajectory Design and Well-Face Stability. Nat. Gas. Ind. (9), 57–59+8.
Liu, X. J., and Luo, P. Y. (1999). Oil Logging and Wellbore Stability. Beijing: Petroleum Industry Press.
Lu, S. K., Wang, D., Li, Y. K., Meng, X. J., Hu, X. Y., and Chen, S. W. (2015). Research on Three-Dimensional Mechanical Parameters' Distribution of the Tight Sandstone Reservoirs in Daniudi Gasfield. Nat. Gas. Geosci. 26, 1844–1850. doi:10.11764/j.issn.1672-1926.2015.10.1844
Meyer, D., Zarra, L., and Yun, J. (2007). From BAHA to Jack, Evolution of the Lower Tertiary Wilcox Trend in the Deepwater Gulf of Mexico. Sed. Rec. 5 (3), 4–9. doi:10.2110/sedred.2007.3.4
Pang, X.-Q., Jia, C.-Z., and Wang, W.-Y. (2015). Petroleum Geology Features and Research Developments of Hydrocarbon Accumulation in Deep Petroliferous Basins. Pet. Sci. 12 (1), 1–53. doi:10.1007/s12182-015-0014-0
Rains, D. B., Zarra, L., and Meyer, D. (2007). The Lower Tertiary Wilcox Trend in the Deepwater Gulf of Mexico. Houst. Geol. Soc. Bull. 50 (2), 24.
Rasouli, V., and Sutherland, A. (2014). Geomechanical Characteristics of Gas Shales: A Case Study in the North Perth Basin. Rock Mech. Rock Eng. 47, 2031–2046. doi:10.1007/s00603-013-0531-3
Tian, J., Yang, H. J., Wu, C., Mo, T., Zhu, W. H., and Shi, L. L. (2020). Discovery of Well Bozi 9 and Ultra-deep Natural Gas Exploration Potential in the Kelasu Tectonic Zone of the Tarim Basin. Nat. Gas. Ind. 40 (01), 11–19. doi:10.3787/j.issn.1000-0976.2020.01.002
Wang, K., Yang, H. J., Zhang, H. L., Li, Y., Zhang, R. H., Yang, X. J., et al. (2018). Characteristics and Effectiveness of Structural Fractures in Ultra-deep Tight Sandstone Reservoir: A Case Study of Keshen-8 Gas Pool in Kuqa Depression, Tarim Basin. Oil Gas Geol. 39 (4), 719–729. doi:10.11743/ogg20180409
Wang, K., Zhang, R. H., Zeng, Q. H., Wang, J. P., Xia, J. F., and Mo, T. (2022). Characteristics and Formation Mechanism of Lower Cretaceous Deep and Ultra-deep Reservoir in Bozi-Dabei Area, Kuqa Depression. J. China Univ. Min. Technol. 51 (02), 311–328. doi:10.13247/j.cnki.jcumt.001337
Xu, K., Dai, J. S., Feng, J. W., Shang, L., and Ren, Q. Q. (2018a). Prediction of 3D Heterogeneous In-Situ Stress Field of Northern Area in Gaoshen, Nanpu Sag, Bohai Bay Basin, China. J. China Univ. Min. Technol. 47 (6), 1276–1286. doi:10.13247/j.cnki.jcumt.000869
Xu, K., Dai, J. S., Shang, L., Feng, J. W., and Fang, L. (2018b). Prediction of Current In Situ Stress Field and its Application of Southern Area of Deep Reservoir in Gaoshangpu Oilfield. J. China Univ. Petroleum(Edition Nat. Sci. 42 (6), 19–29. doi:10.3969/j.issn.1673-5005.2018.06.003
Xu, K., Tian, J., Yang, H. J., Zhang, H., Ju, W., Liu, X. Y., et al. (2022). Effects and Practical Applications of Present-Day In-Situ Stress on Reservoir Quality in Ultra-deep Layers of Kuqa Depression,Tarim Basin. Nat. Gas. Geosci. 33 (1), 13–23. doi:10.11764/j.issn.1672-1926.2020.09.002
Xu, K., Tian, J., Yang, H. J., Zhang, H., Wang, Z. M., Yuan, F., et al. (2020). Prediction of Current In Situ Stress Field and its Application of Deeply Buried Tight Reservoir, a Case Study of Keshen 10 Gas Reservoir in Kelasu Structural Belt, Tarim Basin. J. China Univ. Min. Technol. 49 (4), 708–720. doi:10.13247/j.cnki.jcumt.001134
Yang, H. J., Chen, Y. Q., Tian, J., Du, J. H., Zhu, Y. F., Li, H. H., et al. (2020). Great Discovery and its Significance of Ultra-deep Oil and Gas Exploration in Well Luntan-1 of the Tarim Basin. China Pet. Explor. 25 (02), 62–72. doi:10.3969/j.issn.1672-7703.2020.02.007
Yang, H. J., Li, Y., Tang, Y. G., Lei, G. L., Zhou, L., and Zhou, P. (2019). Discovery of Kelasu Subsalt Deep Large Gas Field, Tarim Basin. Xinjiang Pet. Geol. 40 (01), 12–20.
Yang, H. J., Zhang, R. H., Yang, X. Z., Wang, K., Wang, J. P., Tang, Y. G., et al. (2018). Characteristics and Reservoir Improvement Effect of Structural Fracture in Ultra-deep Tight Sandstone Reservoir: A Case Study of Keshen Gasfield,Kuqa Depression, Tarim Basin. Nat. Gas. Geosci. 29 (7), 942–950. doi:10.11764/j.issn.1672-1926.2018.06.018
Zang, A., and Stephansson, O. (2010). Stress Field of the Earth's Crust. Netherlands: Springer Netherlands.
Zeng, L. B., Lyu, P., Qu, X. F., and Fan, J. M. (2020a). Multi-scale Fractures in Tight Sandstone Reservoirs with Low Permeability and Geological Conditions of Their Development. Oil Gas Geol. 41 (3), 449–454. doi:10.11743/ogg20200301
Zeng, L. B., Qi, J. F., Wang, C. G., and Li, Y. L. (2008). The Influence of Tectonic Stress on Fracture Formation and Fluid Flow. Earth Sci. Front. 15 (3), 292–298.
Zeng, Q. L., Mo, T., Zhao, J. L., Tang, Y. L., Zhang, R. H., Xia, J. F., et al. (2020b). Characteristics,genetic Mechanism and Oil and Gas Exploration Significance of High-Quality Sandstone Reservoirs Deeper Than 7 000 M: a Case Study of the Bashijiqike Formation of Lower Cretaceous in the Kuqa Depression. Nat. Gas. Ind. 40 (1), 38–47. doi:10.3787/j.issn.1000-0976.2020.01.005
Zhang, H., Yin, G. Q., and Wang, H. Y. (2018). Effects of Natural Fractures Geomechanical Response on Gas Well Productivity in Kuqa Depression, Tarim Basin. Nat. Gas. Geosci. 30 (3), 379–388. doi:10.11764/j.issn.1672-1926.2018.10.020
Keywords: in situ stress, geomechanics, numerical simulation, ultra-deep reservoir, Kuqa depression, Tarim basin
Citation: Xu K, Zhang H, Dong R, Ju W, Xie Y, Cui D, Fang L, Yuan F, Lai S, Liang J, Zhang W and Zhao B (2022) In Situ Stress Distribution in Cretaceous Ultra-Deep Gas Field From 1D Mechanical Earth Model and 3D Heterogeneous Geomechanical Model, Kuqa Depression, Tarim Basin, NW China. Front. Earth Sci. 10:937393. doi: 10.3389/feart.2022.937393
Received: 06 May 2022; Accepted: 30 May 2022;
Published: 08 July 2022.
Edited by:
Jingshou Liu, China University of Geosciences Wuhan, ChinaReviewed by:
Zikang Xiao, Ministry of Emergency Management of China, ChinaCopyright © 2022 Xu, Zhang, Dong, Ju, Xie, Cui, Fang, Yuan, Lai, Liang, Zhang and Zhao. This is an open-access article distributed under the terms of the Creative Commons Attribution License (CC BY). The use, distribution or reproduction in other forums is permitted, provided the original author(s) and the copyright owner(s) are credited and that the original publication in this journal is cited, in accordance with accepted academic practice. No use, distribution or reproduction is permitted which does not comply with these terms.
*Correspondence: Ke Xu, eHVrZWUwNTA1QDE2My5jb20=
Disclaimer: All claims expressed in this article are solely those of the authors and do not necessarily represent those of their affiliated organizations, or those of the publisher, the editors and the reviewers. Any product that may be evaluated in this article or claim that may be made by its manufacturer is not guaranteed or endorsed by the publisher.
Research integrity at Frontiers
Learn more about the work of our research integrity team to safeguard the quality of each article we publish.