
95% of researchers rate our articles as excellent or good
Learn more about the work of our research integrity team to safeguard the quality of each article we publish.
Find out more
ORIGINAL RESEARCH article
Front. Earth Sci. , 15 August 2022
Sec. Atmospheric Science
Volume 10 - 2022 | https://doi.org/10.3389/feart.2022.935139
This article is part of the Research Topic Atmospheric Physics, Atmospheric Environment, and Atmospheric Effects on Human Health View all 12 articles
 Yassmin H. Essa1,2*
 Chiara Cagnazzo1,3
 Fabio Madonna4Paolo Cristofanelli5
 Chunxue Yang1
 Federico Serva1
 Luca Caporaso1,6
 Rosalia Santoleri1
Atmospheric temperature is a key variable to detect and attribute climate change. Due to the relative sparseness of ground-based observations and heterogeneity of satellite data, global atmospheric reanalysis products are considered valuable datasets for studying and monitoring the climate, since these usually ensure spatially complete and continuous temporal coverage. Consequently, evaluating differences among the existing reanalyses is key to identifying inconsistencies. To this aim, the current study intercompares the climatological mean, variability, and linear trends for upper air temperature provided from four recent atmospheric reanalysis products (ERA5, ERA-Interim, MERRA-2, and JRA-55) The Reanalysis Multi-Model Ensemble-mean (RMME) is used as a comparator. Radiosonde observations are included for comparison on the regional scale (tropics). The results reveal that all evaluated reanalyses provide a consistent reproduction of the upper-air temperature profile. Temperature differences from RMME within ±0.25 K are found in both the troposphere and lower stratosphere, except for a few specific regions. Larger differences (>± 1.5 K) and discrepancies among the datasets are found in the upper stratosphere. Agreement between reanalyses increased after 1998. Differences in the temperature time series and seasonal cycle at the regional scales are smaller in the Northern Hemisphere mid-latitudes than in the tropics and Southern Hemisphere. A robust cooling trend in the lower stratosphere during the period of largest ozone depletion (1980-1997) and a warming trend in the troposphere for the period 1998-2018 are clearly found, at the global level, in all the datasets. Temperature trends and variability in the tropics are consistent in all reanalysis datasets with the homogenized radiosonde records from the lower to middle troposphere and in the lower stratosphere. However, large differences are found in the upper troposphere, tropical tropopause layer (TTL), and middle stratosphere. The well-known temperature variability in the lower stratosphere associated with Quasi-Biennial Oscillation (QBO) is captured in both reanalyses and observational datasets. Among the reanalyses, ERA5 shows the smallest temperature difference with respect to homogenized upper-air radiosoundings records.
Atmospheric temperature is a state variable, crucial to understanding and predicting the evolution of climate. It is especially important to identify climate change signals in the troposphere and stratosphere (Steiner et al., 2020). For example, the rising of the tropopause, resulting from the warming of the troposphere and the cooling of the stratosphere, has been indicated as one of the most robust fingerprints of anthropogenic climate change (IPCC, 2013; Pisoft et al., 2021), along with stratospheric ozone depletion affecting the temperature profile in the stratosphere (Polvani et al., 2011; Ivanciu et al., 2021).
The limitations of studying upper-air temperature are mainly due to the incompleteness and heterogeneity of satellite and ground-based atmospheric observations (Sterin et al., 2008). A valuable alternative solution to observational datasets is atmospheric reanalysis data (Baatz et al., 2021), which combines vast amounts of observations with numerical models using data assimilation techniques to provide a globally complete gridded and continuous temporal coverage dataset. However, the accuracy of reanalysis products varies strongly (Dee et al., 2011) especially for variables that are very sensitive to atmospheric dynamics and to the main parameters of the assimilation systems, such as the quantity and quality of the assimilated observations, the assimilation scheme (e.g., variational, Kalman filter), and the background forecast model, particularly the spatial and temporal resolutions (Simmons et al., 2004; Alghamdi, 2020; Gleixner et al., 2020). The usability of reanalyses data for long-term climate applications, including trend estimation, is controversial as discussed in the literature, for specific regions in previous reanalyses generations (e.g., Thorne, 2008; Thorne and Vose, 2010). Assessing both long-term temperature variability and trend using reanalyses proved to be challenging due to changes in the assimilation systems and observations that can introduce inhomogeneities, and to the documented difficulties with the representation of low-frequency variations (Simmons et al., 2017; Madonna et al., 2022).
Several intercomparison studies of upper air temperature were performed to assess the quality of the datasets since the first release of the reanalysis products (e.g., ERA15 & NCEP-R1: Pawson and Fiorino 1998, 1999; ERA40 & ERA15 & NCEP-R1: Randel et al., 2004; ERA40 & NCEP-R1 & R2: Manney et al., 2005). Major outcomes of these assessments showed that ERA products agree better with radiosonde observations and have better performance in resolving the low tropopause temperatures compared to NCEP temperatures that are more biased towards satellite-derived values (Pawson and Fiorino, 1998). Evident differences between datasets for temperature at specific regions and/or levels are also documented (e.g. polar lower stratosphere, temperatures near the tropical tropopause and the global stratopause).
In terms of variability and trends studies (Simmons et al., 2014), reasonable agreement is reported in the lower-middle troposphere and lower stratosphere, while larger variations accounted for the mid-upper stratosphere among the considered reanalyses (ERA-40, ERA-interim, MERRA, and JRA-55).
Recently the “Stratosphere-troposphere Processes And their Role in Climate (SPARC) Reanalysis Intercomparison Project (S-RIP)” devoted a notable effort in intercomparing different generations of reanalysis products (SPARC, 2022). Wide enhancements for the reanalyses in terms of model characteristics, physical parameterizations employed, assimilation schemes, and observations assimilated, have been archived as a function of their evolution in time (Fujiwara et al., 2017).
In this framework, particular attention was paid to intercomparing the climatology and variability of the atmospheric temperature and wind variables in reanalyses for the period 1979-2014 (Long et al., 2017), pointing out major improvements for the recent generation of reanalyses compared to the older versions. Discontinuities due to the changing in assimilation instrument(s) were also discussed revealing evident improvements both in the troposphere and in the lower stratosphere in the recent generation (e.g., ERA-Interim versus ERA-40; MERRA2 versus MERRA, JRA-55 versus JRA-25), while issues persist in the upper stratosphere–lower mesosphere.
SPARC project also evaluated the climatological and long-term tropical tropopause layer (TTL) temperature and tropopause characteristics in older and new generations of reanalysis datasets (Tegtmeier et al., 2020), revealing larger biases at TTL in the older reanalysis generations. The recent reanalyses (ERA5, ERA-Interim, MERRA-2, JRA-55, and CFSR) provide realistic representations of temperature structure within the TTL, and the vertical resolution of the involved products played a significant role in representing the temperature at the cold point and lapse rate at the tropopause.
As pointed out, comprehensive inter-comparisons between the old and new generations of reanalyses are provided in the literature. However, among the recent generations, the products’ quality and suitability for a broad set of climate studies or applications are still under discussion or a few discussed for specific regions (e.g., Graham et al., 2019; Alghamdi, 2020; Keller and Wahl, 2021; Simmons, 2022). Furthermore, ERA5, the newest global reanalysis product and one of the most used reanalysis families, has not been extensively intercompared and discussed at the current time compared to the other products. Therefore, the main goal of this study is to investigate the vertical structure of the atmospheric temperature and the coherence among the most recent reanalysis products (ERA5, ERA-Interim, MERRA-2, and JRA-55), focusing on both global and regional scales, with particular attention to the variability and trends. The latter can significantly be influenced by the discontinuities associated with changing the assimilation instruments in reanalysis systems. The reanalyses multi-model mean (RMME) used as a comparator in this study, assuming it is able to minimize the discrepancy with the unknown true value, although it provides a smoother representation of climate variability. The upper-air homogenized observational datasets are also used as a benchmark at a regional scale. A set of diagnostics are used, highlighting the strengths and weaknesses of the presented reanalysis products.
The paper is organized as follows; the considered datasets and methodology are described in Sections 2 and 3. Time series and climatological differences from RMME, trend assessment, and comparison with observations are discussed in Section 4. Discussion and conclusions of the results are provided in Section 5. A list of all acronyms used in this paper is provided in the GLOSSARY section, some of the most important for the understanding of the paper are also introduced in the text.
The datasets considered in this study include two datasets of European Centre for Medium-Range Weather Forecasts (ECMWF) reanalyses ERA5 (Hersbach et al., 2020) and ERA-Interim (Dee et al., 2011), NASA’s Modern Era Retrospective Analysis for Research and Applications-2 (MERRA-2: Molod et al., 2015; Gelaro et al., 2017), and Japanese 55-years Reanalysis (JRA-55: Kobayashi et al., 2015). Climate Forecast System Reanalysis (CFSR) dataset has been excluded as it has changed in 2011 to CFSR-2 with higher resolution and upgrade to the forecast model, and assimilation scheme (SPARC Reanalysis Intercomparison Project (S-RIP), 2022), while the intercomparison of this study focuses on the recent reanalyses which are consistent in their system (i.e., used the same forecast model and assimilation scheme over the entire assessed period).
Older versions of the chosen datasets have been discarded (JRA-25, ERA-40, and MERRA), as they have been discontinued. Nevertheless, we decided to include ERA-Interim (discontinued in September 2019), because it is the former ECMWF reanalysis, recently replaced by ERA5, and it is crucial to understand the quality of this new product with respect to the predecessor version. It is known that reanalyses that span the whole 20th century with global coverage, like ERA-20C or NOAA’s 20CR, are less accurate in the upper atmosphere, as they assimilate surface observations only (Fujiwara et al., 2017); therefore, they have been excluded from the comparison.
ERA5 (Hersbach et al., 2020) is the fifth and latest version of atmospheric global reanalysis provided by the European Centre for Medium-Range Weather Forecasts (ECMWF). It is produced using a four-dimensional variational (4D-Var) data assimilation and model forecasts in CY41R2 of ECMWF’s Integrated Forecast System (IFS) 2016 release, with a TL639 (∼31 km) spatial resolution, and 137 hybrid vertical levels with the top level at 0.01 hPa. The data is available in the climate data store (CDS) in hourly temporal resolution, 0.25° × 0.25° spatial resolution, and interpolated to 37 pressure levels ranging from 1,000 hPa to 1 hPa. In addition to the use of an updated version of IFS in the dataset production and the higher spatial, temporal and vertical resolutions with respect to the preceding version ERA-interim, ERA5 assimilates a much larger number of reprocessed observational datasets that are expected to enhance the reanalysis products, and it depicts a better representation in the troposphere (Hersbach et al., 2020). ERA5 uses the data prepared for CMIP5 (van Vuuren et al., 2011; Lamarque et al., 2010) for representing the evolution of tropospheric aerosols. Volcanic sulfates (Sato et al., 1993) and ash (Tanré et al., 1984) are considered in the stratosphere. Carbon dioxide and trace gases are also treated based on CMIP5-recommended values (Meinshausen et al., 2011), with the extension of RCP3PD scenario after 2010 (“PD” stands for Peak and Decline).
A supplement dataset of the ERA5, called “ERA5.1”, has been released by ECMWF in May 2020 covering the period from 2000 to 2006 to improve the reported cold bias in the lower stratosphere exhibited by ERA5 during the mentioned period (Simmons et al., 2020). ERA5.1 is a rerun of ERA5 from 2000 to 2006, using the background error covariances that were used to produce the ERA5 analyses for the years 1979–1999. It also includes the more restrictive ensemble assimilation of Solar Backscattered Ultra Violet (SBUV) ozone data that was employed in the production of ERA5 from 1979 to 1999. Therefore, in this work, the period 2000-2006 in the ERA5 data is replaced by ERA5.1.
ERA-Interim (Dee et al., 2011) is a global atmospheric reanalysis dataset covering the period from 1 January 1979 up to 31 August- 2019. The assimilation system is based on Cy31r2 of the ECMWF IFS model 2006 release, which includes a 4D-Var. The assimilation includes in situ observations of near-surface air temperature, pressure and relative humidity, upper-air temperature, wind, specific humidity, and rain-affected Special Sensor Microwave Imager (SSMI) radiances. The dataset provides 3 h (forecast) or 6 h (analysis) temporal resolution depending on the selected variable, and a spatial resolution of 0.75° (approximately 79 km) on 60 vertical levels from the surface up to 0.1 hPa. It uses climatological values for aerosols, carbon dioxide, trace gases, and ozone, while it takes prognostic information from the forecasting model for the water vapor and a suite of SST and sea ice data from observations and NCEP.
The Modern-Era Retrospective analysis for Research and Applications, Version 2 (MERRA-2) provides data from 1980 to present (Gelaro et al., 2017), using an updated new version of the Goddard Earth Observing System Data Assimilation System Version 5 (GEOS-5, Molod et al., 2015) atmospheric general circulation model (AGCM) with a 4D-Var data assimilation scheme. Compared to the previous generation of MERRA reanalysis (Rienecker et al., 2011), the assimilation system in MERRA-2 has been updated. The new assimilation system enables the assimilation of modern hyperspectral radiance and microwave observations, along with Global Navigation Satellite System (GNSS) Radio Occultation (RO) datasets. MERRA-2 is the first long-term global reanalysis that assimilates space-based observations of aerosols and represents their interactions with other physical processes in the climate system (Gelaro et al., 2017).
MERRA-2 considered carbon dioxide following the IPCC RCP4.5 scenario, aerosol optical depths from satellites and AERONET are assimilated into the GEOS-5 GAAS (Buchard et al., 2015, 2017; Randles et al., 2017), and the reactive trace gases are specified according to steady-state monthly climatologies from the Goddard two-dimensional chemistry transport model (Rienecker et al., 2008).
The data are hourly fields produced with a horizontal resolution of 0.625° × 0.5° and 72 sigma vertical levels up to 0.01 hPa interpolated to 42 vertical levels from 1,000 hPa to 0.1 hPa available for downloading.
Japanese 55-years Reanalysis (JRA-55) (Kobayashi et al., 2015) is the latest reanalysis produced by the Japan Meteorological Agency (JMA) and released in 2013. It uses a sophisticated data assimilation system based on the operational system as of December 2009 with a 4D-Var scheme. The analysis period covers 55 years, starting from 1958 when regular radiosonde observation began on a global basis. JRA-55 uses in situ observation-based estimates of the COBE (Centennial in situ Observation-Based Estimates)-SST data and sea ice as boundary conditions. Daily values of carbon dioxide and reactive trace gases are assimilated in JRA-55 by interpolating from annual mean values. All species are treated as globally uniform, with sources that vary in time (Kobayashi et al., 2015; Table 7). Aerosols are represented using two aerosol profiles, one over land and one over sea (WMO, 1986), with AOD adjusted to a 2-dimensional monthly climatology (JMA, 2013). Interannual variations, such as those due to volcanic eruptions, are not considered (SPARC, 2022: chapter 2). The dataset spans the period from 1958 to present with 6-h temporal resolution, TL319 (∼55 km) spatial resolution, and 60 vertical levels up to 0.1 hPa. Data interpolated to 1.25° × 1.25° spatial resolution and 37 vertical levels from 1,000 hPa to 1 hPa are available to download. Several issues addressed in the first version (JRA-25) are fixed. It is produced with a higher spatial resolution and a new radiation scheme, 4D-Var with Variational Bias Correction (VarBC) for satellite radiances, and introduction of greenhouse gases with time-varying concentrations.
Three upper-air homogenized data records are used in this study to better understand the performance of the reanalysis datasets: the Radiosonde Observation Correction using Reanalyses (RAOBCORE) (Haimberger, 2007), the Radiosonde Innovation Composite Homogenization (RICH) (Haimberger et al., 2012), and the Radiosounding HARMonization (RHARM) homogenized datasets (Madonna et al., 2022). RAOBCORE and RICH are both homogenized versions for upper air temperatures from the global radiosonde network. The adjustment approach of RAOBCORE/RICH is based mainly on two steps: first to identify the existing shifts in the radiosonde observation time series, then to estimate the size of the shifts through comparison with suitable reference series. A substantial difference between RAOBCORE and RICH in the method used for estimating the break size. RAOBCORE uses differences between the original radiosonde observations (obs) and background forecasts (bg) time series of an atmospheric climate data assimilation system used for reanalyses such as, the 40-years European Centre for Medium-Range Weather Forecasts (ECMWF) (ERA-40), ERA-interim, and currently ERA5, for estimating the break sizes, consequently, it is considered a not “independent” dataset for homogenization but it is influenced by satellite data and the assumptions made in the assimilating model. RICH estimates the break size by comparing the observations of a tested time series with observations of neighboring radiosonde time series (RICH-obs) or by comparing their background departures (RICH-τ). Although this approach is independent of satellite data, it remains influenced by breakpoint dates provided by RAOBCORE.
On the other hand, RHARM algorithm identifies breakpoints and estimates adjustments using a hybrid approach based on “reference measurements” (Thorne et al., 2017; Madonna et al., 2022). The RHARM algorithm works on each time series (i.e., station): data since 2004 (with starting time station-dependent) are obtained by post-processing each single radiosounding profile using a GRUAN-like algorithm (Dirsken et al., 2014); data before 2004 are homogenized at mandatory pressure levels using the cumulative sum test for detection of breakpoint and regulating trends using data after 2004 as a constraint. The approach is applied to 700 stations of Integrated Global Radiosounding Archive (IGRA)–Version 2 (Durre et al., 2018) and radiosoundings from ships.
The homogenized variables in RHARM are not influenced by cross-contamination of biases across stations (Sherwood, 2007) nor dependent on reanalysis data (Haimberger et al., 2012).
The three radiosonde datasets provide the temperature at 16 standard pressure levels (10, 20, 30, 50, 70, 100, 150, 200, 250, 300, 400, 500, 700, 850, 925, 1,000 hPa), and cover the common period between reanalyses, 1980–2018, for performing the inter-comparison.
To inter-compare the atmospheric temperature from the global reanalyses shown in Table 1 and quantify the consistency and discrepancy among these reanalyses, we first use the Reanalysis Multi-Model Ensemble-mean (RMME) as the benchmark. The observational datasets are used for tropics to compare the temperature variability related to the Quasi-Biennial Oscillation (QBO) and to study the vertical profiles of trends at mandatory pressure levels from the lower troposphere (850 hPa) to middle stratosphere (10 hPa).
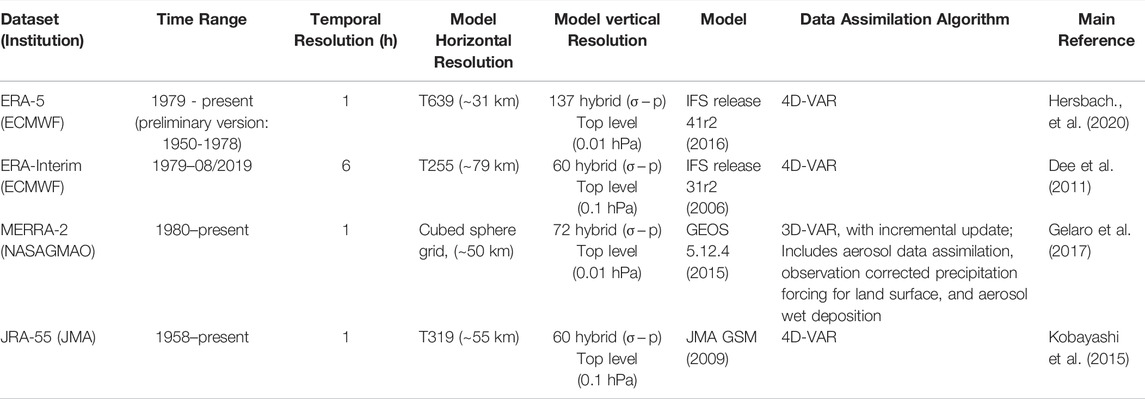
TABLE 1. Summary of the main characteristics of the selected atmospheric reanalysis datasets.
The analysis is conducted for the longest available overlap period among the considered reanalysis datasets (1980–2018), and the common 34 pressure levels, ranging from the “lower” troposphere (1000 hPa) up to the “upper” stratosphere (1 hPa), are considered in the analysis (1,000 hPa, 975 hPa, 950 hPa, 925 hPa, 900 hPa, 875 hPa, 850 hPa, 825 hPa, 800 hPa, 775 hPa, 750 hPa, 700 hPa, 650 hPa, 600 hPa, 550hPa, 500 hPa, 450 hPa, 400 hPa, 350 hPa, 300 hPa, 250 hPa, 200 hPa, 150 hPa, 100 hPa, 70 hPa, 50 hPa, 30 hPa, 20 hPa, 10 hPa, 7 hPa, 5 hPa, 3 hPa, 2 hPa, 1 hPa).
The monthly datasets have been bilinearly interpolated to a common grid and downgraded to the coarsest horizontal resolution grid resolution 1.25° × 1.25° for calculating the RMME. For each grid-point and pressure level, the RMME is therefore estimated as,
where t is the time (monthly frequency), N is the number of ensemble members (N=4) and X(t) is an individual reanalysis product.
The global average temperature, calculated for the four considered datasets over the period 1980-2018, and the corresponding differences with RMME are first investigated. Temperature variability of the reanalysis datasets is examined through the time series and seasonal cycle differences diagnostics at regional scales, focusing on the Northern Hemisphere (NH) mid-latitude (25°N–60°N), Southern Hemisphere (SH) mid-latitude (25°S–60°S), and tropics (25° N–25°S).
Temperature trends are estimated using the ordinary linear least-squares fit to estimate the slope. The effect of the serial correlation (lag-1 temporal autocorrelation of the residuals) of the temperature from each dataset was removed. To determine the robustness of the results, the probability test of error (p-val) analysis was employed to calculate the confidence interval of the temperature trends.
Comparison with observations is finally performed by inspecting temperature anomalies time series from the considered datasets, focusing on the tropical stratospheric region where the signature of the QBO dominates in the lower stratosphere and TTL. Monthly anomalies are calculated for all the reanalyses and observations by first zonally averaging the monthly temperature (on land only for reanalyses) at 6 selected levels (100 hPa, 70 hPa, 50 hPa, 30 hPa, 20 hPa, and 10 hPa) for the region 10°N–10°S. Then, the difference between the temperature time series and its monthly climatology is generated. The vertical profile of the long-term temperature trend is also inter-compared across reanalyses at 13 standard pressure levels from the lower troposphere (850 hPa) to the middle stratosphere (10 hPa).
In the present section, we report the analysis of temperature climatology at the global scale ((section 4.1), temperature time series differences and seasonal cycle differences at two time frames 1980–2000 and 2001–2018 at the regional scale to highlight the main differences among the datasets and periods (section 4.2), the trend assessment (section 4.3) at the global scale and a regional case study (South Polar region). Finally, we compare the reanalyses with the homogenized radiosonde datasets (section 4.4).
The vertical profiles of the zonal mean (latitude vs. pressure level) temperature difference (to RMME) are shown in Figure 1. From the lower troposphere to the middle stratosphere (10 hPa), air temperature climatology shows differences ranging within ±0.25 K except for a few atmospheric regions: the equatorial - mid and upper troposphere (0.5–1.0 K, MERRA-2 and JRA-55), the southern pole middle stratosphere (0.5–1.0 K, ERA5) and the equatorial mid-stratosphere (−1.0 to −0.5 K, ERA-Interim). The largest differences (more than 1.5 K) are found in the southern pole (ERA5, ERA-Interim, JRA-55) below 700 hPa. However, temperature values in this region are vertically extrapolated for all considered reanalyses, except for MERRA-2.
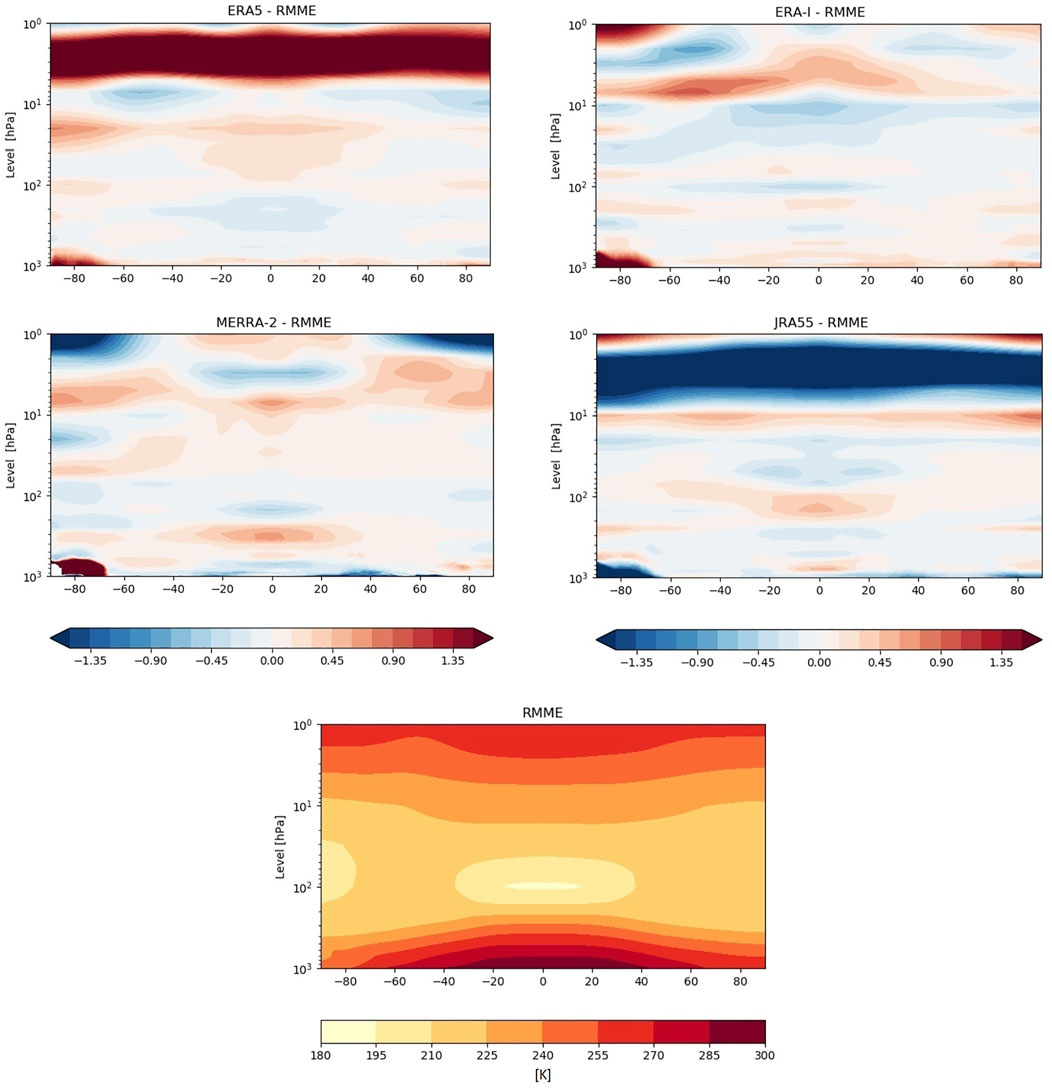
FIGURE 1. Zonal mean of annual mean temperature difference between reanalyses and RMME for the period (1980–2018), and RMME zonal mean temperature map (bottom panel).
From the middle to upper stratosphere, the datasets show larger discrepancies in air temperature climatology. ERA5 (JRA-55) is ∼3.5 K warmer (cooler) than RMME over the entire latitudinal range at the levels within 2–7 hPa, while below these levels (7–10 hPa), this signal is reversed. This reported strong warm (cold) tends to disappear between 1 and 2 hPa for both datasets. ERA-interim shows a warm signal over the polar region between 1–2 hPa, and in the tropics between 3–7 hPa (extending to 90° S between 5–7 hPa). The opposite is found for MERRA-2 which shows a cooler signal at the same pressure levels and regions.
The reported smooth biases of ERA5 and JRA-55 at all latitudinal ranges are possibly due to the difference between the bias correction applied to the radiance in the assimilation model for each dataset. It is useful to highlight that only scan-angle adjustments to SSU-3 and/or AMSU-A14 (Advanced Microwave Sounding Unit for unit A) radiances are applied in ERA5 while a full adjustment to all SSU and AMSU-A channels are applied in JRA-55, as reported by Simmons et al., 2020. It is worth mentioning that a considerable warmer signal in ERA5 than ERA-interim has been also reported by Hersbach et al. (2020) in the monthly time series of the global mean increments between the reanalyses and first-guess fields, at both 0000 and 1200 UTC in the upper stratosphere due to a bias with respect to anchoring satellite observations that peak at those pressure levels, generating the evident warm signal of ERA5 at those levels.
The time series and seasonal cycle are also investigated for all the reanalyses on the regional scale, focusing on the NH mid-latitude (25° N–60° N), SH mid-latitude (25°S–60°S), and tropics (25°N–25°S). Differences between the monthly temperature time series of reanalyses and RMME for these regions are shown in Figure 2. The agreement among reanalyses improves after 1998 in the troposphere and lower stratosphere in all regions due to the transition from the TIROS Operational Vertical Sounder (TOVS) to the Advanced TIROS Operational Vertical Sounder (ATOVS). It is worth mentioning that an improvement in the data homogeneity at this atmospheric region in the recent reanalysis datasets compared to their previous generation versions, particularly after ATOV, is also reported by Long et al. (2017). Another evident improvement across reanalyses is found in the tropical upper troposphere after 2006, likely related to the assimilation of GPS-RO COSMIC data. For all considered reanalyses, the availability of the COSMIC mission data in 2006 significantly increased the number of GNSS-RO profiles available for assimilation (SPARC, 2022: Figure 2.17 in chapter 2).
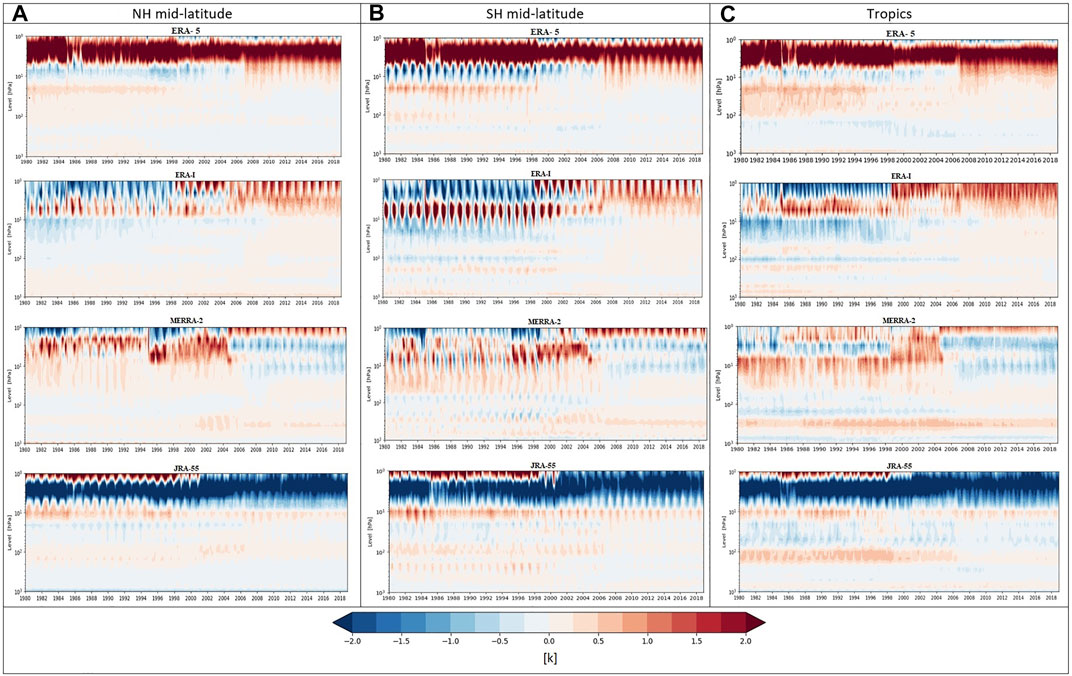
FIGURE 2. Temperature time-series differences (in K) between reanalysis of time series and RMME in the (A-column) NH mid-latitude, (B- column) SH mid-latitude, and (C- column) tropics, spanning the period 1980–2018.
Over the time-series 1980-2018, reanalyses datasets agree better in NH mid-latitude than SH and tropics where a smaller difference, within 0.25 K, is found for all reanalyses with respect to the RMME. In tropics, JRA-55 shows the largest bias at 100 hPa (TTL) within 0.5 K, while the ERA5 has the lowest bias in the same atmospheric region.
A more disagreement between reanalyses in the upper stratosphere (above 10 hPa) is found throughout the time period. The uniform bias of ERA5 and JRA-55, reported in section 4.1, is found in all regions and over all years. The change between TOV and ATOV is evident in ERA-interim dataset, causing a sudden change in the sign at 1–2 hPa. MERRA-2 also shows a substantial discontinuity around 1995 lasting until 2005 in all regions; afterward, improvement in the data homogeneity due to the assimilation of temperatures from Microwave Limb Sounder (MLS) is found.
Seasonal cycle (i.e., monthly climatology) differences between reanalysis products and RMME are examined for the same regions over two periods, 1980-2000 and 2001-2018 as reported in Figures 3, 4 respectively. The reason for dividing this analysis into two periods is to investigate the change in the temperature seasonal cycle before and after the notable improvement in the time series after the availability of ATOVS. The results show a good agreement among all reanalyses which improves after 2000, likely due to the consistency in the assimilation of AMSU-A and AMSU-B radiances–so going from TOVS (1979–2006) to ATOVS (1998 to present), all reanalysis systems assimilate microwave and infrared radiance from these instruments. The improvement can be also due to that all the reanalyses, except for JRA-55, assimilate radiances estimated from the hyperspectral infrared sounders AIRS (2002–present), IASI (2008–present), and/or CrIS (2012–present). In addition, the increasing amount of assimilated observations and, in particular of GNSS-RO, can influence the data performance as pointed out for the tropics.
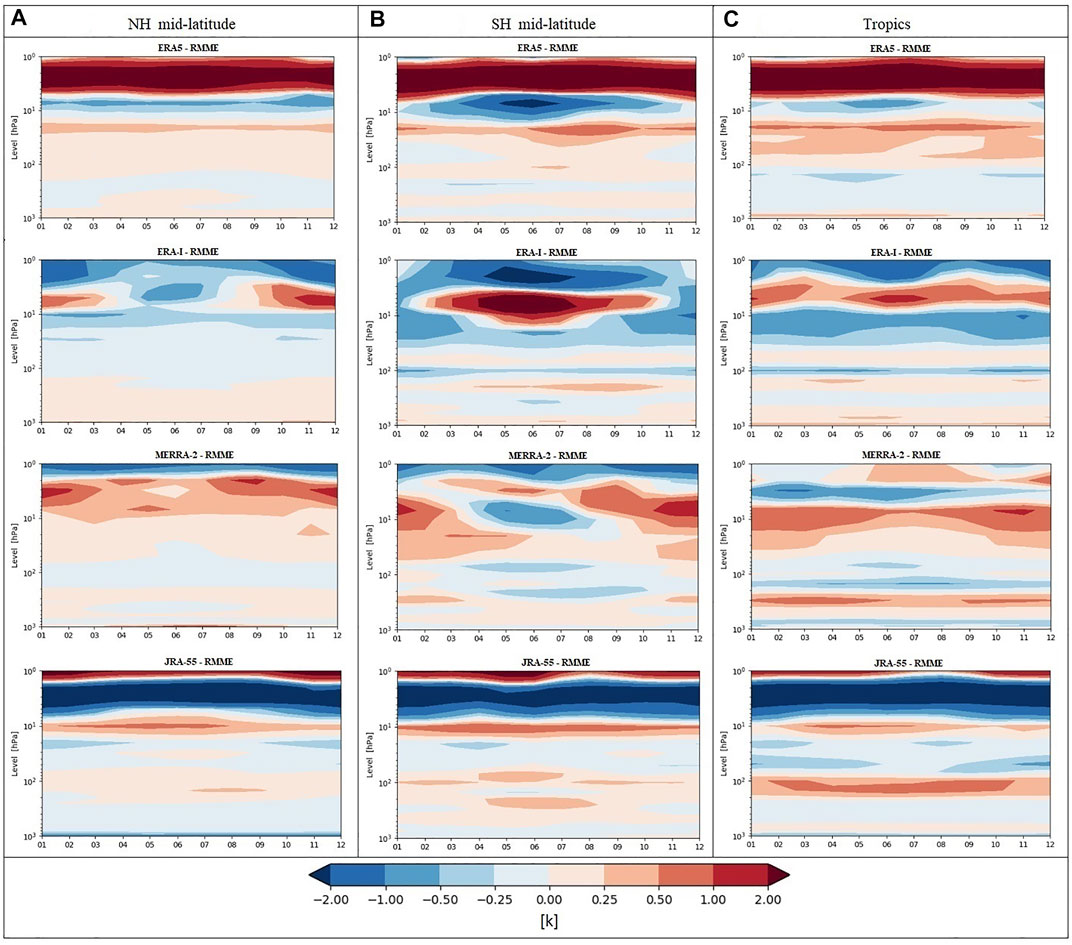
FIGURE 3. Seasonal cycle difference (month vs. pressure level) differences (in K) between reanalyses and RMME in the (A-column) NH mid-latitude, (B- column) SH mid-latitude, and (C- column) tropics, spanning the period 1980–2000.
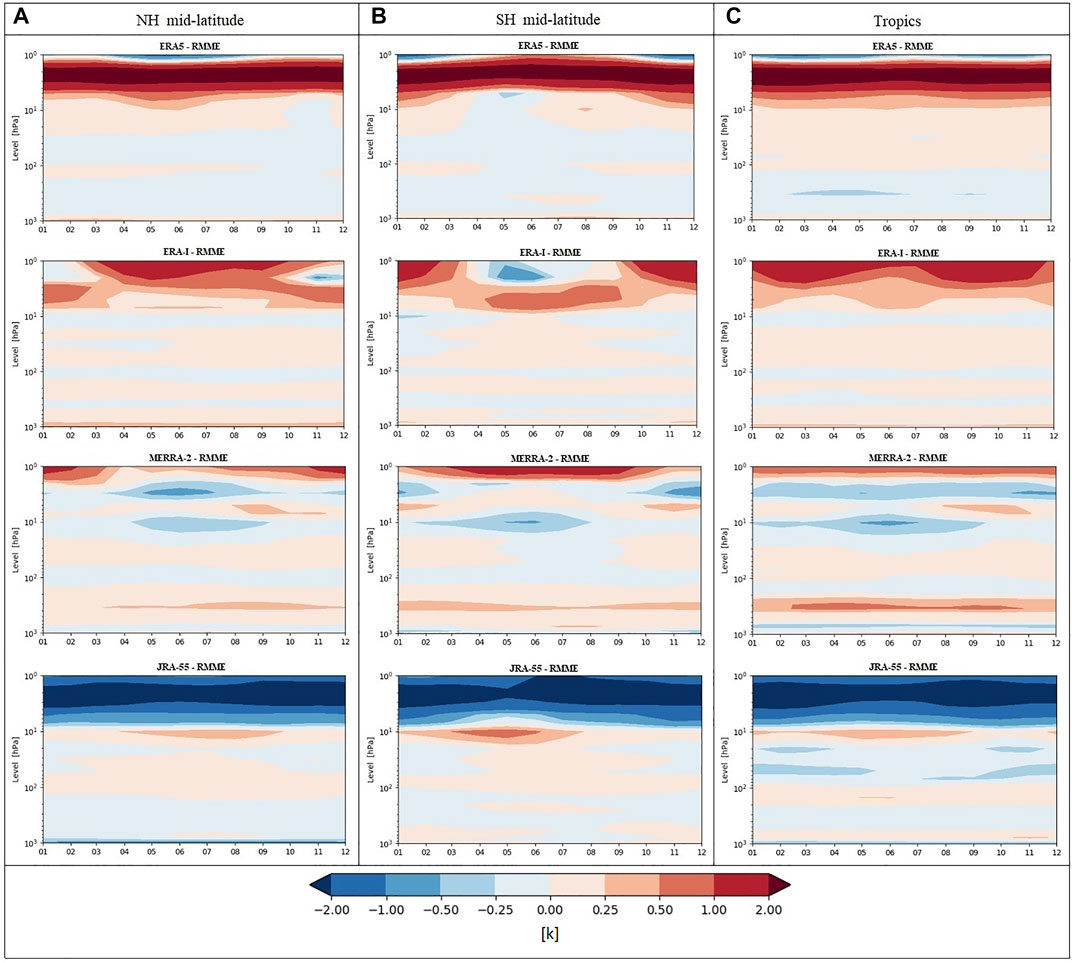
FIGURE 4. Same as Figure 3 but for the period 2001-2018.
Among the examined regions, the difference in the seasonal cycle between reanalyses is pronounced in the SH mid-latitudes for the two periods but reduced in magnitude after 2000. In the upper stratosphere, ERA5 shows opposite sign of ERA-Interim at 5–10 hPa. Furthermore, ERA-Interim and MERRA-2 also show different signs in the tropics at the same atmospheric region. For the period 2001–2018, The differences have reversed the sign at 10 hPa for ERA5, and 20–30 hPa for ERA-Interim and MERRA-2.
Discrepancies between reanalyses in the upper stratosphere are controlled by different factors. In addition to the observations’ paucity for the assimilation in this atmospheric region, mainly satellite data only, differences between reanalysis models and the treatments applied in the uppermost layers can play a relevant role in representing the temperature variability (Fujiwara et al., 2017).
The warm (cold) year-round bias of ERA5 (JRA-55) in the upper stratosphere found in the two periods and entire the investigated latitudinal ranges can possibly refer to the dominating role of the radiation representation in ERA5 and JRA-55 versus the role of representing the atmospheric circulation, dominant in ERA-Interim and MERRA-2.
Inaccurate climate trend detections may lead to deceptive conclusions about the current state and future evolution of climate. Despite the uncertainties affecting their estimations, trends are widely used to assess climate changes in both the scientific and stakeholders” communities. Regression methods represent a good relative diagnostic tool when different datasets are intercompared. Inhomogeneities in climate data records are one of the main issues affecting the reliability of the trends” estimation. For example, obtaining robust and consistent inferences about the long-term trend from different products that assimilate different types of observing systems can be challenging. Therefore, studying the coherence of trends for the reanalyses datasets can be crucial to assess the datasets” suitability for trend estimation.
In the next subsections, we investigate the ability of the considered reanalyses in defining the vertical profile of the global temperature trend; this diagnostic is considered as a fingerprint of climate change (Santer et al., 2013). The global zonal mean trend is also discussed along with the agreements/discrepancies between the considered datasets at different latitudes. Finally, we provide a case study on a regional scale at the southern pole, where the role of stratospheric dynamics in past changes of the Southern Hemisphere climate is evident (Cagnazzo et al., 2013).
The vertical trend profiles of global average deseasonalized temperatures over 1980–2018, 1980–1997, and 1998–2018, are shown in Figure 5. The two sub-periods (1980–1997 and 1998–2018) were selected to examine the weak stratospheric cooling that occurred in 1998–2018 compared to the period characterized by the large ozone depletion and associated cooling in 1980–1997 (Maycock et al., 2018).
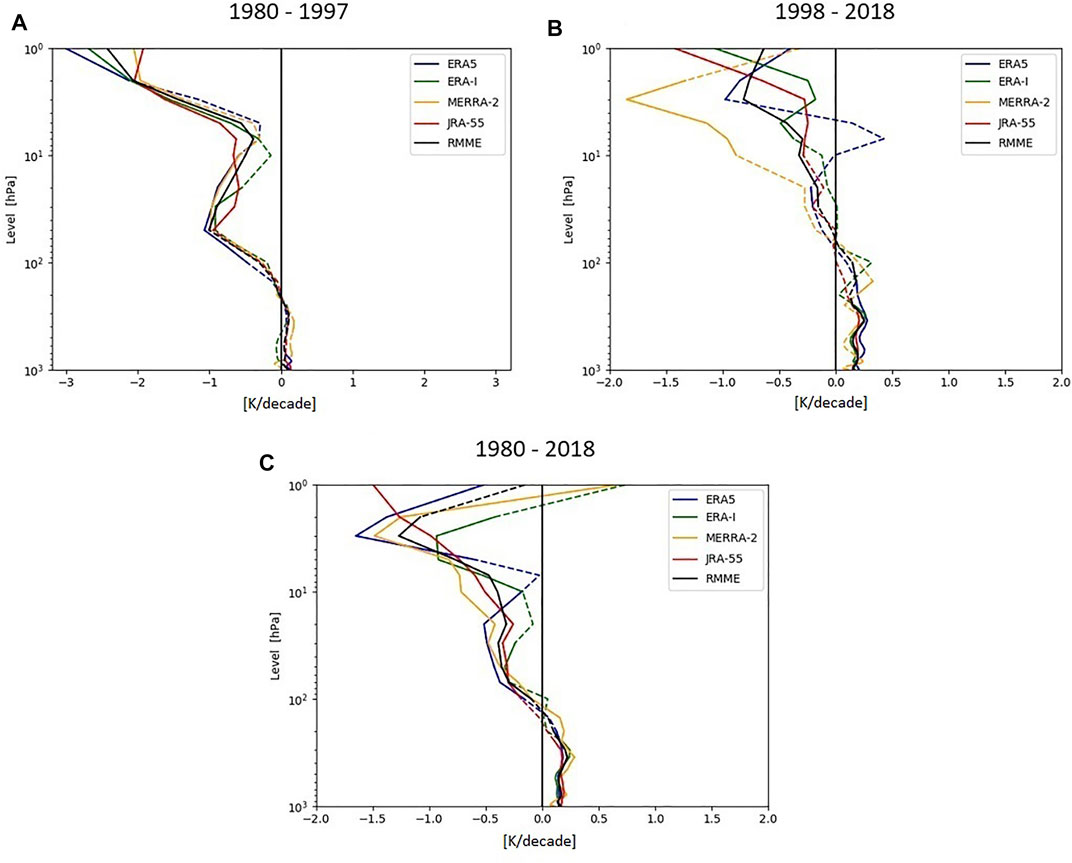
FIGURE 5. Vertical profiles of global mean temperature trends (K/decade) in the four reanalysis datasets (colored lines), and the RMME (black line). Trends are calculated for (A) 1980–1997, (B) 1998–2018, and (C) 1980–2018. The solid lines represent trends at the confidence interval of 95% (p-val ≤ 0.05).
Over 1980–1997, the ozone effect is evident in the period of maximum ozone depletion in the stratospheric layers (top-left panel of Figure 5), with the strongest cooling signal (∼−3 K/decade) in the upper stratosphere near 1 hPa. A good agreement among the datasets is found for this period.
After 1997, the lower stratosphere cooling is dominated by the increase in GHGs (WMO Ozone assessment, 2018), and it becomes less robust for pressure levels below 20 hPa. This finding agrees with the reported stratospheric warming in the recent decades (Philipona et al., 2018). The results are less consistent among the datasets in the mid-upper stratosphere. For ERA-Interim, JRA-55, and MERRA-2, a stratospheric cooling with height up to 5 hPa is found, but with a magnitude smaller than within the preceding period (∼−1.5 K/decade), instead, ERA5 shows a weakening of the cooling, and a non-robust warming signal is found at the levels 5–7 hPa. The temperature increase in the stratosphere is likely due to feedback related to the ozone layer recovery and to the changes in the concentrations of stratospheric halogen gases (WMO World Metrological Organization 2018), in analogy to what has been discussed in Randel et al. (2016).
Over the entire time period 1980–2018, the trends show a clear increase in the stratospheric cooling with height up to 20 hPa. This cooling is dominated by the known effect of carbon dioxide increase and ozone depletion on stratospheric temperatures before 1997 (Shine et al., 2003; Aquila et al., 2016; Steiner et al., 2020). Those effects result in maximum cooling into the lower stratosphere. Above 20 hPa, all datasets show a vertical weakening of the cooling trend, except for JRA-55 which shows a cooling up to 1 hPa. JRA-55 cooling is consistent with the reported temperature trends in the upper stratosphere for 1979–2018 using the SSU channels (Steiner et al., 2020).
In the troposphere, temperature trends behave differently through the considered periods. The tropospheric warming over 1980–2018 (order of 0.25 K/decade) is dominated by the 1998–2018 warming trends. Temperature warming trends in the upper troposphere are not robust, consistent with both large internal variability (Suárez-Gutiérrez et al., 2017) and with uncertainties associated with upper-air data in this atmospheric region (Dirksen et al., 2014; Madonna et al., 2020).
For 1980–2018, the warming (cooling) in the lower troposphere (stratosphere) is a robust trend. Although the separation in the two sub-periods has chosen to focus on stratospheric temperature trends, this choice is in line with the known controversy about the rate of tropospheric warming that was discussed since the 1990s (Spencer and Christy, 1990; Christy and Norris, 2004): global warming trends are indistinguishable from variability in the period 1980–1997 (for a few reanalyses trends are even negative) but become stable, positive and robust after 1998. In this study, the major volcanic signals are not removed from the full-time series, therefore, Pinatubo volcanic eruption that occurred quite late in the 1980–1997 period, causing warming in the stratosphere and cooling in the troposphere for several months following the event, may partially contribute to the weakening of tropospheric warming and stratospheric cooling during this period (Stocker et al., 2019).
The global annual zonal mean of temperature trends is shown in Figure 6. In general, there is a good agreement among the examined reanalyses in both the warming and cooling patterns. For all the latitudes, the warming in the troposphere and the cooling in the stratosphere are largely due to the radiative forcing associated with the increase in GHGs and with the decrease of stratospheric ozone (peaking in the Southern Hemisphere). The cooling in the stratosphere, concomitant to the warming in the troposphere, has been reported for the first time by Manabe and Wetherald (1967) and it is considered a typical fingerprint of increasing CO2 in the extratropical regions (Santer et al., 2013). Meanwhile, the Arctic amplification, i.e., the large near-surface warming in the Northern Hemisphere high latitudes, is also evident in all datasets although with some difference in the magnitude.
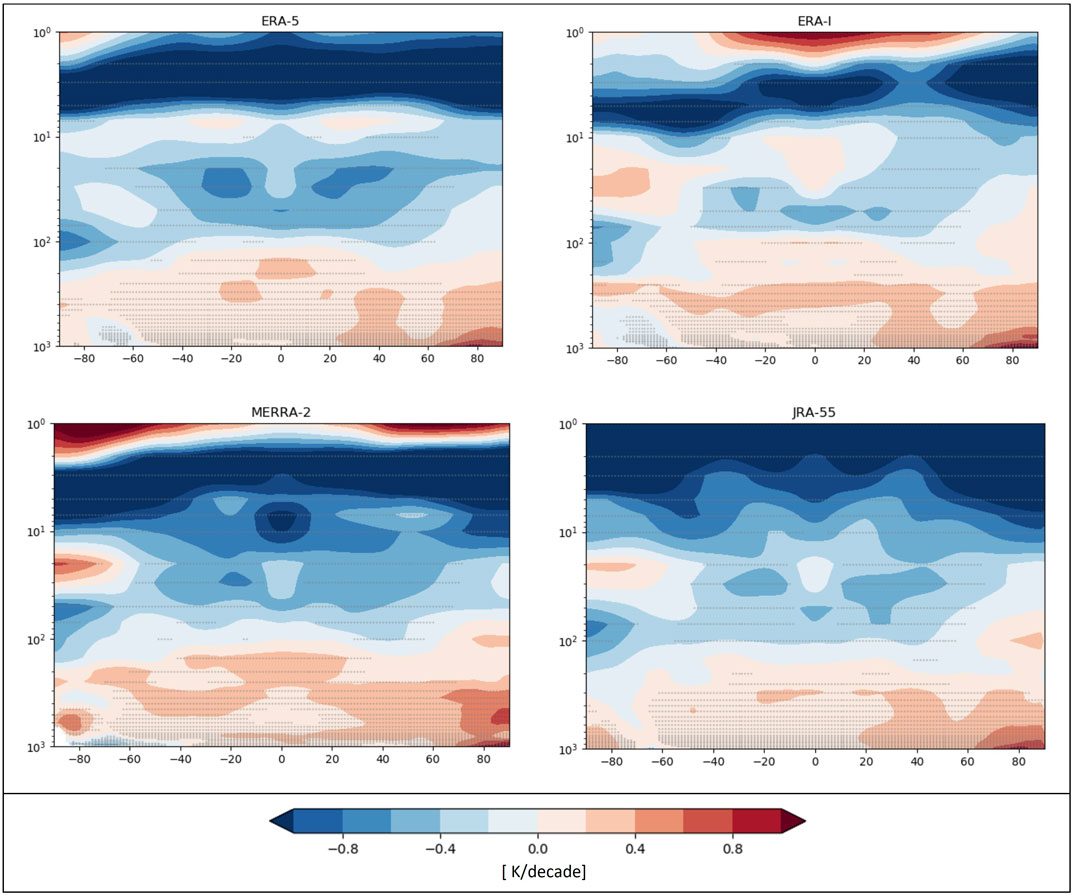
FIGURE 6. Global zonal mean temperature trends [K/decade] of the period (1980-2018) for five reanalyses and the RMME. Gray dots represent confidence intervals 95% (p-val ≤ 0.05) of the trends.
In terms of differences, the southern pole warming (south of 60°S at around 20 hPa) is not reproduced in ERA5 dataset. MERRA-2 provides the largest warming trends in the mid-troposphere in the tropics (from 250 hPa to 300 hPa). A warming signal is detected by ERA-interim and MERRA-2 at the topmost stratosphere (1–3 hPa), albeit for ERA-interim is limited to the 50°S–70°N region. In general, the agreement in the sign of trends among the reanalyses shows a lower consistency in the tropopause, in the stratosphere at levels above 30 hPa, and in high southern latitudes.
The global annual mean trends are dominated by changes in radiative forcing, nevertheless, trends in specific atmospheric regions and seasons also include signals due to changes in the atmospheric circulation and its dynamical forcing, especially in the stratosphere. In this section, we focus on the monthly temperature trends in the Southern Hemisphere (south of 60°S) for all the reanalysis datasets in the period 1980 to 1997.
As discussed in section 4.3.2, the observed temperature changes in this atmospheric region are dominated by the radiative forcing due to the increase of GHGs and the decrease of stratospheric ozone (due to increasing the ozone-depleting substances), but also feedback due to changes in the large-scale circulation (Screen et al., 2018).
In agreement with past studies, over the southern polar region, trends in the lower stratosphere peak in November, about 1 month after the maximum ozone depletion occurs in October (e.g., Trenberth and Olson, 1989; Randel and Wu, 1999). As shown in Figure 7, the obtained results of all reanalyses report the known seasonal evolution of stratospheric changes, with a cooling starting in September and lasting until March in the vertical range 30–200 hPa, reaching maxima in November and December. The peak cooling value is of -3.0 K/decade for all datasets. A consistent cooling trend, in order of −2.0 to −3.0 K/decade, has been reported by Thompson and Solomon (2002) using radiosonde data for the period 1969–1998. Part of this difference in the magnitude could be associated with a different dynamical response, across reanalyses, related to the representation of different processes in the reanalysis models (e.g., input to radiation scheme, feedback to large-scale stratospheric circulation, Brewer-Dobson circulation), similar to what is found for climate models (Cagnazzo et al., 2013; Rea et al., 2018). During the rest of the year, the stratosphere shows a general cooling (not fully evident in Figure 7 because of the choice of contour levels), mostly associated with the radiative effect of increasing CO2. At and below 300 hPa, all reanalyses show a marginally warming, in agreement with radiosonde analysis (though for a different period, Thompson and Solomon, 2002).
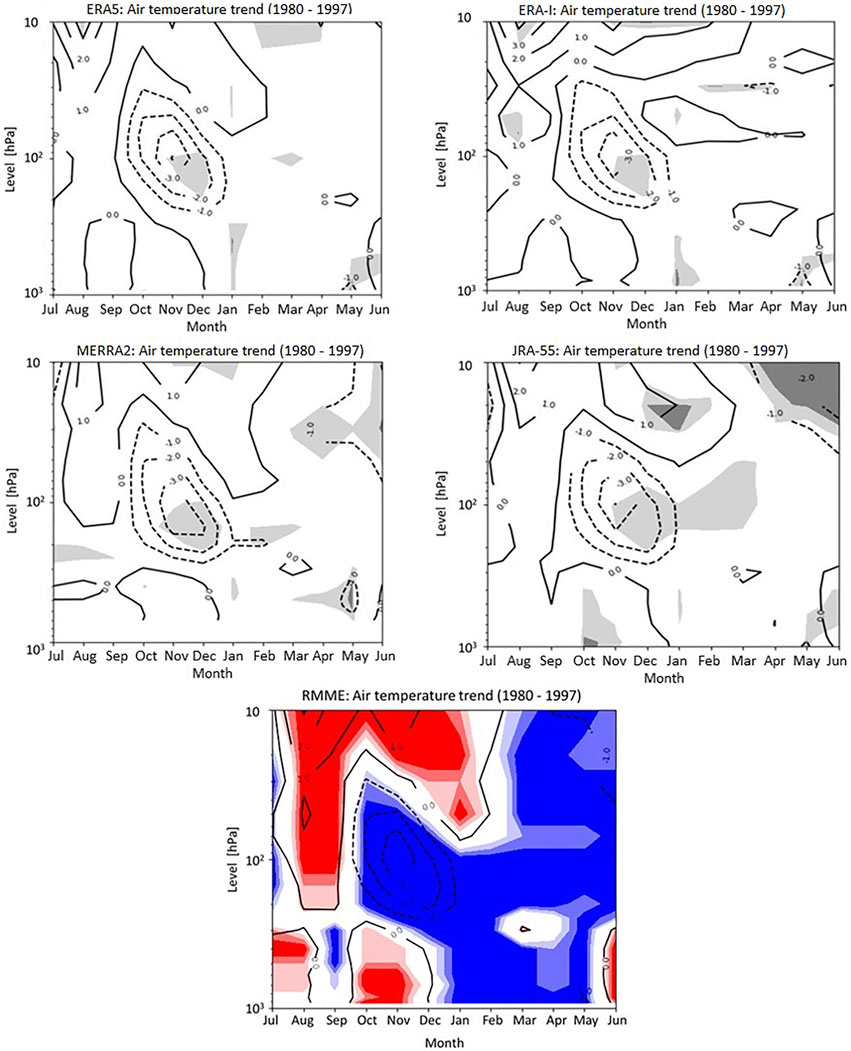
FIGURE 7. Southern pole temperature trends for the period 1980–1997. Contour intervals are 1.0 K/decade. Trends at 95 and 99% confidence levels in reanalyses are shaded (light and dark grey, respectively). Agreement of sign between datasets in RMME are colored in blue (red) for cooling (warming) trend, and shades for number of datasets in agreement.
Above the large cooling, all considered reanalyses report a warming pattern in the mid-stratosphere, in agreement with what was reported in past studies, even if for a slightly different period (Cagnazzo et al., 2013; Rea et al., 2018). This warming has been diagnosed as a manifestation of the stratospheric dynamical response associated with changes in the residual circulation. The obtained results indicate that all considered reanalyses are able to capture the upper stratosphere circulation response and its feedback on temperature, with a signal that may be different in magnitude and in the time occurrence of peak values, although generally well represented.
Comparison with observations is crucial for understanding the performance of reanalyses products. This section compares temperature variability and long-term trends estimated from reanalyses and homogenized upper-air radiosoundings data. Given the detailed characterization of the reanalysis datasets presented above, the comparison with upper-air observations is focused on the assessment of specific aspects of climate and atmospheric circulation in the tropics. This analysis aims to provide evidence of consistency among the datasets in a region where the representativeness error is smaller than at other latitudes.
Monthly temperature anomalies for the period 1980–2018 of the reanalyses (ERA5, ERA-Interim, MERRA-2, and JRA-55), RAOBCORE and RICH datasets for the region 10° N–10° S are shown in Figure 8 at the pressure levels from 100 hPa to 10 hPa. The results show a good agreement for all considered datasets. The well-known variability associated with major volcanic eruptions (El Chichon 1982; Pinatubo 1991) is evident in all datasets, particularly between levels 20–30 hPa. Among the considered reanalyses, ERA5 shows the lowest differences with respect to the radiosonde data, while a notable difference in magnitude, within the range of 4 K, is found for ERA-Interim, MERRA-2, and JRA-55. For 10 hPa and 100 hPa levels, the datasets tend to show slightly larger differences compared to observations in a few years, within ±4 K and ±2 K respectively. However, similar patterns in all datasets are produced and this difference clearly decreases after 2000. It is worth mentioning that this intercomparison is not fully independent due to the fact that RAOBCORE adjustments have been used for radiosonde bias correction in ERA-Interim, MERRA-2, and JRA-55, and RICH is used in ERA5. Differences between reanalyses and RAOBCORE/RICH are possibly due to differences in the datasets’ characteristics (e.g., assimilation schemes, the model used, datasets resolution, spatial sampling, etc.).
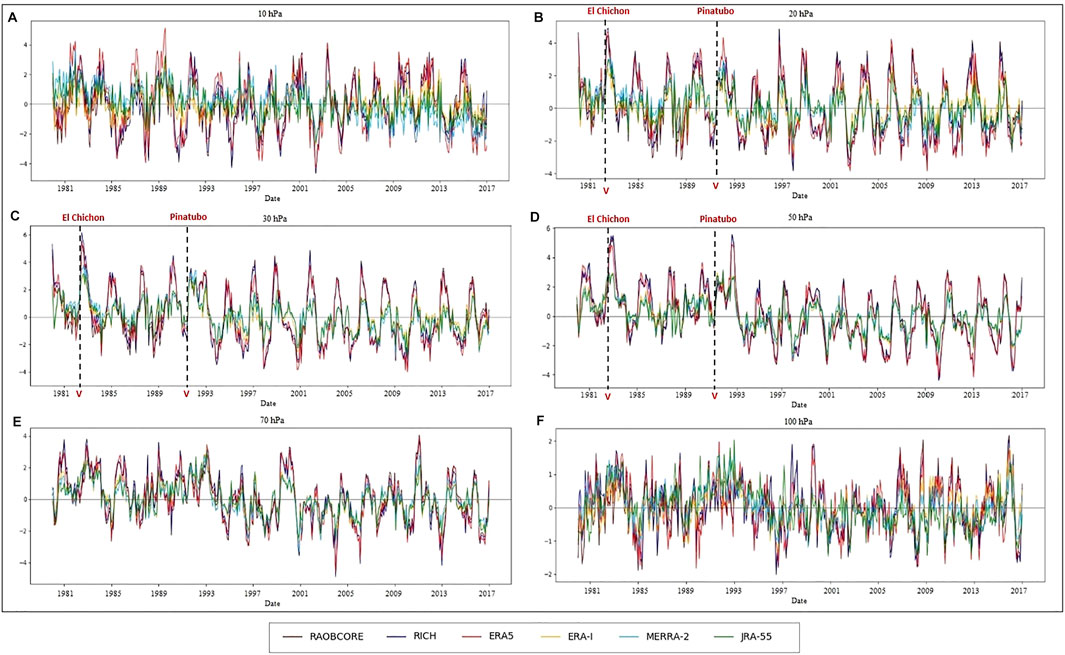
FIGURE 8. Monthly temperature anomalies at the region 10°S - 10°N of the radiosonde observations (RAOBCORE and RICH) and the four reanalysis datasets (ERA5, ERA-Interim, MERRA-2, and JRA-55), for the vertical levels (A) 10 hPa, (B) 20 hPa, (C) 30 hPa, (D) 50 hPa, (E) 70 hPa, and (F) 100 hPa, over the period 1980–2018.
Moreover, it is most notably that the resulted anomaly patterns for all considered reanalyses reflect a reliable representation of the atmospheric circulation in the tropical stratosphere, where the temperature is dominated by QBO signature in this atmospheric region; positive temperature anomalies correspond to westerlies and negative temperature anomalies correspond to easterlies (Pascoe et al., 2005; Yamazaki et al., 2020).
The vertical profile of the long-term trend of temperature, estimated using the linear least-squares method, is also intercompared for all reanalyses and observational datasets (RAOBCORE, RICH, and RHARM) in the tropics (25°N - 25° S) from the lower troposphere (850 hPa) to the middle stratosphere (10 hPa). As shown in Figure 9, all datasets are in very good agreement from the lower to middle troposphere (250 hPa) for both the trend sign and magnitude. At and above 100 hPa, the reanalyses (except for ERA-Interim at 10 and 100 hPa) agree with observations in the sign although there are differences in the magnitude.
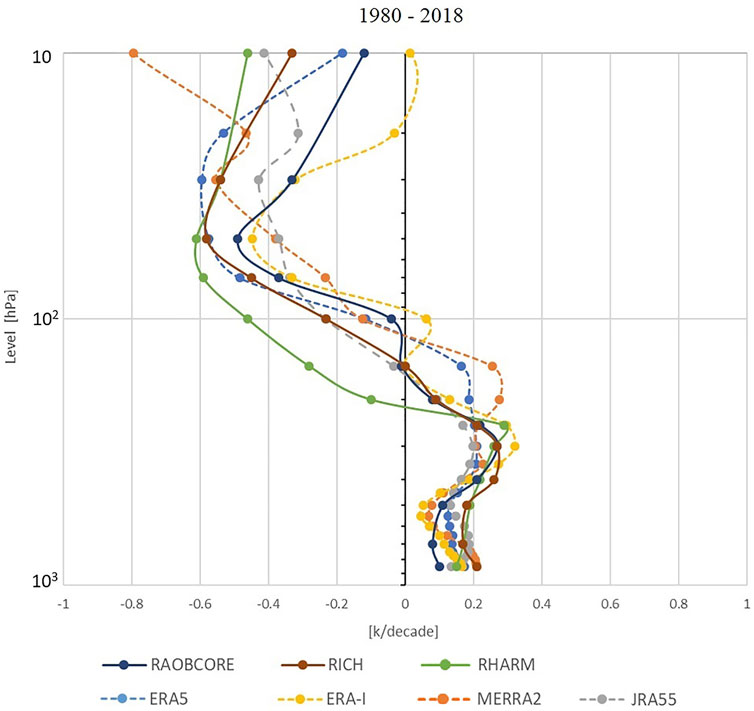
FIGURE 9. Vertical profiles of temperature trends (K/decade) for tropics (25° N - 25° S) of radiosonde observations (solid lines) and the four considered reanalysis datasets (dashed lines), spanning the period 1980–2018.
At the pressure levels between 100 hPa and 250 hPa, discrepancies in the trend results are evident not only between reanalyses and observational datasets but also among the observational datasets. RHARM is the only dataset that shows a cooling trend at the pressure levels 150–250 hPa, while RAOBCORE and RICH show a slight warming trend. It is worth mentioning that ERA5 and MERRA-2 show a warming trend with twice the magnitude of RAOBCORE/RICH datasets at these levels.
The current study investigates and intercompares the upper air temperature provided by the recent generation of four global reanalyses datasets (ERA5, ERA-Interim, MERRA2, and JRA-55) in terms of their mean state, variability, and trends estimation.
The considered reanalyses are characterized by relatively high spatio-temporal and vertical resolution, and no missing data in space (except for MERRA-2 below at and below 700 hPa) and time over 4 decades. All datasets provide consistent reproduction of the upper air temperature although discrepancies are found, mainly due to differences in the reanalysis systems configuration.
The zonal mean of temperature differences agrees with RMME within ±0.25 K from the lower troposphere to the middle stratosphere (10 hPa), except for a few atmospheric regions, such as equatorial mid and upper troposphere, upper stratosphere south of 60°S, equatorial mid-stratosphere. Larger differences (within +3.5 K), instead, and less consistent results are found in the upper stratospheric levels.
Although the temperature data at the southern polar region (Antarctic) is vertically extrapolated and provided for ERA5, ERA-Interim, and JRA-55 below 700 hPa, the datasets largely disagree in this atmospheric region, possibly due to different extrapolation methods. Therefore, special care is strongly recommended to be used for climate studies or applications in this region.
The agreement between the considered reanalyses increased after 1998 owing to the transition from TOVS to ATOVS and the enhanced consistency between the data assimilation systems. At the regional scale, the reanalyses agree better in NH mid-latitudes than in tropics and SH mid-latitudes. The differences among the datasets largely decrease in all regions after 2000, due to the increase in the amount of assimilated observations.
The tropospheric warming and stratospheric cooling are evident in the long-term temperature trend for all evaluated datasets. However, differences in the magnitude are found. Over the period 1980–1997, global temperature trends showed significant cooling in the lower stratosphere. The same is observed over the period 1998–2018 but only above 20 hPa and for specific datasets, consistently with the reported stratospheric warming after a decade of cooling by Philipona et al. (2018). A significant warming trend is found in the troposphere, in particular for the period 1998–2018. The large spread among the datasets indicates that caution needs to be deserved in estimating the trends above 30 hPa and at the tropopause level.
Comparisons of reanalyses and homogenized upper-air radiosounding data in the tropics reveal a reliable representation of the temperature variability and long-term trend for all reanalyses from the lower to the middle troposphere and in the lower stratosphere. Differences between datasets are evident in the upper troposphere, TTL, and middle stratosphere. Among the reanalyses, ERA5 shows the smallest bias in the monthly anomaly, on average, in the levels from 30 hPa to 70 hPa.
The findings of our analysis, including the recent ERA5 reanalysis and multiple in-situ observational datasets, are generally consistent with the major outcomes provided by the final S-RIP report (SPARC, 2022). The increase in the spatial, temporal, and vertical resolutions of the new generation of reanalysis allows to resolve a larger number of processes in the atmosphere, enhances performances, for example, of the trends with the homogenized upper-air data. Nonetheless, relevant issues are still present for all considered reanalyses mainly in the upper atmosphere, where caution is recommended, taking into account dataset-specific characteristics to avoid misleading data interpretations.
Researchers and reanalyses users are interested to know which dataset is the most suitable for their own study or applications. Although the obtained results in this study cannot provide a general answer to this question, specific suggestions and recommendations can be provided on the basis of the used diagnostics:
- For studies/applications that require the construction of long-term climatologies in the stratosphere, it is strongly suggested to use data after 1998 (in all reanalyses systems presented here).
- For analysis focused on the TTL, it is recommended to use data from reanalyses systems with a high vertical resolution in their original grid.
- For the trend estimation, caution must be deserved in the mid-upper stratosphere (≤30 hPa, at the global level) and in Tropical Tropopause Layer (TTL)
- Although usage of multi-reanalyses of the same family is suggested to reduce the uncertainties, caution is recommended in the interpretation of trends driven by the assimilated data and the external forcing.
This study complements previous studies (e.g., Long et al., 2017) by including ERA5 which is most recent but, as a consequence, the less explored in the literature compared to other reanalyses, thus providing additional value to the scientific communities who are interested in using atmospheric reanalyses for their studies and applications.
The original contributions presented in the study are included in the article/supplementary material, further inquiries can be directed to the corresponding author.
YH contributed to designing the methodology, result analysis, and Writing the Original Draft Preparation. CC oversight and lead the planning of the work, designing the methodology, result analysis, and Review–Editing process of the manuscript. FM contributed to the designing the methodology, validation process, and Review; Editing process of the manuscript PC contributed to the designing the methodology, and the Review–Editing process of the manuscript. CY formulate overarching research goals and aims, and Review; Editing process of the manuscript FS contributed to the validation process, and Review–Editing process of the manuscript LC contributed to the Review and Editing process. RS Manage and coordinate the responsibility for the research activity planning, Writing and Review; Editing process.
This work is funded by European Copernicus Climate Change Service (C3S) implemented by European Centre for Medium-Range Weather Forecasts (ECMWF) under the service contract Independent Assessment on ECVs led by National Research council of Italy (CNR) with the service contract number as ECMWF/Copernicus/2017/C3S_511_CNR.
The authors declare that the research was conducted in the absence of any commercial or financial relationships that could be construed as a potential conflict of interest.
All claims expressed in this article are solely those of the authors and do not necessarily represent those of their affiliated organizations, or those of the publisher, the editors and the reviewers. Any product that may be evaluated in this article, or claim that may be made by its manufacturer, is not guaranteed or endorsed by the publisher.
Alghamdi, A. S. (2020). Evaluation of Four Reanalysis Datasets against Radiosonde over Southwest Asia. Atmosphere 1-1411 (4), 402. doi:10.3390/atmos11040402
Aquila, V., Swartz, W. H., Waugh, D. W., Colarco, P. R., Pawson, S., Polvani, L. M., et al. (2016). Isolating the Roles of Different Forcing Agents in Global Stratospheric Temperature Changes Using Model Integrations with Incrementally Added Single Forcings. J. Geophys. Res. Atmos. 121, 8067–8082. doi:10.1002/2015JD023841
Baatz, R., Hendricks Franssen, H. J., Euskirchen, E., Sihi, D., Dietze, M., Ciavatta, S., et al. (2021). Reanalysis in Earth System Science: Toward Terrestrial Ecosystem Reanalysis. Rev. Geophys. 59, e2020RG000715. doi:10.1029/2020RG000715
Buchard, V., da Silva, A. M., Colarco, P. R., Darmenov, A., Randles, C. A., Govindaraju, R., et al. (2015). Using the OMI Aerosol Index and Absorption Aerosol Optical Depth to Evaluate the NASA MERRA Aerosol Reanalysis. Atmos. Chem. Phys. 15, 5743–5760. doi:10.5194/acp-15-5743-2015
Buchard, V., Randles, C. A., da Silva, A. M., Darmenov, A., Colarco, P. R., Govindaraju, R., et al. (2017). The MERRA-2 Aerosol Reanalysis, 1980 Onward. Part II: Evaluation and Case Studies. J. Clim. 30, 6851–6872. doi:10.1175/JCLI-D-16-0613.1
Cagnazzo, C., Manzini, E., Fogli, P. G., Vichi, M., and Davini, P. (2013). Role of Stratospheric Dynamics in the Ozone-Carbon Connection in the Southern Hemisphere. Clim. Dyn. 41, 3039–3054. doi:10.1007/s00382-013-1745-5
Christy, J. R., and Norris, W. B. (2004). What May We Conclude about Global Tropospheric Temperature Trends? Geophys. Res. Lett. 31 (6), a–n. doi:10.1029/2003GL019361
Dee, D. P., Uppala, S. M., Simmons, A. J., Berrisford, P., Poli, P., Kobayashi, S., et al. (2011). The ERA-Interim Reanalysis: Configuration and Performance of the Data Assimilation System. Q.J.R. Meteorol. Soc. 137, 553–597. doi:10.1002/qj.828
Dirksen, R. J., Sommer, M., Immler, F. J., Hurst, D. F., Kivi, R., and Vömel, H. (2014). Reference Quality Upper-Air Measurements: GRUAN Data Processing for the Vaisala RS92 Radiosonde. Atmos. Meas. Tech. 7, 4463–4490. doi:10.5194/amt-7-4463-2014
Durre, I., Yin, X., Vose, R. S., Applequist, S., and Arnfield, J. (2018). Enhancing the Data Coverage in the Integrated Global Radiosonde Archive. Journal of Atmospheric and Oceanic Technology 35 (9), 1753–1770. doi:10.1175/JTECH-D-17-0223.1
Fujiwara, M., Wright, J. S., Manney, G. L., Gray, L. J., Anstey, J., Birner, T., et al. (2017). Introduction to the SPARC Reanalysis Intercomparison Project (S-RIP) and Overview of the Reanalysis Systems. Atmos. Chem. Phys. 17, 1417–1452. doi:10.5194/acp-17-1417-2017
Gelaro, R., McCarty, W., Suárez, M. J., Todling, R., Molod, A., Takacs, L., et al. (2017). The Modern-Era Retrospective Analysis for Research and Applications, Version 2 (MERRA-2). J. Clim. 30 (4), 5419–5454. doi:10.1175/JCLI-D-16-0758.1
Gleixner, S., Demissie, T., and Diro, G. T. (2020). Did ERA5 Improve Temperature and Precipitation Reanalysis over East Africa? Atmosphere 11, 996. doi:10.3390/atmos11090996
Graham, R. M., Hudson, S. R., and Maturilli, M. (2019). Improved Performance of ERA5 in Arctic Gateway Relative to Four Global Atmospheric Reanalyses. Geophys. Res. Lett. 46 (11), 6138–6147. doi:10.1029/2019gl082781
Haimberger, L. (2007). Homogenization of Radiosonde Temperature Time Series Using Innovation Statistics. J. Clim. 20 (7), 1377–1403. doi:10.1175/jcli4050.1
Haimberger, L., Tavolato, C., and Sperka, S. (2012). Homogenization of the Global Radiosonde Temperature Dataset through Combined Comparison with Reanalysis Background Series and Neighboring Stations. J. Clim. 25 (23), 8108–8131. doi:10.1175/jcli-d-11-00668.1
Hersbach, H., Bell, B., Berrisford, P., Hirahara, S., Horányi, A., Muñoz‐Sabater, J., et al. (2020). The ERA5 Global Reanalysis. Q.J.R. Meteorol. Soc. 146, 1999–2049. doi:10.1002/qj.3803
Ivanciu, I., Matthes, K., Wahl, S., Harlaß, J., and Biastoch, A. (2021). Effects of Prescribed CMIP6 Ozone on Simulating the Southern Hemisphere Atmospheric Circulation Response to Ozone Depletion. Atmos. Chem. Phys. 21 (8), 5777–5806. doi:10.5194/acp-21-5777-2021
JMA (2013). Outline of the Operational Numerical Weather Prediction at the Japan Meteorological Agency. WMO Technical Progress Report on the Global Data-Processing and Forecasting System (GDPFS) and Numerical Weather Prediction (NWP) Research, JMA, Japan. available at: http://www.jma.go.jp/jma/jma-eng/jma-center/nwp/outline2013-nwp/index.htm.
IPCC (2013). Climate Change 2013: The Physical Science Basis. Contribution of Working Group I to the Fifth Assessment Report of the Intergovernmental Panel on Climate Change. Editors Stocker T. F., Qin D., Plattner G.-K., Tignor M., Allen S. K., Boschung J.et al. (Cambridge, United Kingdom and New York, NY, USA: Cambridge University Press), 1535.
Keller, J. D., and Wahl, S. (2021). Representation of Climate in Reanalyses: An Intercomparison for Europe and North America. J. Clim. 34 (5), 1667–1684. doi:10.1175/jcli-d-20-0609.1
Kobayashi, S., Ota, Y., Harada, Y., Ebita, A., Moriya, M., Onoda, H., et al. (2015). The JRA-55 Reanalysis: General Specifications and Basic Characteristics. J. Meteorological Soc. Jpn. 93, 5–48. doi:10.2151/jmsj.2015-001
Lamarque, J.-F., Bond, T. C., Eyring, V., Granier, C., Heil, A., Klimont, Z., et al. (2010). Historical (1850–2000) Gridded Anthropogenic and Biomass Burning Emissions of Reactive Gases and Aerosols: Methodology and Application. Atmos. Chem. Phys. 10, 7017–7039. doi:10.5194/acp-10-7017-2010
Long, C. S., Fujiwara, M., Davis, S., Mitchell, D. M., and Wright, C. J. (2017). Climatology and Interannual Variability of Dynamic Variables in Multiple Reanalyses Evaluated by the SPARC Reanalysis Intercomparison Project (S-RIP). Atmos. Chem. Phys. 17, 14593–14629. doi:10.5194/acp-17-14593-2017
Madonna, F., Kivi, R., Dupont, J.-C., Ingleby, B., Fujiwara, M., Romanens, G., et al. (2020). Use of Automatic Radiosonde Launchers to Measure Temperature and Humidity Profiles from the GRUAN Perspective. Atmos. Meas. Tech. 13, 3621–3649. doi:10.5194/amt-13-3621-2020
Madonna, F., Tramutola, E., Sy, S., Serva, F., Proto, M., Rosoldi, M., et al. (2022). The New Radiosounding HARMonization (RHARM) Data Set of Homogenized Radiosounding Temperature, Humidity, and Wind Profiles with Uncertainties. J. Geophys. Res. Atmos. 127, e2021JD035220. doi:10.1029/2021jd035220
Manabe, S., and Wetherald, R. T. (1967). Thermal Equilibrium of the Atmosphere with a Given Distribution of Relative Humidity. J. Atmos. Sci. 24 (3), 241–259. doi:10.1175/1520-0469(1967)024<0241:teotaw>2.0.co;2
Manney, G. L., Allen, D. R., Krüger, K., Naujokat, B., Santee, M. L., Sabutis, J. L., et al. (2005). Diagnostic Comparison of Meteorological Analyses during the 2002 Antarctic Winter. Mon. Weather Rev. 133, 1261–1278. doi:10.1175/mwr2926.1
Maycock, A. C., Randel, W. J., Steiner, A. K., Karpechko, A. Y., Christy, J., Saunders, R., et al. (2018). Revisiting the Mystery of Recent Stratospheric Temperature Trends. Geophys. Res. Lett. 45, 9919–9933. doi:10.1029/2018gl078035
Meinshausen, M., Smith, S. J., Calvin, K., Daniel, J. S., Kainuma, M. L. T., Lamarque, J.-F., et al. (2011). The RCP Greenhouse Gas Concentrations and Their Extensions From 1765 to 2300. Climatic Change 109, 213. doi:10.1007/s10584-011-0156-z
Molod, A., Takacs, L., Suarez, M., and Bacmeister, J. (2015). Development of the GEOS-5 Atmospheric General Circulation Model: Evolution From MERRA to MERRA-2. Geoscientific Model Development 8, 1339–1356. doi:10.5194/gmd-8-1339-2015
Pascoe, C. L., Gray, L., Crooks, S., Juckes, M., and Baldwin, M. (2005). The Quasi-Biennial Oscillation: Analysis Using ERA-40 Data. J. Geophys. Res. 110, D08105. doi:10.1029/2004jd004941
Pawson, S., and Fiorino, M. (1998). A Comparison of Reanalyses in the Tropical Stratosphere. Part 1: Thermal Structure and the Annual Cycle. Clim. Dyn. 14, 631–644. doi:10.1007/s003820050246
Pawson, S., and Fiorino, M. (1999). A Comparison of Reanalyses in the Tropical Stratosphere. Part 3: Inclusion of the Pre-satellite Data Era. Clim. Dyn. 15, 241–250. doi:10.1007/s003820050279
Philipona, R., Mears, C., Fujiwara, M., Jeannet, P., Thorne, P., Bodeker, G., et al. (2018). Radiosondes Show that after Decades of Cooling, the Lower Stratosphere Is Now Warming. J. Geophys. Res. Atmos. 123, 12. doi:10.1029/2018jd028901
Pisoft, P., Sacha, P., Polvani, L. M., Añel, J. A., de la Torre, L., Eichinger, R., et al. (2021). Stratospheric Contraction Caused by Increasing Greenhouse Gases. Environ. Res. Lett. 16 (6), 064038. doi:10.1088/1748-9326/abfe2b
Polvani, L. M., Waugh, D. W., Correa, G. J. P., and Son, S.-W. (2011). Stratospheric Ozone Depletion: The Main Driver of Twentieth-Century Atmospheric Circulation Changes in the Southern Hemisphere. J. Clim. 24 (3), 795–812. doi:10.1175/2010jcli3772.1
Randel, W. J., Smith, A. K., Wu, F., Zou, C.-Z., and Qian, H. (2016). Stratospheric Temperature Trends over 1979-2015 Derived from Combined SSU, MLS, and SABER Satellite Observations. J. Clim. 29 (13), 4843–4859. doi:10.1175/jcli-d-15-0629.1
Randel, W. J., and Wu, F. (1999). Cooling of the Arctic and Antarctic Polar Stratospheres Due to Ozone Depletion. J. Clim. 12 (5), 1467–1479. doi:10.1175/1520-0442(1999)012<1467:cotaaa>2.0.co;2
Randel, W., Udelhofen, P., Fleming, E., Geller, M., Gelman, M., Hamilton, K., et al. (2004). The SPARC Intercomparison of Middle-Atmosphere Climatologies. J. Clim. 17, 986–1003. doi:10.1175/1520-0442(2004)017<0986:tsiomc>2.0.co;2
Randles, C. A., da Silva, A. M., Buchard, V., Colarco, P. R., Darmenov, A., Govindaraju, R., et al. (2017). The MERRA-2 Aerosol Reanalysis, 1980 Onward. Part I: System Description and Data Assimilation Evaluation. J. Clim. 30, 6823–6850. doi:10.1175/jcli-d-16-0609.1
Rea, G., Riccio, A., Fierli, F., Cairo, F., and Cagnazzo, C. (2018). Stratosphere-resolving CMIP5 Models Simulate Different Changes in the Southern Hemisphere. Clim. Dyn. 50, 2239–2255. doi:10.1007/s00382-017-3746-2
Rienecker, M. M., Suarez, M. J., Gelaro, R., Todling, R., Bacmeister, J., Liu, E., et al. (2011). MERRA: NASA's Modern-Era Retrospective Analysis for Research and Applications. J. Clim. 24, 3624–3648. doi:10.1175/jcli-d-11-00015.1
Rienecker, M. M., Suarez, M. J., Todling, R., Bacmeister, J., Takacs, L., Liu, H., et al. (2008). The GEOS-5 Data Assimilation System—Documentation of Versions 5.0.1 and 5.1.0, and 5.2.0. Technical Report Series on Global Modeling and Data Assimilation, 27. Greenbelt, Maryland, 92. NASA/TM-2008-104606 https://ntrs.nasa.gov/search.jsp?R=20120011955.
Santer, B. D., Painter, J. F., Bonfils, C., Mears, C. A., Solomon, S., Wigley, T. M. L., et al. (2013). Human and Natural Influences on the Changing Thermal Structure of the Atmosphere. Proc. Natl. Acad. Sci. U.S.A. 110 (43), 17235–17240. doi:10.1073/pnas.1305332110
Sato, M., Hansen, J. E., McCormick, M. P., and Pollack, J. B. (1993). Stratospheric Aerosol Optical Depths, 1850–1990. Journal of Geophysical Research 98(D12), 22987–22994. doi:10.1029/93JD02553
Screen, J. A., Bracegirdle, T. J., and Simmonds, I. (2018). Polar Climate Change as Manifest in Atmospheric Circulation. Curr. Clim. Change Rep. 4, 383–395. doi:10.1007/s40641-018-0111-4
Shine, K. P., Bourqui, M. S., Forster, P. M. d. F., Hare, S. H. E., Langematz, U., Braesicke, P., et al. (2003). A Comparison of Model-Simulated Trends in Stratospheric Temperatures. Q.J.R. Meteorol. Soc. 129 (590), 1565–1588. doi:10.1256/qj.02.186
Simmons, A. J., Berrisford, P., Dee, D. P., Hersbach, H., Hirahara, S., and Thépaut, J.-N. (2017). A Reassessment of Temperature Variations and Trends from Global Reanalyses and Monthly Surface Climatological Datasets. Q.J.R. Meteorol. Soc. 143, 101–119. doi:10.1002/qj.2949
Simmons, A., Jones, P., da Costa Bechtold, V., Beljaars, A., Kållberg, P., Saarinen, S., et al. (2004). Comparison of Trends and Low-Frequency Variability in CRU, ERA-40, and NCEP/NCAR Analyses of Surface Air Temperature. J. Geophys. Res. Atmos. 109, 1–18. doi:10.1029/2004jd005306
Simmons, A. J., Poli, P., Dee, D. P., Berrisford, P., Hersbach, H., Kobayashi, S., et al. (2014). Estimating Low-Frequency Variability and Trends in Atmospheric Temperature Using ERA-Interim. Q.J.R. Meteorol. Soc. 140 (679), 329–353. doi:10.1002/qj.2317
Simmons, A., Soci, C., Nicolas, J., Bell, B., Berrisford, P., Dragani, R., et al. (2020). Global Stratospheric Temperature Bias and Other Stratospheric Aspects of ERA5 and ERA5. 1’ Ecmwf Tech. Memo. 859, 1–40. doi:10.21957/RCXQFMG0
Simmons, A. (2022). Trends in the Tropospheric General Circulation from 1979 to 2022. Weather and Climate Dynamics. doi:10.5194/wcd-2022-19
SPARC (2022). “SPARC Reanalysis Intercomparison Project (S-RIP) Final Report,” in SPARC Report No. 10. Editors Fujiwara M., Manney G. L., Gray L. J., and WrighT J. S. WCRP-17/2020available at: www.sparc-climate.org/publications/sparc-reports. doi:10.17874/800dee57d13
Spencer, R. W., and Christy, J. R. (1990). Precise Monitoring of Global Temperature Trends from Satellites. Science 247 (4950), 1558–1562. doi:10.1126/science.247.4950.1558
Steiner, A. K., Ladstädter, F., Randel, W. J., Maycock, A. C., Fu, Q., Claud, C., et al. (2020). Observed Temperature Changes in the Troposphere and Stratosphere from 1979 to 2018. J. Clim. 33 (19), 8165–8194. doi:10.1175/jcli-d-19-0998.1
Sterin, A., Khan, V., and Rubinshtein, K. (2008). “Upper-air Temperature Trends: Current Problems and Some Recent Results,” in Climate Variability and Extremes during the Past 100 Years. Editors S. Brönnimann, J. Luterbacher, T. Ewen, H. Diaz, R. Stolarski, and U. Neu (Dordrecht: Advances in Global Change ResearchSpringer), Vol. 33.
Stocker, M., Ladstädter, F., Wilhelmsen, H., and Steiner, A. K. (2019). Quantifying Stratospheric Temperature Signals and Climate Imprints from Post-2000 Volcanic Eruptions. Geophys Res. Lett. 46, 12486–12494. doi:10.1029/2019GL084396
Suárez‐Gutiérrez, L., Li, C., Thorne, P., and Marotzke, J. (2017). Internal Variability in Simulated and Observed Tropical Tropospheric Temperature Trends. Geophys. Res. Lett. 44, 5709–5719. doi:10.1002/2017GL073798
Tanré, D., Geleyn, J.-F., and Slingo, J. M. (1984). “First Results of the Introduction of an Advanced Aerosol-Radiation Interaction in the ECMWF Low Resolution Global Model,” in Aerosols and Their Climatic Effects. Editors Gerber, H. E., and Deepak, A. (Hampton, VA: A. Deepak Publishing), 133–177.
Tegtmeier, S., Anstey, J., Davis, S., Dragani, R., Harada, Y., Ivanciu, I., et al. (2020). Temperature and Tropopause Characteristics from Reanalyses Data in the Tropical Tropopause Layer. Atmos. Chem. Phys. 20, 753–770. doi:10.5194/acp-20-753-2020
Thompson, D. W., and Solomon, S. (2002). Interpretation of Recent Southern Hemisphere Climate Change. Science 296, 5569895–5569899. doi:10.1126/science.1069270
Thorne, P. W. (2008). Arctic Tropospheric Warming Amplification? Nature 455, E1. doi:10.1038/nature07256
Thorne, P. W., Madonna, F., Schulz, J., Oakley, T., Ingleby, B., Rosoldi, M., et al. (2017). Making Better Sense of the Mosaic of Environmental Measurement Networks: A System-Of-Systems Approach and Quantitative Assessment. Geosci. Instrum. Method. Data Syst. 6, 453–472. doi:10.5194/gi-6-453-2017
Thorne, P. W., and Vose, R. S. (2010). Reanalyses Suitable for Characterizing Long-Term Trends. Bull. Amer. Meteor. Soc. 91 (3), 353–362. doi:10.1175/2009bams2858.1
Trenberth, K. E., and Olson, J. G. (1989). Temperature Trends at the South Pole and McMurdo Sound. J. Clim. 2 (10), 1196–1206. doi:10.1175/1520-0442(1989)002<1196:ttatsp>2.0.co;2
van Vuuren, D.P., Edmonds, J., Kainuma, M., Riahi, K., Thomson, A., Hibbard, K., et al. (2011). The Representative Concentration Pathways: An Overview. Climatic Change 109, 5. doi:10.1007/s10584-011-0148-z
WMO (1986). A Preliminary Cloudless Standard Atmosphere for Radiation Computation. World Clim. Programme (WCP) 112, 53. Available at https://library.wmo.int/index.php?lvl=notice_display&id=11668.
WMO World Meteorological Organization (2018). Scientific Assessment of Ozone Depletion: 2018. Geneva, Switzerland: Glob. Ozone Res. Ozone Res. Monit. Project–Report, 588. Available at: https://www.esrl.noaa.gov/csl/assessments/ozone/2018/downloads/2018OzoneAssessment.pdf.
Yamazaki, K., Nakamura, T., Ukita, J., and Hoshi, K. (2020). A Tropospheric Pathway of the Stratospheric Quasi-Biennial Oscillation (QBO) Impact on the Boreal Winter Polar Vortex. Atmos. Chem. Phys. 20 (8), 5111–5127. doi:10.5194/acp-20-5111-2020
AGCM Atmospheric General Circulation Model.
ATOVs Advanced TIROS Operational Vertical Sounder
C3S Copernicus Climate Change Service
abrCDS Climate Data Store
CFSR Climate Forecast System Reanalysis
CMIP5 Coupled Model Intercomparison Project - Phase 5
COBE Centennial in situ Observation-Based Estimates
ECMWF European Centre for Medium-Range Weather Forecasts
ECV Essential Climate Variable
ERA ECMWF Re-Analysis
GEOS-5 Goddard Earth Observing System Data Assimilation System Version 5
GNSS Global Navigation Satellite System
GSM Global spectral mode
IFS Integrated Forecast System
JMA Japan Meteorological Agency
MERRA Modern-Era Retrospective analysis for Research and Applications
MLS Microwave Limb Sounder
RHARM Radiosounding HARMonization
RICH Radiosonde Innovation Composite Homogenization
RMME Reanalyses multi-model ensemble
RO Radio Occultation
RAOBCORE RAdiosonde OBservation COrrection using REanalyses
S-RIP SPARC Reanalysis Intercomparison Project
SPARC Stratosphere-troposphere Processes And their Role in Climate
SSMI Special Sensor Microwave Imager
TTL tropical tropopause layer
TOV TIROS Operational Vertical Sounder
VarBC Variational Bias Correction
Keywords: upper-air temperature, vertical thermal structure, atmospheric reanalysis, radiosonde observations, climatology and variability, trend
Citation: Essa YH, Cagnazzo C, Madonna F, Cristofanelli P, Yang C, Serva F, Caporaso L and Santoleri R (2022) Intercomparison of Atmospheric Upper-Air Temperature From Recent Global Reanalysis Datasets. Front. Earth Sci. 10:935139. doi: 10.3389/feart.2022.935139
Received: 03 May 2022; Accepted: 10 June 2022;
Published: 15 August 2022.
Edited by:
Paulo Artaxo, University of São Paulo, BrazilReviewed by:
Tercio Ambrizzi, University of São Paulo, BrazilCopyright © 2022 Essa, Cagnazzo, Madonna, Cristofanelli, Yang, Serva, Caporaso and Santoleri. This is an open-access article distributed under the terms of the Creative Commons Attribution License (CC BY). The use, distribution or reproduction in other forums is permitted, provided the original author(s) and the copyright owner(s) are credited and that the original publication in this journal is cited, in accordance with accepted academic practice. No use, distribution or reproduction is permitted which does not comply with these terms.
*Correspondence: Yassmin H. Essa, WWFzc21pbi5oZXNoYW1AYXJ0b3YuaXNtYXIuY25yLml0
Disclaimer: All claims expressed in this article are solely those of the authors and do not necessarily represent those of their affiliated organizations, or those of the publisher, the editors and the reviewers. Any product that may be evaluated in this article or claim that may be made by its manufacturer is not guaranteed or endorsed by the publisher.
Research integrity at Frontiers
Learn more about the work of our research integrity team to safeguard the quality of each article we publish.