
95% of researchers rate our articles as excellent or good
Learn more about the work of our research integrity team to safeguard the quality of each article we publish.
Find out more
ORIGINAL RESEARCH article
Front. Earth Sci. , 29 August 2022
Sec. Structural Geology and Tectonics
Volume 10 - 2022 | https://doi.org/10.3389/feart.2022.934206
This article is part of the Research Topic Measuring, Modeling and Predicting the Seismic Site Effect View all 20 articles
 Ping Li1,2,3*
 Kai Zhou1,2*
There is a consensus in earthquake engineering that different soil structures have significant effects on ground motion. Three main methods can be used to study this issue: theoretical analysis, numerical simulation, and earthquake records analysis. Notably, the combined analysis of strong-motion records and station site information appears to be the most effective and reliable approach. In this study, we used site information from the Seismic Monitoring Array of Site and Structure (SMASS) of the Institute of Disaster Prevention and a record of the earthquake that occurred in Guye, China: a point on the bedrock was considered as reference for studying the amplification effect of the soil structure on ground motion through traditional spectral ratio analysis. Our main conclusions are the following. (1) The SMASS array data indicated that the shallow soil had an amplifying effect on ground motion: the frequency bands amplifying the horizontal ground motion were mainly those between 3.4 and 6.8, 11.3–13, and 15–20.8 Hz, while the frequency bands amplifying the vertical ground vibration were mainly those between 5 and 9.9, 13.5–15.9, and 18.5–21.9 Hz (2) The SMASS array data indicated that the influence of the deep soil on the horizontal ground motion frequency component was more significant than that of vertical ground motion. (3) Overall, the SMASS array site amplified the effects of both the high (3.4–20.8 Hz) and low (0.4–2.2 Hz) frequency components of ground motion with the depth decreases of buried depth; notably, the amplification effect of the high-frequency components grew much faster than that of the low-frequency components. (4) The groundwater table had an amplification effect on the vertical ground motion; therefore, its influence is also important to consider.
Field surveys have shown that the damages caused by a single earthquake can often differ from site to site. For instance (Wood 1908), studied the damage data relative to the 1906 San Francisco (United States) earthquake (Ms 7.8), finding that buildings located on soft soil sites presented much greater damages than those on near hard soil. In the case of the 1923 Kanto (Japan) (Ms 7.9) and 1976 Tangshan (Ms 7.8) earthquake in China, a strong correlation was noted between the damage of buildings (structures) and the thickness of the soil layer (Ohsaki, 1969; Liu and Cha, 1982; Gao and Hu, 1987). Interestingly, the damage rate of high-rise buildings was found to increase with the thickness of the soil layer in the case of the 1967 Venezuela earthquake (Ms 6.5) (Seed et al., 1986; Drake and San, 1993). During the 1985 Mexico earthquake (Ms 8.1), mid-rise buildings in Mexico City (at 400 km from the epicenter) were severely damaged, while low- and high-rise buildings (with more that 23 stories) were not damaged (Seed et al., 1988). Furthermore, the 2008 Wenchuan earthquake (Ms 8.0) produced high intensity anomalies in the Hanyuan County (at 200 km from the epicenter), which were mainly due to the amplification of ground motion by the local soil structure (Bo et al., 2009; Qi et al., 2010; Li et al., 2012). Overall, numerous earthquake damage field surveys and studies have shown that site characteristics can affect ground motion. The main reasons are the following: (1) the occurrence of resonance phenomena caused by the natural frequency of buildings that are similar to the predominant period of the site; (2) the local soil structure acting as a filter, which selectively amplifies or reduces the frequency components of ground motion (when ground motion is transmitted from the bedrock to the surface, its frequency components and amplitude values change significantly). The site amplification effect on ground motion is therefore a fundamental issue in seismology and earthquake engineering, since it has an important theoretical value and practical significance for earthquake fortification.
Ground response analysis methods based on strong motion observation data can be classified as reference or non-reference site methods, according to the availability of rock sites. The earliest reference site method (i.e., the traditional spectral ratio method) was proposed by Borcherdt (1970): the site amplification effect is defined based on the ratio of the Fourier spectrum of strong earthquake records at the soil site to that of the nearby rock site. This method considers the direction of the earthquake source and the path effect when the soil and rock sites are far away from each other. For example, Bonilla et al. (1997) studied the site amplification effect in the intensity anomaly zone of the San Fernando Valley (California) based on the aftershock records of the 1994 Northridge earthquake using this method. Moreover, Wang and Xie (2010) analyzed the Wenchuan main shock records recorded by the Zigong landform array based on the traditional spectral ratio method, finding that the landform and the soil site had a large influence on ground motion. Furthermore, Wang (2011) analyzed the strong earthquake records recorded by the digital strong-motion networks deployed in the Weihe Basin by the traditional spectral ratio method. He found that the Ⅶ-degree-intensity abnormal region distributed along the basin edge (from Baoji to Meixian) and associated with the Wenchuan earthquake resulted from a combination of basin edge effect and ground motion’s amplification by the soil site. Based on the main shock records of the Wenchuan earthquake (which were recorded at six stations around the Anning River) and the traditional spectral ratio method, Li et al. (2016) studied the amplification of ground motion at the station sites. A good correlation was identified between the amplification effect of the regional site on ground motion and the engineering geological zoning, and the different engineering geological zones were analyzed in detail. Lan et al. (2020) designed and constructed a centrifugal model test for medium–hard free fields, analyzed the correspondent results based on the traditional spectral ratio method, systematically investigated the nonlinear ground motion effect of the soil layer, and obtained the variation law of the ground motion amplification effect with depth.
So far, due to the limitation of data, most studies have been conducted to analyze the amplification effect of station soil sites by calculating the spectral ratios between the strong motions recorded at those stations and those recorded at nearby rock sites (through the traditional spectral ratio method). However, the soil structure below the surface of each station located in a certain region always includes more than one soil layer; therefore, the site amplification effect observed during the transmission of the ground motion from the bedrock to the surface would derive from the frequency filtering of all these soil layers. Because of the small number of domestic and foreign site soil arrays and strong motion records, studies on the amplification effect of ground motion at different depths below the surface have mostly focused on theoretical analysis and numerical simulation, while only a few studies have been based on actual strong motion records. This study was based on strong motion records collected in Guye (China) by the Seismic Monitoring Array of Site and Structure (SMASS) of the Institute of Disaster Prevention. These records were processed and analyzed by the traditional spectral ratio method, obtaining the spectral ratios for different depths. In this way, it was possible to conduct a systematic and comprehensive study of the amplification effect of ground motion by the soil structure at different bury depths. The obtained results are expected to be useful for future research on site ground motion effects.
The SMASS array, which belongs to the Key Laboratory of Seismic Defense and Risk Assessment of the Hebei Province, consists of both local effect and structure response arrays and is located at a site characterized by a soil layer thickness of ∼ 230 m, a flat bedrock surface, and a groundwater table of ∼ 20 m. Such configuration is ideal for studying the seismic response of soil sites. Notably, the SMASS array is located within the potential seismic source zone of magnitude 8.0, at ∼ 12 km from the macroscopic epicenter of the magnitude 8.0 Sanhe-Pinggu earthquake that occurred on 2 September 1,679. Hence, this site is suitable for strong motion observations in the near field of major earthquakes.
During the construction of the SMASS array, continuous core sampling and logging were carried out. Notably, the deepest drilled hole reached the inside of the bedrock (depth = 240.2 m). Based on the core samples, and according to geological drilling description requirements, we identified a total of 69 soil layers. These were then integrated into 38 layers according to the requirements of site effect observation under strong motion. The P- and S-wave velocities at different depths of the SMASS array were obtained by cross-hole seismic CT, the VSP logging technique, and the single-hole method. The soil samples were subjected to screening, liquid–plastic limit, dynamic triaxial, and resonant column tests to determine the static and dynamic parameters of each soil layer in the array. These data will be useful for future research focusing on the soil layer seismic response.
A total of six measurement points (No. S01-S06) were deployed to monitor strong vibrations in the local effect array. Five of the measurement points (No. S02-S06) was positioned on a concentric circle with a radius of 8 m This measurement points were located in correspondence of observation peep holes: the accelerometers were placed at the bottom of the peep holes (i.e., at 30 m, 65 m, 101 m, 151 m underground and 236 m at the top of the rock layer). Besides, two groundwater pressure measurement points (No. P01 and P02) were located between S02 and S03. The water column was instead 30 m below the observation peep holes: it was possible to monitor the changes of pore water pressure in the saturated stratum. At the same time, an excitation hole 240 m deep was set at the center of a concentric circle. The electric spark excitation source was placed within this circle. The local effect array measurement point plan and the instrument layout table are shown in Figure 1 and Table 1, respectively.
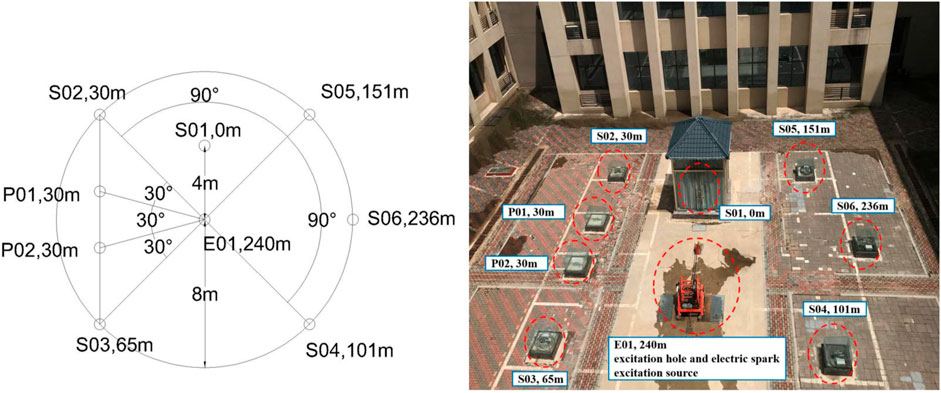
FIGURE 1. Local effect array measurement point plan.

TABLE 1. Information on the instrument layout.
The SMASS array monitored two strong earthquake records after its installation: the Fengnan earthquake (Ms 4.5), which occurred on 5 December 2019, and the Guye earthquake (Ms 5.1), which occurred on 12 July 2020. The epicenter of the Fengnan earthquake was located at 39.31°N, 118.04°E, (focal depth = 10 km): its epicenter was at ∼ 130 km from the SMASS array. Meanwhile, the epicenter of the Guye earthquake was located at 39.78°N, 118.44°E (focal depth = 10 km): its epicenter was at ∼ 143 km from the SMASS array. Since the magnitude of the Fengnan earthquake was small and the quality of the strong earthquake records was poor, we chose the records of the Guye earthquake for this study. (Figure 2)
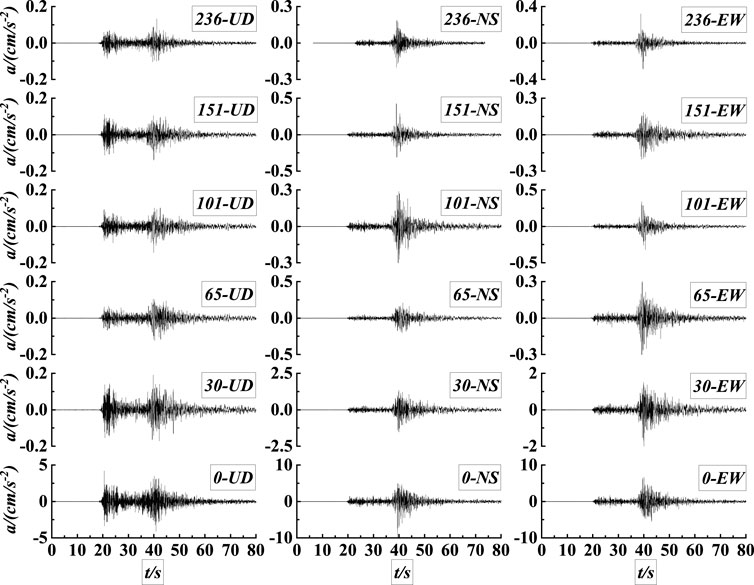
FIGURE 2. Guye strong earthquake acceleration time course.
Only part of the raw strong-motion data collected during the Guye earthquake could be used in the study. In fact, various factors may cause interference in the data from the moment of the motion triggering until the end of the recording of the strong motion seismograph: the direct use of raw strong earthquake records for data analysis, containing false component signals, would greatly affect the results. Processing the original strong-motion recordings was therefore an essential part of the data analysis. Here, we processed the strong-motion record of the Guye earthquake in four main steps: recording discrimination, filtering, smoothing, and horizontal component synthesis.
According to Zhou (2012), defective records can be mainly classified into “asymmetric waveforms” (Department of Earthquake Damage Prevention, China Earthquake Administration, 2008; Shin et al., 2008; Tobita et al., 2010), “small burr waveforms” (Rajesh Rupakhety, 2010), and “palpus phenomena” (Department of Earthquake Damage Prevention, China Earthquake Administration, 2008).
In this study, the ratio of the peak acceleration points to the adjacent sampling points (i.e., the case in which this value exceeded 1.1) and the occurrence of dissimilarities were considered discriminant conditions. In the case of complex palpus phenomena, the ratio of the peak acceleration points to the adjacent sampling points is expected to be too large and anisotropy might occur. The ratios of the peak acceleration points to the adjacent sampling points in the Guye strong-motion records are indicated in Table 2: the ratios never exceeded 1.1 and dissimilarity occurred.
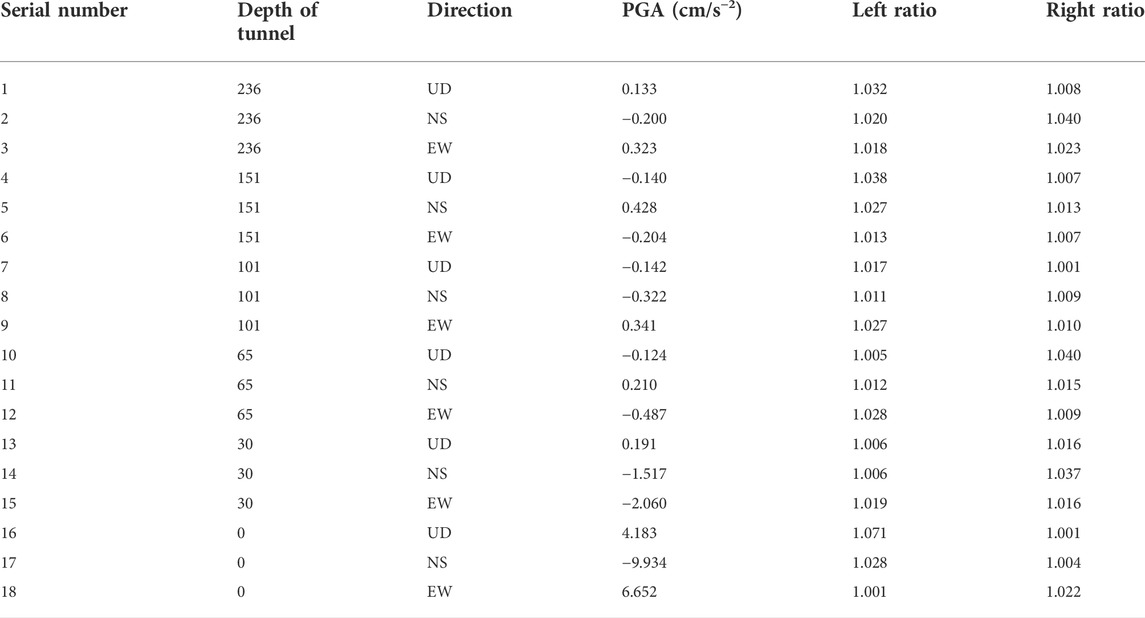
TABLE 2. Ratios of the strong Guye earthquake records.
The main purpose of the filtering step is typically to minimize the interference of noise in strong motion records and, hence, to provide realistic information for any subsequent data analysis. A reasonable cut-off frequency can in fact reduce the interference of noise signals, while an unreasonable one may lead to the loss of original components in the strong motion recordings. A large number of scholars have therefore researched filtering cut-off frequencies. So far, cut-off frequencies have been determined by four types of methods: empirical formulas (Trifunac, 1971; Trifunac and Lee, 1973; Shakal et al., 1988), pseudo-velocity spectra (Syun’itiro et al., 1988), noise spectra (Lee et al., 1982), and the earthquake focus theory (Trifunac and Todorovska, 2001; Shakal et al., 2003). So the filtering cut-off frequencies is selected according to noise spectra (Lee et al., 1982).
We extracted the 17s signal before the arrival of the P-wave of the ground motion recorded by the Guye strong earthquake as a noise spectrum; moreover, the high and low cut-off frequencies were determined by the trend of the original signal Fourier spectrum amplitude and by the intersection position of the original signal Fourier spectrum with the noise signal Fourier spectrum. In the low-frequency part of the record, since the noise signal lasted 17 s, the low cut-off frequency needed to be greater than 0.06 Hz: We found that the low-frequency part of the noise spectrum amplitude was always lower than the signal spectrum amplitude. Furthermore, the signal spectrum amplitude increased with frequency over 0.2 Hz: 0.2 Hz was identified as the low cut-off frequency. We found that the signal and noise Fourier spectra began to intersect at ∼ 20–30 Hz in the high-frequency part, after this point, the frequency component of the original signal may have been contaminated by the noise signal, and the original signal spectrum amplitude increased with frequency. Therefore, 25 Hz was taken as the high cut-off frequency. The original signal was filtered by using the Butteworth filter (of the fourth order) and the Fourier spectrum of the original signal was compared with that of the filtered signal. The peak acceleration values of the ground motion time history at different depths were given after filtering (Table 3).
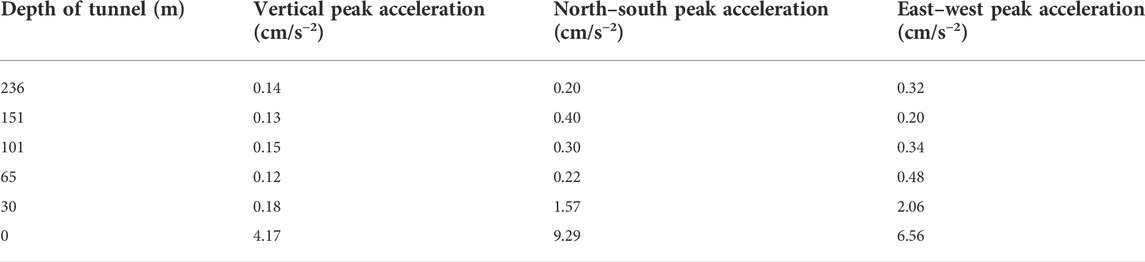
TABLE 3. Peak acceleration in n relation to depth of tunnel.
After the baseline correction and filtering of the strong motion records, we observed a high number of burrs in the Fourier transformed spectra (Figures 3–5). In this case and should the records be used directly for the calculation of the spectral ratio without previous smoothing, it would be difficult to determine the frequency band and energy distributions. This, in turn, would increase the difficulty of identifying the predominant frequency at the study site. Two types of burr processing methods are generally applied to strong motion recording data: (1) the addition of a smoothing window in the time domain and (2) the addition of a smoothing window in the frequency domain (Osaki, 2008). In study, the Parzen window and K-window length of 0.8 Hz (Konno and Ohmachi, 1995) were used to smooth the Fourier spectrum of the Guye strong motion records. Through several tests and comparisons, we found that the best smoothing effect was obtained for a Pazen window length of 0.8 Hz: in this case, the burrs were effectively removed and the error was within a reasonable range. Based on these results, we decided to apply a Parzen window with a window length of 0.8 Hz to smooth the Fourier spectra of the filtered strong motion records: the correspondent smoothing effects are shown in Figures 3–5.
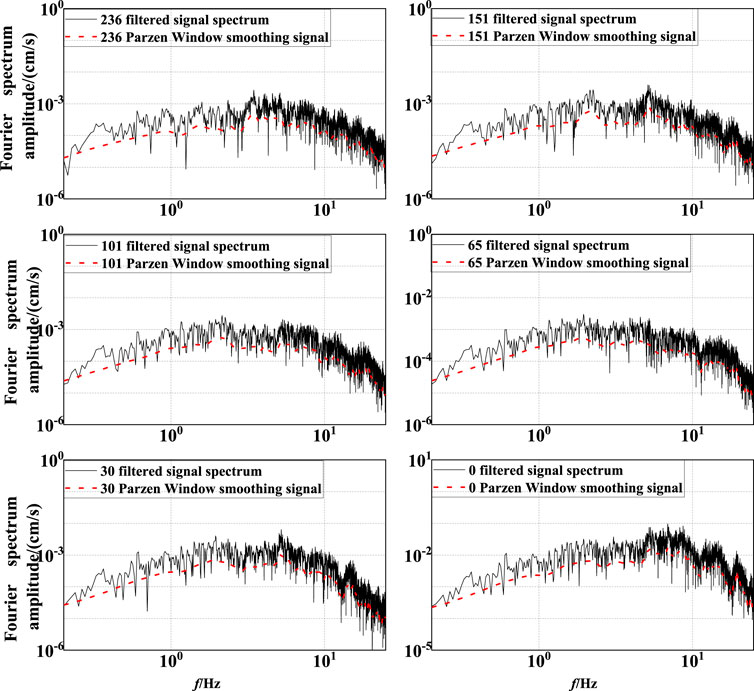
FIGURE 3. Guye strong motion record smoothing effects (vertical direction).
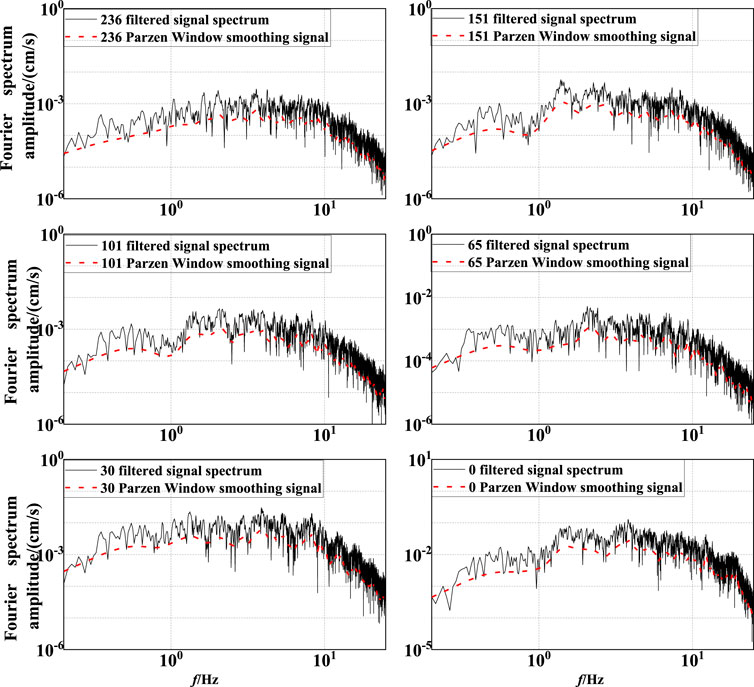
FIGURE 4. Guye strong motion record smoothing effects (north–south direction).
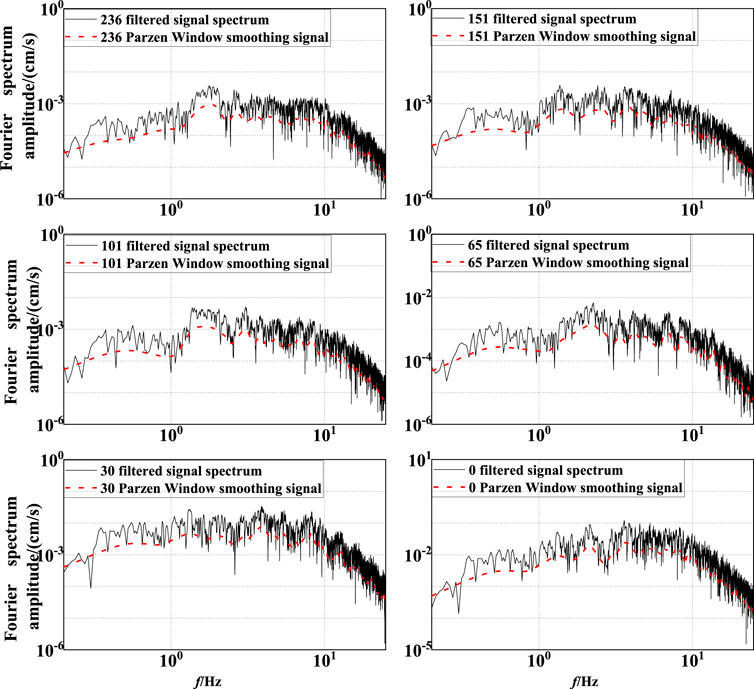
FIGURE 5. Guye strong motion record smoothing effects (east–west direction).
If the direction of the strong motion seismograph is not the same as the actual direction during the placement, a new horizontal component increment may be generated. Here, we focused on the amplification effect of soil structure on ground motion. To improve the accuracy of our predictions, the strong motion records in the east–west direction were synthesized with those in the north–south direction before obtaining the spectral ratio; notably, only the amplification effects of the soil structure on the horizontal and vertical ground motions were considered. Eq. (1) (Yu, 2003) represents the synthesis formula, where
Ground motion is mainly affected by three factors during its propagation: the source effect
Wang Haiyun (2011) found that the interference of the upward and downward wave fields caused by different velocity interfaces at the surface and within the soil body can lead to the so-called “spectral hole” phenomenon. Therefore, based on the concept of stemming function proposed by (Steidl 1996). In their study, further analysis is carried out to obtain the site response at the surface or at a certain depth in the ground by multiplying the stemming function with the Fourier spectral ratio. The coherence function can be expressed by the equation
Therefore, we used the traditional spectral ratio method to determine the site effect: the strong motion records observed at the five measurement points were compared with those observed at the bedrock measurement point.
As a matter of fact, a Fourier transformation consists in the conversion of a signal from the time domain to the frequency domain. A Fourier spectrum, which can be described as a simple harmonic wave frequency in horizontal coordinates and as a simple harmonic wave amplitude in vertical coordinates, can reflect the frequency spectral characteristics of a ground motion time history. The horizontal coordinates of the response spectrum represent the period, while the vertical coordinates represent the maximum response amplitude generated by different single-degree-of-freedom systems under the excitation of a ground motion time history, which can also reflect the frequency spectral characteristics of the ground motion time history. Luo et al. (2019) deduced that the Fourier and zero-damped velocity response spectra can both represent the energy in a vibrator system. The response and Fourier spectra are similar in which they can both record strong motions under the neglect of damping; moreover, the Fourier spectrum curve is always included in the velocity response spectrum. Therefore, we decided to use the spectral ratio of the Fourier spectrum to the velocity response spectrum with zero damping for our contrast, and observe whether the two spectral ratios agree.
In this study, the traditional spectral ratio method was used to analyze the site amplification effect of the SMASS site array. The bedrock (depth = 236 m) was taken as the reference site: the Fourier and response spectra of strong motion records at different depths were compared with those in correspondence of the bedrock to study the variation of ground motion in different soil structures. The correspondent results are shown in and Tables 4, 5.
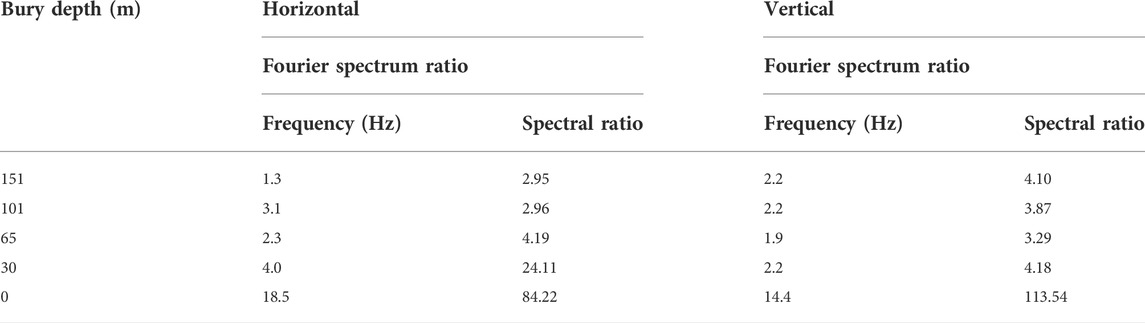
TABLE 4. Amplification factors and corresponding amplification frequencies observed at different bury depths of the SMASS table array in the Guye strong motion records (Fourier spectrum ratios).
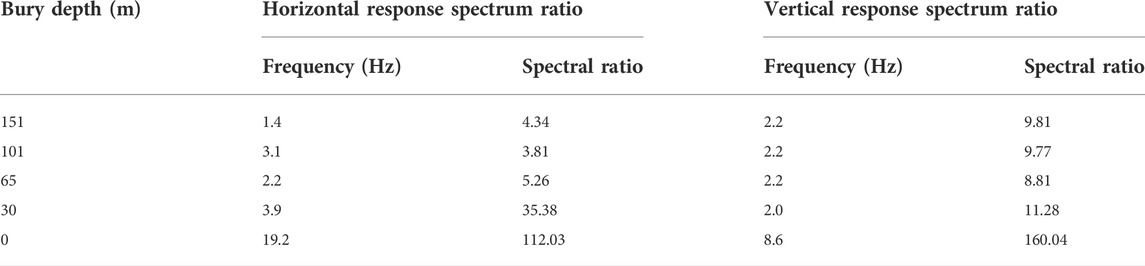
TABLE 5. Amplification factors and corresponding amplification frequencies observed at different bury depths of the SMASS table array in the Guye strong motion records (response spectrum ratios).
Figures 6, 7 show how most of the Fourier spectral ratio curves were located between the reaction spectral ratio curves and had similar shapes (Luo et al., 2019); therefore, the reaction spectrum with zero damping was considered to be feasible for our spectral ratio analyses. The data in Tables 4, 5 show instead how, during the diffusion of the horizontal ground motion from the bedrock to 65 m below ground, the spectral ratio first increased and then fluctuated within a certain range; furthermore, as the horizontal ground motion continued to diffuse upward, the spectral ratio increased significantly. Finally, from 30 m below ground to the surface, the growth rate of the spectral ratio increased further. The changes in spectral ratio during the diffusion of the vertical ground motion from the bedrock upward were slightly different from that just described: from the bedrock to 30 m below ground, there were no obvious variations. However, from 30 m below ground to the surface, the spectrum ratio increased sharply and its growth rate was larger than that of the horizontal ground motion within the same depth interval.
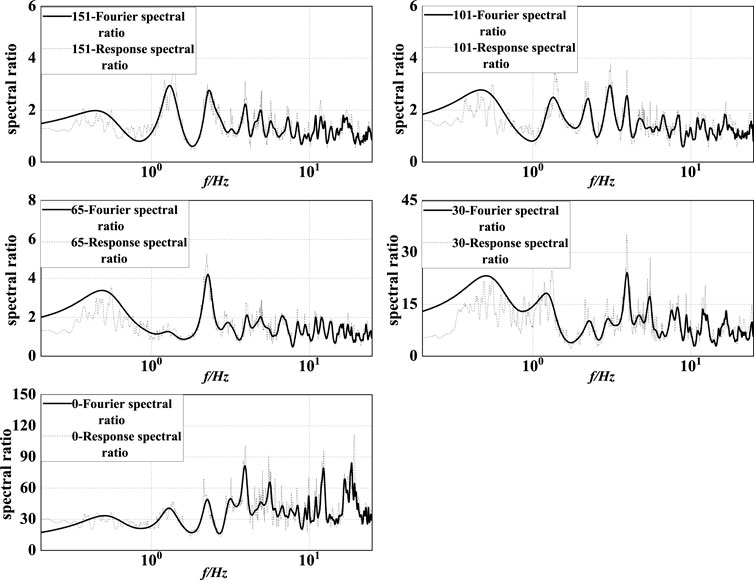
FIGURE 6. Fourier and response spectral ratios in the horizontal direction (Guye strong motion records).
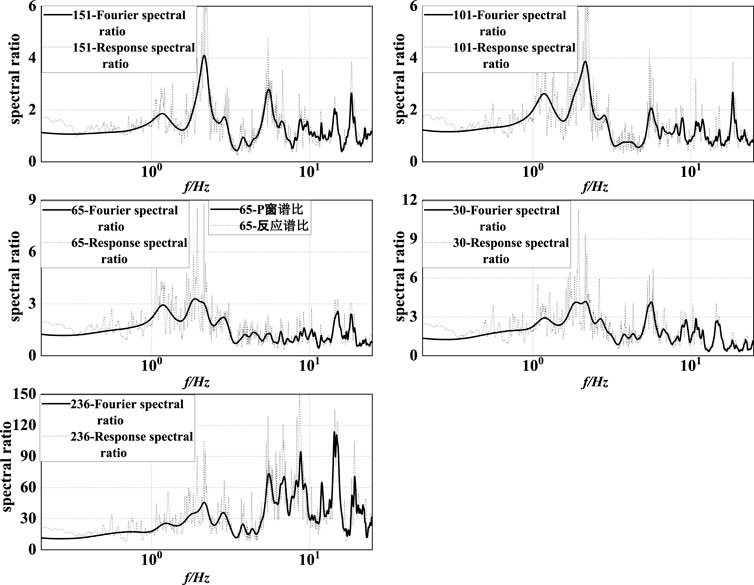
FIGURE 7. Fourier and response spectral ratios in the vertical direction (Guye strong motion records).
Figure 6 shows how the amplification effect of the soil layer on the horizontal ground motion was different at different depths. When the horizontal ground motion diffused from the bedrock to 151 m underground, the ground motion amplification by the soil layer structure was mainly concentrated around 1.3 and 2.1 Hz, and the spectral ratio was maximum at 1.3 Hz. Meanwhile, when the horizontal ground motion diffused from 151 to 101 m underground, the magnitude of the spectral ratio did not change significantly, but the frequency corresponding to the maximum spectral ratio changed from 1.3 to 3.1 Hz. When the horizontal ground motion diffused instead from 101 to 65 m below ground, the peak at 1.04 Hz disappeared (suggesting that the soil structure between 151 and 101 m below ground should have selectively filtered the ground vibration frequency components and amplified the frequencies around 0.5 and 2.3 Hz) and the spectral ratio reached its maximum at 2.3 Hz. When the horizontal ground motion diffused from 65 to 30 m underground, the spectral ratio increased significantly and the frequency of the maximum spectral ratio increased, with small peaks increasing after 4 Hz. Finally, when the horizontal ground motion diffused from 30 m underground to the surface, the correspondent soil layer amplified both the low- and high-frequency components of ground motion; however, the amplification of the former was less obvious than that of the latter, and the spectral ratio was maximum at a frequency of 18.5 Hz.
As shown in Figure 7, the amplification of the vertical ground motion occurred mainly around 2.2, 5.5, and 18 Hz for the soil layer structure between the bedrock and 151 m underground and the spectral ratio was maximum at 2.2 Hz. As the ground motion continued to diffuse upward, the soil layer between 151 and 101 m underground selectively filtered the vertical ground motion frequency components, resulting in a decrease of the spectral ratio at 5.5 Hz; meanwhile, the frequency corresponding to the maximum spectral ratio did not change (was still 2.2 Hz). When the vertical ground motion reached 65 m underground, the frequency band near 1.9 Hz gradually broadened and the frequency corresponding to the maximum spectral ratio changed from 2.2 to 1.9 Hz, while the maximum spectral ratio and the peak acceleration did not change significantly. When the vertical ground motion reached 30 m underground, the small peak of the high-frequency components after 4 Hz started to increase and the frequency corresponding to the maximum spectral ratio increased from 1.9 to 2.2 Hz, while the spectral ratio did not change significantly. Finally, when the vertical ground motion diffused from 30 m underground to the surface, the spectral ratio increased rapidly and the frequency corresponding to the maximum spectral ratio increased, reaching 14.4 Hz at the surface.
The main findings are summarized below.
1) The soil layer structure amplified the ground motion in the SMASS array site mainly in correspondence of the shallow soil layer (above 30 m depth). In the deeper soil layer, the amplification effect occurred but it was not obvious: the amplification effect increased with the decrease of the bury depth.
2) The amplification effect of the soil layers on the horizontal ground motion changed with depth. In fact, the amplification effect of the soil layer between the bedrock and 151 m underground was mainly concentrated at 1.3 and 2.1 Hz (maximum spectral ratio at 1.3 Hz); meanwhile, at 151 m underground the maximum spectral ratio corresponded to a remarkable frequency change (from 1.3 to 3.1 Hz). At 65 m underground, the spectral ratio reached its maximum at 2.3 Hz, while the small spikes started to increase at frequencies >4 Hz at 30 m underground. Finally, the soil layer between 30 m underground and the surface amplified both the low- and high-frequency components of ground motion, but the amplification effect on the former components was less obvious than that on the latter components, and the maximum spectral ratio corresponded to a frequency of 18.5 Hz.
3) An amplification effect of the SMASS array site on both the high- and low-frequency components of ground motion was noted; however, when the bury depth was deeper, the amplification effect on the high-frequency components of ground motion was not obvious and the amplification frequency band was mainly concentrated between ∼ 1–3 Hz. With the decrease of the bury depth, the amplification of the low-frequency component of the band gradually grew; notably, the amplification of the high-frequency component grew much faster than that of the low-frequency components from 4 to 18.5 Hz.
4) From the SMASS array spectral ratio results, we infer that the groundwater level can have an amplifying effect on the peak vertical ground vibration acceleration; however, further studies are needed to determine the quantitative effects.
We investigated the amplification of ground motion by the traditional spectral ratio method and based on the SMASS array, finding that the source effect and path effect were negligible: the only factor causing changes in ground motion is the effect of different soil structures during its diffusion.
As the ground motion diffused from the bedrock upward, different soil layer structures filtered its frequency components in different ways and selectively amplified the components having frequencies similar to their own.
1) Our results clearly indicated that the soil layer structure between the bedrock surface and 151 m underground amplified both the horizontal and vertical components of ground motion; meanwhile, the soil structure between 151 and 65 m underground affected the transmission of ground motion, but the spectral ratios varied within a restricted range and this variation was not obvious.
2) The spectral ratio results indicate that the amplification effect of the deep soil layer was not obvious during the upward diffusion of the horizontal ground motion from the bedrock side: the spectral ratio and the peak ground acceleration of ground motion started to increase significantly only when the horizontal ground motion diffused upward from 65 m underground. The shear wave velocity was 486 m/s at 65 m underground, suggesting that at this depth the soil changed from hard to soft and explaining its increasing amplifying effect on the horizontal ground motion in the upward direction.
3) By comparing the spectral ratios of the horizontal and vertical ground motions at 151, 101, and 65 m underground, we noticed the following: the frequencies corresponding to the maximum spectral ratios in the case of the horizontal ground motions were 1.3, 3.1, and 2.3 Hz, respectively, while those in the case of the vertical ground motions were 2.2, 2.2, and 1.9 Hz, respectively. Moreover, the shape changes of the horizontal ground motion spectral ratios were larger than those of the vertical ground motion spectral ratios. Overall, these results indicate that changes in the soil layer structure had a greater influence on the horizontal, rather than on the vertical ground motion frequency components.
4) When the horizontal and vertical ground motions diffused upward from 65 m underground, the maximum spectral ratio corresponded to the superior frequency and the small spikes in the high-frequency part started to increase. This indicates that the shallow soil layer of the SMASS array site had a greater influence on the amplification of ground shaking, and that the amplification of the high-frequency component of ground motion was stronger than that of the low-frequency component.
The above results clearly indicate that the soil layer structure influenced both the horizontal and vertical components of ground motion, although it had a greater influence on the former. When the horizontal ground motion diffused upward from 65 to 30 m underground, the spectral ratio and the PGA started to increase significantly, and the frequency corresponding to the maximum spectral ratio increased. Meanwhile, the frequency corresponding to the maximum spectral ratio of vertical ground motion also increased, but this change was not obvious and the spectral ratio and the PGA hardly varied. Chen et al. conducted a 3D seismic response analysis of a soft soil site in Shanghai (Chen et al., 2011). By considering various groundwater level depths, they found that the amplification effect of the horizontal peak acceleration increased with the rise of the groundwater level, although this variation was not significant; at the same time, any changes in the depth of the groundwater level had a significant effect on the amplification coefficient of the vertical peak acceleration. In this study, we considered an SMASS array with a perennial groundwater level at ∼ 20 m depth. When the vertical ground motion diffused upward from the bedrock surface to 30 m underground, the maximum spectral ratio did not change significantly; however, when it diffused upward from 30 m underground, the maximum spectral ratio and the PGA increased significantly (the growth rate in this case being greater than that of the horizontal ground shaking). On this basis, we infer that the groundwater level should have had a great influence on the maximum spectral ratio and on the PGA of the vertical ground motion.
Recent research on the amplification effect of ground motion at different depths below the surface has been mostly based on theoretical analysis and numerical simulation. Unfortunately, the low number of arrays and strong motion records has led to a scarcity of works analysis methods aimed at testing the soil seismic response under actual strong earthquake records. The shear wave velocity is an indication of the softness and stiffness of the soil layer to a certain extent. The results of our analyses suggest that the soil layer with shear wave velocity <486 m/s significantly amplified the horizontal ground motion. In this case, it is reasonable to choose the soil layer with shear wave velocity = 500 m/s as input interface for obtaining the soil layer seismic response. The results obtained from these calculations can then be applied to the construction of anti-seismic building structures. However, for important or can lead to secondary disaster of the building (structure), for safety reasons should be specifically studied to determine the input interface.
The ground motions generated during earthquakes are complex and multi-dimensional. In particular, vertical ground motions are sometimes very strong and can cause serious damages to buildings. In the “Code for Seismic Design of Buildings” (GB50011-2010), the vertical earthquake influence coefficient is usually taken as 65% of the maximum horizontal earthquake influence coefficient for determining the vertical seismic action. From the analyses, we found that the peak acceleration of the vertical ground motion in correspondence of the bedrock was much smaller than the correspondent peak acceleration of the horizontal ground motion; moreover, when the ground motion diffused to the shallow soil layer, the growth rate of the peak acceleration of the vertical ground motion was much larger than that of the horizontal ground motion due to the influence of the groundwater level. Finally, when the ground motion reached the surface, the peak acceleration of the vertical ground motion was close to that of the horizontal ground motion: the value of vertical ground motion was low, suggesting that it should be increased for different structural.
The original contributions presented in the study are included in the article/supplementary material, further inquiries can be directed to the corresponding authors.
PL was involved in writing the manuscript. KZ contributed to data analysis and paper writing. PL and KZ read and approved the final manuscript.
This study is funded by the China Earthquake Administration Spark Project of Earthquake Science and Technology (XH204401).
The authors thank the SMASS, Hebei Key Laboratory of Earthquake Disaster Prevention and Risk Assessment for providing data.
The authors declare that the research was conducted in the absence of any commercial or financial relationships that could be construed as a potential conflict of interest.
All claims expressed in this article are solely those of the authors and do not necessarily represent those of their affiliated organizations, or those of the publisher, the editors and the reviewers. Any product that may be evaluated in this article, or claim that may be made by its manufacturer, is not guaranteed or endorsed by the publisher.
Aoi, S., Kunugi, T., and Fujiwara, H. (2008). Trampoline effect in extreme ground motion. Science 322 (5902), 727–730. doi:10.1126/science.1163113
Bo, J. S., Qi, W. H., Liu, H. S., Liu, B., Liu, D. D., and Sun, Y. W. (2009). Abnormality of seismic intensity in Hanyuan during Wenchuan earthquake. Earthq. Eng. Eng. Dyn. 29 (06), 53–64.
Bonilla, L. F., Steidl, J. H., Lindley, G. T., Tumarkin, A. G., and Ar-chuleta, R. J. (1997). Site amplification in the San Fernando Valley, California: Variability of site-effect estimation using the S-wave, coda, and H/V methods. Bull. Seismol. Soc. Am. 87 (3), 710–730. doi:10.1785/bssa0870030710
Borcherdt, R. D. (1970). Effects of local geology on ground motion near San Francisco Bay. Bull. Seism. Soc. Am. 60 (1), 29–61.
Chen, Q. S., Gao, G. Y., and He, J. F. (2011). Three-dimensional nonlinear analysis of seismic ground response of soft soil sites in Shanghai. Rock. Soil. Mech. 32 (11), 3461–3467. doi:10.3969/j.issn.1000-7598.2011.11.043
Department of Earthquake Damage Prevention, China Earthquake Administration (2008). Report on strong earthquake records in China episode 12 volume 1 uncorrected acceleration records of the wenchuan 8.0 magnitude earthquake. Germany: Earthquake Press.
Drake, L. A., and San, C. O. (1993). Germany: St. Augustine. Ground motion and building damage: Caracas 29 july 1967 and Mexico city, 19 september 1985 Proceedings of the Caribbean Conference on Natural Hazard: Volcanoes, Earthquakes, Windstorms, Floods.
Gao, Z. H., and Hu, B. R. (1987). The influence of local site conditions on earthquake damage——analysis of earthquake damage in fengrun county during the tangshan earthquake. North. China. Earthq. Sci. 5 (S1), 208–213.
Ji, K., Ren, Y. F., and Wen, R. Z. (2017). Review on site classification with spectra ratio method. World. Earthq. Eng. 33 (01), 91–99.
Ji, K., Wen, R. Z., Ren, Y. F., and Wang, H. W. (2014). Analysis of site characteristics based on strong-motion records of Lushan aftershocks, Earthquake. Eng. Eng. Dyn. 34 (5), 35–42. doi:10.13197/j.eeev.2014.05.35.jik.005
Konno, K., and Ohmachi, T. (1995). A smoothing function suitable for estimation of amplification factor of the surface ground from microtremor and its application. Dob. Gakkai Ronbunshu, 247–259. doi:10.2208/jscej.1995.525_247
Lan, J. Y., Song, X. J., Liu, J., and Wang, Y. W. (2020). Study on the variation ground motion amplification effect of medium-hard free fields with depth under earthquake action. Chin. J. Rock Mech. Eng. 39 (S2), 3696–3705. doi:10.13722/j.cnki.jrme.2019.1249
Lee, V. W., Trifunac, M. D., and Amini, A. (1982). Noise in earthquake accelerograms. J. Engrg. Mech. Div. 108 (6), 1121–1129. doi:10.1061/jmcea3.0002894
Li, P., Bo, J. S., Li, X. B., and Xiao, R. J. (2016). Amplification effect of soil sites on ground motion in Anning River valley and Qionghai Lake area. Chin. J. Geotech. Eng. 38 (02), 362–369. doi:10.11779/CJGE201602022
Li, P., Bo, J. S., Qi, W. H., Liu, D. D., and Xiao, R. J. (2012). Effects of soil structure on abnormal intensity in Hanyuan old town. Acta Seismol. Sin. 34 (06), 851–857.
Liu, S. K., and Cha, X. G. (1982). The influence of site conditions on earthquake damage in the high intensity area of the Tangshan earthquake. China Earthq. Eng. J. 4 (02), 67–74.
Luo, G. C., Li, X. J., Fu, L., and Wang, Y. S. (2019). Study on nonlinearity of site effect with the HVSR spectral ratio. J. Seismol. Res. 42 (04), 546–554+650.
Ministry of Housing and Urban-Rural Development of the People's Republic of China (2010). GB50011-2010 code for seismic Design of buildings. Beijing: Building Industry Press.
Ohsaki, Y. (1969). Proceedings of the seventh IC SMFE specialty session on soil dynamics. Mexico: Building Industry Press.The effects of local soil conditions upon earthquake damage.
Qi, W. H., Bo, J. S., Liu, X. Guo D. D., and Liu, Q. B. (2010). Preliminary study on a special site in the Wenchuan earthquake. Earthq. Eng. Eng. Dyn. 30 (3), 53–58. doi:10.1785/0120090132
Rupakhety, R. (2010). Contemporary issues in earthquake engineering research: Processing of accelerometric data,modelling of inelastic structural response, and quantification of near_fault effects. Reykjavik: Faculty of Civil and Environmental Engineering School of Engineering and Natural Sciences University of Iceland.
Seed, H. B., Romo, M. P., Sun, J. I., Jaime, A., and Lysmer, J. (1988). The Mexico earthquake of September 19, 1985- Relationships between soil conditions and earthquake ground motions. Earthq. Spectra 4 (4), 687–729. doi:10.1193/1.1585498
Seed, H. B., Wong, R. T., Idriss, I. M., and Tokimatsu, K. (1986). Moduli and damping factors for dynamic analyses of Cohesionless soils. J. Geotech. Engrg. 112 (11), 1016–1032. doi:10.1061/(asce)0733-9410(1986)112
Shakal, A. F., Huang, M. J., and Cao, T. Q. (1988). Proceedings of the second workshop on processing of seismic strong motion records. Tokyo: Springer. Processing of 9wcee strong motion workshop test records by CSMIP.
Shakal, A. F., Huang, M. J., and Graizer, V. M. (2003). 58 Strong-motion data processing. Int. Geophys. 81 (3), 967–981. doi:10.1016/S0074-6142(03)80172-9
Steidl, J. H., Tumarkin, A. G., and Archuleta, A. J. (1996). What is a reference site? Bull. Seismol. Soc. Am. 86 (6), 1733–1748. doi:10.1785/bssa0860061733
Syun'itiro, O., Tokiharu, O., and Shigeto, H. (1988). Data processing method for acceleration records and its application results, Processings of the second workshop on processing of seismic strong motion records. Tokyo: Springer, 119–135.
Tobita, T., Iai, S., and Iwata, T. (2010). Numerical analysis of near-field asymmetric vertical motion. Bull. Seismol. Soc. Am. 100 (4), 1456–1469. doi:10.1785/0120090301
Trifunac, M. D. (1971). Zero baseline correction of strong-motion accelerograms. Bull. Seismol. Soc. Am. 61 (5), 1201–1211. doi:10.1785/bssa0610051201
Trifunac, M. D., and Lee, V. W. (1973). Routine computer processing of strong-motion accelerograms. Pasadena: Earthquake Engineering Research Laboratory. Report EERL 73-03.
Trifunac, M. D., and Todorovska, M. I. (2001). A note on the useable dynamic range of accelerographs recording translation. Soil Dyn. Earthq. Eng. 21, 275–286. doi:10.1016/s0267-7261(01)00014-8
Wang, H. Y. (2011). Amplication effects of soil sites on ground motion in the Weihe basin. Chin. J. Geophys. 54 (01), 137–150. doi:10.3969/j.issn.0001-5733.2011.01.015
Wang, H. Y., and Xie, L. L. (2010). Effects of topography on ground motion in the Xishan park, Zigong city. Chin. J. Geophys. 53 (7), 1631–1638. doi:10.3969/j.issn.0001-5733.2010.07.014
Wood, H. O. (1908). Distribution of apparent intensity in san Francisco, report of the state earthquake commission. Geophysical: Carnegie Institute of Washington.
Yu, J. (2003). The choice of reference sites for seismic ground amplification analyses: Case study at parkway, New Zealand. Bull. Seismol. Soc. Am. 93 (2), 713–723. doi:10.1785/0120010289
Keywords: the seismic site effect, the traditional spectral ratio method, ground motion, amplification, SMASS array site
Citation: Li P and Zhou K (2022) The study of ground motion amplification based on an SMASS array site. Front. Earth Sci. 10:934206. doi: 10.3389/feart.2022.934206
Received: 02 May 2022; Accepted: 01 August 2022;
Published: 29 August 2022.
Edited by:
Yefei Ren, Institute of Engineering Mechanics, China Earthquake Administration, ChinaReviewed by:
Jingyan Lan, Guilin University of Technology, ChinaCopyright © 2022 Li and Zhou. This is an open-access article distributed under the terms of the Creative Commons Attribution License (CC BY). The use, distribution or reproduction in other forums is permitted, provided the original author(s) and the copyright owner(s) are credited and that the original publication in this journal is cited, in accordance with accepted academic practice. No use, distribution or reproduction is permitted which does not comply with these terms.
*Correspondence: Ping Li, Y2hpbmFsaXBpbmcxOTgxQDEyNi5jb20=, Kai Zhou, NzI5ODE0NTYwQHFxLmNvbQ==
Disclaimer: All claims expressed in this article are solely those of the authors and do not necessarily represent those of their affiliated organizations, or those of the publisher, the editors and the reviewers. Any product that may be evaluated in this article or claim that may be made by its manufacturer is not guaranteed or endorsed by the publisher.
Research integrity at Frontiers
Learn more about the work of our research integrity team to safeguard the quality of each article we publish.