 Te Sha
 Xiaojun Yao
 Yu Wang
 Zhijuan Tian
- College of Geography and Environment Sciences, Northwest Normal University, Lanzhou, China
Under the background of global warming, lake changes in the Qinghai–Tibet Plateau and their impacts have been widely concerned. To avoid downloading and preprocessing numerous remote sensing images, we used JavaScript to preprocess the Landsat OLI and Sentinel-2 MSI images based on the Google Earth Engine (GEE) platform and extract the water area of Tuosu Lake by combining NDWI, MNDWI, and SVM methods. The area changes of Tuosu Lake in 2000–2021, and their impact on the surrounding infrastructure were further analyzed. The results show that 1) in different methods of surface water extraction, the segmentation based on NDWI is the most efficient for delineating the Tuosu Lake, and the optimal threshold is 0.15 ± 0.03. 2) During 2000–2021, the area of Tuosu Lake increased by about 45.79 km2, which can be roughly divided into a slow growth period (2000–2013, 1.20 km2/a), a stable period (2013–2016, 0.49 km2/a), slow expansion period (2016–2017, 1.97 km2/a), and rapid expansion period (2017–2021, 7.43 km2/a). In particular, in 2019–2020, the lake area increased sharply by 9.22 km2. 3) Affected by the expansion of Tuosu Lake, the highway along the northern lake had been seriously threatened, and about 19.17 km (83.28%) of it was submerged by 2021. In addition, the distance between Tuosu Lake and the Qinghai–Tibet Railway has been shortened year by year, with the shortest distance of 0.85 km in 2021.
1 Introduction
Lakes are an important part of the terrestrial hydrosphere, and their change can indirectly explain the response of the regional environment to climate change (Williamson et al., 2009; Zhang et al., 2015). Affected by global warming, inland lakes are changing dramatically (Abd Ellah, 2020). As a water tower in Asia, the Qinghai–Tibet Plateau is the birthplace of many glaciers, lakes, and rivers (Pritchard, 2019). The lakes on the plateau are less affected by human activities, which can better reflect the relationship between natural environmental factors and lake evolution (Shao et al., 2008). It was suggested that in recent years, most lakes’ area in the Qinghai–Tibet Plateau has shown an accelerated expansion trend, and the main factors are precipitation increase and more glacier meltwater runoff input due to temperature rise (Wang et al., 2013; Lei et al., 2014; Siyang et al., 2014; Jiang et al., 2017; Li et al., 2017; Lv, 2019; Zhu et al., 2019; Wang et al., 2020). The expansion of some lakes in the Qinghai–Tibet Plateau not only led to the drainage reorganization and physical-chemical property change of lake water but also posed a serious threat to the surrounding human facilities (Yao et al., 2014; Yan et al., 2016; Yao et al., 2017; Liu et al., 2018). Several major disasters caused by glacial lake outburst floods (GLOFs) have been previously reported and studied in detail, such as the Luggye Tsho in Bhutan Himalaya (Watanbe and Rothacher, 1996), Tam Pokhari in the Mt. Everest region (Osti and Egashira, 2009), and RanzeriaCo in the Nyainqentanglha Range (Sun et al., 2014). Many studies focus on glacial lakes and their outburst floods due to their high potential energy and large areas of destruction (Bajracharya et al., 2007; Chen et al., 2010; Hewitt and Liu, 2010; ICIMOD, 2011; Jain et al., 2015a; Jain et al., 2015b). However, the influences of lake changes in the plateau interior region where residents and infrastructures are mainly concentrated have received little attention.
Remote sensing (RS) provides an ideal approach to quickly monitoring lake changes. The common way of lake boundary extraction based on RS includes downloading images covering the lake, processing them such as atmospheric radiation correction, registration, and ortho-rectification, and delineating lakes using manual, semi-automatic, or automatic methods (Mcfeeters, 1996; Liao and Liu, 2008; Landmann et al., 2010; Liu et al., 2010). If all processes are carried out locally, they will occupy a lot of human and material resources. Therefore, an approach to quickly obtaining and processing data is very necessary for the long-time series of water changes. The Google Earth Engine (GEE) platform was jointly developed by Google, the U.S. Geological Survey, and Carnegie Mellon University in 2010 (Zhou, 2017). With the advantages of massive data and cloud processing, GEE has been widely applied in data fusion (Mateo-García et al., 2018), multi-temporal image classification (Tsai et al., 2018), change detection (Zurqani et al., 2018), and dynamic monitoring of land use (Liu et al., 2018). Previously, some authors adopted GEE to obtain a lake water body (Li et al., 2021; Liao et al., 2021; Peng et al., 2021). However, there is a lack of comparison of lake extraction methods. This study aimed to 1) implement the operations of online data acquisition, data process, and surface water extraction based on the GEE platform; 2) compare different methods of lake surface water extraction and propose the most appropriate method to delineate Tuosu Lake and apply the Otsu algorithm to the GEE platform for efficient surface water extraction; and 3) explore the spatiotemporal change characteristics of the Tuosu Lake and evaluate its potential on surrounding infrastructures.
2 Study Area
Tuosu Lake (37°04′-37°13′N, 96°50′-97°03′E, 2808 m a.s.l) is located at the Qaidam Basin in the northeastern Qinghai–Tibet Plateau, 45 km away from the Delingha city in Qinghai province (Figure 1). In addition to runoff from the Keluk e Lake upstream [mainly recharged by groundwater (Tan, 2014)], Tuosu Lake is mainly supplied by precipitation. The water area of Tuosu Lake is about 181.793 km2, and the maximum depth is about 25 m. Its shape presents a triangle with several islands in the north of the lake center (Zongyan et al., 2020). Tuosu Lake is a saltwater lake with a salinity of 35.74 g/L, dissolved oxygen of 105.64 mg/L, and a pH value of 8.38 (Fu et al., 2016; Long et al., 2017). The study area belongs to the sub-basin named Bayan Gol River, which belongs to a plateau desert and semi-desert climate area. The average temperature of the hottest month is 16.7°C, the extremely high temperature can reach 33.1°C, and the annual average temperature is 4.0°C. The sunshine is abundant, and the annual sunshine duration is 3127.9 h. The frost-free period is about 84–99 days. Water resources are extremely scarce, with an average annual rainfall of 176.8 mm, and the annual evaporation is 2102.1 mm (Yan et al., 2012). The main vegetation surrounding the lake are Ephedra, Nitraria, and Compositae (Zhao et al., 2010).
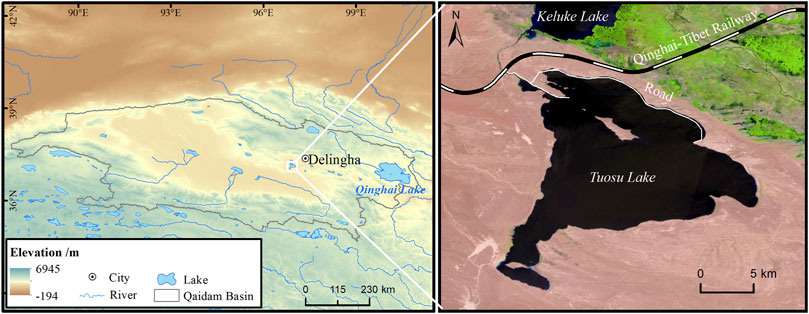
FIGURE 1. Overview of Tuosu Lake (the right is the Sentienl-2B MSI image acquired on 22 July 2021).
3 Materials and Methods
3.1 Materials
As a planetary-scale and cloud-based platform, the GEE provides strong computing power and abundant multi-source data. In this study, the optical remote sensing images used mainly include Landsat ETM+(2000), Landsat OLI (2013–2020), and Sentinel-2 MSI (2021). All images covering Tuosu Lake were first cleaned and screened on the GEE platform to obtain those with less than 5% cloud cover from mid-August to the end of October each year, which are then used to extract the vector boundary of the water area. The meteorological materials adopted are ERA5 data that can be directly called by the GEE platform. Band “temperature_2m,” band “total_precipitation,” and band “potential_evaporation” denote temperature, precipitation, and evaporation, respectively. The AW3D30 (ALOS World 3D) DEM data produced by JAXA were called by the GEE platform as well. In the vector data provided by the GEE platform, the road data were missing. Therefore, we manually drew the Qinghai–Tibet Railway and two unnamed roads around the study area based on the remote sensing images (combined with Sentinel 2 MSI and Landsat ETM+ and OLI). The specific data introduction and GEE platform function call notation are listed in Table 1.
TABLE 1. Data used in this study.
3.2 Methods
3.2.1 Surface Water Extraction
Water index and machine learning are two common methods of quickly extracting surface water. Based on the spectral curve characteristics of water bodies, a variety of water body indexes have been used to extract lake water bodies, such as the Normalized Difference Water Index (NDWI) (Mcfeeters, 1996), Modified Normalized Difference Water Index (MNDWI) (Xu, 2005), Enhanced Water Index (EWI) (Yan et al., 2007), New Water Index (NWI) (Ding, 2009), and Automated Water Extraction Index (AWEI) (Feyisa et al., 2014). The machine learning method to extract water bodies can be mainly divided into the unsupervised classification method (Macqueen, 1967) and the supervised classification method (Platt, 1998; Platt, 1998; Ronneberger et al., 2015; Abeywickrama and Cheema, 2017). Based on the GEE cloud platform, we selected NDWI, MNDWI, and support vector machines (SVMs) to extract the water body of Tuosu Lake on the same remote sensing images. It is worth mentioning that the rivers are also extracted as water bodies in several methods compared. We used the “connectedPixelCount” function provided by GEE to count the adjacent pixels of the target pixel online and took 15 as the threshold to remove the rivers and wetlands in the state of debris. For relatively complete rivers, we deleted them locally
The NDWI takes advantage of the strong absorption of water in the near-infrared band and the strong reflection characteristics in the blue-green band to extract the water body. The specific principle is shown in Formula 1. Like NDWI, the MNDWI mainly uses the strong absorption characteristics of water in mid-infrared to extract water, as shown in Formula 2.
where ρGreen denotes the reflectance of the green band, and ρNIR denotes the reflectance of the near infrared band.
where ρGreen is the reflectance of the green band, and ρMIR is the reflectance of the mid-infrared band.
The SVM is a very classical kernel method. Its main idea is to realize the separability of linear inseparable problems by mapping from low dimensions to high dimensions. Here, we conducted random sampling in the lake area by fixing the “seed” parameter of random sampling. The sample size is 15 by 20 pixels, and the spatial resolution is 30 m. The distance from the hyperplane to the sample point is shown in Formula 3.
where r is the distance from the sample point to the hyperplane, and ||w|| is the length of the vector w; x is the coordinate of the support vector sample point.
3.2.2 Threshold Determination
In NDWI and MNDWI methods, the appropriate threshold is usually dependent on artificial experiments, which are time-consuming and laborious. Therefore, the water body segmentation method proposed by Otsu (1979) is carried out based on GEE in this study. Otsu’s method divides the water area and another region in the image into background and foreground according to the gray characteristics of the image. Its main principle is that variance is a measure of gray distribution uniformity. The greater the inter-class variance between background and foreground, the greater is the difference between the two parts of the image; the expression of interclass variance is shown in Eq. 4. When part of the foreground is misclassified as background or part of the background is wrongly divided into the foreground, the difference between the two parts will become smaller. Therefore, the segmentation that maximizes the variance between classes means the minimum misclassification probability.
where σ is the variance between classes, w0 is the proportion of target pixel in the total image, and u0 is the average gray value; w1 is the proportion of background points in the image, and u1 is the average gray value.
3.2.3 Accuracy Evaluation
In order to evaluate the three surface water extraction methods mentioned earlier, the Intersection over Union (IoU) proposed by Rahman and Wang (2016) was selected as the accuracy evaluation, and the program running time (t) was used as the time evaluation. The IoU is a very common method for accuracy evaluation of the classification results in segmentation and classification tasks. It is obtained by calculating the intersection of the ground truth and the predicted result divided by the union of the ground truth and the predicted result. The formula is shown as follows:
where Pred represents the water body value extracted according to different methods, and True represents the true value of the water body from artificial visual interpretation.
In this study, the water area of Tuosu Lake was interpreted manually based on a Sentinel-2 MSI image. Taking the artificially interpreted lake boundary as the true value, the IoU was calculated with the results extracted by different surface water extraction methods, and the final IoU value is used as the measurement standard of the results obtained by different surface water extraction methods.
4 Results
4.1 Accuracy of the Surface Water Extraction Model
Based on the GEE cloud-based platform, three methods including NDWI, MNDWI, and SVM were applied to extract the water area of Tuosu Lake. To evaluate advantages in accuracy and efficiency, we calculated the IoU value of each method for the prediction result and the total time in extracting the water body of Tuosu Lake for the same image. Otsu’s algorithm was used to automatically calculate the optimal threshold for the single-band water index results. According to the distribution characteristics of the histogram, the optimal solution for a water body is obtained when the pixel value of NDWI and MNDWI is greater than 0.15 ± 0.03. The comparison of the results extracted by three methods has been visualized in Figure 2 (during the mapping process, the part identified as a water body outside the lake area was manually deleted for the sake of aesthetics), in which SVM makes the internal comparison by selecting three different sample numbers. When the thresholds are at the optimal threshold, there is little difference between NDWI and MNDWI in the extraction of water areas. However, MNDWI is more sensitive to wetlands and vegetation coverage areas, which leads to the misidentification of many non-water pixels outside Tuosu Lake as water bodies and low accuracy. The effect of extracting water bodies by NDWI is obviously the best among several experimental methods. Although some wetlands and vegetation were recognized as water bodies as well, the number of misclassified pixels is significantly less than MNDWI. The accuracy of SVM is greatly affected by the quality and quantity of training samples. When the number of training samples of SVM is 15, the visualized classification result is significantly worse than that of the water index method. With the increase in the number of training samples, the classification effect is getting better and better. When the number of training samples reaches 50, the extraction effect of SVM on the water body of Tuosu Lake is almost the same as that of the water index method.
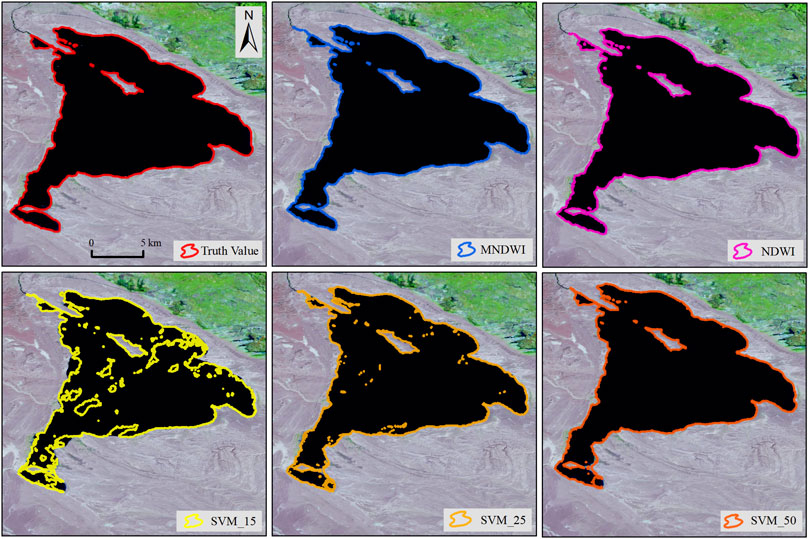
FIGURE 2. Comparison of surface water extraction results by NDWI, MNDWI, and SVM. The base map is the Sentinel-2 MSI image acquired on 26 August 2021.
The statistical results of the IoU value and time t are shown in Table 2. The calculation methods of NDWI (5.5 s) and MNDWI (5.7 s) are almost the same, so the difference in running time is not significant, both within 10 s. The calculation time of SVM is longer than that of the water index method, and with the increase in the amount of training data, the time that the program needs training data also increased, and the training sample is shown in Figure 3. When the number of training samples is 50, the running time of the program is around 18.1 s. In terms of accuracy, the maximum IoU value of NDWI is 0.97, followed by SVM (0.87–0.96) and MNDWI (0.87). The IoU value of SVM increases with the increase in the number of training samples. When the number of samples is 50, the IoU of SVM reaches about 0.96. According to the changing trend of the IoU value of experimental results and the algorithm principle of SVM, when the quality and quantity of samples are improved again, the IoU value of SVM will be greater than that of NDWI, but it also means the increase in operation time. Therefore, NDWI is selected as the method of surface water extraction, according to the two evaluation criteria of comprehensive accuracy and efficiency. Figure 4 shows the boundary of Tuosu Lake over the years extracted by the NDWI method based on the GEE cloud-based platform.

TABLE 2. IoU value and running time of the Tuosu Lake water body extracted by different models.
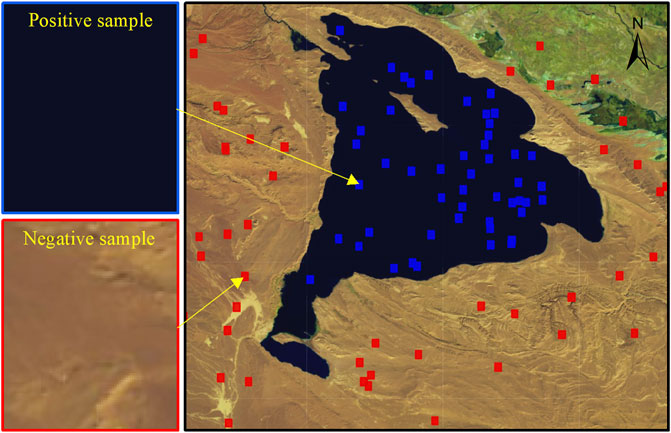
FIGURE 3. Schematic diagram of SMV training sample selection.
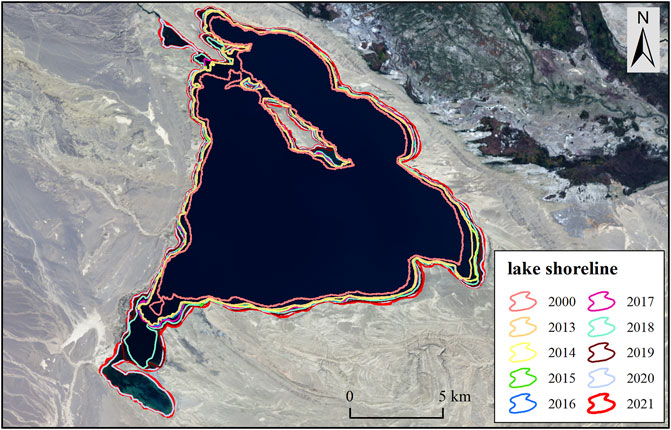
FIGURE 4. GEE platform-based extraction of the boundaries of Tuosu Lake. The base map is the Landsat OLI image (RGB) acquired in 20 September 2021.
4.2 Lake Area Change
From 2000 to 2021, Tuosu Lake showed a significant trend of expansion. The total area increased by nearly 46 km2 in the past 22 years, which is about 34% of the water coverage area of Tuosu Lake in 2000. Due to the influence of cloud cover, our experiment on the monthly area change of Tuosu Lake did not go well. Although the specific area value of the lake cannot be calculated in some months, it can be seen from the statistical results of 2015–2020 (Figure 5) that the maximum area value of the lake usually appears from October to December. Therefore, we selected the image data within this period to extract the maximum area value of the lake every year. The specific change trend of lakes over the years is shown in Figure 6 in which the minimum area in 2000 was 136 km2 and the maximum area in 2021 was 181.78 km2. From 2000 to 2013, the lake area increased by 15.66 km2 in total, with an average annual expansion of 1.11 km2/a, i.e., a slow growth period. The average annual expansion rate in 2014–2016 was less than 1 km2/a, and the lake was in a stable period. From 2017 to 2021, Tuosu Lake showed an obvious expansion trend. In recent four years, the area increased by more than 25 km2, which was 5.4 times that of the previous four years (2013–2017). During this period, the average annual growth rate of the lake area was more than 2 km2/a, and the lake was in a period of rapid expansion.
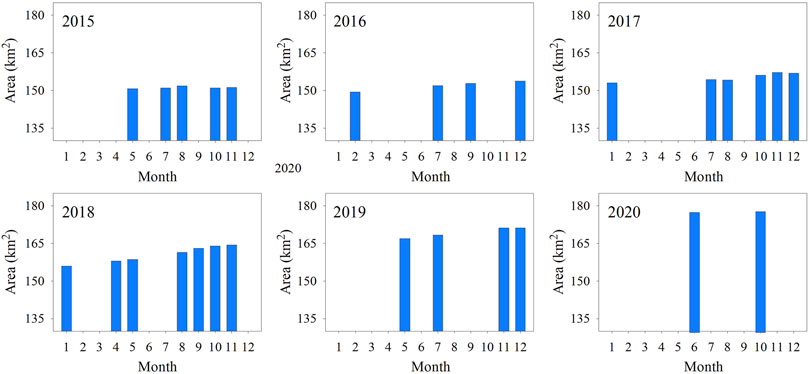
FIGURE 5. Bar plots of monthly area variation of Tuosu Lake.
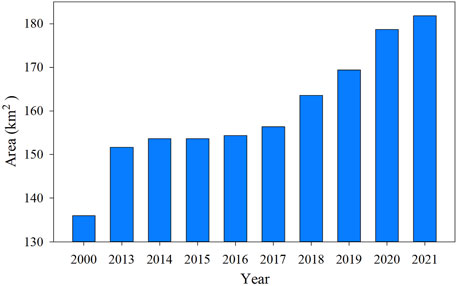
FIGURE 6. Annual area variation of Tuosu Lake in 2000–2021.
Affected by the topography, the expansion of Tuosu Lake is heterogeneous in all directions. Figure 7A demonstrates the water boundary of Tuosu Lake at 10 different moments from 2000 to 2021. The experimental results showed that the water area of Tuosu Lake mainly extends to the northwest, southwest, and east, especially in the northwest and southwest. To highlight the visuality of lake expansion, we zoomed in on the rectangular box area in Figure 7A at two different moments. Figures 7B–E show the remote sensing images of the local area of Tuosu Lake collected by Landsat ETM+ and Landsat OLI in August 2000 and 2021, respectively. As shown in Figures 7B,C, the expansion of Tuosu Lake has inundated a large land area in the northwestern part. Under the influence of topographic conditions, two individual islands higher than the lake surface have been formed in the center of the lake. With the continuous expansion of Tuosu Lake, the area of the islands in the middle of the lake is shrinking year by year, and the northwest island has been almost submerged by the lake. As shown in Figures 7D,E, the expansion toward the southwest of the lake is very intense. Many low-lying depressions were swallowed by the lake water and became a part of Tuosu Lake.
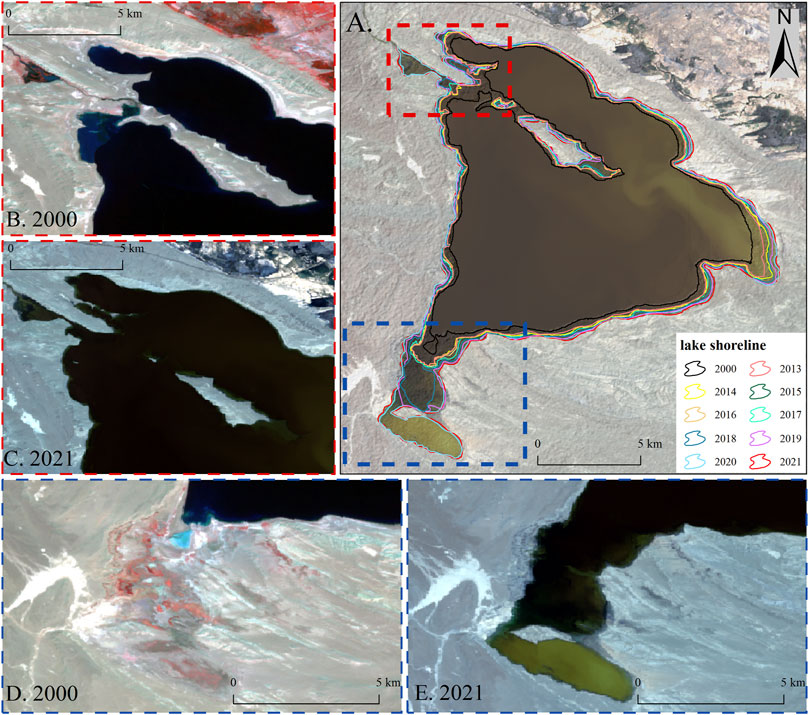
FIGURE 7. Comparison of area changes of Tuosu Lake. (A) Scene of the whole lake. (B) and (D) show the local scene of Tuosu Lake in 2000. (C) and (E) show the local scene of Tuosu Lake in 2021. The base map of (A) and (C)–(E) is the Landsat OLI image (RGB); (B) is the Landsat ETM+ image (RGB).
4.3 Influence of Tuosu Lake Expansion on Traffic
There is a road along the north of Tuosu Lake, with a length of about 24 km. Although the expansion speed in the north of the lake is slow, it still poses a serious threat to this road. The experimental results show that there was no road being submerged in 2000, but due to the continued expansion of the lake in recent years, the part of the road more than 19 km had been submerged by the lake water by August 2021. As shown in Figures 8, 9, from 2000 to 2016, the road was less affected by the expansion and erosion of the lake, and just 1.52 km of the road was submerged in the past 16 years. From 2016 to 2020, the length of roads affected by lake expansion increased significantly. In particular, from 2018 to 2019, 8.44 km of roads around the lake were swallowed and blocked by lake water in a year, accounting for about 35% of the total length. It can be inferred that the lake expanded near the subgrade in 2016, so a large part of the road will be impacted and inundated by the lake every year with the increase in lake water coverage.
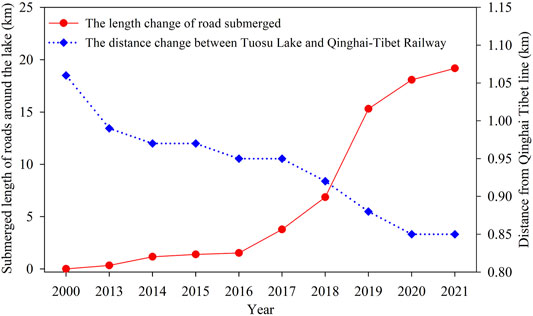
FIGURE 8. Length change of the road submerged and the distance change between Tuosu Lake and the Qinghai–Tibet Railway.
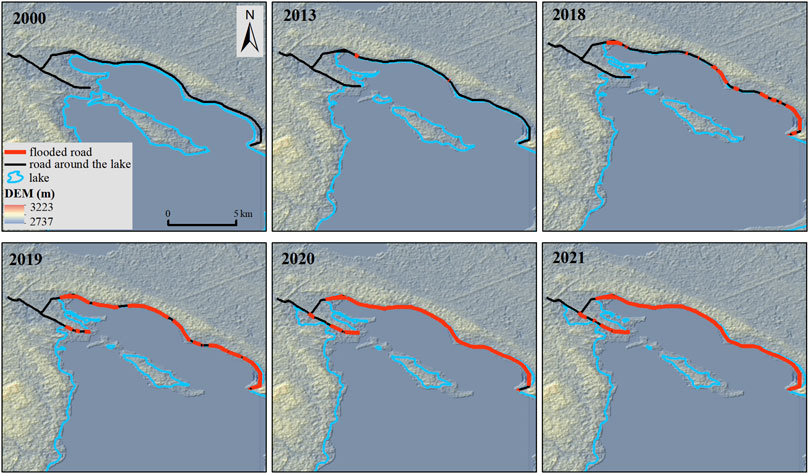
FIGURE 9. Road inundation in 2000, 2013, 2018, 2019, 2020, and 2021.
The expansion of Tuosu Lake not only inundates the road around the lake but also poses a serious threat to the Qinghai-Tibet Railway. As shown in Figure 8, the shortest distance between Tuosu Lake and the Qinghai–Tibet Railway in the north was shortened year by year. The distance between both was shortened from 1.06 km in 2000 to 0.85 km in 2021. Based on the distance between Tuosu Lake and the Qinghai–Tibet Railway, the expansion of the lake to the QinghaiTibet Railway can be divided into three stages: 2000–2013, 2013–2017, and after 2017. More than 40% of the distance shortening occurred after 2017, and the average rate of distance shortening after 2017 is twice that of 2013–2017 and four times that of 2000–2013, which means the expansion of Tuosu Lake to the Qinghai–Tibet line is accelerating.
5 Discussion
5.1 Driving Factors of the Lake Change
The expansion of the enclosed lake mainly depends on the water supply components such as lake surface precipitation, surface water runoff into the lake, and groundwater runoff into the lake, as well as the water consumption part such as lake surface evaporation (Zhang et al., 2013). There is an increasing trend in temperature and precipitation in the Qaidam basin in recent years. The temperature change range gradually decreases from west to east. The precipitation increases as a whole, but the change rate in the central and western regions is much lower than that in the eastern region (Gegen et al., 2020).
Due to the harsh environment, there are few human activities in the Tuosu Lake area, so the expansion of its water area is mainly related to natural factors. To explore the relation between climate change and area change of Tuosu Lake, we selected meteorological data including temperature, precipitation, and potential evaporation provided by ERA5 data obtained by the GEE cloud-based platform. The average annual temperature of the Qaidam Basin in 2000–2021 is about 5.06°C, the average annual precipitation is about 92.64 mm, and the average potential evaporation in the Tuosu Lake area is 643.69 mm water equivalent. The overall trend from 2000 to 2021 shows that the temperature and precipitation in the Tuosu Lake area are increasing, whereas evaporation is decreasing. Compared with the change in the lake area mentioned in the previous section, it can be inferred that the change in the lake area is positively related to temperature and precipitation and negatively related to evaporation. However, there is no glacier in the Tuosu Lake basin, so the temperature affecting the melting of glaciers and snow can be excluded. In the band “potential evaporation” provided by ERA5 data, negative values represent evaporation, and positive values represent condensation. It can be seen from Figure 10 that the change in precipitation and evaporation from 2013 to 2016 is relatively gentle, so the change in the lake area is also relatively moderate; from 2016 to 2018, precipitation increased, evaporation decreased, and the lake experienced a rapid expansion period. After 2018, both precipitation and evaporation fluctuate, and their joint action makes the lake continue to expand. Undoubtedly, a combination of the increased precipitation and the decreasing evaporation led to the expansion of Tuosu Lake.
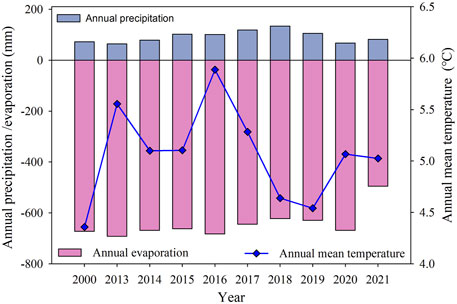
FIGURE 10. Change in temperature, precipitation, and evaporation from 2000 to 2021.
5.2 Lake Expansion Control Measures
During 2000–2021, the area of Tuosu Lake expands by nearly 46 km2. From a dialectical point of view, the impact of the expansion of Tuosu Lake has two sides. The Qaidam Basin has high evaporation, low precipitation, and an arid climate. Water is the most precious natural resource for ecological protection and regional sustainable development in this area. The expansion of Tuosu Lake can improve the surrounding arid environment, increase the humidity of the air, and enhance the self-healing ability of the ecological environment. Meanwhile, the pumping from Keluke Lake, a freshwater lake upstream of Tuosu Lake, not only decelerates the expansion of the latter but also supplies agricultural irrigation and residential water in the surrounding area.
Currently, the main potential hazard of the expansion of Tuosu Lake is the threat to the road along the north bank and the Qinghai–Tibet Railway in the northwestern part. The former was partly destroyed and will be easily submerged with the rise in the water level. If the road is reconstructed, the filling of high subgrade or the overall diversion to the higher altitude on the north side should be adopted, which will spend a huge cost. The other alternative is to strengthen the mending and the maintenance of roads from the eastern Tuosu Lake, which will connect the famous tourist attraction, i.e., the Mar Base. One viaduct of the Qinghai–Tibet Railway passes through the low altitude area near the lake area. According to the change in Tuosu Lake, the lake expands rapidly toward the northwest direction. Therefore, the bridgehead embankment should be taken for risk avoidance. Due to the importance of the Qinghai–Tibet Railway, the intensive monitoring of Tuosu Lake will need to strengthen in the future.
6 Conclusion
This study mainly monitors the area change of Tuosu Lake based on the GEE remote sensing big data platform. The conclusions are as follows: 1) compared with the three surface water extraction methods of NDWI, MNDWI, and SVM, and combined with the prediction accuracy and operation efficiency of the model, it is concluded that the NDWI method is more suitable for extracting the water body of Tuosu Lake. 2) During 2000–2021, the area of Tuosu Lake increased by about 45.79 km2, which can be roughly divided into a slow growth period (2000–2013, 1.20 km2/a), a stable period (2013–2016, 0.49 km2/a), a slow expansion period (2016–2017, 1.97 km2/a), and a rapid expansion period (2017–2021, 7.43 km2/a). In particular, in 2019–2020, the lake area increased sharply by 9.22 km2. The change in the Lake area is positively correlated with temperature and precipitation and negatively correlated with evaporation. 3) The expansion of Tuosu Lake has affected the surrounding traffic lines. In 2021, the road around the lake has been submerged for 19.17 km, and the water body is only 0.85 km away from the Qinghai Tibet line. Therefore, we suggested that the relevant departments should strengthen the monitoring of Tuosu Lake and adopt some measures including controlling the upper stream water supply and digging out the water outlet to mitigate its expansion.
Data Availability Statement
The original contributions presented in the study are included in the article/supplementary material; further inquiries can be directed to the corresponding author.
Author Contributions
XY and TS designed this research. XY improved the manuscript. TS wrote the manuscript. YW and TS conducted mapping. TS and ZT carried out data processing and analysis.
Funding
The study was supported by the National Natural Science Foundation of China (Nos. 41861013, 42071089, and 42161027), the National Key Research and Development Program of China (No. 2019YFE0127700), the Open Research Foundation of National Cryosphere Desert Data Center (No. 20D02), and The Northwest Normal University Graduate Research Grant Program (No. 2020KYZZ001157).
Conflict of Interest
The authors declare that the research was conducted in the absence of any commercial or financial relationships that could be construed as a potential conflict of interest.
Publisher’s Note
All claims expressed in this article are solely those of the authors and do not necessarily represent those of their affiliated organizations, or those of the publisher, the editors, and the reviewers. Any product that may be evaluated in this article, or claim that may be made by its manufacturer, is not guaranteed or endorsed by the publisher.
Acknowledgments
We thank Duan Hongyu and Zhang Cong for their help in writing this article. We also thank for the massive data and powerful computing power provided by the Google Earth Engine cloud platform. Finally, the authors would like to thank the previous scholars for their research results in this field, which are very enlightening for our work.
References
Abd Ellah, R. G. (2020). Physical Properties of Inland Lakes and Their Interaction with Global Warming: A Case Study of Lake Nasser, Egypt. Egypt. J. Aquatic Res. 46, 103–115. doi:10.1016/j.ejar.2020.05.004
Abeywickrama, T., and Cheema, M. A. (2017). Efficient Landmark-Based Candidate Generation for Knn Queries on Road Networks. DASFAA 2017, Part II, LNCS 10178, 425–440. doi:10.1007/978-3-319-55699-4_26
Bajracharya, S. R., Mool, P. K., and Shrestha, B. R. (2007). Impact of Climate Change on Himalayan Galciers and Glacial Lakes:Case Studies on Glof and Associated Hazards in Nepal and Bhutan. Kathmandu, Nepal: International Centre for Integrated Mountain Development.
Chen, Y., Xu, C., Chen, Y., Li, W., and Liu, J. (2010). Response of Glacial-Lake Outburst Floods to Climate Change in the Yarkant River Basin on Northern Slope of Karakoram Mountains, China. Quat. Int. 226, 75–81. doi:10.1016/j.quaint.2010.01.003
Ding, F. (2009). A New Method for Fast Information Extraction of Water Bodies Using Remotely Sensed Data. Remote Sens. Technol. Appl. 24, 167–171. doi:10.11873/j.issn.1004-0323.2009.2.167
Feyisa, G. L., Meilby, H., Fensholt, R., and Proud, S. R. (2014). Automated Water Extraction Index: A New Technique for Surface Water Mapping Using Landsat Imagery. Remote Sens. Environ. 140, 23–35. doi:10.1016/j.rse.2013.08.029
Fu, X., Zhang, J. W., Wang, L., Cui, X. L., Ma, X. Y., and Zhang, Y. Z. (2016). Recent Human Impacts on Sedimentary Record: A Case from Lake Toson. Quat. Sci. 36, 1456–1465. doi:10.11928/j.issn.1001-7410.2016.06.11
Gegen, B. T., Wei, W., Zhang, X., Yang, X. H., and Shi, Z. J. (2020). Spatiotemporal Trends and Periodic Features of Climate Extremes over the Qaidam Basin, China,During 1960-2014. Arid Zone Res. 37, 304–313. doi:10.13866/j.azr.2020.02.04
Hewitt, K., and Liu, J. (2010). Ice-Dammed Lakes and Outburst Floods, Karakoram Himalaya: Historical Perspectives on Emerging Threats. Phys. Geogr. 31, 528–551. doi:10.2747/0272-3646.31.6.528
ICIMOD (2011). Glacial Lakes and Glacial Lake Outburst Floods in Nepal. Kathmandu, Nepa: International Centre for Integrated Mountain Development.
Jain, S. K., Lohani, A. K., and Singh, R. D. (2015a). Identification of Glacial Lake and the Potentially Dangerous Glacial Lake in the Himalayan Basin. Dyn. Clim. Change Water Resour. Northwest. Himalaya, 35–44. doi:10.1007/978-3-319-13743-8_4
Jain, S. K., Sinha, R. K., Chaudhary, A., and Shukla, S. (2015b). Expansion of a Glacial Lake, Tsho Chubda, Chamkhar Chu Basin, Hindukush Himalaya, Bhutan. Nat. Hazards 75, 1451–1464. doi:10.1007/s11069-014-1377-z
Jiang, L., Nielsen, K., Andersen, O. B., and Bauer-Gottwein, P. (2017). Monitoring Recent Lake Level Variations on the Tibetan Plateau Using Cryosat-2 Sarin Mode Data. J. Hydrology 544, 109–124. doi:10.1016/j.jhydrol.2016.11.024
Landmann, T., Schramm, M., Colditz, R. R., Dietz, A., and Dech, S. (2010). Wide Area Wetland Mapping in Semi-arid Africa Using 250-Meter Modis Metrics and Topographic Variables. Remote Sens. 2, 1751–1766. doi:10.3390/rs2071751
Lei, Y., Yang, K., Wang, B., Sheng, Y., Bird, B. W., Zhang, G., et al. (2014). Response of Inland Lake Dynamics over the Tibetan Plateau to Climate Change. Clim. Change 125, 281–290. doi:10.1007/s10584-014-1175-3
Li, B., Zhang, J., Yu, Z., Liang, Z., Chen, L., and Acharya, K. (2017). Climate Change Driven Water Budget Dynamics of a Tibetan Inland Lake. Glob. Planet. Change 150, 70–80. doi:10.1016/j.gloplacha.2017.02.003
Li, H., Luo, Z., Xu, Y., Zhu, S., Chen, X., Geng, X., et al. (2021). A Remote Sensing-Based Area Dataset for Approximately 40 Years that Reveals the Hydrological Asynchrony of Lake Chad Based on Google Earth Engine. J. Hydrology 603, 126934. doi:10.1016/j.jhydrol.2021.126934
Liao, C. B., and Liu, X. H. (2008). An Effectiveness Comparison between Water Body Indices Based on Modis Data. Remote Sens. Land and Resour. 20 (4), 22–26. in Chinese, with English Abstract. doi:10.3724/SP.J.1047.2008.00128
Liao, W. X., Chen, Y. Y., Zhao, X., and Wen, X. C. (2021). Analysis of Lake and Lake Shoreline Evolution in Hubei Province in Recent 30 Years Based on Google Earth Engine. Hubei Agric. Sci. 60, 46–54+59. in Chinese, with English Abstract. doi:10.14088/j.cnki.issn0439-8114.2021.10.009
Liu, C. Z., Shi, J. C., Gao, S., and Chen, L. (2010). The Study on Extracting of Water Body from Modis Image Using an Improved Linear Mixture Model. Remote Sens. Inf. 0, 84–88. in Chinese, with English Abstract. doi:10.3969/j.issn.1000-3177.2010.01.017
Liu, X., Hu, G., Chen, Y., Li, X., Xu, X., Li, S., et al. (2018). High-Resolution Multi-Temporal Mapping of Global Urban Land Using Landsat Images Based on the Google Earth Engine Platform. Remote Sens. Environ. 209, 227–239. doi:10.1016/j.rse.2018.02.055
Long, Q. F., Feng, X. Y., Liu, J., Zhang, G. X., Shen, G. P., and Zhu, D. R. (2017). Microbial Diversity of Keluke-Tuosu Lake Wetland Reserve in Qinghai-Tibet Plateau. Earth Environ. 45, 399–407. in Chinese, with English Abstract. doi:10.14050/j.cnki.1672-9250.2017.04.003
Lv, L. (2019). Study on Changes of Lake Areas since 2000 and its Response to the Climatic Factors in Tibetan Plateau. A Thesis Submitted for the Degree of Master. Chengdu, China: Chengdu University of Technology.
Macqueen, J. B. (1967). Some Methods for Classification and Analysis of Multivariate Observations. Proc. Fifth Berkeley Sympos. Math. Statist. Probab. 1, 281–297.
Mateo-García, G., Gómez-Chova, L., Amorós-López, J., Muñoz-Marí, J., and Camps-Valls, G. (2018). Multitemporal Cloud Masking in the Google Earth Engine. Remote Sens. 10, 1079. doi:10.3390/rs10071079
Mcfeeters, S. K. (1996). The Use of the Normalized Difference Water Index (Ndwi) in the Delineation of Open Water Features. Int. J. Remote Sens. 17, 1425–1432. doi:10.1080/01431169608948714
Osti, R., and Egashira, S. (2009). Hydrodynamic Characteristics of the Tam Pokhari Glacial Lake Outburst Flood in the Mt. Everest Region, Nepal. Hydrol. Process. 23, 2943–2955. doi:10.1002/hyp.7405
Otsu, N. (1979). A Threshold Selection Method from Gray-Level Histograms. IEEE Trans. Syst. Man. Cybern. 9, 62–66. doi:10.1109/TSMC.1979.4310076
Peng, Y. F., Li, Z. Q., Yao, X. J., Mou, J. X., Han, W. X., and Wang, P. P. (2021). Area Change and Cause Analysis of Bosten Lake Based on Multi-Source Remote Sensing Data and Gee Platform. J. Geo-information Sci. 23, 1131–1153. in Chinese, with English Abstract. doi:10.12082/dqxxkx.2021.200361
Platt, J. C. (1998). Sequential Minimal Optimization: A Fast Algorithm for Training Support Vector Machines. Pasadena: Microsoft Research.
Pritchard, H. D. (2019). Asia's Shrinking Glaciers Protect Large Populations from Drought Stress. Nature 569, 649–654. doi:10.1038/s41586-019-1240-1
Rahman, M. A., and Wang, Y. (2016). “Optimizing Intersection-Over-Union in Deep Neural Networks for Image Segmentation,” in Advances in Visual Computing. ISVC 2016. Lecture Notes in Computer Science. Editor G. Bebis, 234–244. doi:10.1007/978-3-319-50835-1_22
Ronneberger, O., Fischer, P., and Brox, T. (2015). “U-net: Convolutional Networks for Biomedical Image Segmentation,” in Lecture Notes in Computer Science (Including Subseries Lecture Notes in Artificial Intelligence and Lecture Notes in Bioinformatics), 9351, 234–241. doi:10.1007/978-3-319-24574-4_28
Shao, Z., Meng, X., Zhu, D., Zheng, D., Qiao, Z., Yang, C., et al. (2008). Characteristics of the Change of Major Lakes on the Qinghai-Tibet Plateau in the Last 25 Years. Front. Earth Sci. China 2, 364–377. doi:10.1007/s11707-008-0038-5
Siyang, D., Xue, X., Xian, X., Quangang, Y., and Fei, P. (2014). Remote Sensing Monitoring of the Lake Area Changes in the Qinghai-Tibet Plateau in Recent 40 Years. J. Lake Sci. 26, 535–544. in Chinese, with English Abstract. doi:10.18307/2014.0407
Tsai, Y., Stow, D., Chen, H., Lewison, R., An, L., and Shi, L. (2018). Mapping Vegetation and Land Use Types in Fanjingshan National Nature Reserve Using Google Earth Engine. Remote Sens. 10, 927. doi:10.3390/rs10060927
Wang, X., Gong, P., Zhao, Y., Xu, Y., Cheng, X., Niu, Z., et al. (2013). Water-Level Changes in China's Large Lakes Determined from Icesat/Glas Data. Remote Sens. Environ. 132, 131–144. doi:10.1016/j.rse.2013.01.005
Wang, X., Guo, X., Yang, C., Liu, Q., Wei, J., Zhang, Y., et al. (2020). Glacial Lake Inventory of High-Mountain Asia in 1990 and 2018 Derived from Landsat Images. Earth Syst. Sci. Data 12, 2169–2182. doi:10.5194/essd-12-2169-2020
Watanbe, T., and Rothacher, D. (1996). The 1994 Lugge Tsho Glacial Lake Outburst Flood, Bhutan Himalaya. Mt. Res. Dev. 16, 77–81. doi:10.2307/3673897
Williamson, C. E., Saros, J. E., Vincent, W. F., and Smol, J. P. (2009). Lakes and Reservoirs as Sentinels, Integrators, and Regulators of Climate Change. Limnol. Oceanogr. 54, 2273–2282. doi:10.4319/lo.2009.54.6_part_2.2273
Xu, H. Q. (2005). A Study on Information Extraction of Water Body with the Modified Normalized Difference Water Index (Mndwi). J. Remote Sens., 9(5), 589–595.
Yan, P., Zhang, Y. J., and Zhang, Y. (2007). A Study on Information Extraction of Water System in Semi-arid Regions with the Enhanced Water Index (Ewi) and Gis Based Noise Remove Techniques. Remote Sens. Inf. 6, 62–67. in Chinese, with English Abstract. doi:10.3969/j.issn.1000-3177.2007.06.015
Yan, Y. C., Xiao, R. X., Xiao, J. S., Liu, B. K., Li, F., Fu, Y., et al. (2012). Remote Sensing Monitoring and Driving Factor Analysis on Land Use and Land Cover Changes of Bayin River Basin in Qinghai Province. J. Desert Res. 32, 276–283.
Yan, L. J., Zheng, M. P., and Wei, L. J. (2016). Change of the Lakes in Tibetan Plateau and its Response to Climate in the Past Forty Years. Earth Sci. Front. 23, 310–323. [in Chinese, with English Abstract]. doi:10.13745/j.esf.2016.04.027
Zhang, G. Q., Xie, H. J., YAO, T. D., and kANG, S. C. (2013). Water Balance Estimates of Ten Greatest Lakes in China Using Icesat and Landsat Data. Chin. Sci. Bull. 58, 2664–2678. doi:10.1360/csb2013-58-26-2664
Zhang, N., Wu, L. J., Liu, S. T., Dou, H. S., and Li, J. (2015). The Characteristics of Climate Change and its Influence on Water Area of Hulun Lake. J. Hydrol. 29, 192–197. doi:10.13448/j.cnki.jalre.2015.245
Zhao, Y., Yu, Z., Liu, X., Zhao, C., Chen, F., and Zhang, K. (2010). Late Holocene Vegetation and Climate Oscillations in the Qaidam Basin of the Northeastern Tibetan Plateau. Quat. Res. 73, 59–69. doi:10.1016/j.yqres.2008.11.007
Zhou, Z. L. (2017). Study On Remote Sensing Retrieval Of Honghu Lake in Recent Ten Years Based On Gee. A Thesis Submitted for the Degree of Master. China: Hubei University Wuhan.
Zhu, L. P., Zhang, G. Q., Yang, R. M., Liu, C., Yang, K., Qiao, B. J., et al. (2019). Lake Variations on Tibetan Plateau of Recent 40 Years and Future Changing Tendency. Bull. Chin. Acad. Sci. 34, 1254–1263. in Chinese, with English Abstract. doi:10.16418/j.issn.1000-3045.2019.11.008
Zongyan, D., Zhang, J. W., Jiawu, Z., Panpan, Y., Shan, Z., and Yuzhi, Z. (2020). Comparison of Sediment Proxies of Cores and Their Environmental Significance at Different Locations of Lake Toson in Qaidam Basin. J. Lake Sci. 32, 259–270. in Chinese, with English Abstract. doi:10.18307/2020.0124
Zurqani, H. A., Post, C. J., Mikhailova, E. A., Schlautman, M. A., and Sharp, J. L. (2018). Geospatial Analysis of Land Use Change in the Savannah River Basin Using Google Earth Engine. Int. J. Appl. Earth Observation Geoinformation 69, 175–185. doi:10.1016/j.jag.2017.12.006
Sun, M. P., Liu, S. Y., Yao, X. J., and Li, L. (2014). The Cause and Potential Hazard of Glacial Lake Outburst Flood Occurred on July 5, 2013 in Jiali County, Tibet. J. Glaciol. Geocryol. 36, 158–165. doi:10.7522/j.issn.1000-0240.2014.0020
Tan, M. P. (2014). Water System, Surface Water Resources and Their Characteristics in Qaidam Basin. Water Conservancy Science and Technology and Economy 20, 51–54. [in Chinese, with English Abstract]. doi:10.3969/j.issn.1006-7175.2014.04.019
Yao, X. J., Liu, S. Y., Sun, M. P., and Zhang, X. J. (2014). Study on the Glacial Lake Outburst Flood Events in Tibet since the 20th Century. J. Nat. Resour. 29, 1377–1390. doi:10.11849/zrzyxb.2014.08.010
Keywords: lake change, remote sensing, GEE, Tuosu Lake, Qinghai–Tibet Plateau
Citation: Sha T, Yao X, Wang Y and Tian Z (2022) A Quick Detection of Lake Area Changes and Hazard Assessment in the Qinghai–Tibet Plateau Based on GEE: A Case Study of Tuosu Lake. Front. Earth Sci. 10:934033. doi: 10.3389/feart.2022.934033
Received: 02 May 2022; Accepted: 26 May 2022;
Published: 07 July 2022.
Edited by:
Baojuan Huai, Shandong Normal University, ChinaReviewed by:
Xin Wang, Hunan University of Science and Technology, ChinaDonghui Shangguan, Northwest Institute of Eco-Environment and Resources (CAS), China
Copyright © 2022 Sha, Yao, Wang and Tian. This is an open-access article distributed under the terms of the Creative Commons Attribution License (CC BY). The use, distribution or reproduction in other forums is permitted, provided the original author(s) and the copyright owner(s) are credited and that the original publication in this journal is cited, in accordance with accepted academic practice. No use, distribution or reproduction is permitted which does not comply with these terms.
*Correspondence: Xiaojun Yao, eWFveGpfbndudUAxNjMuY29t