 Chun-Xin Wang
 Xiaolei Zhang3
 Youjin Wu
 Chang Huang
 Anchuan Fan
- 1USTC Archaeometry Laboratory, University of Science and Technology of China, Hefei, China
- 2Department for the History of Science and Scientific Archaeology, University of Science and Technology of China, Hefei, China
- 3Anhui Provincial Institute of Cultural Relics and Archaeology, Hefei, China
- 4Department of Earth Sciences, The University of Hong Kong, Hong Kong, China
This study utilizes OSL-SAR, TL-SAR, and TL-MAAD methods to date heated quartz extracted from burnt clay and pottery samples from the Lingjiatan archaeological site, China. The OSL components of the heated quartz were determined by deconvoluting the CW-OSL curve, and the Fast Ratio value was used to distinguish whether the initial OSL signal was dominated by the fast component. The results show two types of quartz OSL characteristics in the initial signals: Type I is dominated by the fast component (Fast Ratio values > 10), while Type II is dominated by the medium and slow components (Fast Ratio values < 10). Type I samples show bright OSL signals, and a preheat plateau appears from a relatively low temperature. The recuperation is negligible, and reliable equivalent doses can be obtained using the conventional OSL-SAR measurement conditions. In contrast, the OSL signal of Type II samples is relatively dim, and the preheat plateau appears from a much higher temperature than in Type I samples. The recuperation of Type II samples increases significantly at higher preheat temperatures. Significant De underestimation of Type II samples was observed at lower preheat temperatures. It is noted that the thermal transfer effect can be attenuated by increasing the OSL stimulation temperature. Therefore, a modified OSL-SAR measurement condition, with higher preheat, cut-heat and stimulation temperatures, was used to date Type II samples. The OSL-SAR ages of most of these two types of samples agree well with the independent 14C ages, demonstrating that OSL-SAR can be used to date heated archaeological materials at high firing temperatures (∼900°C). The Lingjiatan archaeological site was determined to be approximately 5.4–5.8 ka BP 2022.
1 Introduction
Since the 1960s, Aitken has utilized thermoluminescence (TL) dating to determine the time of the last heating event of heated archaeological materials (Aitken et al., 1964, Aitken et al., 1968). In the past 2 decades, the single aliquot regenerative dose optically stimulated luminescence (OSL-SAR) dating protocol has been proven to be a robust approach in sediment dating (Murray and Wintle, 2000; Wintle and Murray, 2006; Murray et al., 2021). Archaeologists started to apply the OSL-SAR method to date heated archaeological materials, such as pottery, brick, tile, heated lithic (flint or stone), burnt clay, kiln, metallurgical slag, etc. (Gautier, 2001; Bailiff, 2007; Liritzis et al., 2016; Richter et al., 2017; Zander et al., 2019; Sun et al., 2021; Wang et al., 2022). The OSL signal can be deconvolved into components with different decay rates (Huntley et al., 1996; Bailey et al., 1997; Bulur, 2000; Jain et al., 2003), and they have different characteristics, such as thermal stability, bleaching rate, dose saturation, and annealing temperature response (Singarayer and Bailey, 2003; Tsukamoto et al., 2003; Gong et al., 2014, 2015). The OSL-SAR method is considered reliable for quartz if the fast component dominates its initial OSL signal (e.g., within 0.8 s). In the research of geological sediments, if the initial OSL signal contains a significant thermally unstable medium or slow component, the OSL age would be underestimated (Choi et al., 2003a; Tsukamoto et al., 2003; Thomas et al., 2005; Li and Li, 2006; Steffen et al., 2009). However, some previous studies proposed that medium or slow components of the quartz OSL signal in some samples were thermally stable and did not affect the OSL age (Singarayer and Bailey, 2003; Fan et al., 2009).
Multiple studies suggested that the OSL age of heated archaeological quartz was significantly influenced by the component characteristics. For example, Fu et al. (2010) found that the initial OSL signals of burnt clay from the Qujialing archaeological site in China were all dominated by the fast component, and their OSL ages were consistent with the independent 14C ages. When Solongo et al. (2021) dated the OSL ages of two Mongolian bricks, the initial OSL of one red brick was dominated by the fast component, and the age agreed with the historical age, while the medium component of another gray brick was significant, and the dating result was underestimated. Anderson and Feathers (2019) found two types of samples with different decay rates in the OSL dating of pottery from archaeological sites in the Arctic. One type with a fast decay rate results in reasonable ages, while the other type with a slower decay rate is exceptionally overestimated. Recently, Wang et al. (2022) reported that a high annealing temperature (over 600–800°C) would decrease the OSL decay rate of quartz through pure quartz simulation heating experiments.
Until now, the component characteristics of heated archaeological quartz with two different OSL decay rates and their effects on OSL dating results remain unclear. This study focused on burnt clay and pottery shards, which are the most commonly found materials in Chinese archaeological sites. The burnt clay and pottery shards excavated from the Lingjiatan archaeological site were used as an example to investigate the component characteristics of the samples with different OSL decay rates, quantitatively described as Fast Ratio (Durcan and Duller, 2011), and to explore the effects of preheat and stimulation temperatures on recuperation and De estimates. OSL-SAR was compared with TL-SAR, TL-MAAD, and 14C dating methods to verify the accuracy of OSL-SAR in dating heated archaeological quartz with different components.
2 Archaeological context and sampling
The Lingjiatan site (31°29′ N, 118°02′ E) (Figure 1) is a large Late Neolithic archaeological site located in the East China Plain on flat terrain with an average elevation of approximately 18 m. The site belongs to Hanshan County, Maanshan City, Anhui Province. It is approximately 20 km from Chaohu Lake to the west, 35 km from the Yangtze River to the east, 5 km from Taihu Mountain to the north, and adjacent to the north bank of the middle section of the Yuxi River to the south (Anhui Provincial Institute of Cultural Relics and Archaeology, 2006). In the site, a large number of precious jades, stone tools and pottery have been unearthed. The discovery of Neolithic burials, altars and sacrificial pits within the site indicates that the Lingjiatan site is an essential part of Chinese civilization. There exists a massive region with densely distributed burnt clay at this site, covering an area of more than 3,000 m2. Likely to be the remains of large-scale public buildings such as temples or palaces, this large area of burnt clay is an important relic of the Neolithic period in China, but without an absolute age published. Therefore, this study used the luminescence dating method to determine the absolute age of these heated archaeological materials, which will provide solid chronological evidence for further research on the function of the giant prehistoric public building remains at the Lingjiatan site. The samples in this study contain seven burnt clay blocks and three pottery shards, all taken from the burnt clay layer. Burnt charcoal chips and plant remains were extracted from the burnt clay, which provides suitable material for comparing the luminescence and 14C ages.
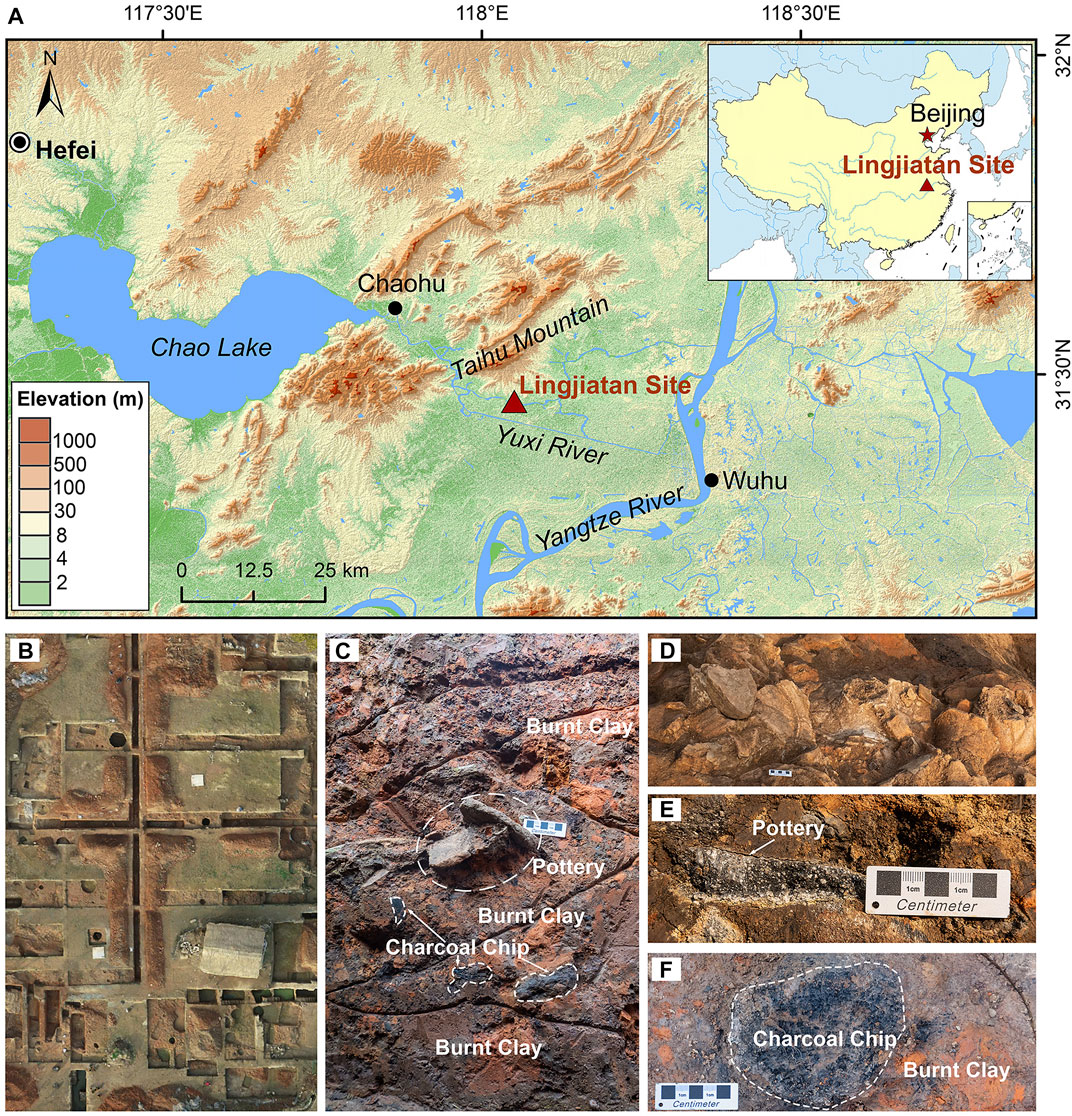
FIGURE 1. (A) The location of the Lingjiatan archaeological site. (B) Aerial view of the site excavation. (C) The picture shows the red burnt clay profile with the pottery shards collected for dating buried in the burnt clay. The black material mixed in burnt clay is burnt charcoal chips collected for radiocarbon dating. (D) The picture shows the pottery heap formed by a large number of pottery. (E) Buried pottery shard, similar to (C). (F) Large carbonized wooden building Pedestal, surrounded by burnt clay.
3 Methodology
3.1 Optically stimulated luminescence and thermoluminescence dating
For burnt clay, the pure fine-grained quartz was extracted using a fine-grained technique. The burnt clay samples were cut by a diamond saw, and approximately 2–3 g of powders were extracted from the unexposed position on the profile using a drill. The 4–11 μm grains were extracted by hydrostatic sedimentation according to Stokes’ Law and treated with 10% hydrochloric acid and 10% hydrogen peroxide for 1 h each to remove possible carbonates and organic matter, respectively. The samples were then treated with 15% fluorosilicic acid for 8 h to remove feldspar and clay minerals. Finally, the samples were treated with 10% hydrochloric acid to remove the fluoride generated by the reaction. If the prepared samples contained any IRSL signals, the last two steps of fluorosilicic acid and hydrochloric acid treatments were repeated until no IRSL signals could be detected. For pottery, a coarse-grain technique was used. The surface-exposed parts (2–3 mm) were first removed using a drill, then gently ground with an iron mortar and then sieved to separate the >63 μm fraction. The chemical treatment was similar to that of the fine grain, the only difference being that the fluorosilicic acid was replaced by 40% hydrofluoric acid with a dissolution time of 40 min. Subsequently, sodium polytungstate solutions of 2.60 and 2.70 g/cm3 were used to separate the remaining feldspar and heavy minerals. Finally, 63–90 and 150–250 μm coarse-grained quartz grains were extracted through second sieving.
The luminescence dating procedure was carried out on a Risø TL/OSL-DA-20 instrument with a90Sr/90Y β radioactive source. The stimulation light source was 470 ± 30 nm blue LEDs (Bøtter-Jensen et al., 2003a) with a maximum power of 45 mW/cm2. An EMI 9235QB photomultiplier tube equipped with a Φ = 45 mm × 7.5 mm U-340 filter was used to detect ultraviolet emission (Bøtter-Jensen et al., 1995).
As shown in Table 1, three protocols were used to obtain De. Namely, the single aliquot regenerative dose optically stimulated luminescence dating (OSL-SAR) (Murray and Wintle, 2000; Wintle and Murray, 2006), the single aliquot regenerative dose thermoluminescence dating (TL-SAR) (Bluszcz and Bøtter-Jensen, 1995; Richter and Krbetschek, 2006) and the multiple aliquots additive doses (TL-MAAD) (Aitken, 1985).
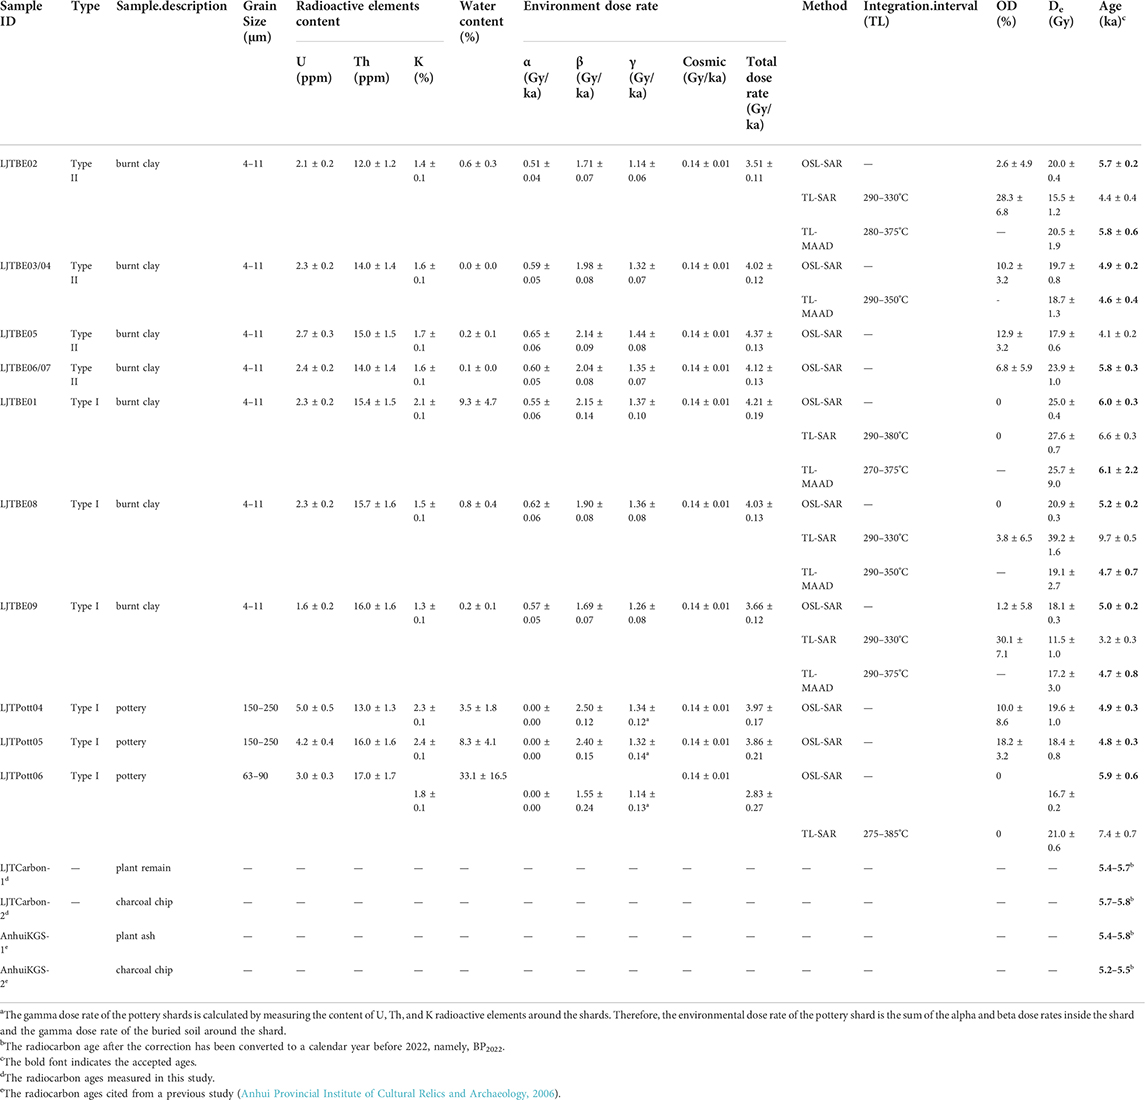
TABLE 1. Summary of sample description, radioactive element content, dose rate, OSL, TL and14C ages.
For OSL-SAR, the width of a single channel was 0.16 s, and the first 0.8 s and the last 8 s of the OSL signal were used as the integration intervals for the signal and background, respectively. The dose response curves were fitted with exponential or linear functions, and each aliquot was subjected to a series of rejection criteria., i.e., a recycling ratio of 0.9–1.1, Tn is more than three sigma above the background, the relative standard error of Tn is below 10% and the recuperation is within ±5%. The relationship among preheat temperature, stimulation temperature and De estimation was investigated, which was used to determine the optimal measurement conditions. A dose recovery test was used to characterize the effectiveness of the method.
During the application of the TL-SAR method, TL signals were recorded from room temperature to a maximum of 450°C. Both the De plateau test (relationship between De and integration temperature) and the heated plateau test (ratio of the first regenerated dose signal to the natural dose signal, i.e., R1/N) were performed (Richter et al., 2014). The temperature range in which appear both plateaus simultaneo usly was considered as the TL integration interval.
For TL-MAAD, the TL signals of N (natural), N+β and N+2β are used to build the dose response curve (DRC), and each step contains three aliquots. Similar to TL-SAR, the De plateau and heating plateau (the ratio of N to N+β) are used to determine the TL integration interval. The De before correction (Q) can be obtained by intercepting the DRC with the y-axis. In the supra-linearity test, a series of aliquots were hot bleached at 450°C and given small incremental regenerative doses to establish the DRC used to obtain the initial correction value (I). The corrected palaeodose P equals Q + I (Aitken, 1985; Zander et al., 2019). Supplementary Table S1 in the Supplementary Material shows the details.
3.2 Data analysis using R
3.2.1 CW-OSL fitting
The OSL signals can be divided into multiple components (fast, medium, slow components, etc.) by deconvoluting continuous-wave OSL or linearly modulated OSL curves (Huntley et al., 1996; Bailey et al., 1997; Jain et al., 2003). Although simple, CW-OSL contains the same physical information as LM-OSL but demonstrates a higher signal-to-noise ratio (Choi et al., 2006; Huntley, 2006; Jain and Lindvold, 2007; Rawat et al., 2014). This study used CW-OSL nonlinear fitting to monitor the OSL component properties of natural and regenerative dose signals. Assuming that each component in CW-OSL follows an exponential decay, the CW-OSL signal [L(t)] as a function of time (t) can be expressed as Eq. 1. (Bulur, 2000; Bøtter-Jensen et al., 2003b).
where i (i = 1, 2, 3 …) represents the ith decaying component, ni represents the number of initially trapped electrons of the ith component, bi represents the detrapping probability of the ith component (unit is s−1), and Ii represents the initial OSL intensity of the ith component. Meanwhile, the relationship of the photoionization cross-section of the ith component (σi, the unit is cm2), detrapping probability of the ith component (bi), stimulating photon flux (I0, unit is photons/(scm2)), maximum LED stimulation power (Pmax, i.e., at 100% LED power percent, unit is mW/cm2), and LED power percent set in Risø Sequence Editor (η, unit is %) satisfies Eqs 2, 3. [Adapted from Choi et al. (2006)]
The stimulation light source was a blue LED (λ = 470 ± 30 nm), the corresponding single-photon energy (E) was 4.23 × 10⁻¹⁹ Ws, and Pmax (45 mW/cm2) was obtained from Risø according to the instrument serial number. All deconvolution processes used the fit_CWCurve () function (Kreutzer, 2022) in the R package “luminescence”.
3.2.2 Fast ratio
Fast ratio (Durcan and Duller, 2011) can be used to distinguish whether the fast component dominates the initial signal of quartz. The fast ratio value can be described by the following equation:
where LF or LM means the representative channel signal whose proportion of fast or medium component intensity is largest, respectively. LM can also be obtained by the time when the fast component intensity decreases to 1%. Similarly, Lbg, namely, the average background signal, can be calculated from the medium component intensity decreasing to 1%–0.1% of its initial value (Durcan and Duller, 2011). Eq. 5 describes the relationship between bi (which has been discussed in 3.2.1) and ti, where ti represents the time when the signal of component i decreases to 1% of its initial value. The relationship between the time when the signal of the ith decaying component depletes to 1% of its initial values (ti) and the corresponding detrapping probability of the ith component (bi) can be calculated as follows:
Using ti calculated from Eq. 9, we can obtain the corresponding LF, LM, and Lbg from the OSL curve for the calculation of the fast ratio value by Eq. 4.
3.2.3 De estimation, age model and radial plot
The R package “numOSL” (Peng et al., 2013; R Core Team, 2016; Peng and Li, 2017) is used to fit DRC and estimate De based on the rejection criteria mentioned above. According to the firing temperature results obtained from the thermal expansion method (see Supplementary Figure S3), the samples in this study were fully hot bleached. Therefore, only the central age model (Galbraith and Roberts, 2012) was used to calculate the De. The De calculation and plotting radial plot used the calc_CentralDose () function (Burow, 2022) and plot_RadialPlot () function (Dietze and Kreutzer, 2022) in the R package “luminescence”, respectively.
3.2.4 Dose rate
The dose rate was calculated using the use_DRAC () function (Durcan et al., 2015; Kreutzer et al., 2022) in the R package ‘luminescence’. α, β, and γ dose rate contributions are converted from radioactive elements U, Th, 4 K using radionuclide conversion factors reported by Guérin et al. (2011). Attenuation factors caused by water are reported by Aitken and Xie (1990) and Zimmerman (1971), which are 1.49, 1.25, and 1.14 for α, β, and γ dose rate contributions, respectively. The water content was based on the measured values, and a relative error of 50% was assumed. To calculate the alpha dose for fine-grained quartz, an alpha efficiency (α-value) of 0.038 ± 0.002 was determined according to Rees-Jones (1995). The attenuation factors of α and β dose rates for different grain sizes are based on Bell (1980) for alpha particles and Guérin et al. (2012) for beta particles. Cosmic was calculated using the formula proposed by Prescott and Hutton (1988, 1994). The relative error for the cosmic dose rate is taken as 10% (Durcan et al., 2015). The contents of U and Th were obtained using ICP-MS, and K was obtained using ICP-OES. The relative errors of radioactive elements U, Th, and 4 K were taken as 10%, 10%, and 5%, respectively (Wang et al., 2022).
For the burnt clay, we selected samples of a large size (approximately 15–30 cm) so that the dose rate was mainly from within itself. For pottery, the total dose rate can be divided into the internal dose rate of the pottery itself and the external dose rate generated by the soil around the pottery (after removing approximately 3 mm from the surface, the external dose rate only indicates the γ dose rate). To maximize the accuracy of the dose rate, we also measured the radioactive element content of the sediments attached to the surface of the pottery to calculate the external dose rate.
4 Results
4.1 Fast ratio and relative component contribution
The burnt clay and pottery collected from the Lingjiatan site can be classified into Type I (Figures 2A–D) and Type II (Figures 2E–K) according to the quartz natural dose brightness and relative component proportions. Burnt clay LJTBE01, LJTBE08, LJTBE09, pottery LJTPott01, LJTPott05, and LJTPott06 belong to Type I (6 samples), while LJTBE02, LJTBE03/04, LJTBE05, and LJTBE06/07 belong to Type II (4 samples). To compare the discrepancy in sensitivity between these two types of samples, the OSL sensitivity (counts/Gy/mg) of Tn within 0.8 s was calculated (see Supplementary Table S2). The higher quartz brightness of the Type I sample (average of approximately 502–14,624 counts/Gy/mg of Tn for different samples) indicates a higher sensitivity of the OSL signal. The Type II sample has relatively dimer quartz brightness (average of approximately 81–148 counts/Gy/mg of Tn for different samples), indicating a lower OSL sensitivity. For Type II samples, the relative fast component proportion varies from 34% to 60% between samples, from 25% to 37% for the medium component, and from 16% to 29% for the slow component. For Type I samples, the fast, medium and slow component variations range from 60%–86%, 14%–39%, and 0.4%–5%, respectively. Although Figure 2 shows only the component characteristics of the natural signal, the results of regenerative doses and test doses in the subsequent cycles show consistent results compared with Figure 2 (see Supplementary Table S2 for details).
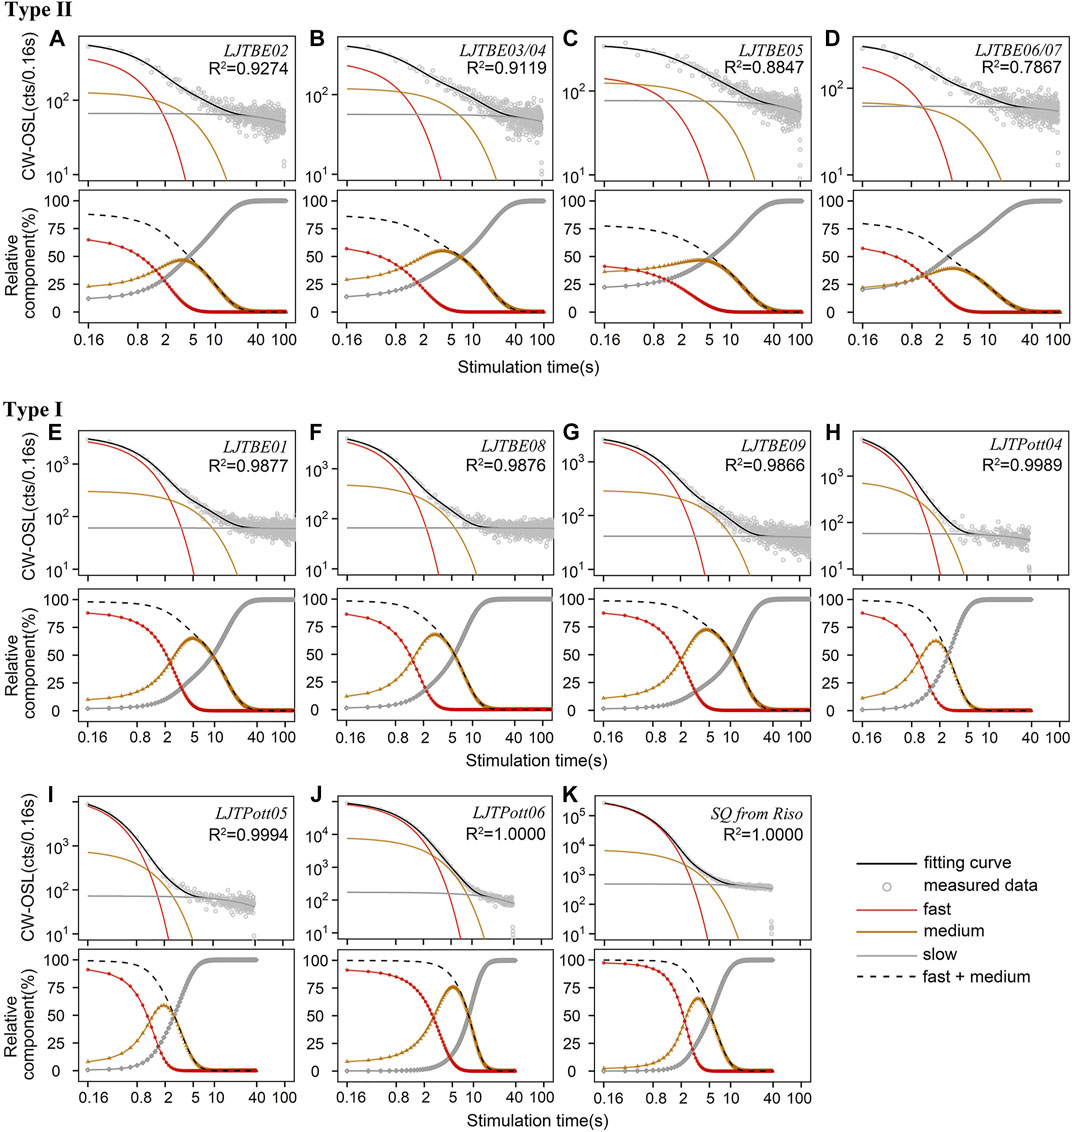
FIGURE 2. The component photon counts and relative percentages of the natural OSL decay curves after deconvolution using CW-OSL fitting. All original curve data are obtained from the pure quartz OSL-SAR dating procedures. (A–D) Type II samples. This type of sample is dim, which shows the characteristics of a slow decay rate. In the initial OSL curves (within 0.8 s), a relatively minor proportion of fast components, or even not dominated by fast components, and significant medium and slow components. Four samples belong to type II, their preheat temperature is 260°C, and their excitation temperature is 180°C. (E–K) Type I samples. This type of sample is bright, showing a fast decay rate. The fast component dominates the initial OSL signal (within 0.8 s), while the medium and slow components account for a minor proportion. Six samples belong to type I, their preheat temperature is 200°C, and their stimulation temperature is 125°C. (K) Is a control sample of the standard radiation source calibration quartz (SQ) provided by Risø.
The Fast Ratio (FR) and relative component contributions for all samples (only the natural dose is shown, see Supplementary Figure S2 for the other cycles) are shown in Figures 3A,B, respectively. The results indicate that the two types of samples have different FR values, illustrating the variation of component contribution in the initial OSL signals for different samples. Although Durcan and Duller (2011) used FR = 20 as a criterion to distinguish whether the initial OSL signal is dominated by the fast component, FR = 10 (Figure 3A) was considered the better criterion for classifying the sample types in this study. For Type I samples, the average FR values were all higher than 10, and the average FR values of different samples varied from 10 to 40 (see Supplementary Table S2 for details), indicating that the fast component occupies the relative main part of the initial signal. For Type II samples, the average FR values were lower than 10, indicating that the medium and slow components were significant in the initial signal.
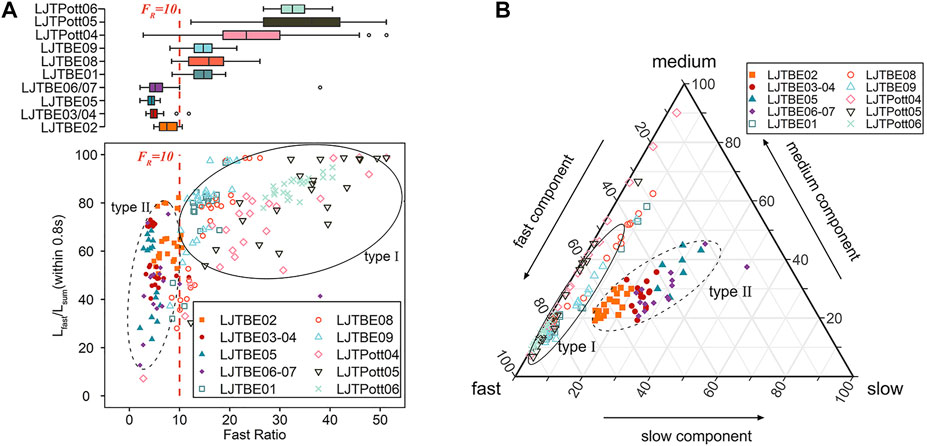
FIGURE 3. (A) The graph shows the Fast Ratio (FR) versus the proportion of the fast component in the initial signal. The proportion is obtained by calculating the integral of the first 0.8 s of the CW-OSL curve. The samples can be classified into two types based on FR and Lfast/Lsum. The FR values of type I are greater than 10, and the fast component dominates the initial signal. The FR values of Type II samples are less than 10, and the fast component is not significant in the initial OSL signal. All the data were calculated from the natural OSL decay curves during pure quartz OSL-SAR dating procedures. (B) The ternary diagram shows the relative proportions of fast, medium and slow components for the pure quartz natural CW-OSL signals. Similar to the results in (A), these samples can be classified into type I and type II according to the relative contributions of the three components.
4.2 Dependence of De on preheat temperature
Before optical stimulation in the OSL-SAR method, preheat plays a vital role in clearing shallow trapped electrons (Wintle and Murray, 2006) and transferring part of the charge into the fast component trap, which simulates the charge transfer in a buried environment (Murray et al., 2021). Therefore, the preheat plateau test is necessary before applying routine SAR protocols. Separate preheat plateau tests whose temperatures ranged from 180–300°C with an increment of 20°C were conducted for the above two types of samples. The results showed that these two types of samples had different plateau ranges. For the representative Type I sample LJTBE01, the De plateau appeared from 180°C, and remained relatively stable in the range of 180–220°C. However, Des decreased in the preheat temperature region of 220–260°C, which may be caused by the intervention of the shallow trap yielding a TL glow peak at 210–220°C (Figure 7C) (Choi et al., 2003b; Peng et al., 2021). Finally, the De would be significantly overestimated above 260°C preheat temperatures (Figure 4A). Between 180 and 260°C, the recycling ratio and recuperation remained between 0.9–1.1 and ±5%, respectively, without significant changes (Figure 4A). However, the recycling ratio beyond this range would be significantly lower, indicating that its OSL sensitivity was not corrected correctly, but the recuperation remained almost constant. The preheat plateau test and TL curves of the other Type I samples showed similar results (Supplementary Figures S5, S6A). For the representative Type II sample LJTBE02, the De plateau appeared from a relatively high temperature, i.e., 240°C, and a higher plateau region ranging from 240–300°C can be illustrated in Figure 4B. In contrast, the 325°C TL peaks were extremely weak for Type II samples, but 160–170 and 220°C TL peaks were observed (Supplementary Figure S6B). This may be attributed to the red TL emission of heated quartz with high firing temperature rather than the UV TL emission (Haustein et al., 2001; Song et al., 2009; Westaway and Prescott, 2012).
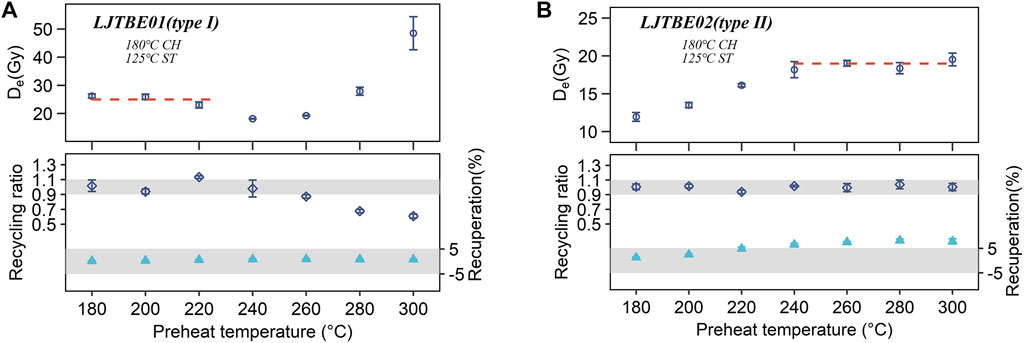
FIGURE 4. (A) The preheat plateau test of representative type I samples (LJTBE01) with a plateau region of 180–220°C. The cut-heat was 180°C. The red dashed line represents the average value of different aliquots of De in this region of approximately 25.0 Gy. The data for each temperature point are calculated from the mean value of three aliquots. (B) The preheat plateau test of typical type II samples (LJTBE02) with a plateau region of 240–300°C, and the average value in this region is approximately 18.8 Gy.
In conclusion, there is a significant difference between TL glow curves of the two types of samples. For example, type II samples exhibited significant 160–170°C TL peaks, while type I samples did not, which may be linked to the more significant medium component of type II samples (Wang et al., 2015; Peng and Wang, 2020). However, how the Des were influenced by the intervention of shallow electron traps in the heated archaeological quartz and the extent of the influence need to be further studied. As the preheat temperature increased, the recycling ratio remained constant and stayed within 0.9–1.1. In contrast, the recuperation ratio increased significantly and exceeded 5% at 240°C and later, indicating significant thermal transfer phenomena caused by higher preheat temperature (Wintle and Murray, 2006). It can be inferred from the presence of a plateau that this thermal transfer/recuperation effect will not significantly affect De (Figures 4A,B). For other samples (not shown in this paper), the preheat plateau results all roughly matched the respective types.
4.3 Dependence of De on stimulation temperature
The above preheat plateau test results showed that the recuperation of Type II samples at high preheat temperatures was quite significant. According to the suggestion of Murray and Wintle (2000), increasing the stimulation temperature may reduce recuperation. Therefore, gradient stimulation temperatures (60, 90, 125, 150, 180 and 210°C) were designed for both types of samples to investigate their relationship with De and recuperation. De values for each temperature step were obtained from three aliquots, and their average values with standard errors were used as the results for each temperature step. In this study, the preheat temperature (PH) and cut-heat temperature (CH) were set as follows: 220°C PH, 180°C CH for type I samples and 260°C, 240°C for Type II samples. Similar to the results of previous studies (Murray and Wintle, 2000; Kijek and Chruścińska, 2015), De does not change significantly with increasing stimulation temperature for both types of samples (except for a significant increase of De at 210°C stimulation temperature for Type I sample LJTBE08), and the recycling ratio remains roughly between 0.9–1.1. However, the recuperation of these two types of samples showed different extents of decrease, as exhibited by a lower extent of decrease for Type I samples (Figure 5A) and a significant extent of decrease for Type II samples (Figure 5B). Specifically, for the Type II sample (LJTBE02), the recuperation decreased from approximately 9 to −2%, while for the Type I sample (LJTBE08), the recuperation decreased from approximately 3 to −1%.
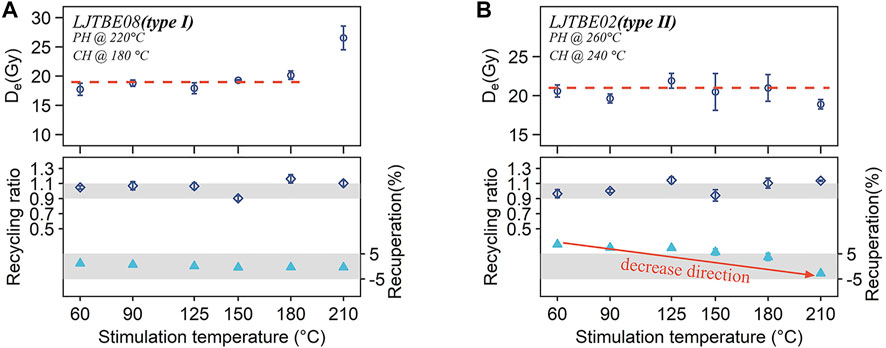
FIGURE 5. (A) De varies with stimulation temperature for a representative Type I sample (LJTBE08). Preheat and cut-heat temperatures are 220 and 180°C, respectively, with stimulation temperatures varying from 60–210°C. The red dotted line illustrates the range of the plateau. The corresponding recycling ratio and recuperation are also shown. The gray stripes represent the recycling ratio of 0.9–1.1 and ±5% recuperation. (B) De varies with stimulation temperature for a representative Type II sample (LJTBE02). The PH and CH temperatures are 260 and 240°C, respectively. The red arrow represents the trend of decreasing recuperation.
4.4 Dose recovery test
Murray and Wintle (2000) reported that too low cut-heat temperatures would lead to the failure of the test dose to monitor the sensitivity changes of the traps of interest, and Bailey (2000) used a cut-heat temperature similar to preheat in his study. Therefore, according to the suggestion of Murray and Wintle (2003), the cut-heat in this study was set 20°C lower than the preheat temperature to improve the result of the dose recovery test. Based on the above results for the preheat plateau and different stimulation temperature tests, the dating conditions of 200°C preheat, 180°C cut-heat, and 125°C stimulation temperature were used for Type I samples, while the dating conditions of 260°C preheat, 240°C cut-heat, and 180°C stimulation temperature were used for Type II. The aliquots used for the dose recovery test were bleached by a solar simulator. Figures 6C,D show the radial plots of the dose recovery test for representative Type I (LJTBE01) and Type II (LJTBE02) samples, respectively. M/G in the figures refers to the ratio of the measured dose to the given dose, and the ratios of both types of samples are close to 1, indicating the validity of the OSL-SAR method in recovering laboratory irradiation doses.
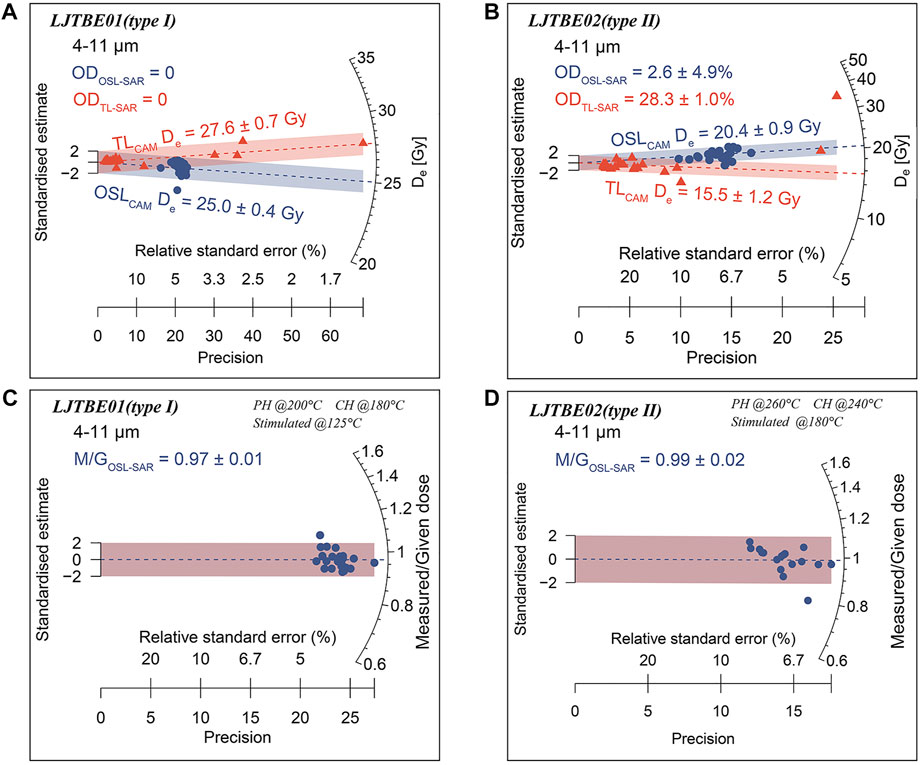
FIGURE 6. (A) Radial plot showing the De distribution of a typical Type I sample (LJTBE01). The blue circles indicate the De values for OSL-SAR dating procedures, and the red triangles indicate those for TL-SAR. (B) Similar to (A), this plot shows the radial plot of the representative type II sample (LJTBE02). (C) The dose recovery test of a typical type I sample (LJTBE01), and the M/G indicates the ratio of measured and given doses. (D) Like (C), this plot represents the radial plot of a representative type II sample (LJTBE02).
4.5 Dating results
Figures 7A,B illustrate the uncorrected OSL decay curves in SAR cycles for representative Type I (LJTBE01) and Type II (LJTBE02) samples. By comparing Figures 7A,B, it is possible to infer that the OSL brightness of the Type II sample is lower. Other type II samples exhibit consistent OSL brightness results. Insets show the DRCs fitted with exponential functions, and the De was calculated by interpolation. The repeated dose points (ΔR1) almost overlap with the first regenerative doses (R1), indicating the effectiveness of the OSL sensitivity correction. Figures 7C,E show the TL grow curve and De plateau plot for sample LJTBE01 in the TL-SAR method. The heating plateau (R1/N) and the De plateau (Figure 7E) determine the final TL integration interval of 290–380°C. Figure 7D shows the TL-MAAD method for LJTBE08, with the TL integration interval determined to be 290–350°C, according to the heating plateau (N/(N+β)) and the De plateau (Figure 7F). For the TL-MAAD method, the TL DRC in low doses may appear supralinear, so it is necessary to establish the second-grow DRC for supra-linearity correction. As shown in the second inset of Figure 7D, the second-grow DRC of sample LJTBE08 remains linear at low doses, indicating that its supra-linearity is negligible.
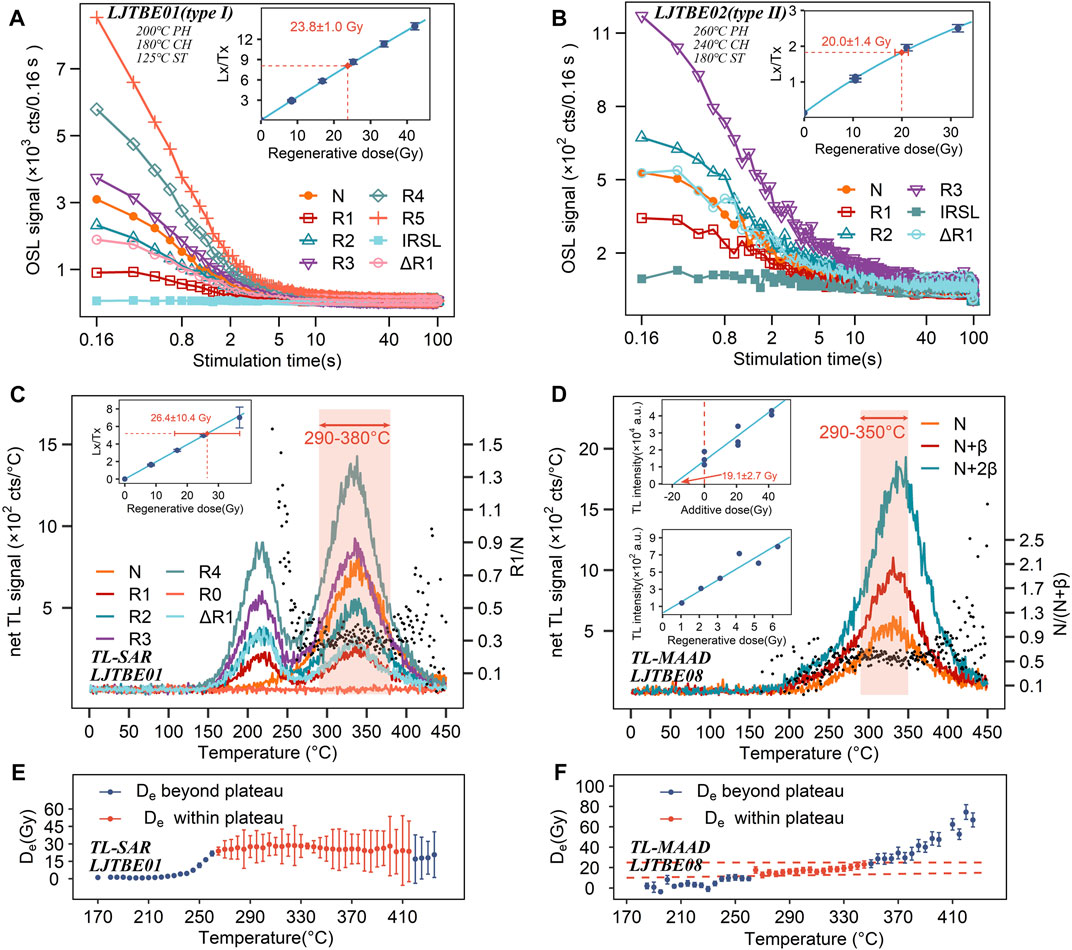
FIGURE 7. (A) The natural (N) and regenerative doses (R1-R5, ΔR1) OSL decay curves and their DRCs for a representative type I sample (LJTBE01), where ΔR1 means the repeated dose equal to R1. The IRSL signal is close to the background value, indicating that the sample is not contaminated with feldspar. The preheat (PH) and cut-heat (CH) temperatures for type I samples were 200 and 180°C, respectively, and the stimulation temperature (ST) was 125°C. (B) The natural (N) and regenerative doses (R1-R3, ΔR1) OSL decay curves and their DRCs for a representative type II sample (LJTBE02). Similarly, the OSL signal of this sample does not contain a feldspar signal. Unlike the type I samples, the PH and CH temperatures for the type II samples were 260 and 240°C, respectively, and the stimulation temperature was 180°C. (C) The natural (N) and regenerative (R1-R4, R0, ΔR1) TL curves after background subtraction of a representative sample (LJTBE01) for TL-SAR dating procedures, where R0 means the zero dose point and ΔR1 means the repeated dose equals R1. The right axis is the value of R1/N, used to find the heating plateau. The inset shows the corresponding DRC. Combining the results of the heating plateau and De plateau, the final TL integration interval of 290–380°C was used to calculate the De value. (D) The natural (N) and additive doses (N+β, N+2β) TL curves after background subtraction of a typical sample (LJTBE08) for TL-MAAD dating procedures. The heating plateau can be inferred from the N/(N+β) marked with black dots. Each dose utilizes three aliquots to obtain the TL signal. The first inset shows the DRC curve, and the second inset indicates the second TL (the first natural TL was bleached by heat) DRC with small doses to check for supra-linearity. The final integration interval is determined to be 290–350°C based on the results of the preheat plateau and the heating plateau. (E) De plateau of sample LJTBE01 corresponding to (C). (F) De plateau of sample LJTBE08 corresponding to (D).
Figures 6A,B show the De distributions of OSL-SAR and TL-SAR for representative samples of the two types. Although the overdispersion values of OSL-SAR and TL-SAR of LJTBE01 (Figure 6A) are both close to 0, the relative standard error of OSL-SAR is still smaller than that of TL-SAR, and the other samples behave similarly. Compared with the OSL-SAR method, the De obtained by TL-SAR exhibited overestimation (LJTBE01, LJTBE08, LJTPott06) or underestimation (LJTBE02, LJTBE09), which may be caused by the inappropriate sensitivity correction of the natural TL signal (Lai et al., 2006; Wang et al., 2022). This could also explain why most of the TL-SAR OD values (0%–30.1%) are larger than OSL-SAR (0%–18.2%) (as shown in Figures 6A,B; Table 1).
The corrected 14C ages within the 2σ standard error for the two charcoal chips are 5.5 ± 0.1 ka and 5.7 ± 0.1 ka (BP 2022, already converted to before 2022). This result agrees well with the 14C ages of grass ash (5.6 ± 0.2 ka BP 2022) and charcoal chips (5.4 ± 0.2 ka BP 2022) from the Lingjiatan site determined by previous researchers (Anhui Provincial Institute of Cultural Relics and Archaeology, 2006). The OSL-SAR ages of most Type II samples utilizing the modified measurement parameters (higher preheat and stimulation temperatures) agree well with those of all Type I samples within 10% error of the radiocarbon age, except for a significant underestimation of sample LJTBE05 for Type II samples with unknown reasons (see Figure 8; Table 1). The slight OSL-SAR age variations of the other samples may come from inaccurate radioactive element measurements or water content estimations. The mean values of TL-MAAD also seem to agree with radiocarbon ages within the ±10% error range, but their relative errors are much larger than those of OSL-SAR, probably from the weighing errors of different aliquots. The TL-SAR ages are rejected in this study due to the inadequate sensitivity corrections discussed above.
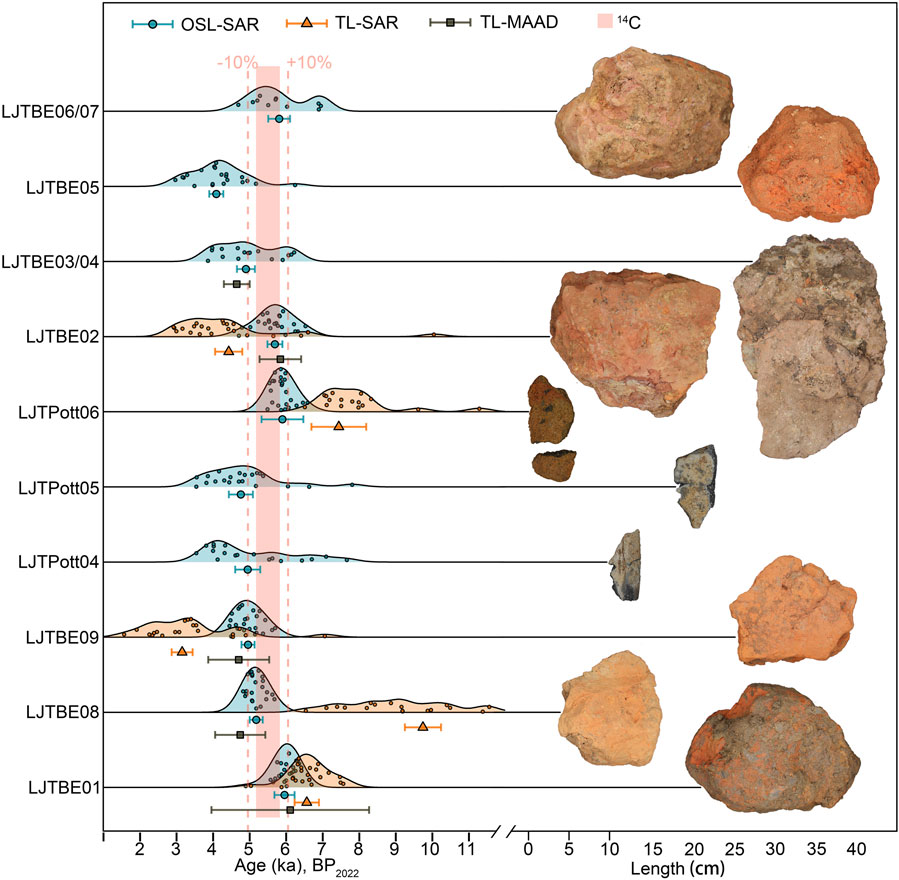
FIGURE 8. Comparison of OSL-SAR, TL-SAR, TL-MAAD and 14C dating methods. The light blue filled color represents the kernel density estimate (KDE) plot of OSL-SAR, and the light brown filled color represents that of TL-SAR. The green solid circles represent the OSL-SAR ages, the red solid triangles represent the TL-SAR ages, the dark blue solid squares represent the TL-MAAD ages, and the pink band represents the range of the two corrected 14C ages. The red dotted lines indicate the range of ±10% mean 14C ages for four samples (two are measured in this study, and the others are cited from previous research).
5 Discussion
5.1 Relationship between component characteristics and measurement cycles and thermal history
There are differences in the fundamental parameters (σ, photoionization cross-section) of quartz extracted from different archaeological samples, but not varying significantly within the error range between different OSL-SAR cycles (see Supplementary Figure S1 in Supplementary Material). The relative component contributions and the fast ratio values will not change significantly with the OSL-SAR cycle. The results in this study are consistent with those of Nian et al. (2019), who found that 200–600°C annealing did not significantly change the relative component contribution of sedimentary quartz.
According to the results of the firing temperatures determined by the thermal expansion method (see Supplementary Material), the firing temperatures of samples LJTBE01 and LJTBE05 (Type I) and sample LJTBE03/04 (Type II) are approximately 900–950°C. However, the firing temperature of sample LJTPott06 (Type I) may be lower than 770°C, which indicates that the firing temperature determined by this method cannot completely distinguish these two types in this study. The FR is larger for the lower firing temperature sample LJTPott06 (FR ∼31–40), while the FR is smaller for the higher firing temperature samples LJTBE01 (FR ∼6–18), LJTBE03/04 (FR ∼4–9), and LJTPott05 (FR ∼14–36), indicating that the Fast Ratio value can distinguish between relatively high and low temperature thermal history in 600–1,000°C, based on the simulation annealing experiments of Wang et al. (2022). They reported that annealing temperatures above 600–800°C would significantly reduce the fast ratio values of quartz, contrary to Gong et al. (2015), who heated the quartz gradient to 500°C. These different results indicate that the OSL properties of archaeological heated quartz have changed significantly at high temperatures (over 600–800°C), leading to this difference from geological quartz.
5.2 De underestimation caused by inappropriate preheat temperature
Typically, before conducting OSL measurements, suitable preheating is required to avoid the influences of shallow electrons on De determination (Choi et al., 2003b; Peng et al., 2021). As suggested by Wintle and Murray (2006), a higher preheat temperature (e.g., 260°C) is typically used for older samples, while a lower preheat temperature (e.g., 200°C) is typically used for younger samples to avoid thermal transfer effects on De estimations (Rhodes, 2000). However, for the relatively young (<6 ka) Late Neolithic archaeological burnt clay and pottery in this study, preheat temperatures that are too low may cause significant De underestimation for type II samples. For the representative Type II sample LJTBE06/07, the De obtained at the 200°C preheat temperature will be underestimated by approximately 83% compared to the 260°C preheat temperature (see Figure 9). Despite higher stimulation temperatures being used for Type II samples, the stimulation temperature will not significantly affect De. When faced with samples collected from the same site or from a single stratigraphic section, an archaeologist or geologist usually selects only one or several representative samples for the preheat plateau test. However, for the samples in this study, this dating strategy is likely to result in a significant De underestimation of the Type II samples. Therefore, we suggest that when dating heated archaeological samples (especially for those heated by high firing temperatures), different types of samples should be distinguished by calculating the Fast Ratio, and separated preheat plateau tests should be conducted to avoid erroneous De estimation.
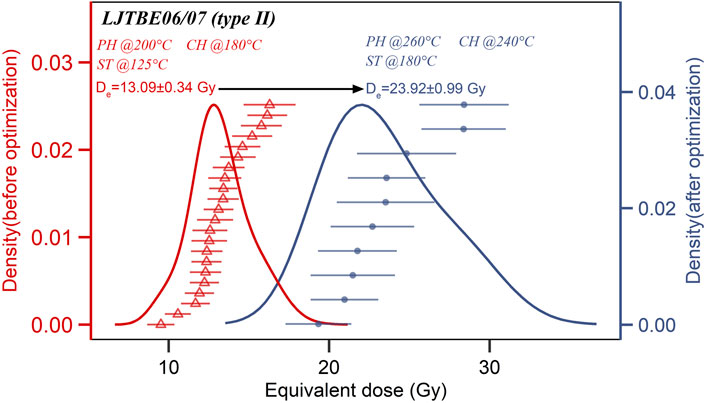
FIGURE 9. OSL-SAR De probability density function plots of a representative type II sample (LJTBE06/07) at different measurement parameters. The red line represents the underestimated probability density function plot with the measurement parameters of 200°C preheat, 180°C cut-heat and 125°C stimulation temperature. The blue line represents the modified probability density function plot with the measurement parameters of 260°C preheat, 240°C cut-heat and 180°C stimulation temperature. The black arrow represents the direction of modification of the CAM De results.
5.3 Thermal stability monitored by De(t) plot
Since significant medium and slow components were observed in the CW-OSL signals of the archaeological samples, the variation of De as a function of the stimulation time (Bailey et al., 2003) was plotted to monitor the thermal stability of the component, i.e., De(t) plot (Figure 10). A consistent initial OSL signal of the test dose (within 0.8 s) was used for the sensitivity correction for different integration intervals to avoid large errors in the De(t) plot resulting from the reduction of the test dose OSL precision. De for each integration interval was calculated from the CAM values of multiple aliquots. Except for LJTPott04 and LJTPott05, the CAM De did not change with the integration interval within 2.24 s for all the other archaeological samples in this study, indicating that the De values of these samples were not affected by the thermally unstable component. However, the De values of samples LJTPott04 and LJTPott05 started to decrease after 0.96 s. It is inferred that there may exist a thermally unstable medium component because the medium component dominates the signal proportion between 0.9–2.5 s. In other words, when using the conventional 0.8 s initial OSL signals as the integration interval for all samples with appropriate measurement conditions in this study, the De will not be significantly affected by the medium and slow components.
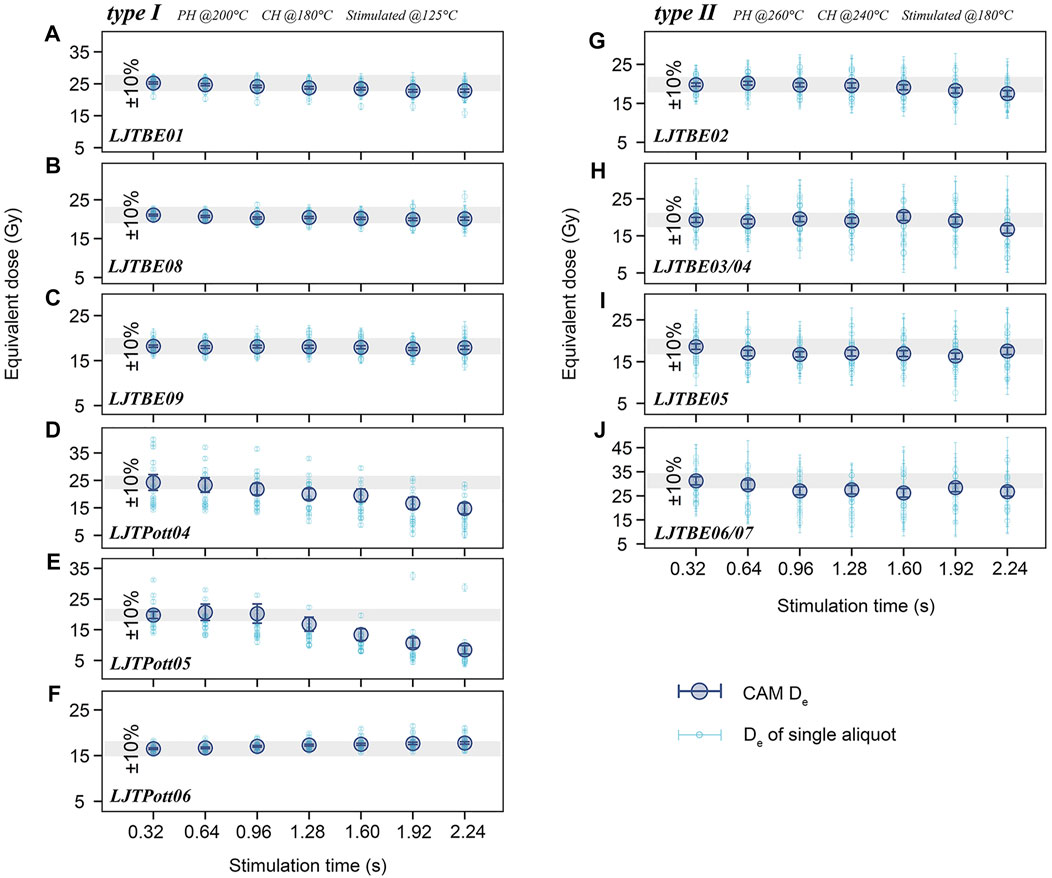
FIGURE 10. (A–F) De(t) plot of type I samples. The small light blue hollow circle represents the De values and its standard error for one aliquot. The large dark blue filled circle represents the CAM De and its error. The integration intervals of stimulation times were 0–0.32 s, 0.32–0.64 s, 0.64–0.96 s, 0.96–1.28 s, 1.28–1.60 s, 1.60–1.92 s, and 1.92–2.24 s, respectively. (G–J) Similar De(t) plot of type II samples as in (A–F). The gray bands represent the ±10% CAM De error for the first (0–0.32 s) integration interval.
6 Conclusion
This study focused on analyzing the OSL component characteristics of heated quartz extracted from burnt clay and pottery shards from the Lingjiatan archaeological site. Different luminescence brightness and component contributions in the initial (within 0.8 s) OSL signals were observed in these archaeological samples. The Fast Ratio value can be used as a classification criterion to identify the OSL characteristics of these samples. Type I samples had relatively larger Fast Ratio values (FR>10), and the preheat plateau appeared from lower temperatures. For Type II samples with smaller Fast Ratio values (FR<10), the preheat plateau appeared from higher temperatures. Applying low preheat temperatures (below the plateau region) for Type II samples would lead to a significant De underestimation. Therefore, separated preheat plateau test strategies are necessary for these two types of samples. With the increase in the preheat temperature, the thermal transfer of Type II samples increases much more significantly than that of Type I samples. However, the recuperation can be reduced by raising the stimulation temperature for Type II samples without a significant effect on De. The ages obtained by the modified OSL-SAR protocol of most Type II samples (3 of 4 samples) and the conventional OSL-SAR protocol of all Type I samples (6 samples) agreed well with TL-MAAD and 14C within the error range. However, the TL-SAR ages showed either overestimation or underestimation, mainly due to the inappropriate sensitivity correction for natural signals. Finally, the age of the Lingjiatan archaeological site was dated back to approximately 5.4–5.8 ka BP 2022.
Data availability statement
The original contributions presented in the study are included in the article/Supplementary Material, further inquiries can be directed to the corresponding author.
Author contributions
AF organized and conceptualized the research and reviewed and proofread the manuscript. C-XW, AF, YW, and YZ collected the samples. XZ authorized the sampling. C-XW completed the experiments, analyzed the data and wrote the manuscript. YZ provided the firing temperature data. CH reviewed and proofread the manuscript.
Funding
This study was supported by the National Natural Science Foundation of China (Grant No. 41303080), the Youth Innovation Promotion Association CAS (2018499) and the USTC Research Funds of the Double First-Class Initiative (YD2110002027).
Acknowledgments
We thank Mei Huang and Lingling Shi for helping with the experiments and Fanzhen Feng for proofreading the manuscript. We also thank the reviewers for their revisions and enlightening ideas.
Conflict of interest
The authors declare that the research was conducted in the absence of any commercial or financial relationships that could be construed as a potential conflict of interest.
Publisher’s note
All claims expressed in this article are solely those of the authors and do not necessarily represent those of their affiliated organizations, or those of the publisher, the editors and the reviewers. Any product that may be evaluated in this article, or claim that may be made by its manufacturer, is not guaranteed or endorsed by the publisher.
Supplementary material
The Supplementary Material for this article can be found online at: https://www.frontiersin.org/articles/10.3389/feart.2022.933342/full#supplementary-material
References
Aitken, M. J., Tite, M. S., and Reid, J. (1964). Thermoluminescent dating of ancient ceramics. Nature 202, 1032–1033. doi:10.1038/2021032b0
Aitken, M. J., Zimmerman, D. W., and Fleming, S. J. (1968). Thermoluminescent dating of ancient pottery. Nature 219, 442–445. doi:10.1038/219442a0
Anderson, S. L., and Feathers, J. K. (2019). Applying luminescence dating of ceramics to the problem of dating Arctic archaeological sites. J. Archaeol. Sci. 112, 105030. doi:10.1016/j.jas.2019.105030
Anhui Provincial Institute of Cultural Relics and Archaeology (2006). One of lingjiatan field archaeological excavation reports. Beijing: Cultural Relics Publishing House. (in Chinese).
Bailey, R. M., Singarayer, J. S., Ward, S., and Stokes, S. (2003). Identification of partial resetting using De as a function of illumination time. Radiat. Meas. 37, 511–518. doi:10.1016/S1350-4487(03)00063-5
Bailey, R. M., Smith, B. W., and Rhodes, E. J. (1997). Partial bleaching and the decay form characteristics of quartz OSL. Radiat. Meas. 27, 123–136. doi:10.1016/S1350-4487(96)00157-6
Bailey, R. M. (2000). The slow component of quartz optically stimulated luminescence. Radiat. Meas. 32, 233–246. doi:10.1016/S1350-4487(99)00285-1
Bailiff, I. K. (2007). Methodological developments in the luminescence dating of brick from English late-medieval and post-medieval buildings. Archaeometry 49, 827–851. doi:10.1111/j.1475-4754.2007.00338.x
Bell, W. T. (1980). Alpha attenuation in quartz grains for thermoluminescence dating. Anc. TL 12, 4–8.
Bluszcz, A., and Bøtter-Jensen, L. (1995). Dosimetric properties of natural quartz grains extracted from fired materials. Radiat. Meas. 24, 465–468. doi:10.1016/1350-4487(95)00005-Y
Bøtter-Jensen, L., Agersnap Larsen, N., Mejdahl, V., Poolton, N. R. J., Morris, M. F., McKeever, S. W. S., et al. (1995). Luminescence sensitivity changes in quartz as a result of annealing. Radiat. Meas. 24, 535–541. doi:10.1016/1350-4487(95)00006-Z
Bøtter-Jensen, L., Andersen, C. E., Duller, G. A. T., and Murray, A. S. (2003a). Developments in radiation, stimulation and observation facilities in luminescence measurements. Radiat. Meas. 37, 535–541. doi:10.1016/S1350-4487(03)00020-9
Bøtter-Jensen, L., McKeever, S. W. S., and Wintle, A. G. (2003b). Optically stimulated luminescence dosimetry. 1st ed. Amsterdam ; Boston ; London: Elsevier.
Bulur, E. (2000). A simple transformation for converting CW-OSL curves to LM-OSL curves. Radiat. Meas. 32, 141–145. doi:10.1016/S1350-4487(99)00247-4
Burow, C. (2022). “calc_CentralDose(): Apply the central age model (CAM) after Galbraith et al. (1999) to a given De distribution. Function version 1.4.1,” in Luminescence: Comprehensive luminescence DatingDataAnalysis. Rpackageversion0.9.19. Editors S. Kreutzer, C. Burow, M. Dietze, M. C. Fuchs, C. Schmidt, M. Fischeret al. Available at: https://CRAN.R-project.org/package=Luminescence.
Choi, J. H., Duller, G. A. T., and Wintle, A. G. (2006). Analysis of quartz LM-OSL curves. Anc. TL. 24, 12.
Choi, J. H., Murray, A. S., Cheong, C. S., Hong, D. G., and Chang, H. W. (2003a). The resolution of stratigraphic inconsistency in the luminescence ages of marine terrace sediments from Korea. Quat. Sci. Rev. 22, 1201–1206. doi:10.1016/S0277-3791(03)00022-2
Choi, J. H., Murray, A. S., Jain, M., Cheong, C. S., and Chang, H. W. (2003b). Luminescence dating of well-sorted marine terrace sediments on the southeastern coast of Korea. Quat. Sci. Rev. 22, 407–421. doi:10.1016/S0277-3791(02)00136-1
Dietze, M., and Kreutzer, S. (2022). “plot_RadialPlot(): Function to create a radial plot. Function version 0.5.7,” in Luminescence: Comprehensive luminescence dating data analysis. R package version 0.9.19. Editors S. Kreutzer, C. Burow, M. Dietze, M. C. Fuchs, C. Schmidt, M. Fischeret al. Available at: https://CRAN.R-project.org/package=Luminescence.
Durcan, J. A., and Duller, G. A. T. (2011). The fast ratio: A rapid measure for testing the dominance of the fast component in the initial OSL signal from quartz. Radiat. Meas. 46, 1065–1072. doi:10.1016/j.radmeas.2011.07.016
Durcan, J. A., King, G. E., and Duller, G. A. T. (2015). Drac: Dose rate and age calculator for trapped charge dating. Quat. Geochronol. 28, 54–61. doi:10.1016/j.quageo.2015.03.012
Fan, A., Li, S.-H., and Li, B. (2009). Characteristics of quartz infrared stimulated luminescence (IRSL) at elevated temperatures. Radiat. Meas. 44, 434–438. doi:10.1016/j.radmeas.2009.02.019
Fu, X., Zhang, J.-F., Mo, D.-W., Shi, C.-X., Liu, H., Li, Y.-Y., et al. (2010). Luminescence dating of baked Earth and sediments from the Qujialing archaeological site, China. Quat. Geochronol. 5, 353–359. doi:10.1016/j.quageo.2009.06.006
Galbraith, R. F., and Roberts, R. G. (2012). Statistical aspects of equivalent dose and error calculation and display in OSL dating: An overview and some recommendations. Quat. Geochronol. 11, 1–27. doi:10.1016/j.quageo.2012.04.020
Gautier, A. (2001). Luminescence dating of archaeometallurgical slag: use of the SAR technique for determination of the burial dose. Quat. Sci. Rev. 20, 973–980. doi:10.1016/S0277-3791(00)00010-X
Gong, Z., Sun, J., Lü, T., and Tian, Z. (2014). Investigating the optically stimulated luminescence dose saturation behavior for quartz grains from dune sands in China. Quat. Geochronol. 22, 137–143. doi:10.1016/j.quageo.2014.01.003
Gong, Z., Sun, J., and Lü, T. (2015). Investigating the components of the optically stimulated luminescence signals of quartz grains from sand dunes in China. Quat. Geochronol. 29, 48–57. doi:10.1016/j.quageo.2015.06.004
Guérin, G., Mercier, N., and Adamiec, G. (2011). Dose-rate conversion factors: Update. Anc. TL 29, 5.
Guérin, G., Mercier, N., Nathan, R., Adamiec, G., and Lefrais, Y. (2012). On the use of the infinite matrix assumption and associated concepts: A critical review. Radiat. Meas. 47, 778–785. doi:10.1016/j.radmeas.2012.04.004
Haustein, M., Krbetschek, M. R., Trautmann, T., Roewer, G., and Stolz, W. (2001). A luminescence study for dating archaeometallurgical slags. Quat. Sci. Rev. 5. doi:10.1016/S0277-3791(00)00038-X
Huntley, D. J., Short, M. A., and Dunphy, K. (1996). Deep traps in quartz and their use for optical dating. Can. J. Phys. 74, 81–91. doi:10.1139/p96-013
Huntley, D. J. (2006). Thoughts arising from “Choi, Duller and Wintle: Analysis of quartz LM-OSL curves. Anc. TL 24, 69–70.
Jain, M., Murray, A. S., and Bøtter-Jensen, L. (2003). Characterisation of blue-light stimulated luminescence components in different quartz samples: implications for dose measurement. Radiat. Meas. 37, 441–449. doi:10.1016/S1350-4487(03)00052-0
Jain, M., and Lindvold, L. (2007). Blue light stimulation and linearly modulated optically stimulated luminescence. Anc. TL 25.
Kijek, N., and Chruścińska, A. (2015). Equivalent dose of quartz originating from ceramics obtained by OSL SAR method – tests of protocol parameters. Radiat. Meas. 81, 128–133. doi:10.1016/j.radmeas.2015.02.003
Kreutzer, S., Dietze, M., and Burow, C. (2022). “use_DRAC(): Use DRAC to calculate dose rate data. Function version 0.14,” in Luminescence: Comprehensive luminescence dating data analysis. R package version 0.9.19. Editors S. Kreutzer, C. Burow, M. Dietze, M. C. Fuchs, C. Schmidt, M. Fis- cheret al. Available at: https://CRAN.R-project.org/package=Luminescence.
Kreutzer, S. (2022). “fit_CWCurve(): Nonlinear least squares fit for CW-OSL curves -beta version. Function version 0.5.2,” in Luminescence: Comprehensive luminescence dating data analysis. R package version 0.9.19. Editors S. Kreutzer, C. Burow, M. Dietze, M. C. Fuchs, C. Schmidt, M. Fischeret al. Available at: https://CRAN.R-project.org/package=Luminescence.
Lai, Z., Murray, A. S., Bailey, R. M., Huot, S., and Bøtter-Jensen, L. (2006). Quartz red TL SAR equivalent dose overestimation for Chinese loess. Radiat. Meas. 41, 114–119. doi:10.1016/j.radmeas.2005.06.006
Li, B., and Li, S.-H. (2006). Comparison of estimates using the fast component and the medium component of quartz OSL. Radiat. Meas. 41, 125–136. doi:10.1016/j.radmeas.2005.06.037
Liritzis, I., Jin, Z., Fan, A., Sideris, A., and Drivaliari, A. (2016). Late helladic and later reuse phases of kastrouli settlement (Greece): Preliminary dating results. doi:10.5281/ZENODO.163775
Murray, A., Arnold, L. J., Buylaert, J.-P., Guérin, G., Qin, J., Singhvi, A. K., et al. (2021). Optically stimulated luminescence dating using quartz. Nat. Rev. Methods Prim. 1, 72. doi:10.1038/s43586-021-00068-5
Murray, A. S., and Wintle, A. G. (2000). Luminescence dating of quartz using an improved single-aliquot regenerative-dose protocol. Radiat. Meas. 32, 57–73. doi:10.1016/S1350-4487(99)00253-X
Murray, A. S., and Wintle, A. G. (2003). The single aliquot regenerative dose protocol: potential for improvements in reliability. Radiat. Meas. 37, 377–381. doi:10.1016/S1350-4487(03)00053-2
Nian, X., Zhang, W., Qiu, F., Qin, J., Wang, Z., Sun, Q., et al. (2019). Luminescence characteristics of quartz from Holocene delta deposits of the Yangtze River and their provenance implications. Quat. Geochronol. 49, 131–137. doi:10.1016/j.quageo.2018.04.010
Peng, J., Dong, Z., Han, F., Long, H., and Liu, X. (2013). R package numOSL: numeric routines for optically stimulated luminescence dating. Anc. TL 31, 8.
Peng, J., and Li, B. (2017). Single-aliquot regenerative-dose (SAR) and standardised growth curve (SGC) equivalent dose determination in a batch model using the R package ‘numOSL’. Anc. TL 35, 22.
Peng, J., Wang, X., Adamiec, G., Pagonis, V., and Choi, J.-H. (2021). Modelling the dependence of equivalent dose determined from a dose recovery test on preheating temperature: The intervention of shallow electron traps. Radiat. Meas. 142, 106566. doi:10.1016/j.radmeas.2021.106566
Peng, J., and Wang, X. (2020). On the production of the medium component in quartz OSL: Experiments and simulations. Radiat. Meas. 138, 106448. doi:10.1016/j.radmeas.2020.106448
Prescott, J. R., and Hutton, J. T. (1994). Cosmic ray contributions to dose rates for luminescence and ESR dating: Large depths and long-term time variations. Radiat. Meas. 23, 497–500. doi:10.1016/1350-4487(94)90086-8
Prescott, J. R., and Hutton, J. T. (1988). Cosmic ray and gamma ray dosimetry for TL and ESR. Int. J. Radiat. Appl. Instrum. Part D. Nucl. Tracks Radiat. Meas. 14, 223–227. doi:10.1016/1359-0189(88)90069-6
R Core Team (2016). R: A language and environment for statistical computing. Vienna Austria. Available at: https://www.r-project.org/.
Rawat, N. S., Dhabekar, B., Kulkarni, M. S., Muthe, K. P., Mishra, D. R., Soni, A., et al. (2014). Optimization of CW-OSL parameters for improved dose detection threshold in Al2O3:C. Radiat. Meas. 71, 212–216. doi:10.1016/j.radmeas.2014.02.013
Rees-Jones, J. (1995). Optical dating of young sediments using fine-grained quartz. Anc. TL 13, 9–14.
Rhodes, E. J. (2000). Observations of thermal transfer OSL signals in glacigenic quartz. Radiat. Meas. 32, 595–602. doi:10.1016/S1350-4487(00)00125-6
Richter, D., Angelucci, D. E., Dias, M. I., Prudêncio, M. I., Gouveia, M. A., Cardoso, G. J., et al. (2014). Heated flint TL-dating for gruta da oliveira (Portugal): dosimetric challenges and comparison of chronometric data. J. Archaeol. Sci. 41, 705–715. doi:10.1016/j.jas.2013.09.021
Richter, D., Grün, R., Joannes-Boyau, R., Steele, T. E., Amani, F., Rué, M., et al. (2017). The age of the hominin fossils from jebel irhoud, Morocco, and the origins of the middle stone age. Nature 546, 293–296. doi:10.1038/nature22335
Richter, D., and Krbetschek, M. (2006). A new thermoluminescence dating technique for heated flint. Archaeometry 48, 695–705. doi:10.1111/j.1475-4754.2006.00281.x
Singarayer, J. S., and Bailey, R. M. (2003). Further investigations of the quartz optically stimulated luminescence components using linear modulation. Radiat. Meas. 37, 451–458. doi:10.1016/S1350-4487(03)00062-3
Solongo, S., Tengis, S., Wagner, G. A., and Hüttel, H.-G. (2021). CW-OSL, LM-OSL and TL dating of bricks from karakorum, Mongolia: Insights from TL spectra. Geochronometria 48, 402–414. doi:10.2478/geochr-2020-0003
Song, K.-W., Yun, K.-K., and Hong, D.-G. (2009). Radiation response of thermoluminescence glow peaks separated using a glow curve fitting method for red emission from quartz. Radiat. Meas. 44, 611–614. doi:10.1016/j.radmeas.2009.03.034
Steffen, D., Preusser, F., and Schlunegger, F. (2009). OSL quartz age underestimation due to unstable signal components. Quat. Geochronol. 4, 353–362. doi:10.1016/j.quageo.2009.05.015
Sun, M., Sun, Y., Wei, H., Hou, G., Xianba, J., Xie, L., et al. (2021). Luminescence dating of relics in ancient cities provides absolute dates for understanding human-land relationships in qinghai lake basin, northeastern Tibetan plateau. Front. Earth Sci. 9, 701037. doi:10.3389/feart.2021.701037
Thomas, P. J., Jain, M., Juyal, N., and Singhvi, A. K. (2005). Comparison of single-grain and small-aliquot OSL dose estimates in years old river sediments from South India. Radiat. Meas. 39, 457–469. doi:10.1016/j.radmeas.2004.07.005
Tsukamoto, S., Rink, W. J., and Watanuki, T. (2003). OSL of tephric loess and volcanic quartz in Japan and an alternative procedure for estimating De from a fast OSL component. Radiat. Meas. 37, 459–465. doi:10.1016/S1350-4487(03)00054-4
Wang, C.-X., Ji, X., Wu, Y., Jin, Z., Zhang, Y., Chen, M., et al. (2022). Quartz OSL and TL dating of pottery, burnt clay, and sediment from Beicun archaeological site, China. Quat. Geochronol. 70, 101281. doi:10.1016/j.quageo.2022.101281
Wang, X. L., Du, J. H., Adamiec, G., and Wintle, A. G. (2015). The origin of the medium OSL component in West Australian quartz. J. Lumin. 159, 147–157. doi:10.1016/j.jlumin.2014.11.003
Westaway, K., and Prescott, J. (2012). Investigating signal evolution: A comparison of red and UV/blue TL, and UV OSL emissions from the same quartz sample. Radiat. Meas. 47, 909–915. doi:10.1016/j.radmeas.2012.01.001
Wintle, A. G., and Murray, A. S. (2006). A review of quartz optically stimulated luminescence characteristics and their relevance in single-aliquot regeneration dating protocols. Radiat. Meas. 41, 369–391. doi:10.1016/j.radmeas.2005.11.001
Zander, A., Strebler, D., Classen, E., Rethemeyer, J., and Brückner, H. (2019). Roman traces in Germania magna: New thermoluminescence and pIRIR 290 data from a lime kiln at Bergisch Gladbach, Germany. Archaeometry 61, 506–518. doi:10.1111/arcm.12435
Keywords: OSL component, age underestimation, heated quartz, luminescence dating, lingjiatan site
Citation: Wang C-X, Zhang X, Zhang Y, Wu Y, Huang C and Fan A (2022) Luminescence dating of heated quartz extracted from burnt clay and pottery excavated from the Lingjiatan archaeological site, China. Front. Earth Sci. 10:933342. doi: 10.3389/feart.2022.933342
Received: 30 April 2022; Accepted: 11 July 2022;
Published: 04 August 2022.
Edited by:
Hui Zhao, Chinese Academy of Sciences (CAS), ChinaReviewed by:
Jun Peng, Hunan University of Science and Technology, ChinaJie Chen, China Earthquake Administration, China
Copyright © 2022 Wang, Zhang, Zhang, Wu, Huang and Fan. This is an open-access article distributed under the terms of the Creative Commons Attribution License (CC BY). The use, distribution or reproduction in other forums is permitted, provided the original author(s) and the copyright owner(s) are credited and that the original publication in this journal is cited, in accordance with accepted academic practice. No use, distribution or reproduction is permitted which does not comply with these terms.
*Correspondence: Anchuan Fan, YW5jaHVhbkB1c3RjLmVkdS5jbg==