 Wei Guo
 Chunmei Dong1,2*
94% of researchers rate our articles as excellent or good
Learn more about the work of our research integrity team to safeguard the quality of each article we publish.
Find out more
ORIGINAL RESEARCH article
Front. Earth Sci., 21 June 2022
Sec. Solid Earth Geophysics
Volume 10 - 2022 | https://doi.org/10.3389/feart.2022.932929
This article is part of the Research TopicDigital Rock Physics and Machine LearningView all 10 articles
Digital rock physics (DRP) has become an important tool to analyze the characteristics of pore structures and minerals and reveal the relationships between microscopic structures and the physical properties of reservoirs. However, it is greatly difficult to upscale the rock physical parameters, such as P-wave velocity, S-wave velocity, and elastic moduli, from DRP to large-scale boreholes and reservoirs. On the other hand, theoretical rock physical modeling can establish the internal relationship between the elastic properties and physical parameters of tight sandstones, which provides a theoretical basis for seismic inversion and seismic forward modeling. Therefore, the combination of digital rock physics and rock physical modeling can guide the identification and evaluation of the gas reservoir’s “sweet spot.” In this study, the CT images are used to analyze the mineral and pore characteristics. After that, the V-R-H model is used to calculate the equivalent elastic moduli of rocks containing only the mineral matrix, and then, the differential equivalent medium (DEM) model is used to obtain the elastic moduli of dry rocks containing minerals and pores. Subsequently, the homogeneous saturation model is used to fill the fluids in the pores and the Gassmann equation is used to calculate the equivalent elastic moduli of the saturated rock of tight sandstones. Rock physical modeling is calibrated, and the reliability of the rock physical model is verified by comparing those with the logging data. Afterward, the empirical relationship of rock porosity established from CT images and rock elastic moduli is obtained, and then, the elastic parameters obtained by seismic data inversion are converted into porosity parameters by using this empirical relationship. Finally, the porosity prediction of large-scale reservoirs in the study area is realized to figure out the distribution of gas reservoirs with high porosity. The results show that the H3b and H3c sections of the study area exhibit higher porosity than H3a. For the H3b reservoir, the northeast and middle areas of the gas field are potential targets since their porosity is larger than that of others, from 10% to 20%. Because of the effects of the provenance from the east direction, the southeast region of the H3c reservoir exhibits higher porosity than others.
Digital rock physics (DRP) is an important platform for the characterization of pore systems and minerals and numerical simulations of rock physics which can involve solid mechanics, acoustics, electricity, fluid mechanics, and fluid–solid coupling numerical simulation (Lin et al., 2018; Wu et al., 2018). Compared with the rock physics experiments, DRP, as a numerical simulation method, is cheap and effective to obtain the various rock properties (Yang et al., 2021; Golparvar et al., 2018). At present, 3D digital rocks have been used to evaluate the porosity and analyze the pore radius and connectivity (Anselmetti et al., 1998; Jadoon et al., 2016; Wu et al., 2019a), elastic moduli (Hossain et al., 2019; Miao et al., 2015), permeability (Wu et al., 2019b; Nie et al., 2016), and electrical properties. It is important to construct accurate digital rocks for the simulation of rock physical properties (Wei et al., 2018; Wu et al., 2020a). Digital rocks can be constructed by computed tomography (CT) experiments and stochastic modeling methods, such as multiple-point statistics and simulated annealing (Laird and Putnam, 1951). Among them, X-ray CT is the most widely used physical experiment method to construct 3D digital rocks (Wu et al., 2018). CT scanning is a non-destructive imaging method and can be used to obtain the internal spatial structure of rocks without any damage because it directly scans the core sample to obtain the required 2D gray slice data and then generates the 3D digital model of the core samples through mathematical transformation and image processing methods (Zhu et al., 2019; Nie 2014; Wu et al., 2019c). The acquired CT images usually contain mineral information since different minerals exhibit different gray values on CT images (Wu et al., 2020b; Wang et al., 2021). For example, Ma et al. (2019) obtained the relevant information and distribution characteristics of various components of pyrite rocks, namely, minerals, matrix, and pores, by using CT images. Mao et al. (2022) realized the spatial distribution characteristics of different minerals in granite through the segmentation threshold of the CT gray image.
Rock physics is a bridge to connect the elastic properties of subsurface rocks with the physical properties of reservoirs and is the basis of reservoir prediction. Quantitative characterization of the relationship between elastic parameters such as rock bulk modulus and shear modulus, and physical parameters such as porosity, shale content, and water saturation play an important role in the field of geophysical research. It provides a reasonable rock physical model for seismic forward modeling and seismic inversion interpretation, thereby reducing the ambiguity of seismic interpretation (Mavko et al., 2009; Ba et al., 2017; Liu and Grana, 2018). Traditionally, rock physics studies are based on physical laboratory tests. However, because of the limitation of sample preparation and testing methods, the traditional rock physics research methods cannot fully meet the actual needs of oil and gas reservoir prediction. With the development of computer technology and the application of X-ray CT scanning technology in rock physics experiments, digital rock physics technology provides a new technical means for rock physics research (Zhao et al., 2016; Yin et al., 2015; Jian et al., 2020). Wang (2006) calculated the compressional and S-wave velocities of the formation in this area by selecting the differential equivalent medium model. In the process of calculation, the error between the observed P-wave velocity and the calculated P-wave velocity of the actual formation was minimized through continuous iterative processing (Hilpert and Miller, 2001), the elastic modulus parameters of the formation rock were obtained, and the relationship between the elastic modulus parameters and the P-wave and S-wave velocities was analyzed (Saenger and Bohlen., 2004). Shao (2009) obtained multiple mineral components through conventional logging data and obtained the equivalent elastic modulus of the formation by using the average mineral formula. Taking the P-wave velocity as the constraint condition, the S-wave velocity of the formation is calculated according to the model (Deng, 2009). The comparison between the calculated results and the measured results shows that the average relative error is about 5%, which indicates that the model has good adaptability in the study area (Zong et al., 2015). In the same year, Deng (2009) tested the P-wave and S-wave velocities of sandstone samples under simulated reservoir conditions. The adaptability of the contact cementation model to the sandstone samples in this area was analyzed and discussed (Zhao et al., 2016). Zhou (2010) sorted out the rock physics parameters obtained from the conversion of rock physics experimental data and conventional logging data and predicted the S-wave velocity of the study area by using the model, which is highly consistent with the actual S-wave velocity. It is proven that this method can effectively solve the problem of S-wave velocity prediction in the area lacking S-wave logging data (Zhu et al., 2017). Zhang et al. (2019) and Zhang et al. (2020a) pointed out that the reservoir can be better described based on the rock physical modeling of two-phase media, and the concept of critical porosity can also be used to establish the empirical relationship between the grain matrix and dry rock, providing parameters for fluid identification.
In this study, the 3D image analysis of micro-CT samples about tight sandstone is carried out to obtain information on the pore structure, mineral composition, and particle size distribution, and the rock physical model is established using these data. Tight sandstone rock physical modeling is mainly composed of a boundary average model, inclusion model, fluid replacement model, and so on. The equivalent elastic modulus of the rock mineral matrix is calculated by using the boundary average model of the V-R-H model, the dry rock matrix modulus is calculated by using the differential equivalent medium DEM model, then the pore is filled with fluid through the uniform saturation model, and the equivalent elastic modulus of saturated rock is calculated by using the Gassmann equation. This method can be used to estimate the equivalent modulus of saturated rock in a tight sandstone medium. Finally, the reliability of the rock physical model is verified, the empirical formula of porosity is established through the petrophysical relationship, and the prediction of porosity with seismic data is realized.
This study takes an offshore gas field in eastern China as the study area. The gas field is mainly structural oil and gas reservoirs with thick sandstone, but the physical properties of the reservoirs are generally tight and change rapidly, and the “sweet spot” of the reservoir plays an important role in controlling oil and gas productivity. The target interval in the study area is mainly the braided delta sedimentary system under the background of a shore-shallow lake, which mainly developed an underwater distributary channel, and sandstone is well developed with large thickness and wide distribution. There are three types of reservoirs, namely, medium-low porosity and medium–low-permeability reservoirs, extra-low-porosity and extra-low-permeability reservoirs, and medium-porosity and medium–high-permeability reservoirs locally. The oil and gas reservoirs in the study area are mainly controlled by structures, such as anticlinal gas reservoirs. The study area is dominated by sandstone with medium grain size. The lithology developed in the study area includes mudstone, siltstone, fine sandstone, medium-fine sandstone, coarse sandstone, argillaceous sandstone, and glutenite. The color of the sandstone is grayish-white, with fine grain size and medium sorting. The pore types in the study area mainly include residual intergranular pores, intergranular dissolved pores, intragranular dissolved pores, and moldic pores. The intergranular dissolved pore is the most common pore type in the reservoir of the study area.
The physical properties of tight sandstone reservoirs are generally poor, and the coexistence of medium-low porosity and medium–low-permeability reservoirs and ultra-low-porosity and ultra-low-permeability reservoirs reflects strong reservoir heterogeneity (Radlinski et al., 2004; Hu et al., 2012; Bordignon et al., 2019; Liu and Mukerji, 2022). It is necessary to build a rock physical model of tight sandstone under heterogeneous conditions. With the increase of the burial depth, the tight sandstone in the middle and deep layers tends to be densified due to strong compaction and cementation. However, because of the influence of heterogeneity, high-quality reservoirs with good porosity and permeability characteristics will appear in local areas, namely, “sweet spots” (Bloch et al., 2002; Mavko et al., 2009).
To carry out rock physical modeling of heterogeneous tight sandstone reservoirs, it is necessary to analyze the structural characteristics of the “sweet spot” reservoir, including rock mineral composition and pore structures. During the process of sedimentation and diagenesis, rocks have experienced tectonism, sedimentation, diagenesis environments, and their matching process in time and space. For example, Figure 1 shows the core photos and casting thin sections of the “sweet spot” reservoir and the “non-sweet spot” reservoir. The “sweet spot” reservoir is different from the “non-sweet spot” reservoir in terms of rock mineral grain size, pore type, structure, etc., and the “sweet spot” reservoir exhibits coarser grain size and higher porosity.
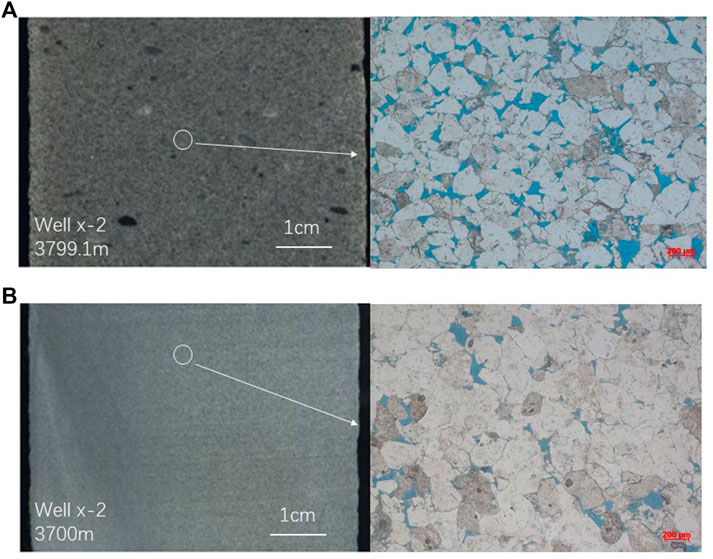
FIGURE 1. Core image and pore structure slice of the tight sandstone reservoir. (A) “Sweet spot” reservoir and (B) “non-sweet spot” reservoir.
The research process adopted in this study is shown in Figure 2. First, the mineral composition and corresponding volume ratio of rocks in the study area are obtained through digital core analysis and then the rock physical model is established with these data as the input data. The equivalent elastic modulus of the rock mineral matrix is calculated by the boundary average model of the V-R-H model, and the dry rock skeleton containing minerals and pore modulus is calculated by the differential equivalent medium DEM model. Then the equivalent elastic modulus of saturated rock is calculated by the Gassmann equation with the homogeneous saturated model filled with fluid in the pores, to realize the estimation of the equivalent modulus of saturated tight sandstone and establish the rock physical model of tight sandstone digital rock. The rock physical model is calibrated and its reliability is verified through logging data, then the empirical relationship of the rock porosity established from CT images and rock elastic moduli is obtained, and the porosity parameters can be predicted from seismic data by using this empirical relationship.
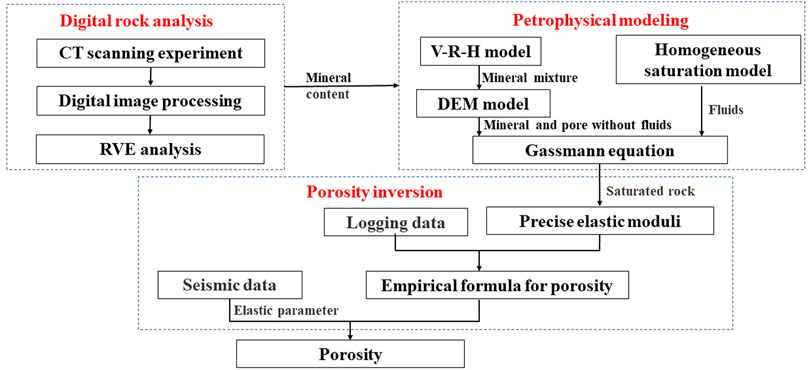
FIGURE 2. Flow chart of porosity prediction based on seismic data by rock physical modeling.
The construction of 3D digital rocks containing the real pore structure of complex reservoir rocks is the first step of DRP (Markus et al., 2001). The projection data obtained by X-ray CT scanning is used to reconstruct the 3D gray image of the core through the filtering (convolution) back-projection technique. The gray value of the image reflects the density of different parts of the rock slice (Das et al., 2017; Liu et al., 2022). The whiter the image (larger gray value), the higher the density, and the darker the image (smaller gray value), the lower the density. The gray value reflects the degree of X-ray absorption attenuation of the material. How to accurately divide the boundary between the skeleton and the pore is the key to calculating core porosity, pore structure parameters, and rock physical properties by using digital rock.
The modeling process of the X-ray CT scanning method can be summarized into three main steps, namely, CT scanning experiment, digital image processing, and RVE analysis.
CT scanning uses the X-ray CT scanning technique, which has the advantages of high imaging resolution, large scanning area, and no damage to the scanned sample. During the experiment, when the X-ray passes through the scanned rock sample, part of the energy of the X-ray will be absorbed by the rock sample and the energy and intensity of the X-ray will be weakened. This process can be expressed by Beer’s law as follows (Wildenschild and Sheppard, 2013; de Figueiredo et al., 2019):
In the formula,
In general, I and I0 are easily obtained in the formula, so that the linear attenuation factor µ can be calculated. This factor depends on the density of the scanned material, we can separate the components of different densities in the tested sample according to this technique. At present, there are many methods to convert the linear attenuation coefficient into an image. One of the most common methods is called filtered back-projection. It convolves the linear data obtained at each angle with a specific filter and then back-projects it at the same angle to obtain the image. The next step is image processing after obtaining the X-ray CT scan image (Wildenschild and Sheppard, 2013).
Image processing mainly includes the following processes: cropping, denoising, threshold segmentation, and REV (representative elementary volume) judgment. When the sample is cut, try to select the middle part of the scanned sample rather than the edges and corners. The purpose of denoising is to improve the signal-to-noise ratio of the image. There are many denoising algorithms, such as median filtering, non-local means filtering, sigma filtering, Nagao filtering, SNN filtering, majority filtering, recursive exponential filtering, bilateral filtering, and box filtering. The purpose of threshold segmentation is to identify and separate the object of study (such as the pore or oil phase) from the image. Based on the distribution characteristics of the gray value histogram, the relevant personnel then observe and judge by naked eyes and experience. This research object can be separated. The REV judgment is to determine if the cropped area is greater than the minimum volume representing the rock. For images with poor image quality, the process will also include morphological operations such as dilation, erosion, opening and closing, and removal of small objects. These image processing processes can be done based on software or programs such as ImageJ, Fiji, Matlab, PerGeos/Avizo, etc. Andrä et al. (2013) systematically discussed the issues that should be paid attention to during image processing.
In this study, six low-permeability sandstone reservoir samples with different depths are selected as the research objects, which are sequentially numbered as S1, S2, S3, S4, S5, and S6. They come from the third and fourth members of the Huagang Formation of the X-2 well in the Xihu Sag of the study area, and all of them belong to tight sandstone natural gas reservoirs. The sampling depths of samples S1–S6 are 3736.6 m, 3785 m, 3818.9 m, 3714.5 m, 3373.1 m, and 4008.3 m, respectively, the resolutions are 14.6 μm, 14.1 μm, 13.6 μm, 12.9 μm, 13.0 μm 8 μm, and 10.7 μm, respectively, and the sample size is 300
After the CT scan data volume is obtained, the original CT images containing gray information are cropped, denoised, and segmented and the REV is judged by using the image processing technique. During the process of threshold segmentation, pores and different minerals are separated according to different gray values. Figure 3 shows the image processing process of sample S2. In the original CT image, a smaller gray value corresponds to the pore and a smaller gray value is quartz, which is the main component of the rock. A larger gray value corresponds to feldspar, and the maximum gray value is clay. Therefore, CT images can be used to segment different mineral components.
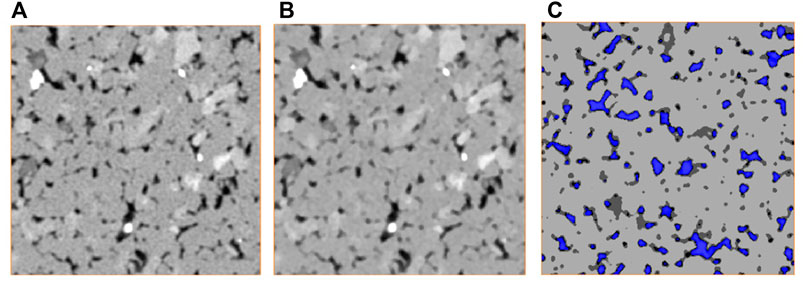
FIGURE 3. CT images before and after processing. (A) Original CT image; (B) CT image after filter; and (C) image after thresholding segmentation.
After selecting the REV of each sample and completing the image processing mentioned previously, the REV images of six samples can be constructed, as shown in Figure 4. It can be seen from the external and internal views of the six samples that there are more tiny pores in samples S2, S3, and S5, fewer pores in samples S1, S4, and S6, and the similarity between samples S2, S3, and S5 are higher.

FIGURE 4. Constructed digital rocks using CT.
The heterogeneous tight sandstone reservoir has medium–low porosity and medium–low permeability. (Cai et al., 2014; Avseth et al., 2014; Dutta et al., 2012) proposed a rock physical modeling method for medium–low-permeability tight rocks by analyzing the lithofacies type and burial history, that is, the CCT contact model is used to calculate the low porosity section (35%), while the HS upper limit is used to calculate the medium-porosity section (10%–35%) (He, 2017; Tang, 2011; Pan et al., 2019). In this study, considering the pore type and structure in the middle-low porosity and middle–low-permeability section, the DEM model and Gassmann equation, which are suitable for rock physical modeling of relatively high porosity, are used to calculate the equivalent rock physical model (Yin et al., 2017; Antariksa et al., 2022; Fawad and Mondol, 2022; Guo et al., 2016).
Tight sandstone rock physical modeling is mainly composed of a boundary average model, inclusion model, fluid replacement model, and so on (Figure 5). The boundary average model is used to calculate the equivalent elastic modulus of the rock mineral matrix, the inclusion model is used to calculate the dry rock matrix modulus, and the fluid replacement model is used to fill the fluid in the pores and calculate the equivalent elastic modulus of the saturated rock. In this way, the equivalent modulus of saturated rock in a tight sandstone medium can be estimated.
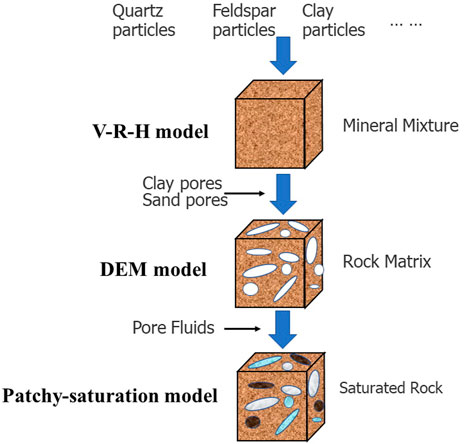
FIGURE 5. Flow chart of rock physical modeling of tight sandstone.
The boundary average model calculates the elastic modulus (generally refers to the bulk modulus and shear modulus) of the rock matrix of mixed minerals by calculating the upper and lower limits of the physical properties of the rock matrix. The Voigt-Reuss-Hill average is chosen as the boundary average model in this study. The boundary average model generally does not take into account the geometric structure of mineral components and other factors.
The Voigt-Reuss-Hill (VRH) average is the average of the Voigt and Reuss models (Voigt, 1907; Reuss, 1929). The Voigt model is the upper limit of the equivalent elastic modulus of rock
In the formula,
Averaging the two models, the elastic modulus of the rock matrix
The inclusion model can be used to estimate the equivalent elastic modulus of rock with solid or fluid inclusions. Many different types of inclusion models have been developed according to the differences in rock physics characteristics of specific study areas, such as the differential equivalent medium (DEM) (Bandyopadhyay, 2009), Kuster–Toksoz (KT) model (Kuster and Toksöz, 1974), Kachanov model, Mori–Tanaka model, linear slip model, etc. The fluid inclusion can be represented as the rock pore space, and the pore can be equivalent to an ellipsoid, which can be used to analyze the influence of the rock internal pore structure on rock properties.
The differential equivalent medium model (DEM) assumes that inclusions in rocks are isolated from each other and do not interact with each other. The DEM model divides the inclusions into infinitesimal parts, each part is then added to the background phase step by step, and the equivalent modulus is affected by the addition order of the inclusions. It should be noted that the order of soft and hard pore addition of dry rock has little effect on the final equivalent modulus results. The equivalent bulk modulus of the DEM model
where the initial condition is
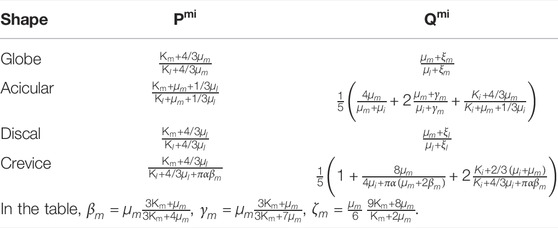
TABLE 1. P and Q coefficients of different shapes.
For different types of “sweet spot” reservoirs, the plaque-saturated model (Eqs 7–9) is used to calculate the elastic modulus of the mixed fluid.
In the formula,
The equivalent elastic modulus of saturated rock for different types of “sweet spot” reservoirs is calculated using the Gassmann formula (Shi, 2009) and the elastic modulus of saturated rock is used to calculate the compressional and S-wave velocities of tight sandstone reservoirs as follows:
Here,
According to the pore structure characteristics of different types of “sweet spot” reservoirs, the new rock physical model constructs the rock physical models of different types of “sweet spot” reservoirs, which can be well applied to tight sandstone reservoirs with large changes in porosity and permeability.
Pore refers to the basic reservoir space of fluid in rocks, and pore structure refers to the type, size, distribution, and connectivity of pores in rocks. The determination of pore structure parameters is the basis of calculating the equivalent elastic modulus of the tight sandstone skeleton.
The pore geometry in the tight sandstone is diverse and the pore structure is complex. It can be observed from the digital rock constructed by CT that the rocks in the study area mainly include primary intergranular pores, intragranular dissolution pores, and moldic pores. The pore structure of tight sandstone reservoirs is greatly affected by compaction, and the amount of primary pores is the key factor to determine the quality of the reservoir. Rock grain size, quartz content, and clay content are the main factors affecting the pore structure parameters. The larger the grain size is, the larger the primary pore will be, so that the residual intergranular pore and intergranular dissolution pore are larger under the same burial process and diagenesis. Quartz is the most important rigid mineral in clastic rocks which determines the ability of rocks to resist compaction, that is, the preservation of pores. Rock cuttings mainly composed of quartz also have strong compressibility. The clay content is mainly related to the irreducible water saturation, which is the key factor affecting the seepage. In the theory of rock physical modeling of tight sandstone, the primary intergranular pore has a large pore size and good connectivity. The intragranular dissolution pores are the dissolution pores of feldspar and rock debris, with small grain size and poor connectivity. The diameter of the casting mold hole is larger, but the connectivity is poor. The reservoir of the H3 member of the granite formation in the study area has many primary pores, large porosity, and relatively uniform pore fluid distribution.
The heterogeneity of the tight sandstone reservoir is the difference in porosity and permeability caused by the grain size of rock minerals and pore structure types between different formations. Therefore, according to the geological characteristics of the study area, using porosity as the division standard of natural gas “sweet spot,” aiming at the characteristics of medium–low-porosity and medium–low-permeability natural gas reservoirs, the rock physical model of heterogeneous tight sandstone is established. Based on the aforementioned reservoir characteristics, the basic idea of rock physics modeling is to use the effective medium theory to add flat pores (small pore aspect ratio) and more circular pores (large pore aspect ratio) based on isotropic background media and calculate the dry rock stiffness coefficient matrix. The elastic parameters of fluid-saturated rocks are estimated according to the isotropic replacement method. According to the digital rock analysis, the minerals of the tight sandstone reservoir in the study area mainly include quartz, feldspar, shale, and debris, among which quartz is the main component with high content. Because of the deep burial depth and complex diagenesis of the heterogeneous tight sandstone reservoir, the “sweet spot” reservoir has the petrological characteristics of coarse grain size, high quartz content, and low clay content. The grain size of rock minerals affects the pore structure of rocks, so the grain size difference is regarded as the difference in the pore structure of rocks.
The results of the digital rock (Table 2) show that the volume fraction of the rigid grains is about 70% for quartz, about 25% for feldspar, and about 5% for clay. Because the density of quartz and feldspar is not very different, it is difficult to distinguish and compare digital rock. However, the difference in elastic physical parameters between quartz and feldspar is not particularly large. Therefore, the influence on the accuracy of the rock physical model results is within an acceptable range. The pore types of tight sandstone reservoirs are divided into connected pores and unconnected pores, and a porosity of 12% is defined as the “sweet spot” of tight sandstone reservoirs. These input parameters (Table 3) can be used as the input data of the rock physical model. A rock physical model of heterogeneous tight sandstone is established and a series of analyses are carried out.
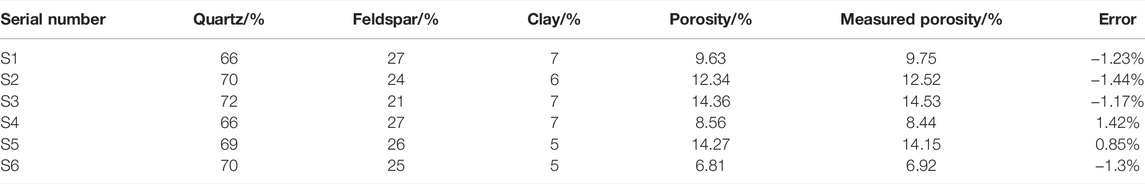
TABLE 2. Basic information of the six samples used in this study.
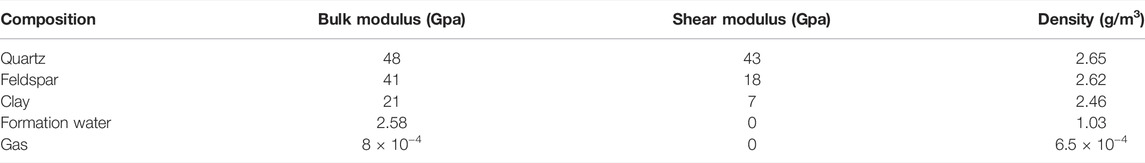
TABLE 3. Parameters of the mineral constituent and fluid of the model.
According to the experimental data of rock physics in the actual work area, the reliability of the rock physics model is verified. Figure 6 shows the comparison between the P-wave and S-wave velocity reconstruction results (blue) of the X-2 well based on the rock physical model and the actual rock physics experimental measurement data, and the relative error between the rock physics measurement results and the estimation results. It can be seen that the error between the rock physics model prediction value and the experimental measurement value is less than 3%, which indicates that the model prediction result can reflect the actual value with high accuracy, and the rock physics modeling result is more reliable.
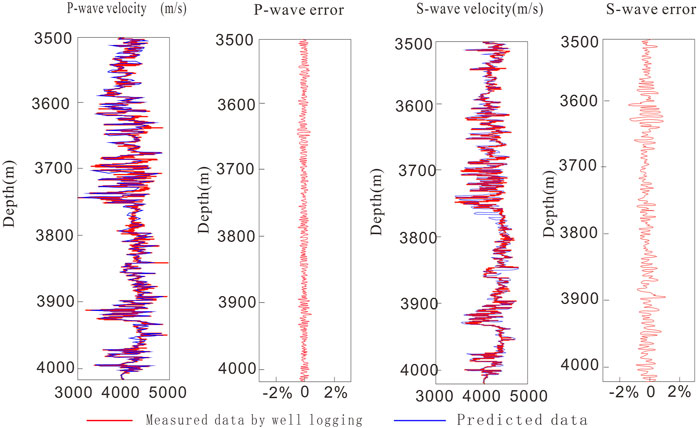
FIGURE 6. Reconstruction results and errors of P-wave and S-wave velocities based on the rock physical model.
The effect of porosity is studied based on the constructed rock physical model of thick and low-permeability reservoirs. Figure 7 shows the effect of the reservoir porosity on the volume and shear modulus of the “sweet spot” in the H3 section of well X-2. The curves with different colors indicate that the shale content increases gradually from top to bottom, and the blue points represent the data of the actual logging curve of the corresponding non-sweet spot reservoir. The red dots represent data from the actual log of the corresponding segment of the “sweet spot” reservoir. It can be seen from the figure that with the increase in porosity, the bulk modulus and shear modulus show a decreasing trend. Compared with the “sweet spot” data of actually good data, it is found that the porosity of the “sweet spot” reservoir is larger than that of the non-sweet spot reservoir. It is consistent with the changing trend of the rock elastic modulus calculated by the model, which confirms the reliability of the rock physics model.
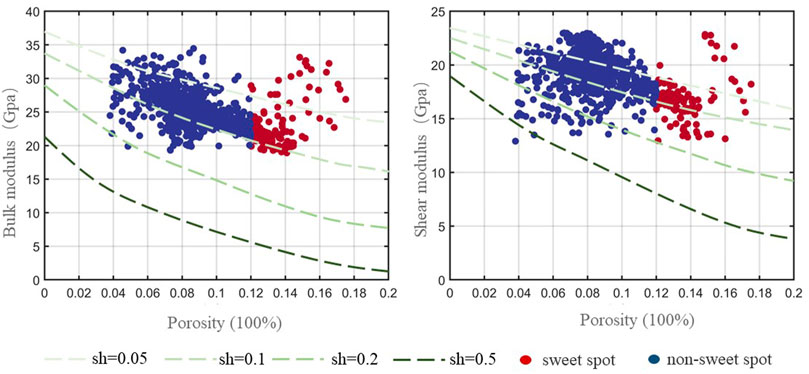
FIGURE 7. Influence of reservoir porosity of “sweet spot” in the H3 section of the X-2 well on the volume and shear modulus.
Using the constructed rock physical model, the quantitative interpretation version between reservoir physical parameters and elastic parameters can be established, which can be used to predict reservoir parameters. Figure 8 shows the the rock physics version of the reservoir in the H3 section of the x gas field.
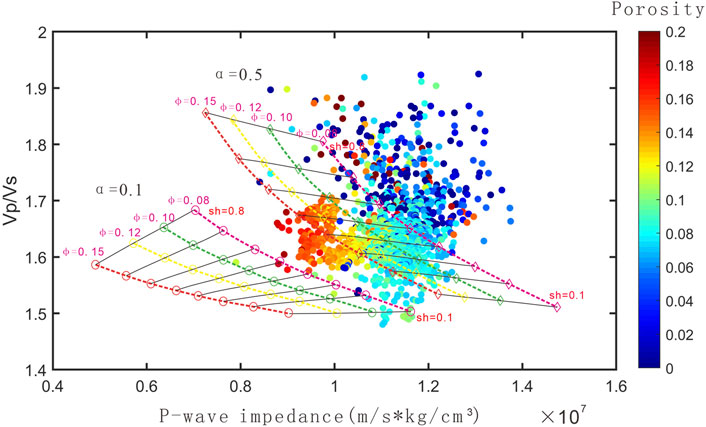
FIGURE 8. Rock physics quantification of section H3 in Donghai X gas field.
The physical property parameter prediction method based on linearized rock physics inversion applies to linear or slightly nonlinear rock physical models (Zhang et al., 2020b; Pan et al., 2021). For the highly nonlinear rock physical model, the empirical formula method is used to predict the porosity (Zong and Yin, 2017; Chen et al., 2017; Pan et al., 2017; Liu et al., 2022). It is to obtain a statistical empirical relationship between porosity and rock elastic parameters (such as P-wave velocity, S-wave velocity, density, and elastic impedance) by using rock physics test data and logging data and then use this statistical empirical relationship to convert the elastic parameters obtained by seismic inversion into porosity parameters.
According to the rock physics version, the fitting formula for porosity prediction is
In the formula,
In this study, we used the high signal-to-noise ratio seismic data processed by a contractor. After processing, the pre-stack AVO inversion approach was implemented to estimate the elastic parameters (P-wave velocity, S-wave velocity, and density). Figures 9A,B show the inversion result of P-wave impedance and the estimated sensitive parameter
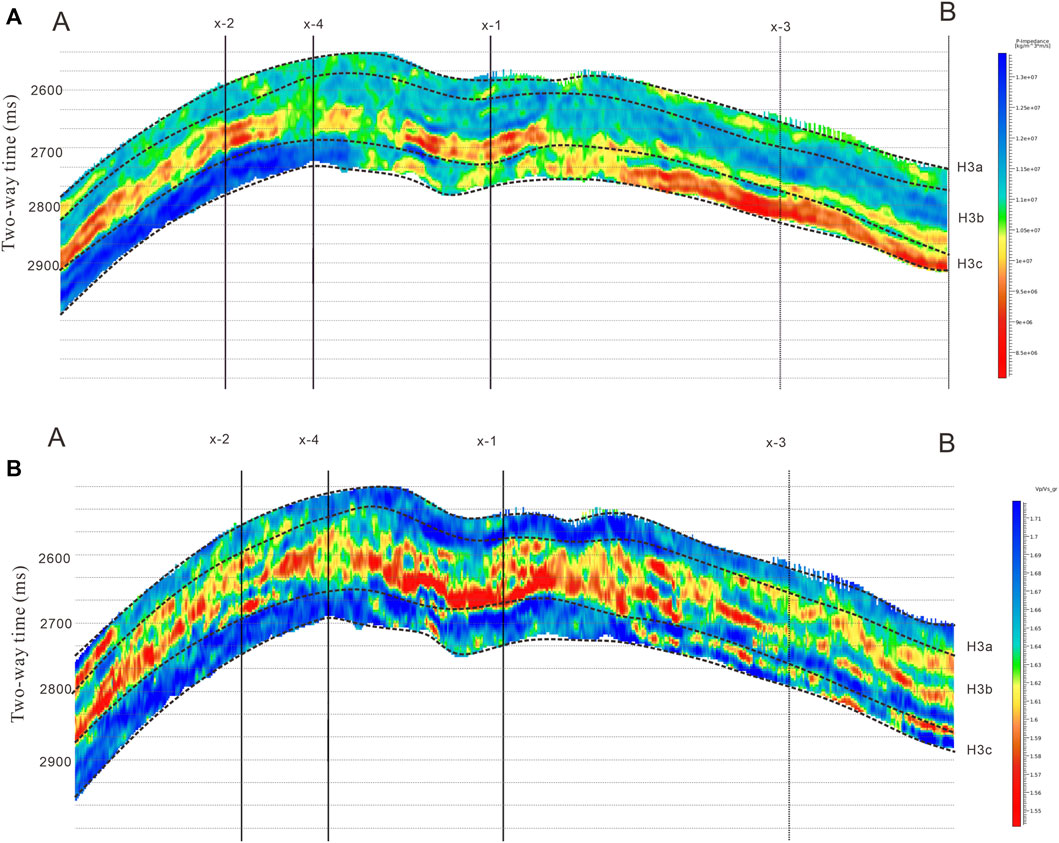
FIGURE 9. Well-tie section for P-wave impedance and the sensitive parameter
H3 has three sand bodies of H3a, H3b, and H3c (Figure 10), and the porosity of each sand body is predicted separately. Figure 11 shows the well-tie profile of H3a porosity prediction, in which the top and bottom of H3a are marked with interpretation horizons. It can be seen from the figure that the porosity of the H3a reservoir is higher than that of the upper and lower mudstone formations, which is consistent with the reservoir (lithology) prediction results. At the same time, the H3a porosity profile reflects the distribution characteristics of the H3a reservoir. That is to say, the reservoir is relatively thin, but the distribution is relatively uniform, and the reservoir is slightly thicker at well X-1. The porosity of H3b is higher than that of the upper and lower mudstone formations and the H3a reservoir, and it is a high-porosity thick reservoir, which is consistent with the prediction results of the H3b thick sand reservoir. The porosity of H3c near well X-3 and well X-1 is higher, while the porosity near well X-2 is lower, which is consistent with the prediction results of the H3c thick sand reservoir.
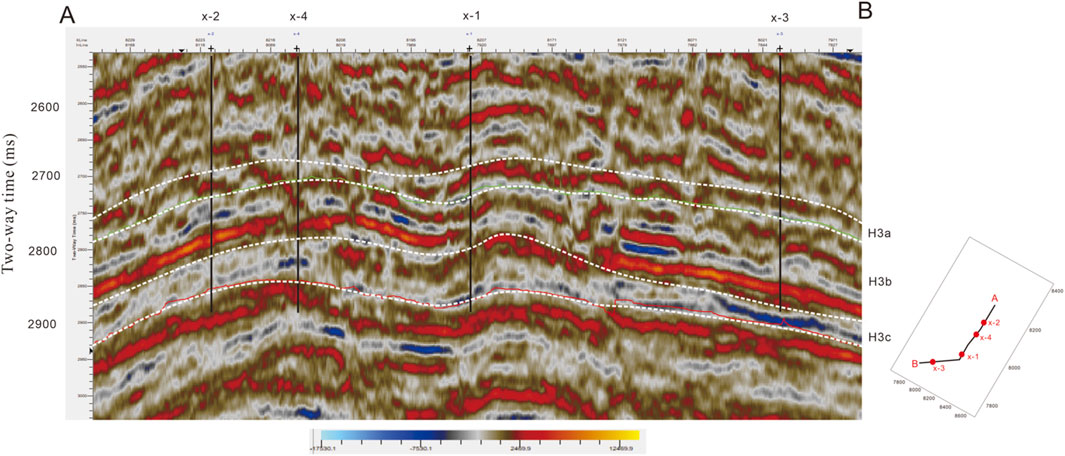
FIGURE 10. Original seismic profile of well-tie in the study area.
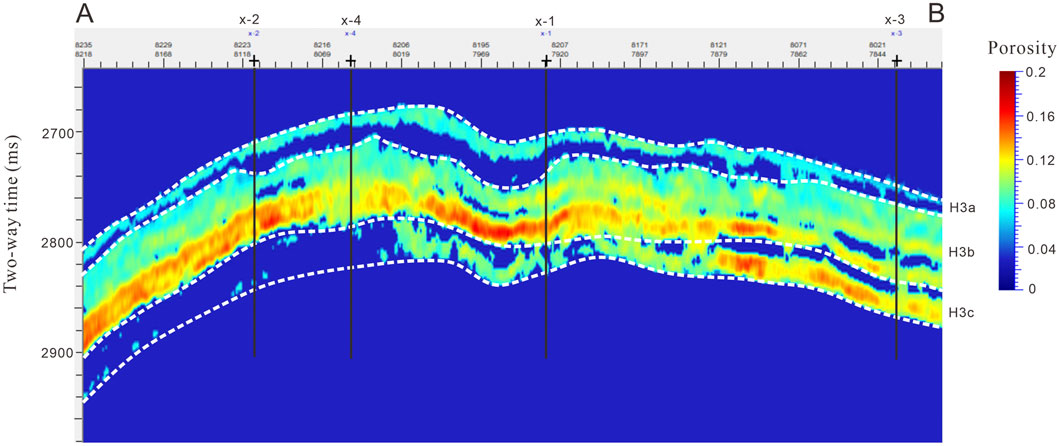
FIGURE 11. Well-tie section for porosity prediction in the study area.
Figure 12 shows the attribute map of the average porosity of H3a, which is also similar to the plane distribution law of the H3a reservoir (lithology). From the attribute map, it can be seen that the porosity in the middle and northwest of the gas field is relatively high, with an average porosity of about 5%–8%, while the porosity in other areas is relatively small, with an average porosity of less than 5%. The average porosity of sandstone in the gas-bearing area changes relatively fast.
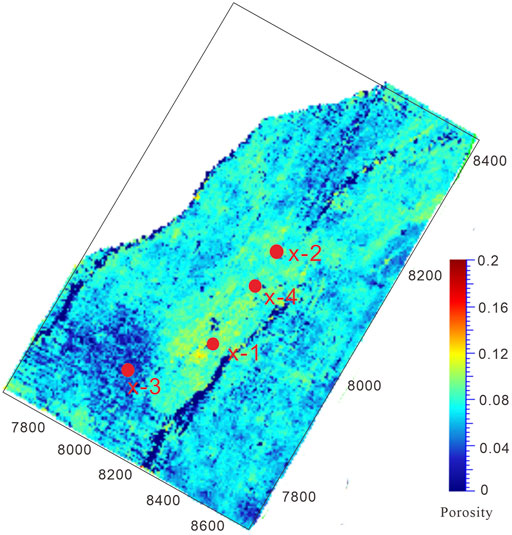
FIGURE 12. Average attribute map of H3a porosity along with the layer.
Figure 13 reveals the attribute map of the average value of H3b porosity, which is also similar to the plane distribution law of the H3b reservoir (lithology). The porosity in the northeast and middle parts of the gas field is relatively high, which can reach 18%–20%, while the porosity in the southwest part is relatively low, with an average porosity of 8%–12%. The average porosity of the sandstone in the gas-bearing area does not change much.
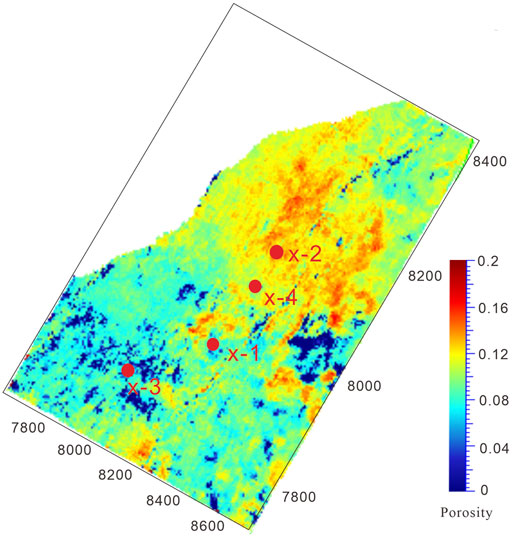
FIGURE 13. Average attribute map of H3b porosity along with the layer.
Figure 14 displays the attribute map of the average value of H3c porosity, which is also similar to the plane distribution law of the H3c reservoir (lithology). The porosity of the gas field shows a trend of high in the south and low in the north. The average porosity in the south of the gas field is around 7.5%–12%, while the average porosity in the north is less than 3%. The average porosity of sandstone in the gas-bearing area changes relatively fast and decreases gradually from south to north.
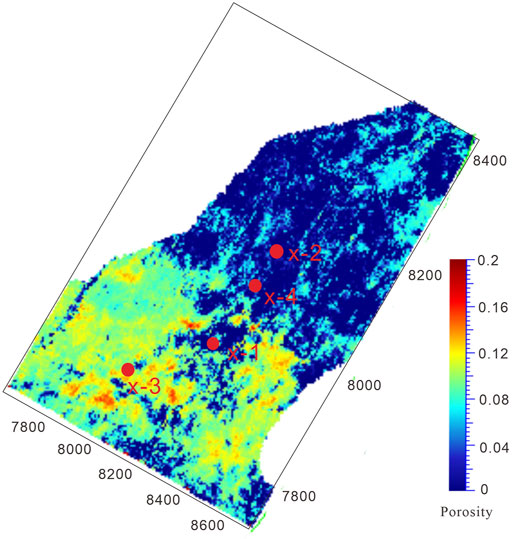
FIGURE 14. H3c porosity average value attribute map of porosity along with the layer.
The results of the porosity prediction are very consistent with the sedimentary background of the study area. In the H3a period, the hydrodynamic is weak, the mudstone is developed in the study area, and the overall porosity is low. During the H3b period, the high-energy braided channel was mainly developed in the northeast region of the study area, with abundant and coarse-grained sediments. Influenced by the resistance of lake water, the southern waterway of the study area cannot be cut down, the grain size of sediments becomes smaller, and the thickness of sandstone becomes thinner. The low-energy braided channel is developed, which is consistent with the prediction results of porosity in the study area. During the H3c period, there was a provenance in the east of the study area. Affected by the water system from the southeast, the low-energy braided channel is mainly developed in the study area, and the sediments are mainly fine sandstones and become thinner and pinched out northward.
The results of the digital rock constructed using CT show that the rigid grain quartz accounts for about 70% by volume, the feldspar occupies about 25% by volume, and the clay minerals account for about 5%, which can be used as input data for rock physical modeling to establish the rock physical model of heterogeneous tight sandstone.
Tight sandstone rock physical modeling is mainly composed of a boundary average model, inclusion model, and fluid replacement model. The boundary average model is used to calculate the equivalent elastic modulus of the rock mineral matrix, the inclusion model is used to calculate the dry rock matrix modulus, and the fluid replacement model is used to fill the fluid in the pores and calculate the equivalent elastic modulus of the saturated rock. In this way, the equivalent modulus of saturated rock in a tight sandstone medium can be estimated. The error between the rock physical model prediction and the experimental measurement is less than 3%, which reveals that the model prediction results can reflect the actual value with high accuracy, and the rock physical modeling results are more reliable.
The porosity of the whole reservoir is predicted based on seismic data through rock physical modeling. The average porosity of the H3a reservoir is about 5%–8%, the reservoir is thin and evenly distributed, and the porosity in the middle and northwest regions of the gas field is relatively high. The reservoir of well X-1 is slightly thicker. The porosity of the H3b reservoir is higher than that of the upper and lower mudstone formations and H3a reservoir, with a maximum of 18%–20% and an average porosity of 8%–12%. It is a thick reservoir with high porosity, relatively high porosity in the northeast and middle regions of the gas field, and relatively low porosity in the southwest. On the whole, the porosity of H3c is higher in the south and lower regions in the north. The porosity is higher near well X-3 and well X-1, and lower near well X-2. The average porosity in the south of the gas field is between 7.5% and 12%, and the average porosity in the north is less than 3%.
The datasets presented in this study can be found in online repositories. The names of the repository/repositories and accession number(s) can be found in the article/Supplementary Material.
WG: investigation, methodology, writing—original draft, and data analysis. CL: supervision and writing—review and editing. CD: supervision and writing—review and editing. YW: writing—original draft, and processing the data. XZ: methodology. JL: writing—review and editing.
This study was funded by the Joint Fund Projects (NO.U19B2006), the Natural Science Foundation of China (U19B200129), the Support Program of China Postdoctoral Innovative Talents (Grant No. BX2021373), and Fundamental Research Funds for the Central Universities (Grant Nos. 22CX06006A and 19CX02001A).
The authors declare that the research was conducted in the absence of any commercial or financial relationships that could be construed as a potential conflict of interest.
All claims expressed in this article are solely those of the authors and do not necessarily represent those of their affiliated organizations, or those of the publisher, the editors, and the reviewers. Any product that may be evaluated in this article, or claim that may be made by its manufacturer, is not guaranteed or endorsed by the publisher.
Special thanks go to Shikai Jian, You Zhou, Rui Yang, and Yage Wang of China University of Petroleum (East China) for their constructive suggestions and for revising the manuscript. The discussion with them has played a positive role in this research and article writing.
Andrä, H., Combaret, N., Dvorkin, J., Glatt, E., Han, J., Kabel, M., et al. (2013). Digital Rock Physics Benchmarks-Part I: Imaging and Segmentation. Comput. Geosciences 50, 25–32. doi:10.1016/j.cageo.2012.09.005
Anselmetti, F. S., Luthi, S., and Eberli, G. P. (1998). Quantitative Characterization of Carbonate Pore Systems by Digital Image Analysis[J]. AAPG Bull. 82 (10), 1815–1836.
Antariksa, G., Muammar, R., and Lee, J. (2022). Performance Evaluation of Machine Learning-Based Classification with Rock-Physics Analysis of Geological Lithofacies in Tarakan Basin, Indonesia. J. Petroleum Sci. Eng. 208, 109250. doi:10.1016/j.petrol.2021.109250
Avseth, P., Johansen, T. A., Bakhorji, A., and Mustafa, H. M. (2014). Rock-physics Modeling Guided by Depositional and Burial History in Low-To-Intermediate-Porosity Sandstones. Geophysics 79 (2), D115–D121. doi:10.1190/GEO2013-0226.1
Ba, J., Xu, W., Fu, L.-Y., Carcione, J. M., and Zhang, L. (2017). Rock Anelasticity Due to Patchy Saturation and Fabric Heterogeneity: A Double Double-Porosity Model of Wave Propagation. J. Geophys. Res. Solid Earth 122 (3), 1949–1976. doi:10.1002/2016JB013882
Bandyopadhyay, K. (2009). Seismic Anisotropy: Geological Causes and its Implications to Reservoir Geophysics [D]. Stanford University.
Bloch, S., Lander, R. H., and Bonnell, L. (2002). Anomalously High Porosity and Permeability in Deeply Buried Sandstone Reservoirs: Origin and Predictability[J]. AAPG Bull. 86 (2), 301–328. doi:10.1306/61EEDABC-173E-11D7-8645000102C1865D
Bordignon, F., de Figueiredo, L. P., Exterkoetter, R., Barbosa Rodrigues, B., and Duarte, M. (2019). Deep Learning for Grain Size and Porosity Distributions Estimation on Micro-CT Images. Proceedings of the 16th International Congress of the Brazilian Geophysical Society and Expogef. doi:10.22564/16cisbgf2019.209
Cai, J., Perfect, E., Cheng, C. L., and Hu, X. Y. (2014). Generalized Modeling of Spontaneous Imbibition Based on Hagen-Poiseuille Flow in Tortuous Capillaries with Variably Shaped Apertures[J]. Langmuir 30 (18), 5142–5151. doi:10.1021/la5007204
Chen, H., Zhang, G., Chen, T., and Yin, X. (2017). Joint PP- and PSV-Wave Amplitudes versus Offset and Azimuth Inversion for Fracture Compliances in Horizontal Transversely Isotropic Media[J]. Geophys. Prospect. 66, 561–578. doi:10.1111/1364-2478.12567
Das, P. K., Mandal, N., and Arya, A. (2017). Effects of Cation Ordering on the Elastic and Electronic Properties of Mg-Fe Silicate Phases at High Pressures[J]. J. Appl. Phys. 122 (22), 225107. doi:10.1063/1.500188410.1111/1365-2478.12567
de Figueiredo, L. P., Bordignon, F., Exterkoetter, R., Barbosa Rodrigues, B., and Duarte, M. (2019). Deep 3D Convolutional Neural Network Applied to CT Segmented Image for Rock Properties Prediction[J]. Seg. Tech. Program Expand. Abstr. 2019. doi:10.1190/segam2019-3216835.1
Deng, J. (2009). Effect of Cement on Seismic Elastic Properties of Reservoir Sandstone [J]. J. Petroleum Nat. Gas 31 (4), 238–242. doi:10.1007/978-1-4020-2402-3_50
Dutta, R., and Mandal, N. (2012). Effects of Pressure on the Elasticity and Stability of Zircon (ZrSiO4): First-Principle Investigations. Comput. Mater. Sci. 54, 157–164. doi:10.1016/j.commatsci.2011.09.035
Fawad, M., and Mondol, N. H. (2022). Monitoring Geological Storage of CO2 Using a New Rock Physics Model[J]. Sci. Rep. 12 (1), 1–11. doi:10.1038/s41598-021-04400-7
Golparvar, A., Zhou, Y., Wu, K., Ma, J., and Yu, Z. (2018). A Comprehensive Review of Pore Scale Modeling Methodologies for Multiphase Flow in Porous Media. Adv. Geo-Energy Res. 2 (4), 418–440. doi:10.26804/ager.2018.04.07
Guo, J., and Han, X. (2016). Rock Physics Modelling of Acoustic Velocities for Heavy Oil Sand. J. Petroleum Sci. Eng. 145, 436–443. doi:10.1016/j.petrol.2016.05.028
He, F. (2017). Study on Rock Physical Model of Tight Sand Considering the Effect of Pore Fluid [D]. Qingdao: China University of Petroleum.
Hilpert, M., and Miller, C. T. (2001). Pore-morphology Based Simulation of Drainage in Totally Wetting Porous Media[J]. Adv. Water Resour. 24 (3-4), 243–255. doi:10.1016/s0309-1708(00)00056-7
Hossain, M. M., Arns, J. Y., and Liang, Z. (2019). Humidity Effects on Effective Elastic Properties of Rock: An Integrated Experimental and Numerical Study. Journal of Geophysical Research: Solid Earth 124 (8), 7771–7791. doi:10.1029/2019JB017672
Hu, Z., Li, Y., Huang, S., Lv, J., and Zhu, B. (2012). Research Progress on Destruction and Preservation Mechanism of Primary Pores in Sandstone Reservoirs [J]. Prog. Earth Sci. 27 (01), 14–25. doi:10.1007/s13202-020-01042-9
Jadoon, Q. K., Roberts, E., Blenkinsop, T., Wust, R. A. J., and Shah, S. A. (2016). Petrophysical Evaluation and Uncertainty Analysis of Roseneath and Murteree Shales Reservoirs in Cooper Basin, Australia (A Case Study). J. Petroleum Sci. Eng. 147, 330–345. doi:10.1016/j.petrol.2016.06.010
Jian, S., Fu, L., Wang, Z., Han, T. C., and Li, J. I. (2020). Elastic Equivalent Numerical Modeling Based on the Dynamic Method of Longmaxi Formation Shale Digital Rock[J]. Chin. J. Geophys. 63 (7), 2786–2799. doi:10.6038/cjg2020N0312
Kuster, G. T., and Toksöz, M. N. (1974). Velocity and Attenuation of Seismic Waves in Two‐phase Media: Part I. Theoretical Formulations. Geophysics 39 (5), 587–606. doi:10.1190/1.1440450
Laird, A. D. K., and Putnam, J. A. (1951). Fluid Saturation in Porous Media by X-Ray Technique. Pet. Trans. AIME 3, 275–284. doi:10.2118/951275-g
Lin, C., Wu, Y., and Ren, L. (2018). Review of Digital Rock Modeling Methods[J]. Prog. Geophys. 33 (2), 0679–0689. doi:10.6038/pg2018BB0335
Liu, M., Grana, D., and de Figueiredo, L. P. (2022). Uncertainty Quantification in Stochastic Inversion with Dimensionality Reduction Using Variational autoencoderUncertainty Quantification in Stochastic Inversion with Dimensionality Reduction Using Variational Autoencoder[J]. Geophysics 87 (2), M43–M58. doi:10.1190/geo2021-0138.1
Liu, M., and Grana, D. (2018). Stochastic Nonlinear Inversion of Seismic Data for the Estimation of Poroelastic Properties Using the Ensemble Smoother and Data Reparameterization[J]. Geophysics 83 (3), M25–M39. doi:10.1190/geo2017-0713.1
Liu, M., and Mukerji, T. (2022). Multiscale Fusion of Digital Rock Images Based on Deep Generative Adversarial Networks. Geophys. Res. Lett. 49, e2022GL098342. doi:10.1029/2022GL098342
Ma, Z., Zuo, Y., Lu, C., and Miao, X. (2019). Application of Computed Tomography (CT) in the Observation of Meso-Structure of Minerals and Rocks [J]. Miner. Metall. Process. 48 (3), 4–8. doi:10.1016/j.jngse.2020.103591
Mao, W., Lv, Q., Peng, Y. U., and Liu, J. (2022). Analysis of Mineral Composition and Meso-Structure of Granite Using CT Images[J]. J. Eng. Geol. 30 (1), 216–222. doi:10.13544/j.cnki.jeg.2020-121
Markus, H., and Cass, T. M. (2001). Pore-Morphology-Based Simulation of Drainage in Totally Wetting Porous Media. Advances in Water Resources 24, 243–255. doi:10.1016/S0309-1708(00)00056-7
Mavko, G., Mukerji, J., and Dvorkin, J. (2009). The Rock Physics Handbook. Second Edition. Cambridge: Tools for Seismic Analysis of Porous MediaCambridge University Press.
Miao, T., Yu, B., Duan, Y., and Fang, Q. (2015). A Fractal Analysis of Permeability for Fractured Rocks. Int. J. Heat Mass Transf. 81, 75–80. doi:10.1016/j.ijheatmasstransfer.2014.10.010
Nie, X. (2014). Research on Digital Rock Modeling and Conductivity Numerical Simulation of Shale Gas Reservoir Rock[D]. Beijing: China University of Geosciences.
Nie, X., Zou, C., Li, Z., Meng, X., and Qi, X. (2016). Numerical Simulation of the Electrical Properties of Shale Gas Reservoir Rock Based on Digital Core[J]. J. Geophys. Eng. 13 (4), 481–490. doi:10.1088/1742-2132/13/4/481
Pan, G., Liang, L., and Habashy, T. M. (2019). A Numerical Study of 3D Frequency-Domain Elastic Full-Waveform Inversion. Geophysics 84, R99–R108. doi:10.1190/geo2017-0727.1
Pan, X., Zhang, G., and Yin, X. (2017). Azimuthally Anisotropic Elastic Impedance Inversion for Fluid Indicator Driven by Rock Physics. Geophysics 82, C211–C227. doi:10.1190/geo2017-0191.1
Pan, X., Zhang, P., Zhang, G., Guo, Z., and Liu, J. (2021). Seismic Characterization of Fractured Reservoirs with Elastic Impedance Difference versus Angle and Azimuth: A Low-Frequency Poroelasticity Perspective. Geophysics 86, M123–M139. doi:10.1190/geo2020-0492.1
Radlinski, A. P., Ioannidis, M. A., Hinde, A. L., Hainbuchner, M., Baron, M., Rauch, H., et al. (2004). Angstrom-to-millimeter Characterization of Sedimentary Rock Microstructure. J. Colloid Interface Sci. 274 (2), 607–612. doi:10.1016/j.jcis.2004.02.035
Reuss, A. (1929). Berechnung der Fließgrenze von Mischkristallen auf Grund der Plastizitätsbedingung für Einkristalle. Z. angew. Math. Mech. 9, 49–58. doi:10.1002/zamm.19290090104
Saenger, E. H., and Bohlen, T. (2004). Finite‐difference Modeling of Viscoelastic and Anisotropic Wave Propagation Using the Rotated Staggered Grid. Geophysics 69 (2), 583–591. doi:10.1190/1.1707078
Shao, C. (2009). Inversion of S-Wave Velocity Based on Rock Physics and Multi-Mineral Analysis Using Conventional Logging Data [J]. J. China Univ. Geosci. 34 (4), 699–707.
Shi, Y. (2009). Fluid Substitution Based on Gassmann Equation [D]. Chengdu: Chengdu University of Technology.
Tang, X. (2011). Unified Theory of Elastic Wave Propagation in Porous and Fractured Media — Extension of Biot's Theory [J]. Sci. China Earth Sci. 41 (6), 784–795. doi:10.1007/s11430-011-4245-7
Voigt, W. (1907). Bestimmung der Elastizitätskonstanten von Eisenglanz. Ann. Phys. 327, 129–140. doi:10.1002/andp.19063270108
Wang, Y. (2006). Reservoir Identification Method Based on Rock Physical Simulation of Logging Data [J]. Geophys. Prospect. 41 (6), 644–650.
Wang, Y., Shabaninejad, M., and Armstrong, P. (2021). Deep Neural Networks for Improving Physical Accuracy of 2D and 3D Multi-Mineral Segmentation of Rock Micro-CT Images[J]. Appl. Soft Comput. 104, 107185. doi:10.1016/j.asoc.2021.107185
Wei, Y., Nie, X., Jin, L., Zhang, C., Xhang, C., and Zhang, Z. (2018). Investigation of Sensitivity of Shale Elastic Properties to Rock Components Based on a Digital Core Technology and Finite Element Method[J]. Arab. J. Geosci. 11, 1–14. doi:10.1007/s12517-018-3576-5
Wildenschild, D., and Sheppard, A. P. (2013). X-ray Imaging and Analysis Techniques for Quantifying Pore-Scale Structure and Processes in Subsurface Porous Medium Systems. Adv. Water Resour. 51, 217–246. doi:10.1016/j.advwatres.2012.07.018
Wu, Y., Lin, C., Ren, L., Yan, W., An, S., Chen, B., et al. (2018). Reconstruction of 3D Porous Media Using Multiple-point Statistics Based on a 3D Training Image. J. Nat. Gas Sci. Eng. 51, 129–140. doi:10.1016/j.jngse.2017.12.032
Wu, Y., Tahmasebi, P., Lin, C., and Dong, C. (2019c). Process-based and Dynamic 2D Modeling of Shale Samples: Considering the Geology and Pore-System Evolution[J]. Int. J. Coal Geol. 218, 103368. doi:10.1016/j.coal.2019.103368
Wu, Y., Tahmasebi, P., Lin, C., and Dong, C. (2020a). A Comprehensive Investigation of the Effects of Organic-Matter Pores on Shale Properties: A Multicomponent and Multiscale Modeling. J. Nat. Gas Sci. Eng. 81, 103425. doi:10.1016/j.jngse.2020.103425
Wu, Y., Tahmasebi, P., Lin, C., Munawar, M. J., and Cnudde, V. (2019a). Effects of Micropores on Geometric, Topological and Transport Properties of Pore Systems for Low-Permeability Porous Media. J. Hydrol. 575, 327–342. doi:10.1016/j.jhydrol.2019.05.014
Wu, Y., Tahmasebi, P., Lin, C., Zahid, M. A., Dong, C., Golab, A. N., et al. (2019b). A Comprehensive Study on Geometric, Topological and Fractal Characterizations of Pore Systems in Low-Permeability Reservoirs Based on SEM, MICP, NMR, and X-Ray CT Experiments. Mar. Pet. Geol. 103, 12–28. doi:10.1016/j.marpetgeo.2019.02.003
Wu, Y., Tahmasebi, P., Yu, H., Lin, C., Wu, H., and Dong, C. (2020b). Pore‐Scale 3D Dynamic Modeling and Characterization of Shale Samples: Considering the Effects of Thermal Maturation. J. Geophys. Res. Solid Earth 125 (1), e2019JB018309. doi:10.1029/2019JB018309
Yang, Y., Zhou, Y., Blunt, M. J., Yao, J., and Cai, J. (2021). Advances in Multiscale Numerical and Experimental Approaches for Multiphysics Problems in Porous Media. Adv. Geo-Energy Res. 5 (3), 233–238. doi:10.46690/ager.2021.03.01
Yin, X., Zheng, Y., and Zong, Z. (2017). Research on the Equivalence between Digital Core and Rock Physics Models. J. Geophys. Eng. 14 (3), 666–674. doi:10.1088/1742-2140/aa6650
Yin, X., Zong, Z., and Wu, G. (2015). Research on Seismic Fluid Identification Driven by Rock Physics. Sci. China Earth Sci. 58 (2), 159–171. doi:10.1007/s11430-01404992-3
Zhang, J.-J., Zhang, G.-Z., and Huang, L.-H. (2019). Crack Fluid Identification of Shale Reservoir Based on Stress-dependent Anisotropy. Appl. Geophys. 16 (2), 209–217. doi:10.1007/s11770-019-0754-5
Zhang, J., Yin, X., Zhang, G., Gu, Y., and Fan, X. (2020b). Prediction Method of Physical Parameters Based on Linearized Rock Physics Inversion. Pet. Explor. Dev. 47 (1), 59–67. doi:10.1016/s1876-3804(20)60005-2
Zhang, J., Yin, Y., and Zhang, G. (2020a). Rock Physics Modelling of Porous Rocks with Multiple Pore Types: a Multiple‐porosity Variable Critical Porosity Model. Geophys. Prospect. 68, 955–967. doi:10.1111/1365-2478.12898
Zhao, L., Qin, X., Han, D.-H., Geng, J., Yang, Z., and Cao, H. (2016). Rock-physics Modeling for the Elastic Properties of Organic Shale at Different Maturity Stages. Geophysics 81 (5), D527–D541. doi:10.1190/geo2015-0713.1
Zhou, Z. (2010). Study on the Calculation Method of S-Wave Velocity Constrained by Logging Based on Rock Physics Model [J]. J. Geochem. Explor. 32 (5), 536–541.
Zhu, L., Zhang, C., Zhang, C., Zhou, X., Zhang, Z., Nie, N., et al. (2019). Challenges and Prospects of Digital Core-Reconstruction Research[J]. Geofluids 2019, 7814180. doi:10.1155/2019/7814180
Zhu, W., Zhao, L., and Shan, R. (2017). Modeling Effective Elastic Properties of Digital Rocks Using a New Dynamic Stress-Strain Simulation Method. Geophysics 82 (6), MR163–MR174. doi:10.1190/geo2016-0556.1
Zong, Z., and Yin, X. (2017). Model Parameterization and P-Wave AVA Direct Inversion for Young's Impedance. Pure Appl. Geophys. 174 (5), 1965–1981. doi:10.1007/s00024-017-1529-7
Keywords: digital rock, CT scan, rock physical model, porosity inversion, seismic data
Citation: Guo W, Dong C, Lin C, Wu Y, Zhang X and Liu J (2022) Rock Physical Modeling of Tight Sandstones Based on Digital Rocks and Reservoir Porosity Prediction From Seismic Data. Front. Earth Sci. 10:932929. doi: 10.3389/feart.2022.932929
Received: 30 April 2022; Accepted: 16 May 2022;
Published: 21 June 2022.
Edited by:
Nibir Mandal, Jadavpur University, IndiaReviewed by:
Xinpeng Pan, Central South University, ChinaCopyright © 2022 Guo, Dong, Lin, Wu, Zhang and Liu. This is an open-access article distributed under the terms of the Creative Commons Attribution License (CC BY). The use, distribution or reproduction in other forums is permitted, provided the original author(s) and the copyright owner(s) are credited and that the original publication in this journal is cited, in accordance with accepted academic practice. No use, distribution or reproduction is permitted which does not comply with these terms.
*Correspondence: Chunmei Dong, MTcyNDE4Mzc4QHFxLmNvbQ==; Yuqi Wu, d3V5dXFpMTUwMzQ4QDE2My5jb20=
Disclaimer: All claims expressed in this article are solely those of the authors and do not necessarily represent those of their affiliated organizations, or those of the publisher, the editors and the reviewers. Any product that may be evaluated in this article or claim that may be made by its manufacturer is not guaranteed or endorsed by the publisher.
Research integrity at Frontiers
Learn more about the work of our research integrity team to safeguard the quality of each article we publish.