 Yujie GUO
 Qi XIAN
 Dongwei NIU
94% of researchers rate our articles as excellent or good
Learn more about the work of our research integrity team to safeguard the quality of each article we publish.
Find out more
ORIGINAL RESEARCH article
Front. Earth Sci., 19 August 2022
Sec. Quaternary Science, Geomorphology and Paleoenvironment
Volume 10 - 2022 | https://doi.org/10.3389/feart.2022.932834
This article is part of the Research TopicTrapped Charge Dating and Its Application in Geomorphological, Geological and Archaeological Studies in East AsiaView all 15 articles
As part of the “generalized Nihewan Basin”, the Huailai basin has recently attracted archaeologists’ attention. Ten Paleolithic sites were found in this basin in 2014; among these, the Zhuwobu site is the oldest―dated to 504 ± 76 ka using the electron spin resonance (ESR) dating method. This study redated the Zhuwobu site using the multiple elevated temperatures (MET) post infrared (pIR) infrared stimulated luminescence (IRSL) procedure (MET-pIRIR) on both multi-grained single and multiple aliquots of potassium-rich feldspars (K-feldspars). The consistency of the De results obtained from the single- and multiple-aliquot procedures mutually supported the reliability of our age results. Our results suggest that the cultural layer at this site was deposited about 280 ± 13 ka (MIS 8) ago, ∼220 ka younger than the previous ESR age. Considering the region’s tectonic history and the characteristics of the sedimentary facies for the ZWB site, we suggested that the previous ESR age results for the bottom three samples from the sediment profile might be overestimated due to poor bleaching before burial. In contrast, the ESR age of 346 ± 32 ka (MIS 10) for one cultural-layer collected sample might be more reliable due to higher-quality bleaching before burial. Further archaeological, geological, and chronological studies are needed to explore the ancient hominins’ survival conditions in the “generalized Nihewan Basin” and possible connections with the renowned Zhoukoudian sites.
The Nihewan Basin is one of the most critical regions for studying Paleolithic archaeology and early human behaviors of East Asia due to its rich Paleolithic sites (see reviews and references in Yang et al., 2020). The “Nihewan Basin” has different coverage in terms of geographical scope. It usually refers only to the Yangyuan Basin since most Paleolithic sites were initially discovered around the Nihewan village in the eastern part of the Yangyuan Basin. As more and more Paleolithic sites are found in the west and south adjacent basins, it sometimes includes the Datong and Yuxian basins. The “generalized Nihewan Basin” includes the adjacent east Yan-Huai Basin, which includes the Xuanhua, Zhuolu, Huailai, and Yanqing basins (Xie et al., 2006). The above basins are part of the Fenwei Graben System, the tectonic boundary between the Ordos Block and the North China Block (Wang et al., 2020) (Figure 1A, B). Paleo-lakes had filled the basins during the Quaternary period. Today, the Sanggan River and its tributaries connect the basins that were once paleo-lakes (e.g., Zhao et al., 2010; Yuan et al., 2011; Guo et al., 2016; Ji and Wang, 2017).
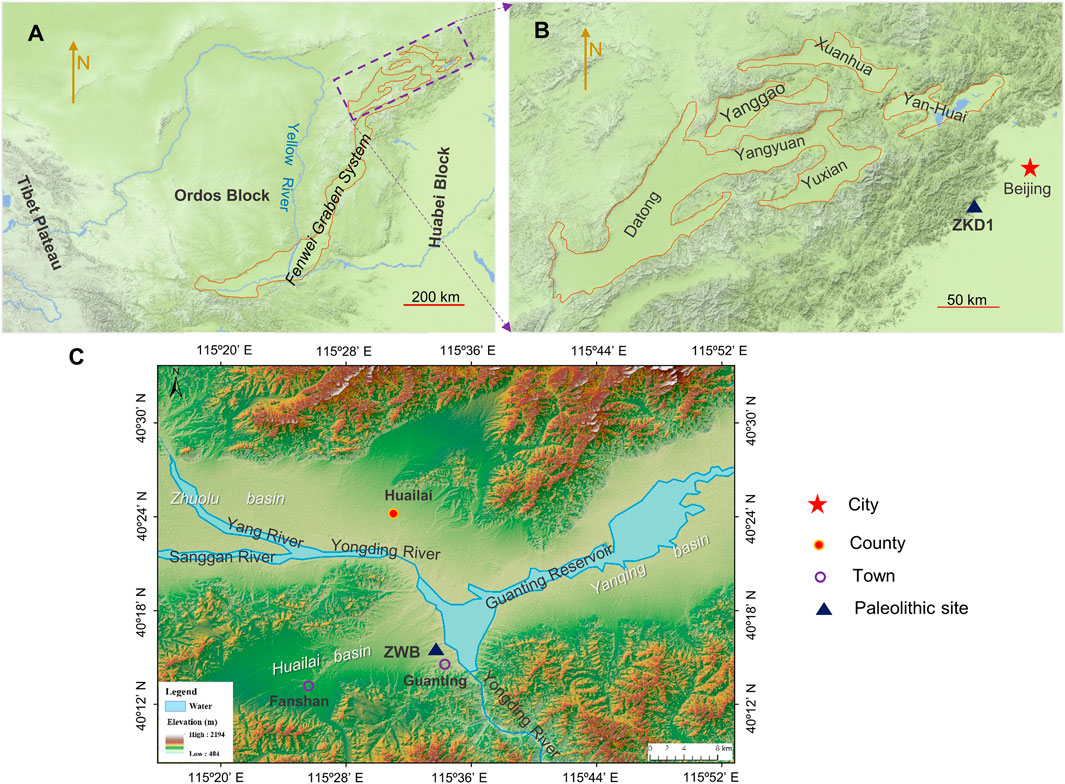
FIGURE 1. Topographic maps showing the locations of the Fenwei Graben System (A) and the basins comprising the “generalized Nihewan Basin” B) (courtesy of Tengxun Map). ZKD1 in panel (B) represents the Paleolithic site of Zhoukoudian Locality 1. (C) Digital elevation model (DEM) of the middle part of the Yan-Huai Basin showing the location of the Zhuwobu (ZWB) paleolithic site.
The Huailai basin (also named the Fanshan basin in some literature) is a V-shaped elongated intermountain basin with a length of 100 km from east to west and a width of 20 km from north to south (Figure 1C). The average altitude of the internal basin is ∼650 m asl, and the surrounding mountains are over 1000 m asl. The Yongding River (downstream of the Sanggan and Yang Rivers) flows from the north into the south artificial Guanting Reservoir. The internal landscape includes piedmont diluvial-colluvial fans, alluvial-diluvial platforms, and river terraces from the foot of the surrounding mountains to the center of the basin―containing the Quaternary fluvial-lacustrine deposits up to ∼200–400 m thick (Wu et al., 1979; Li, 1992). Previous studies in the Huailai basin mainly focused on regional geology, biostratigraphy, and paleoclimatology (e.g., Wu et al., 1979; Li, 1992; Ran et al., 1992; Hu et al., 2000; Zheng et al., 2001; Zhu et al., 2020), while no Paleolithic archaeology studies had been done before 2014. Archaeologists from the Hebei Normal University and the Museum of Huailai County conducted an archaeological field investigation in this basin in 2014, and a total of ten Paleolithic sites were discovered (Niu et al., 2017). Among these, the Zhuwobu (ZWB) site―dated to 504 ± 76 ka using the Electron Spin Resonance (ESR) dating method based on the Ti-Li center of quartz (Li et al., 2018)―is currently the oldest in this basin. This site is essential for us to understand the ancient hominins’ survival conditions and interactions with other groups of North China in the Middle Pleistocene. In this study, we redated this site using the regenerative-dose optically stimulated luminescence (Aitken, 1998) dating method to provide a chronological framework reference.
The optically stimulated luminescence (OSL) dating method has become one of the most used numerical dating methods to constrain the timing of sediment deposition worldwide (e.g., Feathers, 2003; Lai, 2010; Rhodes, 2011; Liritzis et al., 2013; Wang, 2014; Hu et al., 2019; Jacobs et al., 2019; Clarkson et al., 2020) since the single-aliquot regenerative-dose (SAR) method was proposed (Murray and Roberts, 1998; Galbraith et al., 1999; Murray and Wintle, 2000, 2003). Quartz and potassium-rich feldspar (K-feldspar) are the two most widely used minerals for luminescence dating. The infrared stimulated luminescence (IRSL) signals from K-feldspars saturate at a much higher radiation dose than the conventional OSL signal from quartz and have the potential to date much older sediments (see reviews in Li et al., 2014a). Luminescence dating on K-feldspars has been successfully applied to the Middle Pleistocene sediments in the Nihewan Basin (e.g., Nian et al., 2013; Guo et al., 2015, 2016, 2020; Rui et al., 2020a; Rui et al., 2020b; Lu et al., 2021; Wang et al., 2021) using either a two-step post infrared (post-IR) IRSL procedure (post-IR IRSL; Thomsen et al., 2008; Buylaert et al., 2009,2012; Thiel et al., 2011) or a multiple elevated temperatures (MET) post-IR IRSL procedure (MET-pIRIR; Li and Li, 2011; Li and Li, 2012). This study redated the Zhuwobu site on K-feldspars using the multi-grained single- and multiple-aliquot regenerative-dose MET-pIRIR procedure to constrain the depositional time for sediments bearing the cultural remains.
The Zhuwopu site (40°15′50″ N, 115°34′12″ E; 498 m asl) is located at the third terrace of the Yongding River in the town of Guanting in Huailai County, Hebei Province (Figure 1C). The site was discovered in 2014, and a total area of 23 m2 was test excavated by Hebei Normal University and the Huailai Museum during the same year. A total of 262 stone artifacts were discovered (Figure 2). They include cores (11), hammerstones (2), debitage (233, with 51 complete flakes, 7 incomplete flakes, 45 debris, and 130 chunks), stone tools (8), and natural river cobbles (11). The raw materials are dominated by basalt, andesite, siliceous limestone, flint, etc., from the nearby river cobbles. The flaking method is mainly direct hard-hammer percussion. This site’s lithics belong to the “flake-tool” technology that existed in North China from the Early to Late Pleistocene (Zhang, 1999; Bar-Yosef and Wang, 2012). A total of 263 animal bone fragments and 21 teeth were recovered, mostly from the remains of steppe ungulates such as antelope, horses, and rhinoceros. The lithic technology details for this site are provided in Niu et al. (2022).
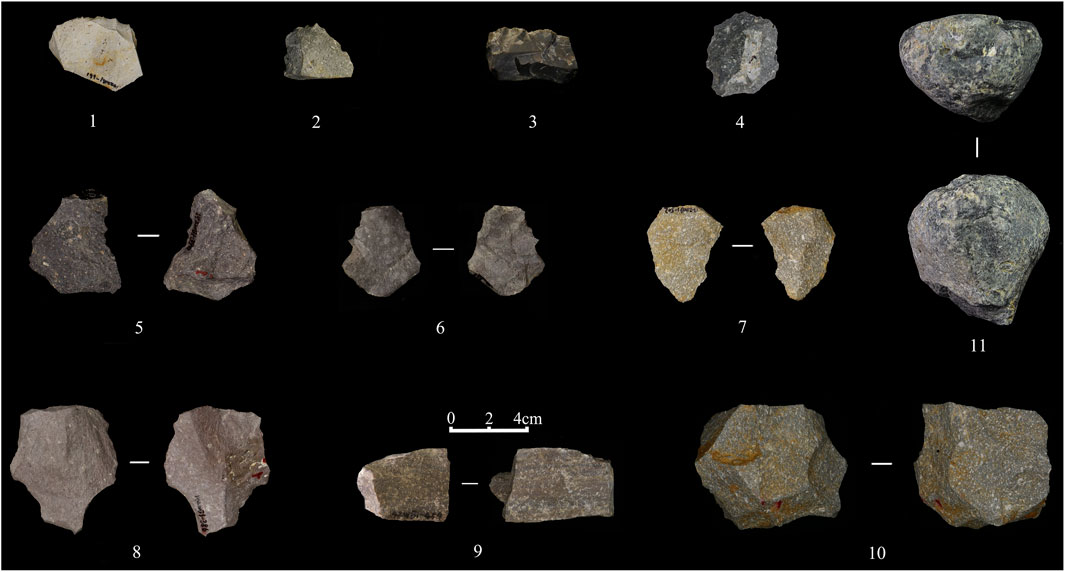
FIGURE 2. Selection of the stone artifacts excavated from ZWB site: (1–4) scrapers; (5–8) complete flakes; (9and10) cores; (11) hammerstone.
The sedimentary profile of the site’s excavated north wall consists of five units comprising 20 layers, which are as follows from top to bottom (Figures 3A, B):
1) Unit 1 (layer 1, ∼0.2 m thick): Gray-brown gray soil. The structure is loose, and plant roots are developed.
2) Unit 2 (layers 2–13, ∼4.5–5.5 m): Layers of gray-green or gray-black silty clay interbedded with yellow or tawny fine/coarse sands with the internal wave and cross beddings. The layers’ upper surfaces were reworked by water flows, resulting in erosional grooves filled with overlying sediments. This unit reflects the interbeds of lakeshore swamp and beach bar sediments, with rapid water level fluctuations.
3) Unit 3 (layers 14–15, ∼2.5–3.5 m): Gray-green silty clay with strip lens of gray-yellow fine sands, wave, and horizontal beddings. Fragments of bivalves and calcium carbonate spots are scattered. This unit reflects the lacustrine sediments with relatively weak and stable water flows.
4) Unit 4 (layer 16–17, ∼1.8–4.0 m thick): Gray-green, gray-black, and gray-yellow silty clay with the strip lens of gray-yellow fine sands, wave, and horizontal beddings. Fragments of bivalves and calcium carbonate spots are scattered. The erosional basal groove filled with blocks of silty clay indicates a high flood of layer 17. The abundant red-yellow iron oxide and white calcium carbonate spots indicate the development of the seasonal redox and eluviation process. This unit reflects the lakeshore sediments with unstable water flows. Abundant stone artifacts and vertebrate bone fragments were recovered from the lower part of layers 16 and 17.
5) Unit 5 (layers 18–20, >1.5 m): Gray-yellow loose coarse sands, with large-scale cross and horizontal beddings. Layer 19 of red-yellow coarse sand with iron-manganese rusty spot indicates the redox process induced by seasonal groundwater had been developed. This unit reflects the high-energy fluvial sediments.
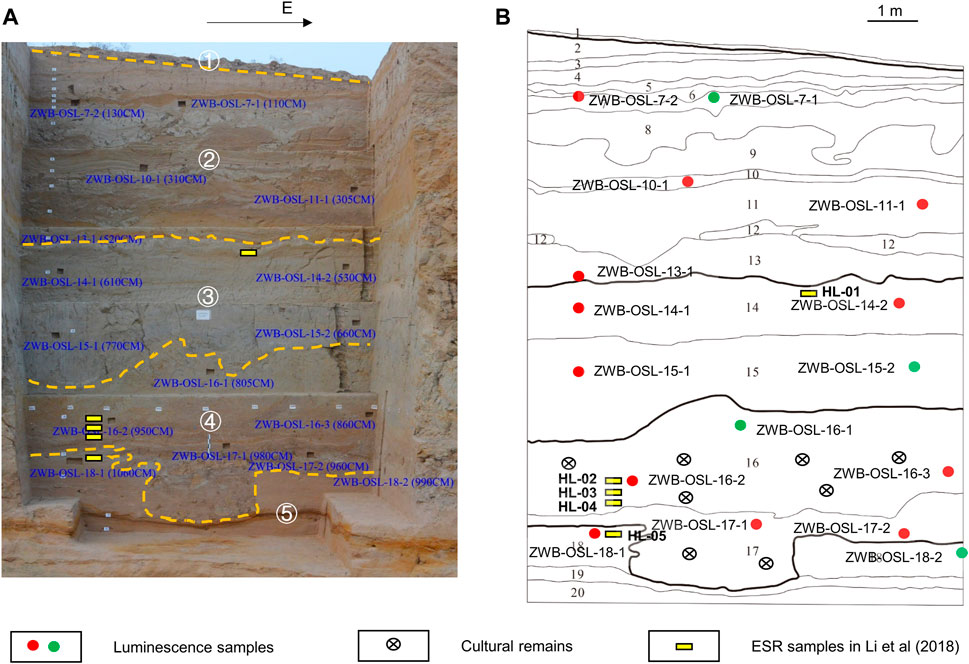
FIGURE 3. Photo (A) and graphic sketch (B) showing the sedimentary profile and the luminescence and ESR sampling locations of ZWB site. The numbers in circles in panel A) indicate the sedimentary units 1 to 5, and the Arabic numbers in panel B) represent the detailed sedimentary Layers 1 to 20.
In all, a sequence of fluvial (unit 5)–lakeshore (unit 4)–lacustrine (unit 3)–lakeshore (unit 2) sediments from the bottom up indicates a cycle of lake expansion (unit 5 to unit 3), and retreating (unit 3 to unit 2) processes. According to the sedimentary facies and the distribution pattern of the cultural remains, we consider that the remains might have been transported from a distance by a high flood; thus, the numerical age for the sediments of the cultural layer represents the minimum age for the cultural remains.
In this study, 16 block samples (ZWB-OSL-7-1 to -18-2) about 15 × 15 × 15 cm in size were systematically collected from the sedimentary profile for luminescence dating, and 12 of them were measured to save instrumental time. Samples ZWB-OSL-16-2, -16-3, -17-1, and -17-2 were collected from the cultural layer (Figure 3A,B). After the samples were removed from the profile, they were immediately wrapped in aluminum foil and transported for analysis to the Luminescence Dating Laboratory at the Hebei Normal University, China. The previous ESR sampling positions are also shown in Figure 3, and the samples HL-02, -03, and -04 were collected from the cultural layer (Li et al., 2018).
Sample preparation was carried out under subdued red light in the laboratory. The sample blocks’ outer layer (∼2 cm) was removed and used for dose rate determination. The blocks’ remaining internal parts were treated to extract K-feldspar grains using the standard mineral separation techniques (Aitken, 1998). Carbonate and organic matter were removed using HCl (waiting for reactions for 1 day) and H2O2 (waiting for 1 week) solutions, respectively. Fractions at the grain-size interval of 90–150 μm were isolated by wet sieving and then dried for density separation. K-feldspar grains were extracted using a heavy liquid with a density of 2.58 g/cm3. These grains were etched in 10% HF acid for 40 min to remove the grains’ alpha-irradiated rinds. The precipitated fluorides generated during HF etching were removed using a 10% HCl solution for at least 2 h. The etched grains were finally dry sieved again to remove the dissolved portions of less than 90 μm. An overall reduction of 10 μm in diameter by HF etching was assumed.
The uranium (U), thorium (Th), and potassium (K) concentrations for each sample were determined using inductively coupled plasma mass spectrometry (ICP-MS) for U and Th and X-ray fluorescence (XRF) for K at Qingdao Sparta Analysis & Test Co., Ltd., China. The internal K and Rb concentrations of the K-feldspar samples were assumed to be 12 ± 1% (Rui et al., 2019) and 400 ± 100 ppm (Huntley and Lamothe, 2001), respectively. The long-term water content was assumed as 15 ± 5% for all samples based on previous studies in this region (Zhao et al., 2010; Nian et al., 2013; Guo et al., 2016; Wang et al., 2021). The total environmental dose rates were calculated using the online DRAC (dose rate and age calculator) v. 1.2 software (Durcan et al., 2015), in which the cosmic-ray contribution to the dose rate was involved. The conversion factors in Adamiec and Aitken (1998) and beta attenuation factors in Mejdahl (1979) were adopted to calculate the dose rates.
Aliquots were made by applying a 2 mm diameter coating of silicone spray oil to stainless steel discs (10 mm in diameter) using a tiny brush, followed by a single layer of the K-feldspar grains. De measurements were performed on an automated Risø TL/OSL-DA-20 reader (Bøtter-Jensen et al., 2000; Bøtter-Jensen et al., 2003). The optical simulations were conducted using the IR diodes (870 nm) and the laboratory irradiations used a calibrated 90Sr beta source. The luminescent emissions were first filtered by a blue filter pack comprising Schott BG-39 and Corning 7–59 filters and were then detected by an Electron Tubes Ltd. 9235QB15 photomultiplier tube. The instrumental reproducibility error was assumed as 1% for the De measurements (Guo et al., 2020). Considering possible bias in the calibration of the laboratory beta source for the De measurements (Galbraith and Roberts, 2012), a systematic error of 2% was also added in quadrature to the measurement errors.
A series of SAR MET-pIRIR procedures (50–170°C, 80–200°C, 110–230°C, 140–260°C, and 170–290°C in a step of 30°C) and a two-step post-IR IRSL procedure (200, 290°C), with preheat temperatures 30°C higher than the highest stimulation temperature, were first tested on sample ZWB-OSL-17-2 to find an optimal measurement procedure for ZWB samples. Only the MET-pIRIR140–260 °C procedure passed the SAR performance tests (see below) and was adapted to measure the De for the samples in this study (Table 1). Typical natural IRSL140 °C and pIRIR170–260 °C decay curves are shown in Supplementary Figure S1 for one aliquot of sample ZWB-OSL-17-2. The net IRSL signals used for De determination were calculated as the sum of the counts in the first 15 s of IRSL decay minus the counts from the final 15 s of stimulation as background. The dose-response curve (DRC) for each aliquot was conducted using the sensitivity-corrected pIRIR signals (Lx/Tx, Table 1) induced from a series of regenerative doses associated with fixed test doses of 240 Gy. The DRCs were fitted using the double exponential function in the Analyst V.4.57 software. The De values were determined by interpolating the sensitivity-corrected natural signals (Ln/Tn, Table 1) onto their corresponding DRCs (Murray and Wintle, 2000, 2003).
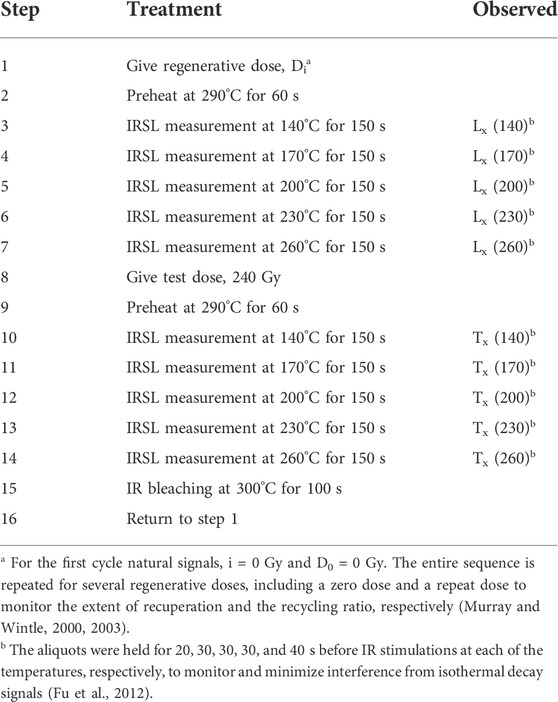
TABLE 1. The De measurement procedure for the SAR MET-pIRIR measurements (after Li and Li, 2011, 2012).
To check the dependence of De on preheat treatment, sample ZWB-OSL-17-2 was test measured with preheat temperatures of 290 and 320 °C. The results are plotted in Figure 4A. It shows that the De values increased as the stimulation temperatures increased, achieving a plateau of ∼954 Gy for pIRIR230°C and pIRIR260°C at both 290 and 320°C preheating temperatures. It indicates that signals of pIRIR230 °C and pIRIR260 °C are “non-faded” (Li and Li, 2011) and independent of preheating treatments. This study adopted the preheat temperature of 290°C to save instrumental time.
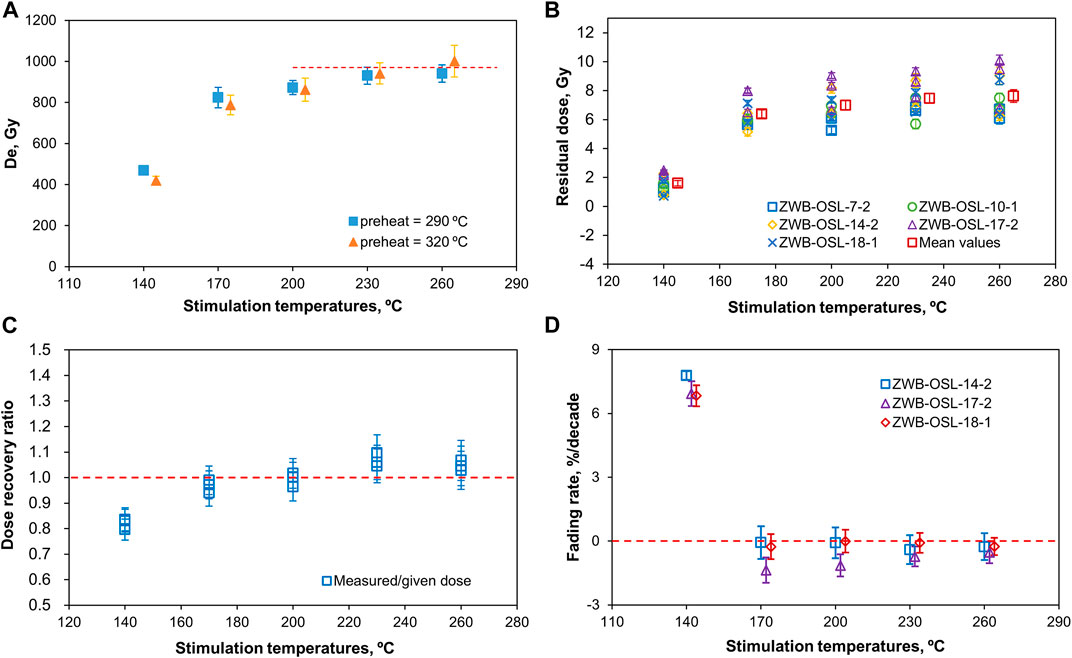
FIGURE 4. (A) The De values obtained at preheat temperatures of 290–320°C for sample ZWB-OSL-17-2 measured using the SAR MET-pIRIR procedure on K-feldspars. The data points represent the mean values for two aliquots, and the dashed red line indicates the mean value of ∼954 Gy for the De values measured at 230°C and 260°C stimulation temperatures. (B) The residual doses measured for samples ZWB-OSL-7-2, -10-1, 14-2, -17-2, and -18-1 using the SAR MET-pIRIR procedure, plotted against IR stimulation temperatures. The red squares represent the means of all the aliquots measured at each IR stimulation temperature for the five samples, and each of the other data points represents one aliquot. (C) Dose recovery ratios for sample ZWB-OSL-17-2 at different IR stimulation temperatures. Each blue square represents the value for one aliquot. (D) Anomalous fading rates for the MET-pIRIR signals of samples ZWB-OSL-14-2, -17-2, and-18-1. The vertical bars in each panel indicate the corresponding standard errors. The symbols are offset laterally for clarity.
Residual dose tests were performed on samples ZWB-OSL-7-2, 10-1, 14-2, 17-2, and 18-1 to check whether the samples from this site were well bleached. Two aliquots of each sample ZWB-OSL-7-2, 10-1, 14-2, and 18-1 were bleached for 10 h, and three aliquots of sample ZWB-OSL-17-2 were bleached for 8 h in the solar simulator (Hönle: UVACUBE 400). The remaining doses were then measured using the procedure in Table 1, with two regenerative doses of 24 and 72 Gy. The DRCs were linear fitted and did not pass the original point. The results are plotted in Figure 4B. The arithmetic means of the residual doses measured at 140–260°C stimulation temperatures for the five samples are 1.6 ± 0.2, 6.4 ± 0.3, 7.0 ± 0.4, 7.5 ± 0.4, and 7.6 ± 0.5, respectively.
The dose recovery test (Galbraith et al., 1999; Wallinga et al., 2000) was conducted on sample ZWB-OSL-17-2 to check the applicability of the MET-pIRIR procedure for samples from this site. Three aliquots of the sample were bleached for 8 h in the solar simulator, and a dose of 960 Gy was then given to each aliquot as the surrogate “natural” dose. Then the “natural” dose was measured using the procedure in Table 1. The ratios of the measured (subtracting the residual dose) to the given dose are consistent with unity for the pIRIR170–260°C signals (Figure 4C), demonstrating that a known laboratory dose can be accurately recovered for samples from this site using the SAR MET-pIRIR procedure.
A fading test (Huntley and Lamothe, 2001; Auclair et al., 2003; Guo et al., 2015) was conducted on samples ZWB-OSL-14-2, -17-2, and -18-1 to determine the fading rate (g-value, the percentage of signal loss per decade) of the IRSL signals. Four aliquots of each of the three samples that had been used for De measurements were first bleached at 300°C using IR light for 150 s to empty any residual/transferred signals in the grains. A fixed-dose of 600 Gy was repeated given to the aliquots following preheating of 290°C, and the IR140°C and pIRIR170–260°C Lx/Tx signals were measured with different delay periods (up to 7 days). The results (Figure 4D) show that the fading rates are consistent with or below zero for the pIRIR170–260°C signals for the three samples. The fading rates below zero might be artifacts of the laboratory measurement procedure, caused by the signal sensitivity which had not been accurately corrected after storage (Buylaert et al., 2012), or the fixed-dose not close to the De value, which is not the scope of this study. The De plateau and successful dose recovery ratios are enough to validate that the pIRIR230 °C and pIRIR260°C signals are non-faded, and their calculated ages do not need correction for fading.
To save instrumental time, we applied the standardized growth curve (SGC) method (Li et al., 2015; Guo et al., 2016) to measure the samples’ De. The SGC was constructed using a series of sensitivity-corrected regenerative-dose induced Lx/Tx signals, which were normalized to the Lx/Tx signals measured at a regenerative dose of 480 Gy from two aliquots of each of the 12 samples. De values were then obtained by projecting the natural Ln/Tn signal (normalized to 480 Gy) onto the SGC. The SGC was fitted using the built-in function “fitGrowth” with a double saturation exponential model (model = “dexp”) in the “numOSL” package v. 2.6 (Peng et al., 2013; Peng and Li, 2017) in the RStudio software v. 4.0.3 (Figures 5A–E). To check the reliability of the De values obtained based on the SGC method, another aliquot from each of the 12 samples was measured using the complete cycles of the SAR procedure. The De values obtained from individual DRCs and the SGC are plotted in Figures 5F–J. It can be seen that the De values have increasing standard errors as the stimulation temperatures increase due to the normalized Ln/Tn signals approaching the saturated region of the growth curves. The De values increasingly deviate from the 1:1 line as the stimulation temperatures increase due to the normalized Lx/Tx signals deviating from the SGCs at higher regenerative doses (Supplementary Figure S2). However, the De values deviate no more than 10% from the 1:1 line for each sample, indicating that the SGC method is applicable for the ZWB samples (Li et al., 2015). Thus, another ten aliquots for each sample were measured for only two SAR cycles―one natural and one regenerative-dose (480 Gy) signal associated with their corresponding test dose signals. The final De for each sample was obtained by projecting the weighted mean, calculated using the central age model (CAM; Galbraith et al., 1999; Galbraith and Roberts, 2012) of the normalized Ln/Tn values onto the SGC.
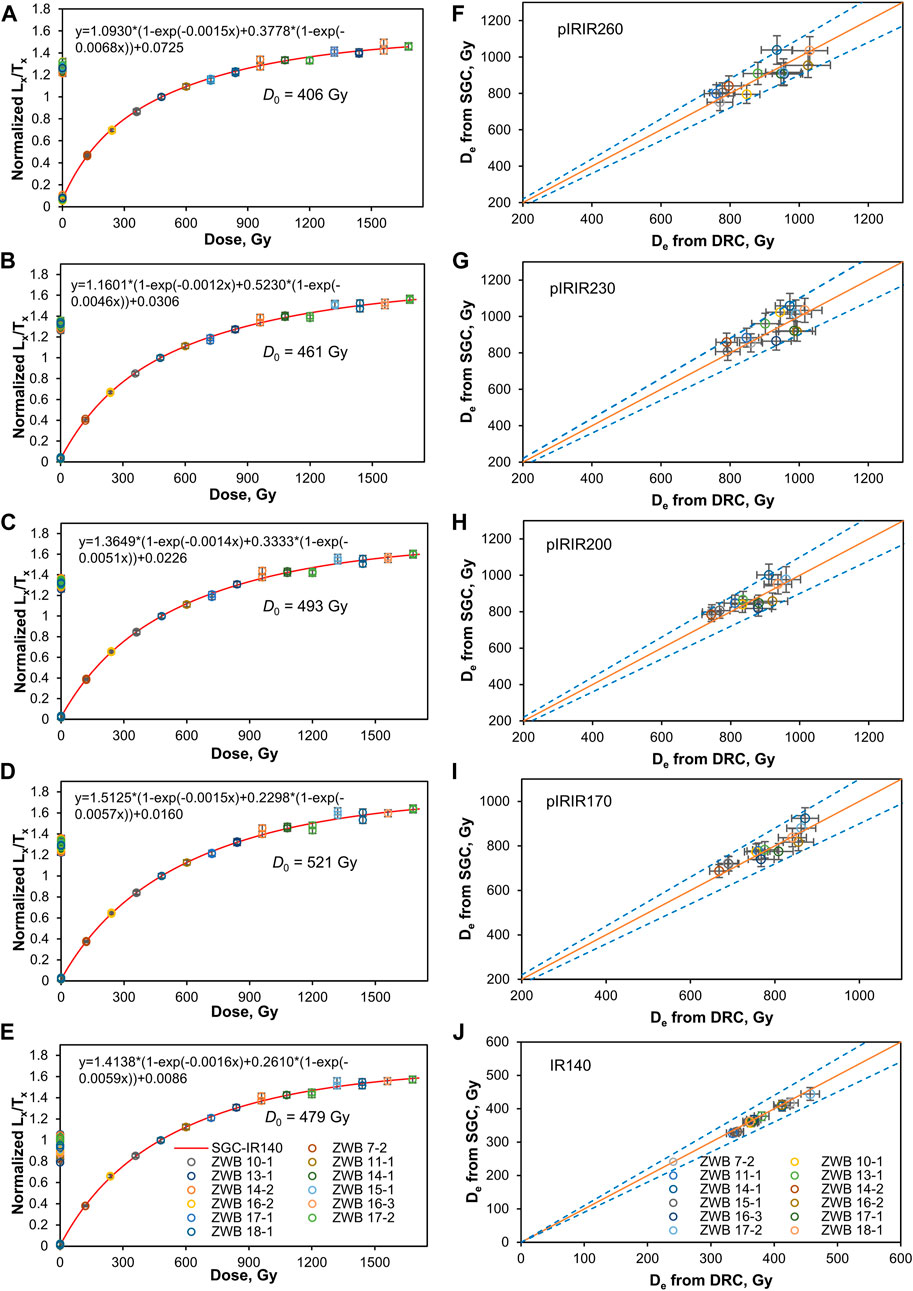
FIGURE 5. (A–E) Standardized growth curves (SGCs) for the Lx/Tx signal (normalized to unity at a dose of 480 Gy) measured at 140–260°C stimulation temperatures using the SAR MET-pIRIR procedure on K-feldspar from samples ZWB-OSL-7-2 to -18-1. The natural signals are shown as the upper set of data points on the y-axis. The fitted function and the D0 values (the characteristic saturation dose, see Figure 6 caption) of the SGCs are shown in each panel. (F–J) Equivalent dose (De) values obtained from individual dose-response curves (DRC) plotted against those obtained from the SGCs for samples ZWB-OSL-7-2 to -18-1. The solid lines denote the 1:1 relationship, and the dashed lines indicate the 10% deviations. Each data point in each panel indicates the value for one aliquot, and the vertical and horizontal bars indicate the corresponding standard errors.
It is noted that some SAR De values measured at 230 and 260°C in Figures 5F, G are beyond the empirical 2D0, corresponding to ∼86% of the saturation intensity (Wintle and Murray, 2006) limits of their SGCs. The multi-aliquot regenerative-dose (MAR) pre-dose MET-pIRIR procedure (Li et al., 2013; Guo et al., 2015) was then applied to sample ZWB-OSL-17-2 to inter-check the reliability of the SAR De results because the MAR pre-dose procedure has larger D0 and can date much older sediments than the SAR procedure (see reviews and references in Zhang and Li, 2020). The measurement procedure is listed in Table 2. In this procedure, the sensitivity-corrected LX/T1 and the inter-aliquot normalized Lx/T2 and T1/T2 signals can all be used for De determination. Aliquots were divided into six groups. One group was used to measure the natural signal. The other five groups were bleached in the solar simulator for 8 h and then given different regenerative doses. The MAR DRCs for the pre-dose MET-pIRIR signals, fitted using a single saturation exponential function, are shown in Figures 6A–C. The MAR DRCs for Lx/T2 signals at 230 and 260 °C yielded D0 values of 732 and 721Gy, respectively. Applying the conservative 2D0 limit would enable reliable dating to ∼1500 Gy, equating to ∼430 ka for the ZWB samples. The MAR Lx/T2 signal measured at 230 and 260 °C yielded De values of 1017 ± 49 and 978 ± 44 Gy, respectively, both accounting for about 1.4D0 of their corresponded DRCs. The De results obtained from the SAR and MAR MET-pIRIR signals at 230 and 260 °C are statistically consistent at 1σ (Figure 6D), mutually supporting the reliability of the De results for the ZWB samples obtained in this study.
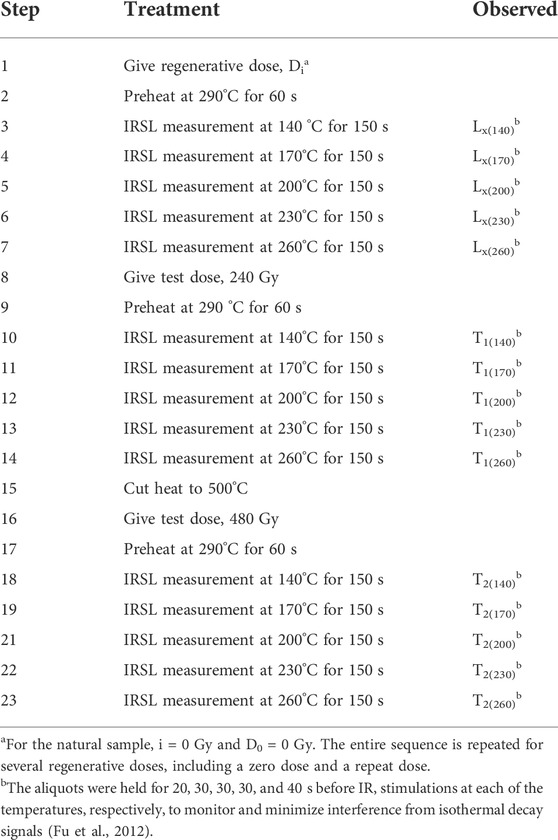
TABLE 2. The De measurement procedure for the MAR pre-dose MET-pIRIR measurements (after Li et al., 2014b).
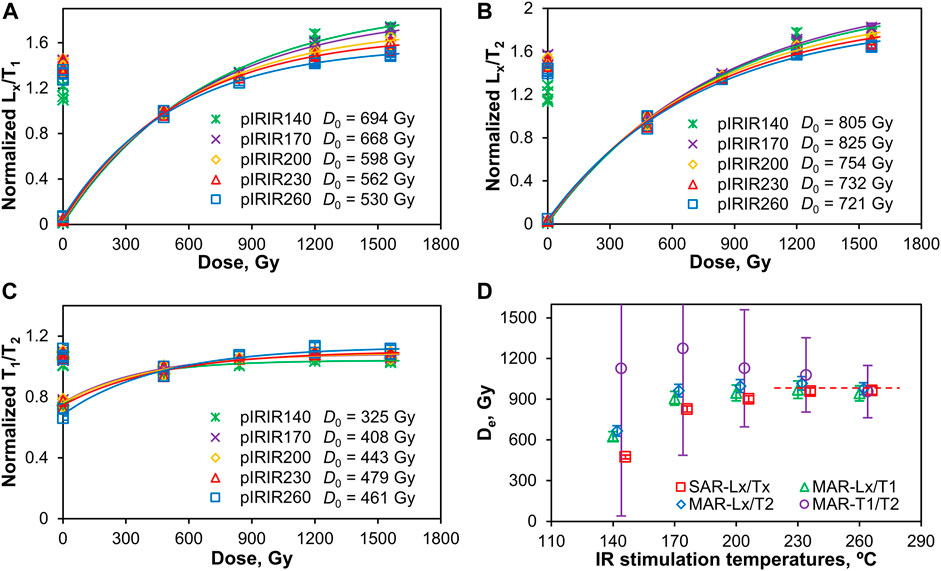
FIGURE 6. (A–C) Dose-response curves (DRC) for the Lx/T1, Lx/T2, and T1/T2 signals (re-normalized to unity at a dose of 480 Gy) measured at 140–260°C stimulation temperatures using the MAR pMET-pIRIR procedure for sample ZWB-OSL-17-2. The natural signals are shown as the upper set of data points on the y-axis. Each data point in panels (A–C) represents one aliquot. The curves were fitted using a single saturating exponential function of the form I = I0 (1−exp (−D/D0)) + y0, where I is the normalized IRSL intensity, D is the regenerative dose, D0 is the characteristic saturation dose (correspond to ∼63% of the saturation intensity), and the sum of I0 and y0 is the saturation value of the exponential curve. (D) De values for sample ZWB-OSL-17-2 were measured at 140–260°C using the SAR and MAR pMET-pIRIR procedures. The dashed red line indicates a mean value of ∼960 Gy for the De values measured at 230°C and 260°C stimulation temperatures from both the SAR and MAR procedures. The data points are offset laterally for clarity. Each data point in panel D) represents the mean values for four aliquots for the MAR procedure, and the CAM values for 12 aliquots for the SAR procedure (Table 3 and Supplementary Table S1). The vertical bars in each panel indicate the corresponding standard errors. It is noted that the natural pIRIR Tn/T2 signals are close to the saturation levels of their DRCs, resulting in significant errors in the De values.
Based on all the above performance test results, the pIRIR230 °C and pIRIR260 °C signals are proved non-faded, independent of preheating treatments, and can recover the given dose, indicating they are both suitable for dating the ZWB samples. The distributions of the pIRIR230 °C and pIRIR260 °C De results for each sample are plotted in the radial plots in Figure 7 and Supplementary Figure S3, respectively. The De values are distributed around a central value, and their over-dispersion (OD) values, calculated using the CAM, are less than 10% for all samples, indicating they had been well bleached before burial. Since the pIRIR230°C De results have relatively lower OD values than the pIRIR260°C De results, the CAM De values at 230°C were thus used for final age calculations for all the ZWB samples in this study. Since the residual doses are negligible compared to the total De (<0.8%), they were not subtracted from the final CAM De for each sample. The calculated ages were also not corrected for fading.
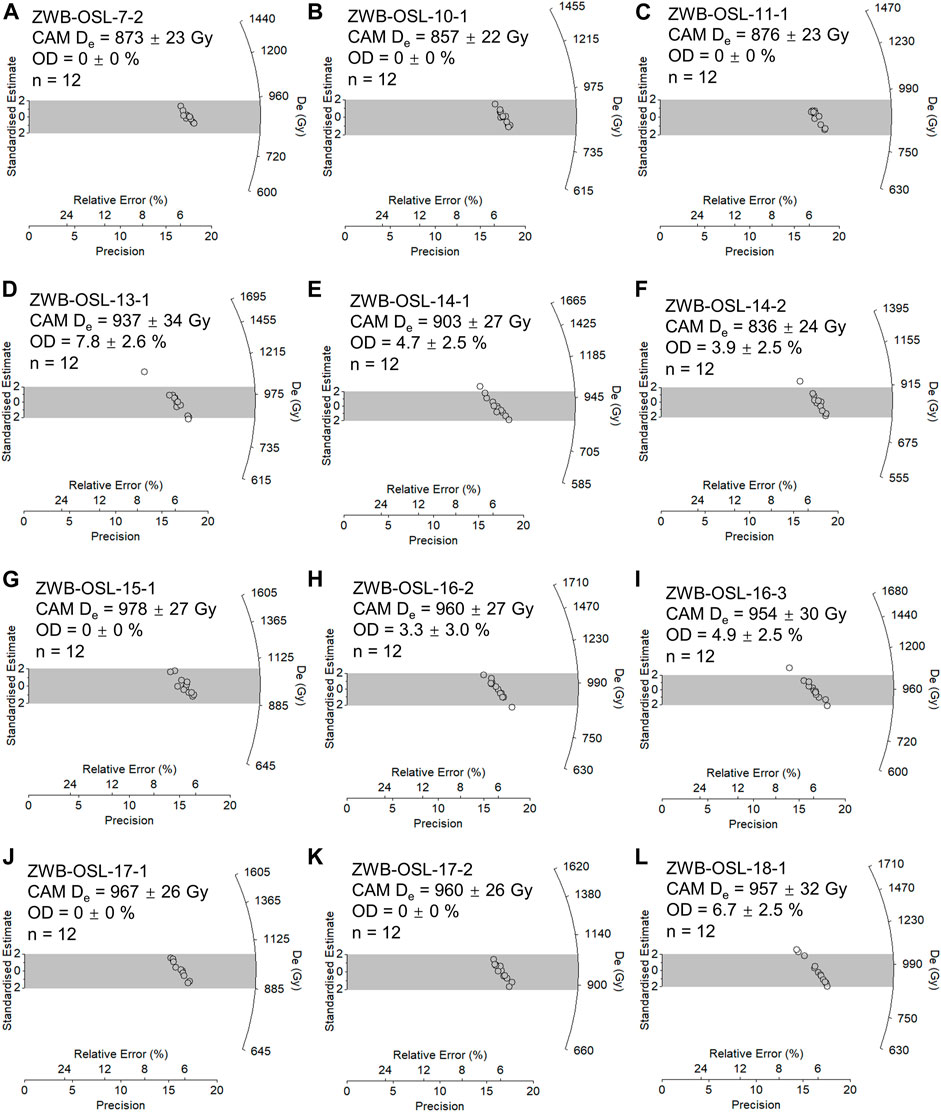
FIGURE 7. (A–L) pIRIR230 °C De distributions of individual aliquots of K-feldspar from samples ZWB-OSL-7-1 to -18-1 were measured, respectively. The gray bands are centered on their central age model (CAM) values. The values of n indicate the number of measured aliquots.
The environmental dose rates, CAM De values, and the calculated ages at different pIRIR temperatures are summarized in Table 3 and Supplementary Table S1. Here, we only use the ages obtained at 230°C for discussion. The samples’ SAR and MAR ages at 230°C are plotted against depth in Figure 8. The samples’ ages are broadly consistent with their stratigraphic positions, ranging from ∼300 ka to ∼240 ka from the bottom up (Figure 8) and covering the time range of the marine isotope stage (MIS) 8 (Lisiecki and Raymo, 2005). The SAR and MAR ages of the samples from the cultural layer (samples ZWB-OSL-16-2, -16-3, -17-1, and -17-2) are consistent at 1 σ (Figure 8) and give a mean value of 280 ± 13 ka, ∼220 ka younger than the previous ESR mean age of 504 ± 76 ka (Li et al., 2018).
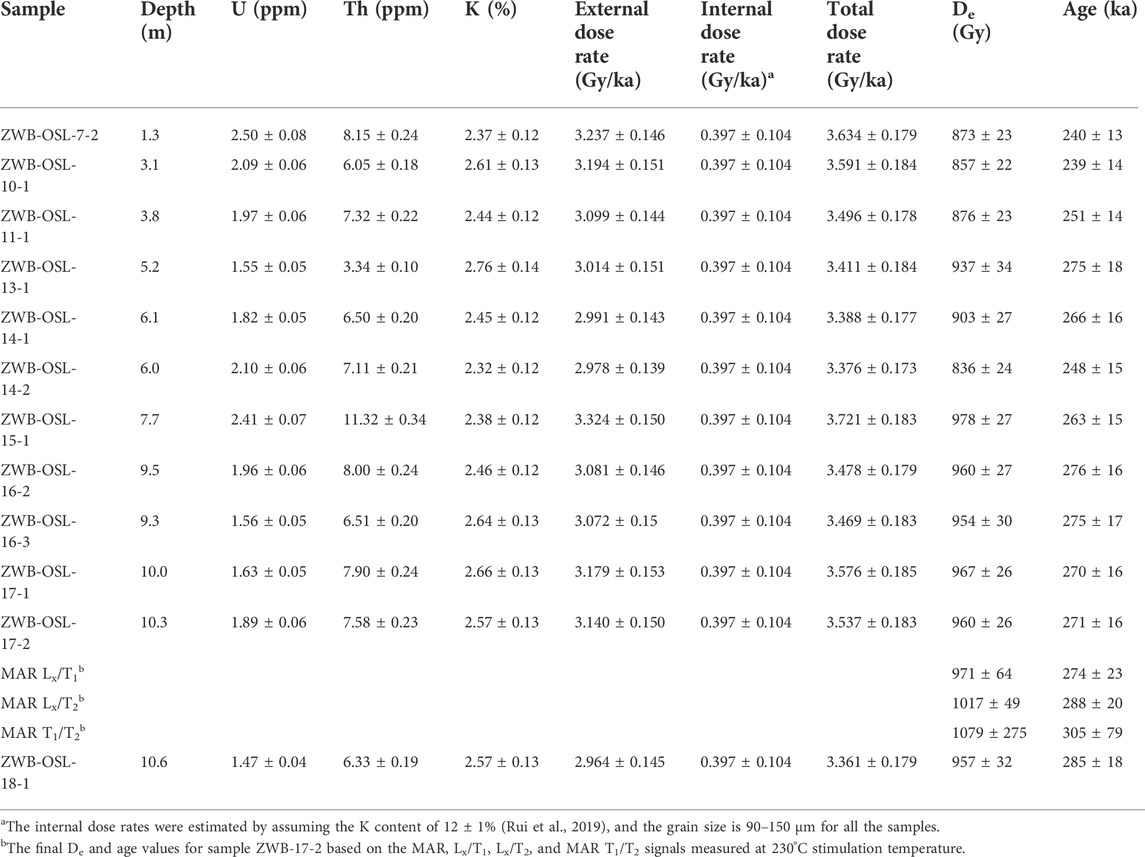
TABLE 3. Environmental dose rates, single-aliquot De, and ages were measured at 230°C stimulation temperature for K-feldspar samples from ZWB.
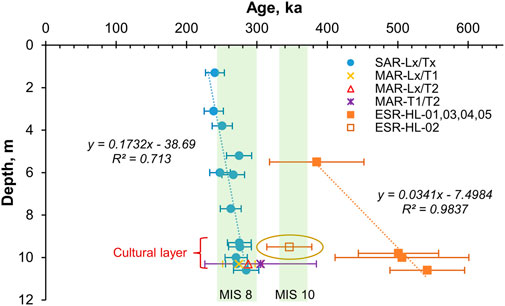
FIGURE 8. Age results obtained based on multi-grained single- and multiple-aliquot K-feldspars in this study for samples ZWB-OSL-7-2 to -18-1, and previous ESR age results for samples HL-01 to -05 presented in Li et al. (2018) plotted against their depth, from top to bottom, respectively. The horizontal bars for each point represent the standard errors. The green bans indicate the Marine Isotope Stage (MIS) boundaries follow Lisiecki and Raymo (2005).
The ages of the ESR samples HL- 01 to -05 (Figure 3) in Li et al. (2018) are 385 ± 67, 346 ± 32, 501 ± 57, 506 ± 95, and 542 ± 53 ka, respectively. The ESR ages are plotted together with the pIRIR230 °C ages against depth in Figure 8. The ESR ages are systematically older than the pIRIR230 °C ages, given that the ESR ages for samples HL-01 and -02 are statistically consistent with their paralleled pIRIR samples at 2 σ. The ESR age for sample HL-02 is rejected by Li et al. (2018) because it is abnormally younger than those of the other two samples of HL-03 and 04 collected from the cultural layer (Figure 8). The discrepancy between the pIRIR and ESR age results could be attributed to the ‘underestimation’ of the pIRIR age or “overestimation” of the ESR age results.
Similar to luminescence dating, the ESR dating method also aims to date the last exposure of the sediment to sunlight (Yokoyama et al., 1985), and the age is also obtained using the equivalent dose (De) dividing the environmental dose rate. The calculations of the environmental dose rates are the same for ESR and luminescence dating methods. The water content was assumed to be 10%, and the cosmic ray contribution was not involved in Li et al.’s study (2018), while the water content is set at 15 ± 5%, and the cosmic ray contribution is involved in this study. However, the assumed water contents are consistent with errors in these two studies, and the cosmic ray contribution is minimal (below 2 m in depth). Therefore, the effect of the environmental dose rates on the age discrepancy between pIRIR230 °C and ESR methods is negligible.
For the De determination, the SAR pIRIR230°C De values for the samples in this study (Table 3) account for ∼1.9 to 2.1 D0 of the SGC, reaching the empirical upper limit (2D0) of the reliable De estimation suggested by Wintle and Murray (2006). The MAR Lx/T2 De values at 230°C are within the 2D0 limit and consistent with the SAR pIRIR230 °C De, indicating that the corresponding SAR SGC was constructed accurately and that much higher De values (like 3D0) could be estimated (Galbraith and Roberts, 2012; Li et al., 2015; Rui et al., 2020a). Thus, we consider that our pIRIR230 °C age results are reliable. Based on laboratory experiments, the pIRIR signals in K-feldspars are more light-sensitive and could decrease to a few grays after several hours of bleaching (e.g., Li and Li, 2011; Guo et al., 2016; Wang et al., 2021), while the ESR signals at the Ti-Li center of the quartz need several tens to over 100 h of bleaching to be reset (e.g., Toyoda et al., 2000; Duval et al., 2017; Ji et al., 2021) using the solar simulator. The low OD values of the SAR De distributions for ZWB samples indicated the pIRIR signals in K-feldspars had been well bleached before burial. In contrast, the bleachability of the signals for the ESR samples was not available except for sample HL-02, which was suggested to have been well bleached before burial by a bleaching test (Li et al., 2018). The sediments of the ZWB profile’s cultural layer indicate high-flood deposition (see above description of the sedimentary profile of Units 4 and 5). Thus, the discrepancy between the pIRIR and the ESR age results is possibly caused by overestimating the ESR De values, at least for samples HL-03 to -5, due to poor bleaching before burial.
From the geological aspect, the ZWB site is at the boundary of the Huailai and Yanqing basins (Figure 1C). The Huailai basin began falling and accumulating sediments in the Middle Pleistocene, resulting in the Middle-Late Pleistocene alluvial-diluvial sediments up to 200–400 m thick in the basin’s center (Wu et al., 1979; Li, 1992). The Yanqing basin had been dominated by falling since Neogene, resulting in the Quaternary fluvial-lacustrine sediments up to 800 m thick in the basin’s center (Wu et al., 1979; Li, 1992). The ZWB profile’s overall sedimentation rate is ∼0.17 m/ka, estimated based on our pIRIR230 °C chronology (Figure 8), resulting in a thickness of ∼110 m deposits for the Middle Pleistocene. A sedimentation rate of ∼0.034 m/ka is obtained based on the ESR age results (if rejecting sample HL-02), resulting in a thickness of only ∼22 m deposits for the Middle Pleistocene. The thin ∼22 m deposits seem too thin to be reasonable because the ZWB profile shows rapid alternations of lakeshore and fluvial deposits (Figure 2), indicating a high sedimentation rate in this area. In addition, Yin and Lu (1996) dated the lacustrine sediments (marked as lacustrine Unit B, correlated to layers 1–17 of ZWB) of the third terrace from sections near ZWB and sections in the middle of the Yanqing basin using the ESR, thermoluminescence (TL), and IRSL methods, resulting in a time range of ∼350–160 ka. The lacustrine Unit B’s thickness is about 30 m, and a sedimentation rate of ∼0.16 m/ka is thus calculated. The time range (Yin and Lu, 1996) and the computed sedimentation rate are closer to our pIRIR230 °C age results.
Based on the above discussions, we suggest: 1) our pIRIR230 °C age results in this study are reliable; 2) the age results for ESR samples HL-03 to -05 might be overestimated due mainly to poor bleaching before burial; 3) the ESR samples HL-01 and -02 might have been better bleached and given statistically consistent age values with the pIRIR230°C ages at 2σ. To be conservative, the mean value of 280 ± 13 ka (MIS 8) based on the SAR and MAR pIRIR230°C ages for samples ZWB-OSL-16-2, -16-3, -17-1, and -17-2 can be the lower, and the ESR age of 346 ± 32 ka (MIS 10) for sample HL-02 can be the upper limit of the cultural layer. However, the contained stone artifact and animal fossil remains should be even older because they were transported to the location by a high flood.
The Paleolithic sites in Nihewan Basin have been dated back to ∼1.66 Ma (Zhu et al., 2004), and the neighboring (∼150 km) Zhoukoudian Locality 1 (ZKD1) dated back to ∼0.5 to 0.8 Ma (see reviews and references in Chen and Zhou, 2009). The lithic technologies in both areas belong to the ‘small-tool’ industry (flake technology), one of the major Paleolithic traditions in North China (Jia et al., 1972; Zhang, 1990, 1999; Liu, 2014; Guo et al., 2017). The close distance and similarities in the lithic technology prompt archaeologists to infer that immigrations or communications might have occurred between the Nihewan and Zhoukou areas as early as the initial Middle Pleistocene (Li and Shi, 2020). As part of the “generalized Nihewan Basin”, the Yan-Huai Basin might act as one of the corridors for the Nihewan people to move east to the Zhoukoudian area or even north to Northeast China. Seeking out early Middle Pleistocene Paleolithic sites in the Yan-Huai Basin is critical for exploring the nature of the initial dispersal of Nihewan people to the Zhoukoudain area. However, considering the Quaternary tectonic activity in this region (Wu et al., 1979), efforts should be paid more to the tectonic uplifting or stable surrounding mountain feet rather than the middle of the Basin, which had been dominated by tectonic falling and sediment accumulation in Quaternary.
This study has dated 12 samples from the Zhuwobu site in the Huailai Basin, using the MET-pIRIR procedure on multi-grained single and multiple aliquots on K-feldspars. The consistency of the De results obtained from the MAR and SAR procedure mutually supported the reliability of the age results obtained in this study. The pIRIR230°C ages for the samples are broadly consistent with their stratigraphic positions, ranging from ∼300 ka to ∼240 ka from the bottom up (Figure 8A), resulting in a mean sedimentation rate of ∼0.17 m/ka for the profile. Our results suggest that the cultural layers at this site were deposited 280 ± 13 ka (MIS 8) ago, ∼220 ka younger than the previous ESR mean age of 504 ± 76 ka (Li et al., 2018).
Considering the region’s tectonic history activity and the characteristics of the sedimentary facies for the ZWB site, we suggest that the ESR ages in Li et al. (2018), at least for samples HL-03 to -05, might be overestimated due to poor bleaching before burial. While the rejected age of 346 ± 32 ka (MIS 10) for sample HL-02―consistent with our pIRIR230°C age results within 2σ―might be more reliable due to being well-bleached before burial. However, the cultural remains should be even older because they were not buried in situ. Other dating methods, for example, ESR/U-series on animal fossils, or TT-OSL or Paleomagnetic dating on sediments, are encouraged at this site to cross-check the reliability of the pIRIR230 °C and the ESR age results. Further archaeological, geological, and chronological studies are needed to explore the ancient hominins’ survival conditions in the “generalized Nihewan” region and possible connections with the renowned Zhoukoudian sites.
The original contributions presented in the study are included in the article/Supplementary Material, further inquiries can be directed to the corresponding author.
YG: conducted the experiments in the laboratory, performed the data analysis, and wrote the manuscript. QX: conducted the experiments in the laboratory. CL: conducted the experiments in the laboratory. DN: organized the project, collected the samples, draw the figures, and reviewed the manuscript.
This research was supported by the National Natural Science Foundation of China(41902022 and 41702192)and the National Key R&D Program of China(2020YFC1521500).
We would like to thank professors Shuwen Pei from the Institute of Vertebrate Paleontology and Paleoanthropology (IVPP), Chenglong Deng from the Institute of Geology and Geophysics, Chinese Academy of Sciences, Fei Xie from the Hebei Provincial Institute of Cultural Relics and Archaeology for their help in the field investigations and sample collections. We thank the editor and the reviewers for their constructive suggestions for this study.
The authors declare that the research was conducted in the absence of any commercial or financial relationships that could be construed as a potential conflict of interest.
All claims expressed in this article are solely those of the authors and do not necessarily represent those of their affiliated organizations, or those of the publisher, the editors, and the reviewers. Any product that may be evaluated in this article, or claim that may be made by its manufacturer, is not guaranteed or endorsed by the publisher.
The Supplementary Material for this article can be found online at: https://www.frontiersin.org/articles/10.3389/feart.2022.932834/full#supplementary-material
Auclair, M., Lamothe, M., and Huot, S. (2003). Measurement of anomalous fading for feldspar IRSL using SAR. Radiat. Meas. 37, 487–492. doi:10.1016/s1350-4487(03)00018-0
Bar-Yosef, O., and Wang, Y. P. (2012). Paleolithic archaeology in China. Annu. Rev. Anthropol. 41, 319–335. doi:10.1146/annurev-anthro-092611-145832
Bøtter-Jensen, L., Andersen, C. E., Duller, G., and Murray, A. S. (2003). Developments in radiation, stimulation and observation facilities in luminescence measurements. Radiat. Meas. 37, 535–541. doi:10.1016/S1350-4487(03)00020-9
Bøtter-Jensen, L., Bulur, E., Duller, G. A. T., and Murray, A. S. (2000). Advances in luminescence instrument systems. Radiat. Meas. 32, 523–528. doi:10.1016/s1350-4487(00)00039-1
Buylaert, J. P., Jain, M., Murray, A. S., Thomsen, K. J., Thiel, C., and Sohbati, R. (2012). A robust feldspar luminescence dating method for Middle and Late Pleistocene sediments. Boreas 41, 435–451. doi:10.1111/j.1502-3885.2012.00248.x
Buylaert, J. P., Murray, A. S., Thomsen, K. J., and Jain, M. (2009). Testing the potential of an elevated temperature IRSL signal from K-feldspar. Radiat. Meas. 44, 560–565. doi:10.1016/j.radmeas.2009.02.007
Chen, T. M., and Zhou, L. P. (2009). Dating of the peking man site: A comparison between existing chronology and the 26Al/10Be burial ages. Acta Anthropol. Sin. 28, 285–291. (in Chinese with English abstract). doi:10.16359/j.cnki.cn11-1963/q.2009.03.007
Clarkson, C., Harris, C., Li, B., Neudorf, C. M., Roberts, R. G., Lane, C., et al. (2020). Human occupation of northern India spans the Toba supereruption ∼74, 000 years ago. Nat. Commun. 11, 961. doi:10.1038/s41467-020-14668-4
Durcan, J. L., King, G. E., and Duller, G. A. T. (2015). DRAC: Dose rate and age calculator for trapped charge dating. Quat. Geochronol. 28, 54–61. doi:10.1016/j.quageo.2015.03.012
Duval, M., Arnold, L. J., Guilarte, V., Demuro, M., Santonja, M., and Pérez-González, A. (2017). Electron spin resonance dating of optically bleached quartz grains from the Middle Palaeolithic site of Cuesta de la Bajada (Spain) using the multiple centres approach. Quat. Geochronol. 37, 82–96. doi:10.1016/j.quageo.2016.09.006
Feathers, J. K. (2003). Use of luminescence dating in archaeology. Meas. Sci. Technol. 14, 1493–1509. doi:10.1088/0957-0233/14/9/302
Fu, X., Li, B., and Li, S. H. (2012). Testing a multi-step post-IR IRSL dating method using polymineral fine grains from Chinese loess. Quat. Geochronol. 10, 8–15. doi:10.1016/j.quageo.2011.12.004
Galbraith, R. F., Roberts, R. G., Laslett, G. M., Yoshida, H., and Olley, J. M. (1999). Optical dating of single and multiple grains of quartz from jinmium rock shelter, northern Australia: Part I, experimental design and statistical models. Archaeometry 41, 339–364. doi:10.1111/j.1475-4754.1999.tb00987.x
Galbraith, R. F., and Roberts, R. G. (2012). Statistical aspects of equivalent dose and error calculation and display in OSL dating: An overview and some recommendations. Quat. Geochronol. 11, 1–27. doi:10.1016/j.quageo.2012.04.020
Guo, Y. J., Li, B., Zhang, J. F., and Roberts, R. G. (2015). Luminescence-based chronologies for Palaeolithic sites in the Nihewan Basin, northern China: First tests using newly developed optical dating procedures for potassium feldspar grains. J. Archaeol. Sci. Rep. 3, 31–40. doi:10.1016/j.jasrep.2015.05.017
Guo, Y. J., Li, B., Zhang, J. F., Yuan, B. Y., Xie, F., and Roberts, R. G. (2016). Luminescence ages for three ‘Middle Palaeolithic’ sites in the Nihewan Basin, northern China, and their archaeological and palaeoenvironmental implications. Quat. Res. 85, 456–470. doi:10.1016/j.yqres.2016.03.002
Guo, Y. J., Li, B., Zhang, J. F., Yuan, B. Y., Xie, F., and Roberts, R. G. (2017). New ages for the upper Palaeolithic site of Xibaimaying in the Nihewan Basin, northern China: Implications for small-tool and microblade industries in North-East Asia during marine isotope stages 2 and 3. J. Quat. Sci. 32, 540–552. doi:10.1002/jqs.2949
Guo, Y. J., Li, B., and Zhao, H. L. (2020). Comparison of single-aliquot and single-grain MET-pIRIR De results for potassium feldspar samples from the Nihewan Basin, northen China. Quat. Geochronol. 56, 101040. doi:10.1016/j.quageo.2019.101040
Hu, H. B., Tian, L. F., and Sun, L. M. (2000). Characteristics and ages of the Pleistocene lithostratigraphy and biostratigraphy in the Huailai-Zhuolu basin, Hebei. Regional Geol. China 19, 137–143. (in Chinese with English abstract).
Hu, Y., Marwick, B., Zhang, J. F., Rui, X., Hou, Y. M., Yue, J. P., et al. (2019). Late middle Pleistocene levallois stone-tool technology in southwest China. Nature 565, 82–85. doi:10.1038/s41586-018-0710-1
Huntley, D. J., and Lamothe, M. (2001). Ubiquity of anomalous fading in K-feldspars and the measurement and correction for it in optical dating. Can. J. Earth Sci. 38, 1093–1106. doi:10.1139/e01-013
Jacobs, Z., Li, B., Shunkov, M. V., Kozlikin, M. B., Bolikhovskaya, N. S., Agadjanian, A. K., et al. (2019). Timing of archaic hominin occupation of Denisova Cave in southern Siberia. Nature 565, 594–599. doi:10.1038/s41586-018-0843-2
Ji, H., Liu, C. R., Yin, G. M., Wei, C. Y., and Song, W. J. (2021). ESR dating of the Hougou Paleolithic site in the Nihewan Basin, North china, using both additive and regenerative dose methods. Quat. Int. 619, 72–80. doi:10.1016/j.quaint.2021.10.001
Ji, Y. P., and Wang, G. L. (2017). Final disappearing process of the ancient lake during Quaternary in Nihewan. Acta Geosci. Sin. 38, 38–42.
Jia, L. P., Gai, P., and You, Y. Z. (1972). Report on the excavation at zhiyu paleolithic site in shanxi Province. Kaoguxuebao 1, 39–58. (in Chinese).
Lai, Z. P. (2010). Chronology and the upper dating limit for loess samples from Luochuan section in the Chinese Loess Plateau using quartz OSL SAR protocol. J. Asian Earth Sci. 37, 176–185. doi:10.1016/j.jseaes.2009.08.003
Li, B., Jacobs, Z., Roberts, R. G., and Li, S. H. (2013). Extending the age limit of luminescence dating using the dose-dependent sensitivity of MET-pIRIR signals from K-feldspar. Quat. Geochronol. 17, 55–67. doi:10.1016/j.quageo.2013.02.003
Li, B., Jacobs, Z., Roberts, R. G., and Li, S. H. (2014a). Review and assessment of the potential of post-IR IRSL dating methods to circumvent the problem of anomalous fading in feldspar luminescence. Geochronometria 41, 178–201. doi:10.2478/s13386-013-0160-3
Li, B., and Li, S. H. (2012). Luminescence dating of Chinese loess beyond 130 ka using the non-fading signal from K-feldspar. Quat. Geochronol. 10, 24–31. doi:10.1016/j.quageo.2011.12.005
Li, B., and Li, S. H. (2011). Luminescence dating of K-feldspar from sediments: A protocol without anomalous fading correction. Quat. Geochronol. 6, 468–479. doi:10.1016/j.quageo.2011.05.001
Li, B., Roberts, R. G., Jacobs, Z., and Li, S. H. (2014b). A single-aliquot luminescence dating procedure for K-feldspar based on the dose-dependent MET-pIRIR signal sensitivity. Quat. Geochronol. 20, 51–64. doi:10.1016/j.quageo.2013.11.001
Li, B., Roberts, R. G., Jacobs, Z., Li, S. H., and Guo, Y. J. (2015). Construction of a ‘global standardised growth curve’ (gSGC) for infrared stimulated luminescence dating of K-feldspar. Quat. Geochronol. 27, 119–130. doi:10.1016/j.quageo.2015.02.010
Li, C. A. (1992). Analysis on active tectonics of Quaternary period around Fanshan basin in heibei Province. Inland Earthq. 6, 240–245. (in Chinese with English abstract). doi:10.16256/j.issn.1001-8956.1992.03.005
Li, J., and Shi, X. R. (2020). From nihewan to zhoukoudian: The evolution model of paleolithic culture in northern China. J. Shanxi Univ. (Philosophy Soc. Sci. 43, 59–67.
Li, W. P., Liu, C. R., Niu, D. W., Wei, C. Y., and Li, J. P. (2018). Electron spin resonance data of the zhuwobao paleolithic site in the Huailai basin of China. Quat. Sci. 38, 680–687. (in Chinese with English abstract). doi:10.11928/j.issn.1001-7410.2018.03.12
Liritzis, I., Singhvi, A. K., Feathers, J. K., Wagner, G. A., Kadereit, A., Zacharias, N., et al. (2013). Luminescence dating in archaeology, anthropology, and geoarchaeology: an overview. Heidelberg: Springer.
Lisiecki, L. E., and Raymo, M. E. (2005). A Pliocene–Pleistocene stack of 57 globally distributed benthic δ 18O records. Paleoceanography 20, PA1003. doi:10.1029/2004pa001071
Liu, Y., and Yang, C. h. (2014). Unveiling the secrets to her heart. Neuron 2, 3–5. doi:10.1016/j.neuron.2014.06.019
Lu, Y., Sun, X. F., Zhao, H. L., and Tan, P. Y. (2021). Luminescence dating of youfangbei early late Pleistocene site, Nihewan Basin, north China. Quat. Res. 104, 159–169. doi:10.1017/qua.2021.19
Murray, A. S., and Roberts, R. G. (1998). Measurement of the equivalent dose in quartz using a regenerative-dose single-aliquot protocol. Radiat. Meas. 29, 503–515. doi:10.1016/s1350-4487(98)00044-4
Murray, A. S., and Wintle, A. G. (2000). Luminescence dating of quartz using an improved single-aliquot regenerative-dose protocol. Radiat. Meas. 32, 57–73. doi:10.1016/s1350-4487(99)00253-x
Murray, A. S., and Wintle, A. G. (2003). The single aliquot regenerative dose protocol: Potential for improvements in reliability. Radiat. Meas. 37, 377–381. doi:10.1016/s1350-4487(03)00053-2
Nian, X. M., Zhou, L. P., and Yuan, B. Y. (2013). Optically stimulated luminescence dating of terrestrial sediments in the Nihewan Basin and its implication for the evolution of ancient Nihewan Lake. Quat. Sci. 33, 403–414. (in Chinese with English abstract). doi:10.3969/j.issn.1001-7410.2013.03.01
Niu, D. W., Wang, X. M., Li, D. Y., and Xie, F. (2022). Report on the test excavation at Zhuwobu paleolithic site in Huailai county, Hebei Province. Archaelogy 3, 243–252. (in Chinese).
Niu, D. W., Xue, F., Li, D. Y., Li, Y. H., and Xie, F. (2017). A report on paleolithic survey of 2014 in Huailai basin, Hebei Province. Acta Anthropol. Sin. 37, 79–87. (in Chinese with English abstract). doi:10.16359/j.cnki.cn11-1963/q.2017.0071
Peng, J., Dong, Z. B., Han, F. Q., Long, H., and Liu, X. J. (2013). R package numOSL: numeric routines for optically stimulated luminescence dating. Anc. TL 31, 41–48.
Peng, J., and Li, Bo. (2017). Single-aliquot regenerative-dose (SAR) and standardised growth curve (SGC) equivalent dose determination in a batch model using the R package 'numOSL. Anc. TL 35, 32–53.
Ran, Y. K., Fang, Z. J., Li, Z. Y., Wang, J. B., and Li, R. C. (1992). Paleoseismicity and segmentation along the active fault at the north boundary of huai-zhuolu basin, Hebei Province. Earthq. Res. China 8, 74–85. (in Chinese with English abstract).
Rhodes, E. J. (2011). Optically stimulated luminescence dating of sediments over the past 200, 000 years. Annu. Rev. Earth Planet. Sci. 39, 461–488. doi:10.1146/annurev-earth-040610-133425
Rui, X., Guo, Y. J., Zhang, J. F., Hu, Y., Mei, H. J., Wang, Y. P., et al. (2019). Luminescence chronology of the palaeolithic–neolithic transition in the yujiagou site at the Nihewan Basin, northern China. J. Quat. Sci. 34, 125–137. doi:10.1002/jqs.3086
Rui, X., Li, B., and Guo, Y. J. (2020a). Testing the upper limit of luminescence dating based on standardised growth curves for MET-pIRIR signals of K-feldspar grains from northern China. Quat. Geochronol. 57, 101063. doi:10.1016/j.quageo.2020.101063
Rui, X., Li, B., and Guo, Y. J. (2020b). The effect of residual signal on dose measurements using MET-pIRIR signals from K-feldspar. Quat. Geochronol. 58, 101065. doi:10.1016/j.quageo.2020.101065
Thiel, C., Buylaert, J. P., Murray, A., Terhorst, B., Hofer, I., Tsukamoto, S., et al. (2011). Luminescence dating of the Stratzing loess profile (Austria)–testing the potential of an elevated temperature post-IR IRSL protocol. Quat. Int. 234, 23–31. doi:10.1016/j.quaint.2010.05.018
Thomsen, K. J., Murray, A. S., Jain, M., and Bøtter-Jensen, L. (2008). Laboratory fading rates of various luminescence signals from feldspar-rich sediment extracts. Radiat. Meas. 43, 1474–1486. doi:10.1016/j.radmeas.2008.06.002
Toyoda, S., Voinchet, P., Falguères, C., Dolo, J. M., and Laurent, M. (2000). Bleaching of ESR signals by the sunlight: a laboratory experiment for establishing the ESR dating of sediments. Appl. Radiat. Isotopes 52, 1357–1362. doi:10.1016/s0969-8043(00)00095-6
Wallinga, J., Murray, A., and Wintle, A. (2000). The single-aliquot regenerative-dose (SAR) protocol applied to coarse-grain feldspar. Radiat. Meas. 32, 529–533. doi:10.1016/s1350-4487(00)00091-3
Wang, F. G., Guo, Y. J., Xian, Q., Li, M. Y., Rui, X., and Xie, F. (2021). Luminescence chronology for the Paleolithic site of Xinmiaozhuang Locality 1 (XMZ1) in the Nihewan Basin, northern China, and its paleoenvironmental and archaeological implications. J. Hum. Evol. 157, 103033. doi:10.1016/j.jhevol.2021.103033
Wang, F., Xun, S., Peng, J., Huang, Q., Zhao, J., Meng, Z., et al. (2020). A study of the symbiotic relationship between tectonic fissures and faults in the Fenwei Graben System, China. Environ. Earth Sci. 79, 212. doi:10.1007/s12665-020-08966-9
Wang, X. (2014). Optically stimulated luminescence dating of sand-dune formed within the little ice age. J. Asian Earth Sci. 91, 154–162. doi:10.1016/j.jseaes.2014.05.012
Wintle, A. G., and Murray, A. S. (2006). A review of quartz optically stimulated luminescence characteristics and their relevance in single-aliquot regeneration dating protocols. Radiat. Meas. 41, 369–391. doi:10.1016/j.radmeas.2005.11.001
Wu, Z. R., Yuan, B. Y., Sun, J. Z., and Liu, Z. S. (1979). Neotectonics and seismicity of yan-Huai basin in Hebei Province. Seismol. Geol. 1, 46–56. (in Chinese with English abstract).
Xie, F., Li, J., and Liu, L. Q. (2006). Paleolithic archeology in the Nihewan Basin. Shijiazhuang: Huashan Literature and Arts Press. (in Chinese).
Yang, S. X., Deng, C. L., Zhu, R. X., and Petraglia, M. D. (2020). The paleolithic in the Nihewan Basin, China: Evolutionary history of an early to late Pleistocene record in eastern Asia. Evol. Anthropol. 29, 125–142. doi:10.1002/evan.21813
Yin, G. M., and Lu, Y. C. (1996). The Quaternary tectonic events in the Yanqing faulting-down Basin, Beijing. North China Earthq. Sci. 14, 19–30. (in Chinese with English abstract)
Yokoyama, Y., Falgueres, C., and Quaegebeur, J. P. (1985). ESR dating of quartz from quaternary sediments: first attempt. Nucl. Tracks Radiat. Meas. 10, 921–928. doi:10.1016/0735-245x(85)90109-7
Yuan, B. Y., Xia, Z. K., and Niu, P. S. (2011). Nihewan rift and early man. Beijing: Geology Press. (in Chinese).
Zhang, J. J., and Li, S. H. (2020). Review of the post-IR IRSL dating protocols of K-feldspar. Methods Protoc. 3, 7. doi:10.3390/mps3010007
Zhang, S. S. (1999). On the important advancements of the Palaeolithic archeology in China since 1949 (in Chinese with English abstract). Acta Anthr. Sin. 18, 193–214.
Zhang, S. S. (1990). Regional industrial gradual advance and cultural exchange of Paleolithic in North China (in Chinese with English abstract). Acta Anthr. Sin. 9, 322–333.
Zhao, H., Lu, Y., Wang, C., Chen, J., Liu, J., and Mao, H. (2010). ReOSL dating of aeolian and fluvial sediments from Nihewan Basin, northern China and its environmental application. Quat. Geochronol. 5, 159–163. doi:10.1016/j.quageo.2009.03.008
Zheng, R. Z., Ji, F. J., and Li, J. P. (2001). Lake development and climatic changes, during the middle and late times of Late Pleistocene in the Yan-Huai Basin. Seismol. Geol. 23, 55–62. (in Chinese with English abstract). doi:10.3969/j.issn.0253-4967.2001.01.007
Zhu, R. X., Potts, R., Xie, F., Hoffman, K. A., Deng, C. L., Shi, C. D., et al. (2004). New evidence on the earliest human presence at high northern latitudes in northeast Asia. Nature 431, 559–562. doi:10.1038/nature02829
Keywords: Huailai basin, MET-pIRIR, K-feldspar, ESR, the “generalized Nihewan Basin”
Citation: GUO Y, XIAN Q, LU C and NIU D (2022) Redating the Zhuwobu Paleolithic site in the Huailai basin, North China, using the MET-pIRIR procedure on K-feldspars. Front. Earth Sci. 10:932834. doi: 10.3389/feart.2022.932834
Received: 30 April 2022; Accepted: 21 July 2022;
Published: 19 August 2022.
Edited by:
Yuxin Fan, Lanzhou University, ChinaCopyright © 2022 GUO, XIAN, LU and NIU. This is an open-access article distributed under the terms of the Creative Commons Attribution License (CC BY). The use, distribution or reproduction in other forums is permitted, provided the original author(s) and the copyright owner(s) are credited and that the original publication in this journal is cited, in accordance with accepted academic practice. No use, distribution or reproduction is permitted which does not comply with these terms.
*Correspondence: Dongwei NIU, bmR3MTk4NkAxNjMuY29t
Disclaimer: All claims expressed in this article are solely those of the authors and do not necessarily represent those of their affiliated organizations, or those of the publisher, the editors and the reviewers. Any product that may be evaluated in this article or claim that may be made by its manufacturer is not guaranteed or endorsed by the publisher.
Research integrity at Frontiers
Learn more about the work of our research integrity team to safeguard the quality of each article we publish.