 Li Li
Li Li Fangzhou Shen
 Zhiguo He
 Zhuzhu Yu1
94% of researchers rate our articles as excellent or good
Learn more about the work of our research integrity team to safeguard the quality of each article we publish.
Find out more
ORIGINAL RESEARCH article
Front. Earth Sci., 29 August 2022
Sec. Geohazards and Georisks
Volume 10 - 2022 | https://doi.org/10.3389/feart.2022.932149
This article is part of the Research TopicSediment Dynamics and Geohazards in Estuaries and DeltasView all 14 articles
Typhoons are extreme weather events that cause serious social and economic losses in coastal and estuarine areas worldwide. Understanding the impact of typhoons on sediment dynamics is essential for protecting coastal areas from these marine disasters. Hangzhou Bay is macro-tidal, turbid, and frequently affected by strong typhoons. In this study, we established and validated a three-dimensional model coupling waves, current, and sediment to investigate the sediment dynamics in Hangzhou Bay during Typhoon Chan-hom. The results showed that high suspended sediment concentration (SSC) areas during the typhoon were mainly located at the bay head and near the southern shore near the Andong tidal flat. The maximum bottom SSC was at least twice that near the surface. The peak bottom SSC values at the peak flood (6 g/L) were larger than those at the peak ebb (5 g/L) owing to the stronger current velocity at peak flood. The SSC near the northern shore was larger at the peak flood than at other times, and the SSC was high at the southern shore at peak ebb at the cross-section near the Andong tidal flat. The typhoon impacted SSC by changing the bottom stress. SSC was most influenced by wave action, followed by wind stress action, and was least influenced by air pressure action, which contributed 71.3%, 69.9%, and 1.8% to the bottom stress, respectively. Our findings are scientifically important for research on geomorphological evolution and are practically meaningful for coastal management.
1) We built and validated a numerical model coupling tides, waves, surges, and sediments to study sediment dynamics during Typhoon Chan-hom in Hangzhou Bay.
2) Suspended sediment concentration (SSC) during storm tides was double that during calm weather, and peak SSC and sediment fluxes occurred near the bay head and southern shore.
3) The large bottom stress caused by strong waves and winds, combined with strong advection changed the SSC and sediment fluxes in the bay during the storm tides.
4) Wave, wind stress, and air pressure contributed 71.3%, 69.9%, and 1.8% to the bottom stress, respectively and subsequently changed the SSC in HZB.
Typhoons are extreme weather events that cause serious social and economic losses in coastal and estuarine areas worldwide (Peduzzi et al., 2012; Walsh et al., 2016; Cong et al., 2021). Owing to strong sea–air interactions, typhoons have remarkable effects on water level rise (Wang et al., 2020), tidal range changes (Pan et al., 2021; Wang et al., 2021), water circulation structure (Wu et al., 2016), sediment transport (Liu et al., 2011), and sea bed evolution (van Rijn, 2011; Xu, 2019). In particular, the transport, deposition, and burial of sediments on a continental shelf can lead to severe erosion near the track, the offshore movement of sand ridges, and deposition of layers of up to 25 cm during a storm (Allison et al., 2005; Goff et al., 2010; Li et al., 2015; Zang et al., 2018; Li H. et al., 2019).
Coastal and estuarine hydro-sediment dynamics are considerably affected by typhoons. In situ time-series observations in the northern South China Sea confirmed that typhoon events can intermittently block coastal upwelling (Zheng et al., 2018). Coastal topography and hydrological data from the northern coast of Hangzhou Bay before and after Typhoon Metsa revealed the response of the coast to the typhoon, including the advance and retreat of the shoreline and the washout of the topography of the silty coast (Dai et al., 2009). Remote sensing is one of the main methods used to obtain the suspended sediment concentration (SSC) (Li, 1987). Another method used for investigating the impact of typhoons is the rapid inversion and correction of the spatial and temporal SSC distribution in a sea area using remote sensing data (Liu et al., 2013; Wang et al., 2014; Jiang et al., 2015), the availability and quality of satellite data are affected by the thick clouds and water vapor in the air during typhoons (Wang et al., 2018a; Tang et al., 2021). In situ and satellite observations are the most direct methods used to obtain SSCs; however, they provide only local descriptions and cannot synchronously measure SSCs (Green et al., 1995; Williams and Rose, 2001; Aagaard et al., 2012; Wang et al., 2018b). Therefore, numerical models have become an important for analyzing sediment dynamics during typhoons. Numerical models have been combined with empirical data to study sediment transport and tidal flat siltation during typhoons in different regions (van Rijn, 2011; Oberle et al., 2014; Palinkas et al., 2014; Huang, 2017; Xu, 2019), showing that storm surges and wind-generated currents are the main forces driving sediment transport. Wind currents, combined with tidal currents, increase current velocities and accelerate sediment transport, and waves are the dominant factor affecting suspended sediment (Jiang et al., 2014). For example, when the water depth is less than 30 m, 49% of the sediment is mobilized in shelf areas (Oberle et al., 2014). Enhanced wave–current dynamics and increased bed shear stress during typhoons are the main reasons for the sharp increase in SSC; sediment is exchanged between channels and shoals during a typhoon, which affects the SSC distribution for up to 1 month (Tang et al., 2021).
Hangzhou Bay (Figure 1) is one of the most turbid estuaries in the world, with a multiyear average suspended particle concentration of 1.58 g/L in the tidal flats of the bay (Liu, 2013). It is a typical well mixed estuary. Tidal current is strong. Waves and runoff are relatively weak. The turbulence generated by bottom friction is enough to stir the entire water column (Ji and Lu, 2007). The suspended sediment concentration of Qiantang River discharges is lower than 0.25 g/L (Pan et al., 2013), and the particle sizes of suspended sediment and bed load are about 0.023 and 0.055 mm. The sediment supply is mainly from the Yangtze River (Wang and Esima, 1990). The large amount of sediment brought by the flood current accumulates as sandbar, and there are many obvious scour channels and sand ridges in the estuary (Ji and Lu, 2007). Reclamation and other marine engineering changed the estuarine bathymetry. Researchers have focused on setting parameters of suspended cohesive sediments (Wang et al., 2018a), the effect of waves on the sediment flushing process (Lu et al., 2019), the variation in near-bottom flow velocity for different wind directions, and sediment erosion rate under with wind directions and speeds (Shi et al., 2008). The spring-neap tides control SSC distribution and variation in shallow coastal areas. The increased turbulence energy during the typhoon affects the vertical mixing depth, thereby increasing the SSC on the surface (Li and Li, 2016). Wang et al. (2020) used the finite-volume coastal ocean model (FVCOM) to reappear tidal flooding in the south Yangtze coastal plain during the middle Holocene during sea level rise and storm surges (Huang et al., 2021). Model results showed that typhoons also induce larger tidal bores in Hangzhou Bay (Wang et al., 2021). The East China Sea is affected by an average of four typhoons per year (Lu et al., 2019). Extreme weather results in a large amount of sediment transport in estuaries within a short time, thus changing the topography (Xu, 2019). The effects of typhoon events on sediment in estuaries are related to estuary types (Leonardi et al., 2018). Hangzhou Bay is a macrotidal turbid bay with funnel-shaped geomorphology, which is frequently impacted by typhoons. Therefore, we want to investigate the sediment characteristics and mechanism during typhoons.
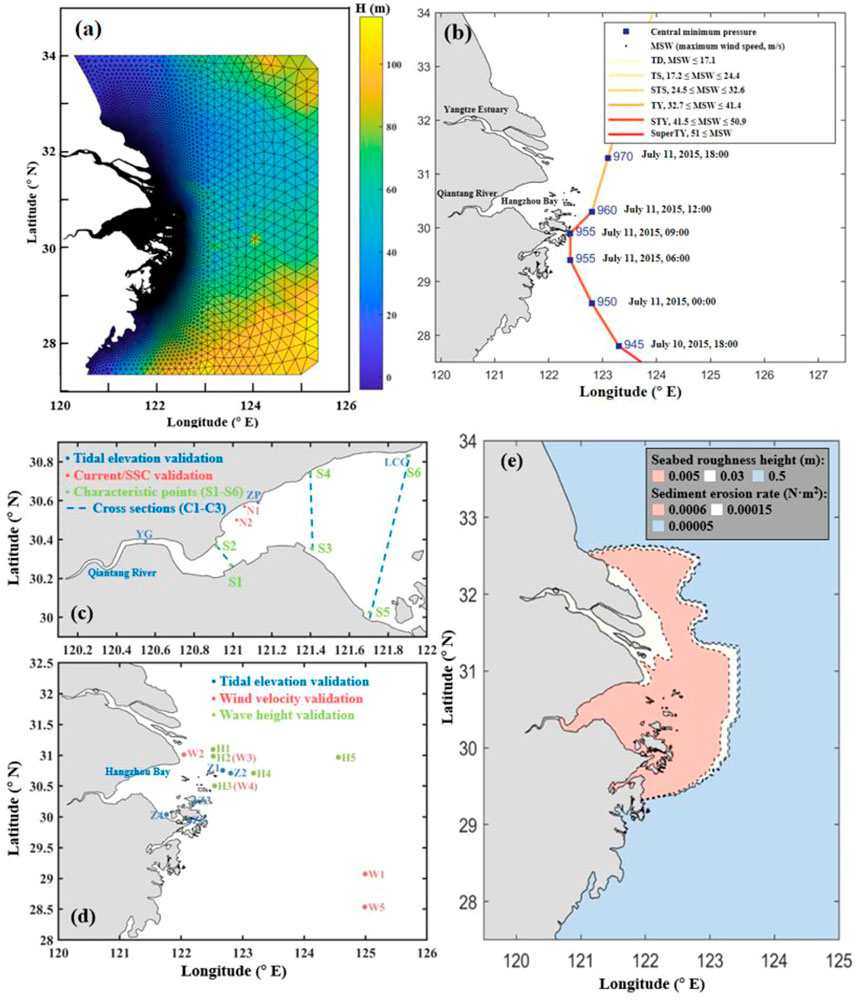
FIGURE 1. (A) Model domain. (B) Information of the Typhoon Chan-hom. (C) and (D) Field stations for model validation. (E) Settings for bottom friction.
In this study, we established and validated a three-dimensional wave-current-sediment coupling model of Hangzhou Bay to simulate the sediment dynamics in Hangzhou Bay during Typhoon Chan-hom in 2015. We studied the effects of typhoon on SSC contribution and sediment transport in Hangzhou Bay, analyzed the influence of wind stress, atmospheric pressure and waves on the distribution of suspended sediment in Hangzhou Bay, and calculated the bottom stress to analyze the influence mechanism of different factors on the SSC distribution.
We used an unstructured grid FVCOM (Chen et al., 2003; Chen et al., 2006) to investigate the impact of typhoons on sediment transport in Hangzhou Bay. We discretized the FVCOM with an unstructured triangular mesh in the horizontal direction and a generalized terrain-following coordinate system in the vertical direction. The finite-volume method ensured the volume and mass conservation of the model. In the model, we adopted the Mellor and Yamada level 2.5 (MY-2.5) turbulence closure scheme to close the equation (Mellor and Yamada, 1982). We used FVCOM-SWAVE to simulate the generation and propagation of the typhoons and waves. This model is based on the third-generation wave model, SWAN, which is based on the Eulerian formulation of the discrete spectral balance of action density (Booij et al., 1999). The equations governing the model are as follows:
where x, y, and σ are the east, north, and vertical coordinates in the σ coordinate system, respectively; t is the time; u, v, and w are the velocity components in the three directions, respectively;
The sediment model in FVCOM (Wang, 2002; Ye, 2019) further considers the influence of sediment on water density, the influence of floating mud on bottom friction, and the flocculation and sedimentation processes.
1) The suspended sediment boundary conditions are described as follows:
where E is the sediment resuspension flux and D is the bottom sediment deposition flux.
where
where
where
where
2) Water-sediment density coupling. The high SSC affects the vertical distribution of water density in Hangzhou Bay. The influence of SSC on water density reflects the influence of sediments on water stratification.
where
3) Effect of mud. Mud often occurs in Hangzhou Bay when the water flow velocity is low owing to the high sediment content. The rheological and consolidation characteristics of mud have a substantial effect on the bottom boundary layer. Referring to Wang et al. (2005), we introduced the flux Richardson number in the turbulent closed equation into the friction coefficient equation to reduce
where A=5.5 is the empirical parameter; Rf is the Richardson number, which is related to the vertical density gradient.
where Km is the vertical eddy viscosity coefficient.
4) Flocculation sedimentation. Fine sediment is easily flocculated at a high SSC. Sediment settles in the form of flocs, which is different from a single particle. Shi et al. (2008) found that, by comparing various flocculation settlement formulas, the suspended sediment flocculation settlement formula proposed by Cao and Wang (1994) is the most suitable for numerically simulating suspended sediment near the Yangtze River estuary. Therefore, we used the settling velocity formula proposed by Cao and Wang (1994) for the sediment model,
where
5) Thickness of erosion and deposition. We used the following relationship (Harris and Wiberg, 1997) to represent the active-layer thickness of the bottom sediment:
where
We used the Fujita–Takahashi formula (Wang et al., 1991) and reanalyzed ECMWF wind field data to reconstruct the pressure and wind fields for the wave–current–sediment coupling model. Fujita-Takahashi pressure field formula:
where
After we constructed the pressure field, we used the gradient wind formula to calculate the corresponding wind field distribution according to the pressure distribution. The gradient wind formula is:
where f Coriolis force parameter and
Selecting the maximum wind radius R is key to calculating the typhoon field in a typhoon simulation. We adopted the empirical formula (Li, 1987) in this study for calculation, and verified and adjusted the formula according to the measured wave data:
where
Finally, we superimposed the gradient wind field and ECWMF background wind field with a certain weight to construct a new synthetic wind field:
where
where n = 9 is the same as in (Liu et al., 2013).
The velocity components of the synthetic wind field are
where u is the east–west directional velocity component, v is the south–north directional.velocity component, and
typhoon center and the direction due east.
We selected the field wind data at five stations (W1 were selected W5) to validate the reconstructed wind fields. The field data period ranged from July 1 to 15, 2015, including July 10 to 12, when Hangzhou Bay was affected by Typhoon Chan-hom (Figure 1B). Few wind field data during typhoons are available, whereas the reconstructed wind field data effectively increased the accuracy of the wind speed prediction during typhoons, the values of which were closer to the field data (Figure 2). The reconstructed wind field data more accurately fit the trajectory and center of the typhoon (Figure 3). The modified wind field data have a higher temporal resolution (1 h) during typhoons than the ECMWF data (6 h).
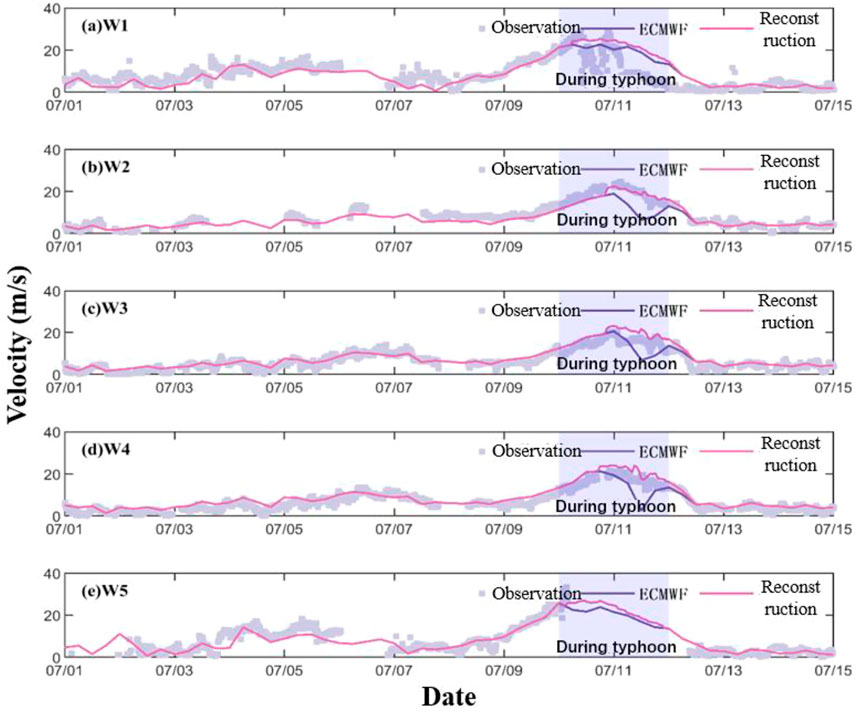
FIGURE 2. Synthetic wind field data (purple lines) vs. ECMWF wind field data (blue lines) vs. observational data (gray dots) at the five stations W1 to W5.
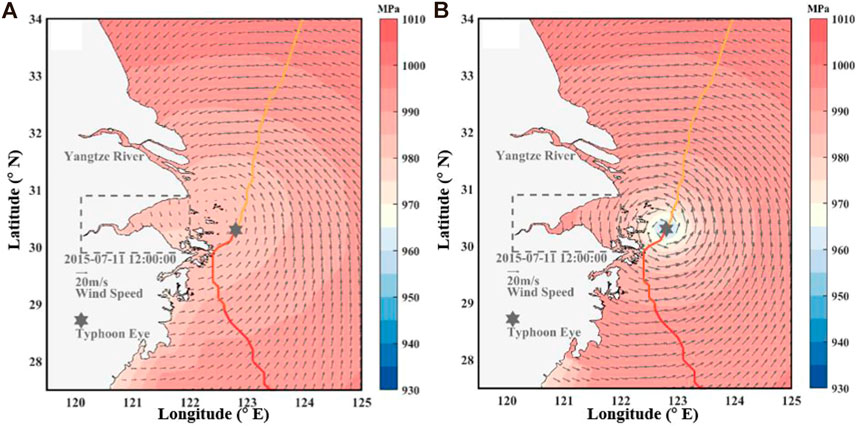
FIGURE 3. Comparison of (A) ECMWF and (B) synthetic wind field distribution (11 July 2015, 12:00:00).
We used an unstructured triangular mesh for the model domain covering the Yangtze River estuary, Hangzhou Bay, Zhoushan Archipelago, and most of the East China Sea (120°–125.5° E, 27.5°–34° N), with 60,441 nodes and 114,211 cells. We varied the horizontal resolution of the mesh from 100 to 200 m in Hangzhou Bay and the Zhoushan Archipelago to approximately 30 km at the open boundary to consider both calculation efficiency and accuracy. We vertically divided the water column into 11 uniform sigma layers. To refine the study area with notable changes in water and sediment elements, we set the proportion of each layer to the total water depth to 0.0, −0.02, −0.08, −0.18, −0.32, −0.5, −0.68, −0.82, −0.92, −0.98, and −1.0. We obtained eight major astronomical tidal constituents (K1, O1, P1, Q1, M2, S2, N2, and K2) from TPXO8 for tidal forcing (Egbert and Erofeeva, 2002). We set the initial temperature and salinity to 20°C and 30‰, respectively, because of the short-term nature of the simulation. We considered only viscous sand for the sediment. We set the median particle size and critical shear stress for erosion to 0.008 mm and 0.1 Nm2, respectively (Pan et al., 2013). Because of the difference of the particle size of the bottom sediment (Pan et al., 2013; Zhang et al., 2013) and the influence of the floating mud in the simulation area, Hangzhou Bay, we then determined the initial sediment erosion rate (E0) and seabed roughness height (Z0) by region (Ye, 2019) (Figure 1 and Table 1).
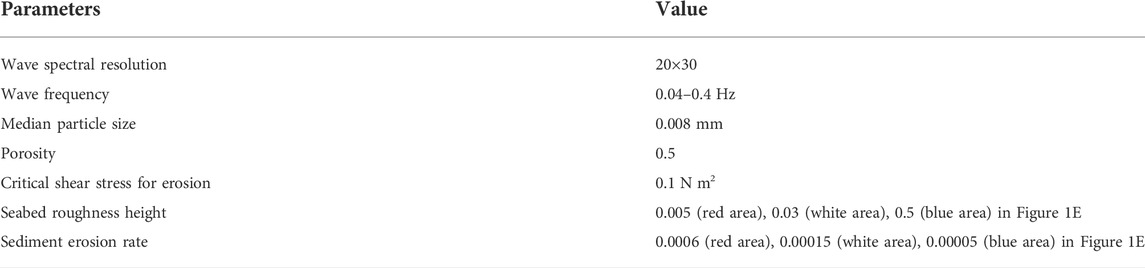
TABLE 1. Main parameters of the sediment and wave models.
We divided the validation of the model into two parts: validation of tidal currents and SSC during calm weather (March 1 to 31, 2013) and validation of tidal currents and wave heights during a typhoon (June 28 to 15 July 2015). We validated the model using multiple observational datasets, including the tidal elevation at seven stations (YG, ZP, and LCG, March 1 to 31, 2013; Z1, Z2, Z3, Z4, and Z5, June 28 to 15 July 2015); currents and SSC at two stations (N1 and N2) from March 1 to 31, 2013; substantial wave heights at five stations (H1, H2, H3, H4, and H5) and wind velocities at five stations (W1, W2, W3, W4, and W5) during Typhoon Chan-hom. The measured data were provided by Shanghai Typhoon Research Institute. The measured data used in this paper were provided by the Shanghai Meteorological Service, the Center for Numerical Prediction and Innovation, and the Zhejiang Marine Monitoring and Forecasting Center (He et al., 2020).
We used the correlation coefficients (CC) and model evaluation coefficient (Skill) (Murphy, 1992) to evaluate the credibility and accuracy of the model.
where mi and Oi are the simulated and observed data, respectively;
The simulated tidal elevation was in good agreement with observational data. The Skill and CC of LCG and ZP were above 0.96. Station YG is vulnerable to tidal surges because it is located upstream of the Qiantang River estuary. Therefore, the Skill and CC at this station were relatively low, 0.84 and 0.70, respectively (Ye, 2019).
We used observational tidal elevation data at five stations (Z1, Z2, Z3, Z4, and Z5, which are the blue points in Figure 1E) to validate the tide elevation during Typhoon Chan-hom. The values of Skill and CC in Table 2 and Figure 4 show that the simulated values and observational data of tidal elevation fit well at all five stations.
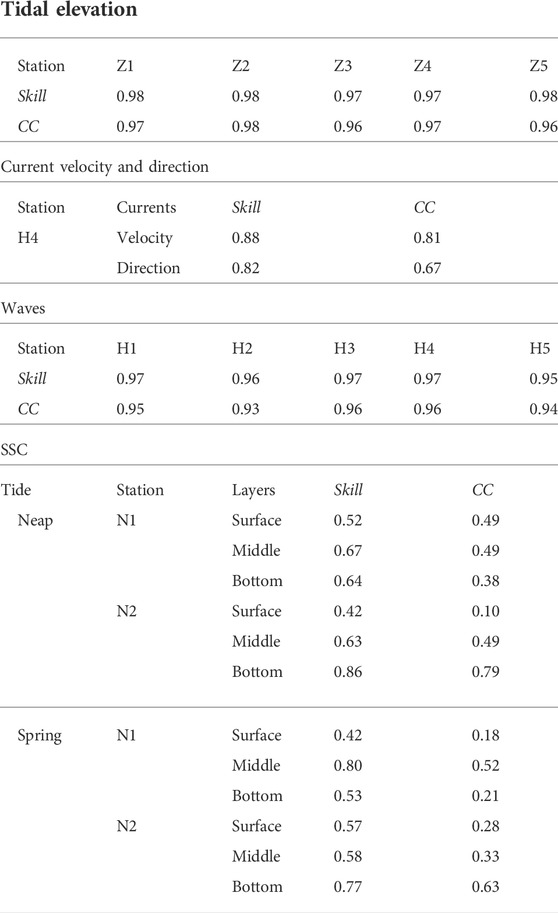
TABLE 2. Model validation.
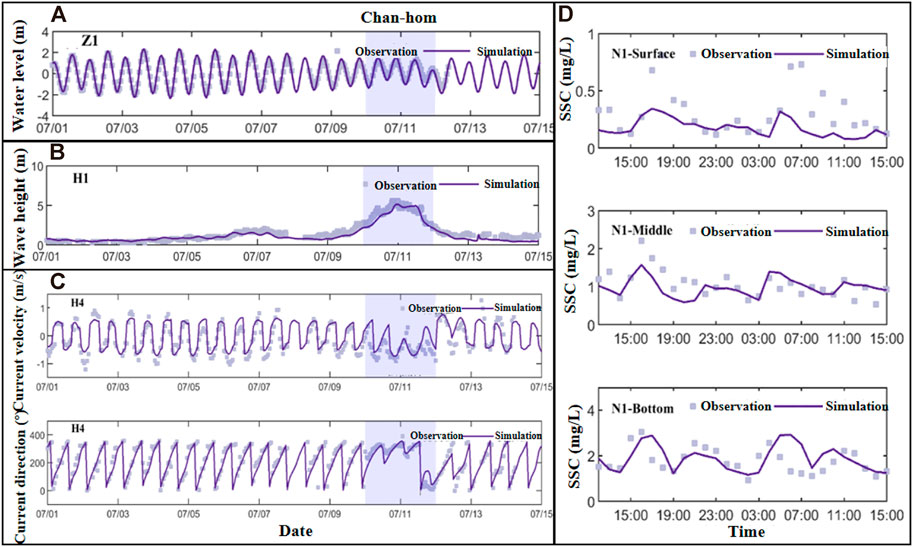
FIGURE 4. Model validation for (A) sea surface level, (B) significant wave height, (C) current magnitude and direction, and (D) suspended sediment concentration.
We obtained the current velocity data from two stations (N1 and N2, which are red points in Figure 1E). We obtained high quality validation results for current velocity and direction for each layer at N1 and N2 stations. The CC and Skill of each layer of current velocity during the neap tide (12:00 on March 6 to 16:00 7 March 2013) were above 0.9. The minimum CC of each layer in the current direction was 0.78 and Skill was greater than 0.84. The simulation results were relatively poor during spring tide (8:00 March 12 to 9:00 13 March 2013), and the minimum Skill and CC were 0.82 and 0.66, respectively (Ye, 2019).
We obtained current data on typhoon weather from station H4. The Skill and CC of the current velocity were 0.88 and 0.81, respectively; those of the current direction were 0.82 and 0.67, respectively. In general, the results of the current validation were good.
The Skill of the substantial wave heights was higher than 0.95, and the CC was higher than 0.93. Overall, the simulated wave height values matched the observational data well, so we found that the model was able to accurately simulate the process of wave generation and extinction during typhoons, laying a suitable foundation for analyzing the effect and influence of waves.
The SSC validation results at stations N1 and N2 were consistent with the vertical distribution of the actual SSC. The model accurately reflected the trend in the variation in SSC over time. The Skill of SSC in the surface layer were lower than those in the other two layers. When the SSC was large, the simulated surface SSC at N1 (Figure 4) was smaller than the measured data. The N1 station is nearshore. The instantaneous SSC at station N1 is subject to various factors, which would impact the model validation. Moreover, we ignore wave-current interaction and wind during calm weather, which may result in low surface SSC. In general, the quality of the results of SSC validation were not as high as those of hydrodynamic validation. The simulation results met the reliability requirement that the Skill value be greater than 0.5. Therefore, based on the model results, we studied the sediment dynamic characteristics during a typhoon in Hangzhou Bay. More information about the model validation was provided by Yu (2020) and He et al. (2020).
Sediment flux is one of the main parameters used to study sediment transport. We believe that sediment is mainly transported by current. So, we use the current velocity and SSC of each layer to calculate sediment flux at different locations in the paper, and then we integrate it over time to get the net flux.
where
We analyzed the surge characteristics and SSC in Hangzhou Bay before and after the typhoon based on the results of the model. To facilitate the analysis, we selected six characteristic points (S1–S6) and three cross-sections (C1–C3) in Hangzhou Bay, and divided the bay into three parts: the top (TB), center (CB), and mouth (MB) of the bay.
The maximum water levels (4.03, 3.98, 2.93, 2.96, 2.44, 2.33 m at S1 to S6, respectively) all occurred during high slack water. We found that the difference in water levels between the northern and southern shores in the same section was small. Similarly, the maximum surge values at S1 to S6 were 2.04, 1.95, 1.55, 1.42, 1.50, and 1.10 m, respectively. The surges on the southern shore were larger than those on the northern shore. The surges in the MB were smaller than those in the CB and TB. From the MB to TB, the maximum surge occurred approximately 2 h later. As the typhoon approached, the peak surge advanced from the MB to the TB (Figure 5).
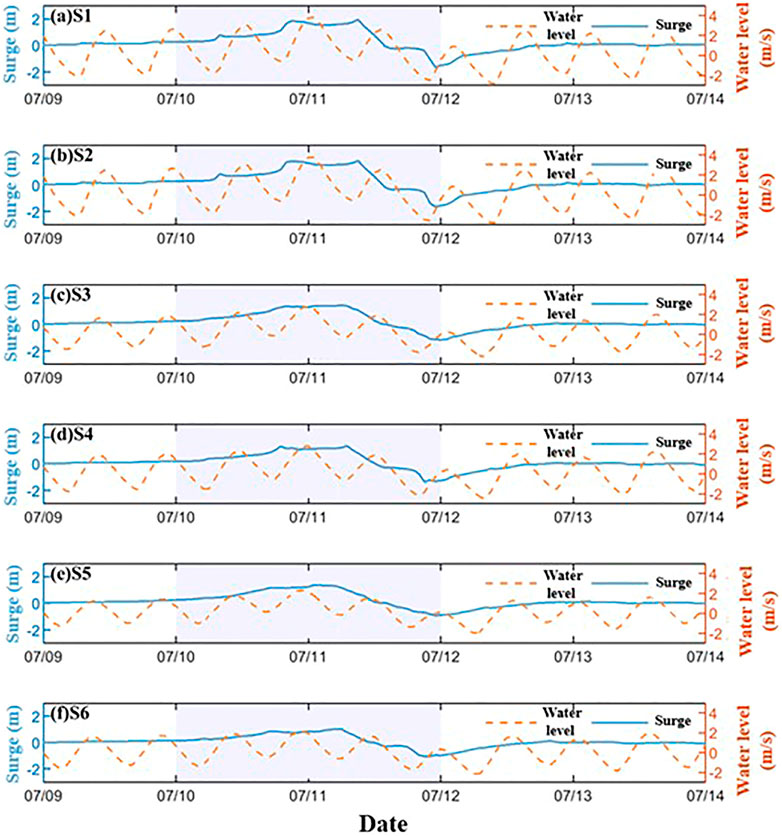
FIGURE 5. Comparison between surge and water level from July 9 to 14 July 2015 at stations (A–F) stations S1 to S6, respectively. Surge is the water level difference between Case0 and Case4.
With the gradual approach of the typhoon, the water level at MB was the first to increase. Subsequently, the surge propagated to the CB and TB. The maximum sea surface levels at the MB and CB were 2.5 and 3.5 m, respectively. At 1:00 on 11 July 2015, the sea surface level at the TB was 4.0 m at C1. Similarly, the maximum surge advanced from the MB to the TB, with the maximum surge of approximately 1.2 m at C3 in the MB and up to 1.5 m at C2 in the CB, and finally reached a maximum of 3.0 m in the TB at 00:00 on 11 July 2015. The typhoon affected the surge to a lesser extent, which was always smaller in the MB because the MB is wide and deep, so the geomorphology had a lesser effect here than at the TB. The bay is sheltered from the impact of typhoons by the Zhoushan Islands. The maximum surge was mainly related to the distance between typhoon and Hangzhou Bay. The maximum water level was predominantly influenced by the tidal level. The time of the maximum tidal level at each point was later than the time of the maximum surge. So, the surge increased before the water level and the maximum surge occurred earlier than the maximum water level. More information about the sea surface level, surge, currents, and waves was provided by Yu (2020) and Li et al. (2022).
As the typhoon approached, the SSC increased in most areas of the bay (Figures 6A,B). In the southern part of the MB, the SSC at the surface and bottom layers was always approximately 1 g/L. The high-SSC area in the middle of the MB gradually expanded northward. Finally, the surface and bottom SSC in the northern part of the MB reached 5 and 10 g/L, respectively. Similar to the MB, the SSC in the CB extended from the southern shore to the north. The surface and bottom SSC increased from 2.5 to 4.5 and 5–12 g/L, respectively. The cross-section of the TB was narrow, so the SSC substantially changed under the influence of the typhoon. During the typhoon, the SSC throughout the water column in the TB increased, with the surface and bottom SSC reaching 5.5 and 14 g/L, respectively.
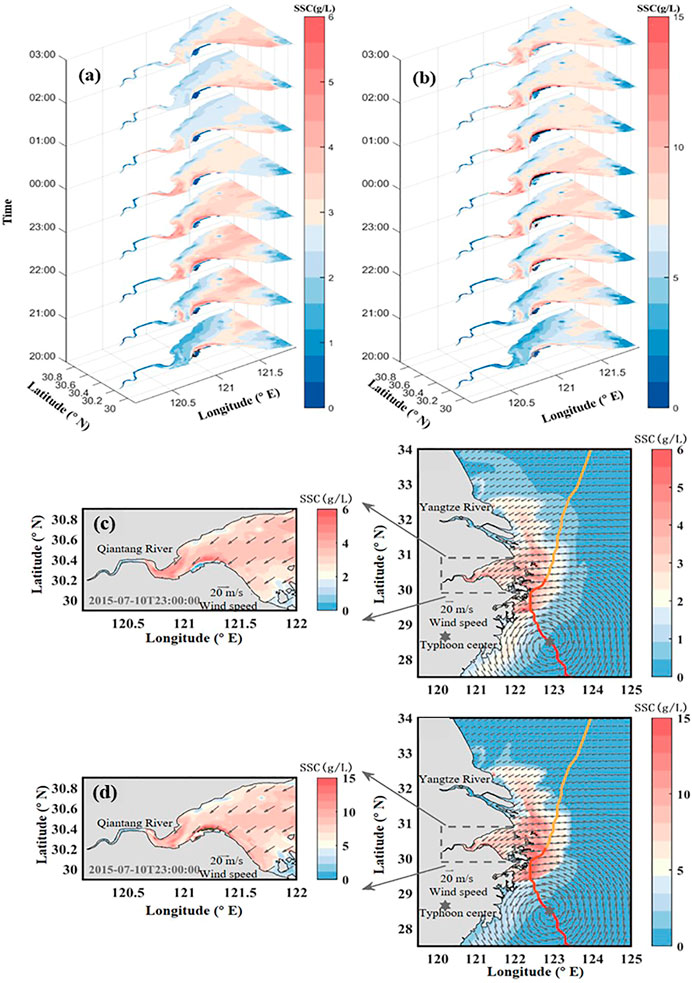
FIGURE 6. Time-series of SSC distribution in the surface and bottom layer (20:00 on 10 July 2015 to 03:00 11 July 2015): (A) surface and (B) bottom layers. SSC distribution in the (C) surface and (D) bottom layers at 23:00 on 10 July 2015. The vector indicates wind.
Comparing the surface and the bottom SSC distribution on 10 July 2015 at 23:00, when the typhoon had the strongest impact on the SSC in Hangzhou Bay, we found that the temporal and spatial SSC distributions in the surface water layer were basically the same as in the bottom layer, but the SSC in the surface layer was only approximately 30% of that in the bottom layer (Figures 6C,D). The high SSC in Hangzhou Bay was mainly distributed in the shoal and northern-central parts of the MB. The SSC in Hangzhou Bay was relatively low before and after typhoon, and typhoon increased it. Before the typhoon, the area with high SSC was distributed in the TB and northern shore of the bay. After typhoon, the area with high SSC in the bay moved to the southern shore (Figure 7).
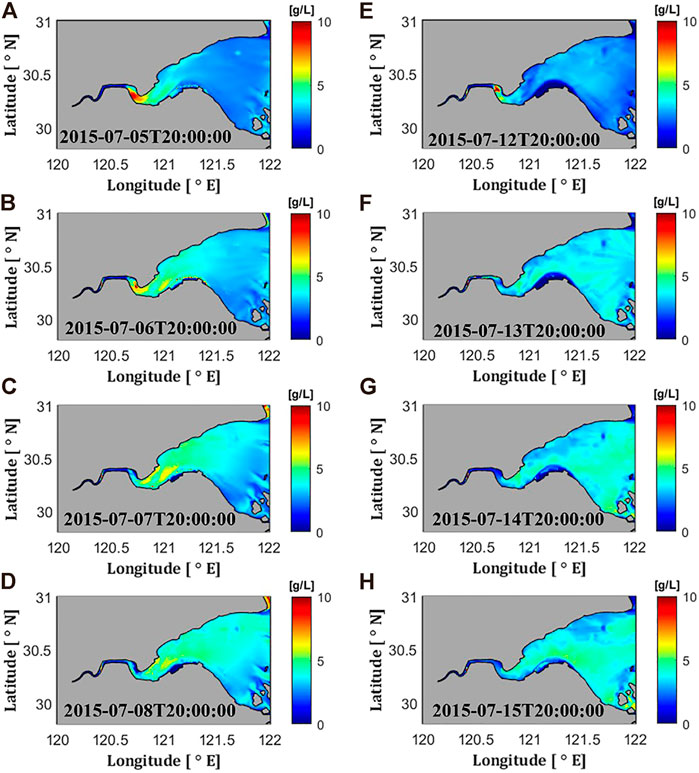
FIGURE 7. Bottom SSC condition in the calm period before typhoon (A–D) and after typhoon (E–H).
In the ebb and flood periods, the difference in the vertical SSC in each section was large, and the bottom SSC was more than 10 times larger than at the surface (Figure 8), which may cause turbidity currents near bottom. The minimum SSC occurred owing to the low water velocity during high and low water. The water in section C1 was shallow and narrow. Therefore, the peak SSC in section C1 was larger than that in sections C2 and C3. The SSC near the southern shore was larger than that near the northern shore in section C2 at peak ebb and peak flood. The SSC of C3 section was higher near the northern shore than near the southern shore at the peak flood tide, and reversed at the peak ebb tides because the northern and southern shores were the main flood and ebb tidal channels, respectively.

FIGURE 8. Vertical SSC distribution at C1, C2, and C3 cross-sections: (A) low water, (B) peak flood, (C) high water, and (D) peak ebb.
We calculated the net sediment fluxes during the foreruner, main shock, and aftershock periods, and the results are shown in Figure 9. In the foreruner period, suspended sediment was transported into the bay mainly through the middle and northern parts of the MB from the open sea, and the SSC was generally small. The SSC of the southern shore of the CB was relatively large. During the mainshock of the typhoon, large amounts of suspended sediment were transported from the middle and northern parts of the MB to the bay, most of which was transported to the southern shore of Hangzhou Bay and the Zhoushan Islands. A small portion was transported to the bay, reaching the CB and even the TB. The SSC on the southern shore of the CB was large (80–100 kg/m3). During the aftershock period, the SSC net flux differed from that in the previous two periods. Overall, suspended sediment was transported from within the bay to the open sea. The sediment flux on the southern shore of the MB was large. Hence, during the typhoon, the transport of suspended sediment in Hangzhou Bay was similar to that during the main shock period. Suspended sediment was transported through the middle and northern parts of the MB from the open sea to the bay. Most of the sediment was transported to the southern shore of the MB and the Zhoushan Islands, and a small portion was transported upstream. The sediment flux on the southern shore of the CB was large. Therefore, the typhoon led to a substantial increase in the SSC on the southern shore of the CB and MB and the Zhoushan Islands.
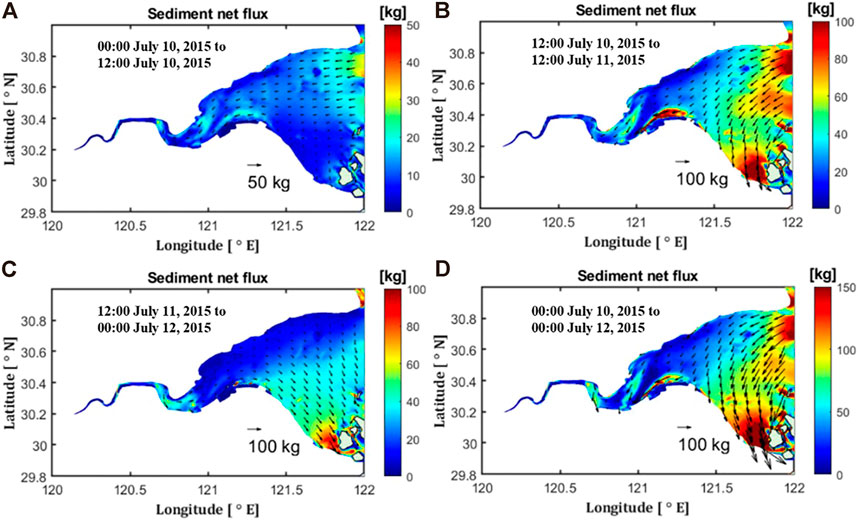
FIGURE 9. Net sediment flux during Typhoon Chan-hom: (A) forerunner, (B) main shock, (C) aftershock, and (D) whole typhoon periods.
During typhoons, SSC is affected by many factors such as wind stress, atmospheric pressure, and waves. To examine the impact of various factors on the change in SSC, we conducted various numerical tests in this study, as shown in Table 3. We analyzed the effects of various factors on the SSC during a typhoon by comparing the test results under different driving forces. Case 0 was the control group. In the Case 1, we turned off all the wind field input. During the typhoon, atmospheric pressure changes greatly over the sea, so we turned off the atmospheric pressure field input in the Case 2 to study its influence on the SSC. In the Case 3, we turned off the wave model. For the Case 1–3, the tidal forcing still existed (the water level on the open boundary). In the Case 4, we only considered the effect of tide on the SSC, that is, we only gave the tidal forcing to the model. In the Case 5, we canceled the tidal forcing on the open boundary (there were no water level change on the open boundary). In all cases, we didn’t consider the current input on the open boundary.
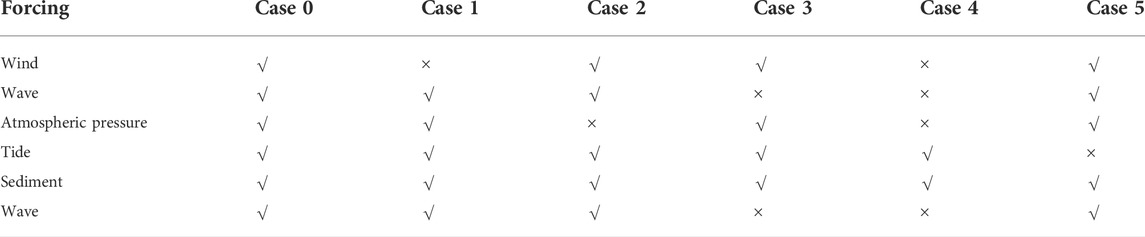
TABLE 3. Forcings considered in the numeric tests.
Before Typhoon Chan-hom, current-induced bottom stress was dominant, and the wave-induced bottom stress was close to zero during calm weather (Figure 10). The difference between surface SSC and bottom SSC was significantly smaller than that during typhoon. However, the bottom SSC substantially increased during the typhoon, and the maximum bottom SSC was 10 g/L among the six stations. The surface SSC simultaneously increased by less than 5 g/L. Therefore, the difference between the surface and bottom SSC increased because waves had a considerable impact on the bottom SSC during the typhoon. During the typhoon, wave-induced bottom stress remarkably increased from 5 to 10 Pa. The current velocity and current-induced bottom stress simultaneously slightly increased. We found modest difference between the current-induced bottom stress during calm (0–1 Pa) and typhoon weather (2 Pa). Therefore, the increase in the bottom stress under the combined action of waves and current substantially increased the bottom SSC. The surface SSC was impacted by the suspension of sediment, so the surface SSC also increased with bottom SSC.
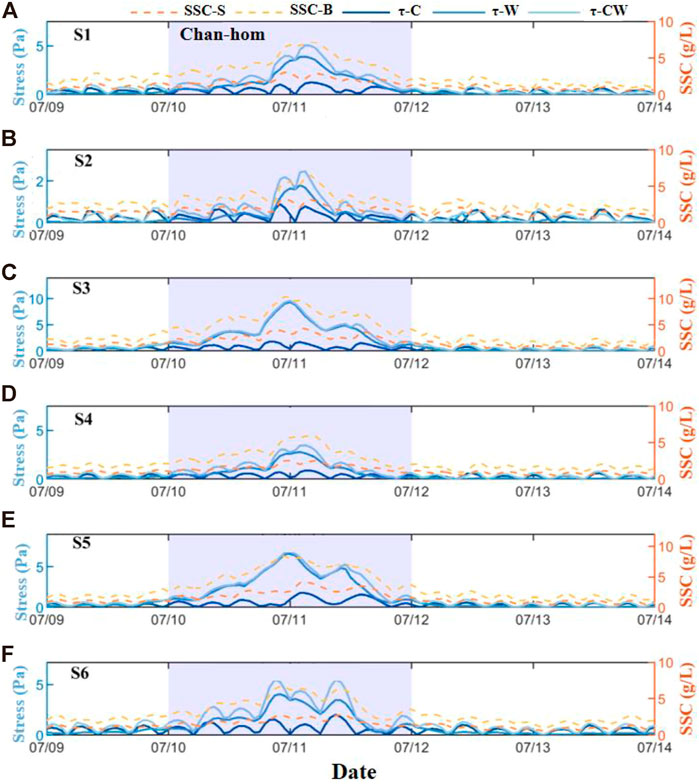
FIGURE 10. Comparison between SSC and bottom stress from July 9 to 14 July 2015 at stations (A–F) stations S1 to S6, respectively. SSC-S, surface SSC; SSC-B, bottom SSC; τ-C, current-induced bottom stress; τ-W, wave-induced bottom stress; τ-CW, combined wave- and current-induced bottom stress.
When the typhoon center was located southeast of Hangzhou Bay (11 July 2015 at 01:00), the SSC reached its maximum and an ebb current was present in Hangzhou Bay (Figure 11). The current velocity on the southern shore was higher than that on the northern shore, and the current velocity at MB was higher than that at TB. Therefore, the current-induced bottom stresses on the south and north shores were 2 and 0.5 Pa, respectively. The current-induced bottom stresses at MB were 0.5–2 Pa, and no more than 0.5 Pa at TB. In the Qiantang River, the current-induced bottom stress was 4 Pa because the waterway was narrow.
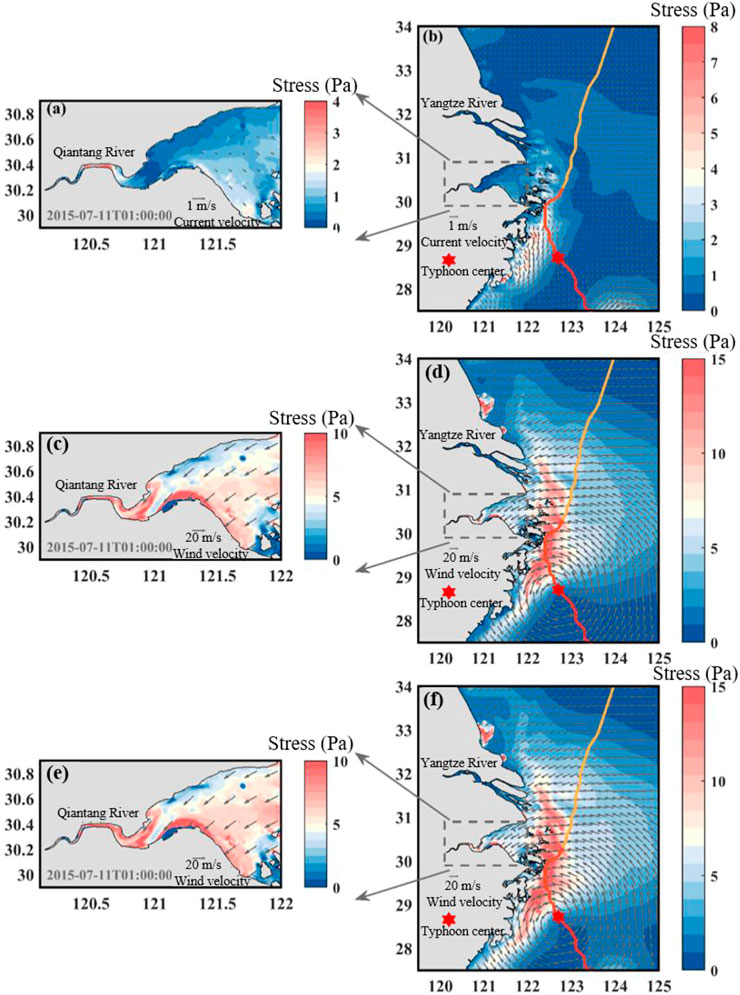
FIGURE 11. Bottom stress induced by (A,B) currents (arrow indicates bottom current velocity), (C,D) waves (arrow indicates wind velocity), and (E,F) combined action of currents and waves (arrow indicates wind velocity) at 01:00 on 11 July 2015 (the red and orange gradient line indicates typhoon path, the red six-pointed star indicates typhoon center).
The wave-induced bottom stress during the typhoon was similar to that under the combined effect of waves and currents; therefore, waves had the dominant influence on bottom stress during the typhoon (Figures 11C,E). The magnitude of wave-induced bottom stress is mainly determined by the bottom roughness, wave height, and water depth. In this study, the wave-induced bottom stress was low in the open sea, and the maximum was less than 5 Pa because of the high waves and water depth. The wave-induced bottom stress in Hangzhou Bay was restricted by three factors. High bottom stress was mainly distributed in the middle of the MB owing to the large wave height, the Andong shoal (the southern shore of the CB), and the Qiantang River above the TB because of the shallow water. The stress at the Andong Shoal was 10 Pa.
The stress produced by the action of the wind enhanced the lifting of the bottom sediment, mainly by intensifying wave action (Figure 12I-I’). The surface SSC synchronized the variation of bottom SSC with approximately half of the magnitude. In calm weather, the wind is weak and has less influence on the SSC. The surface SSC caused by wind stress (dark blue line) was close to zero, and the bottom SSC (light blue line) was less undulating. During the typhoon, the SSC changed significantly owing to the increase in wind velocity.
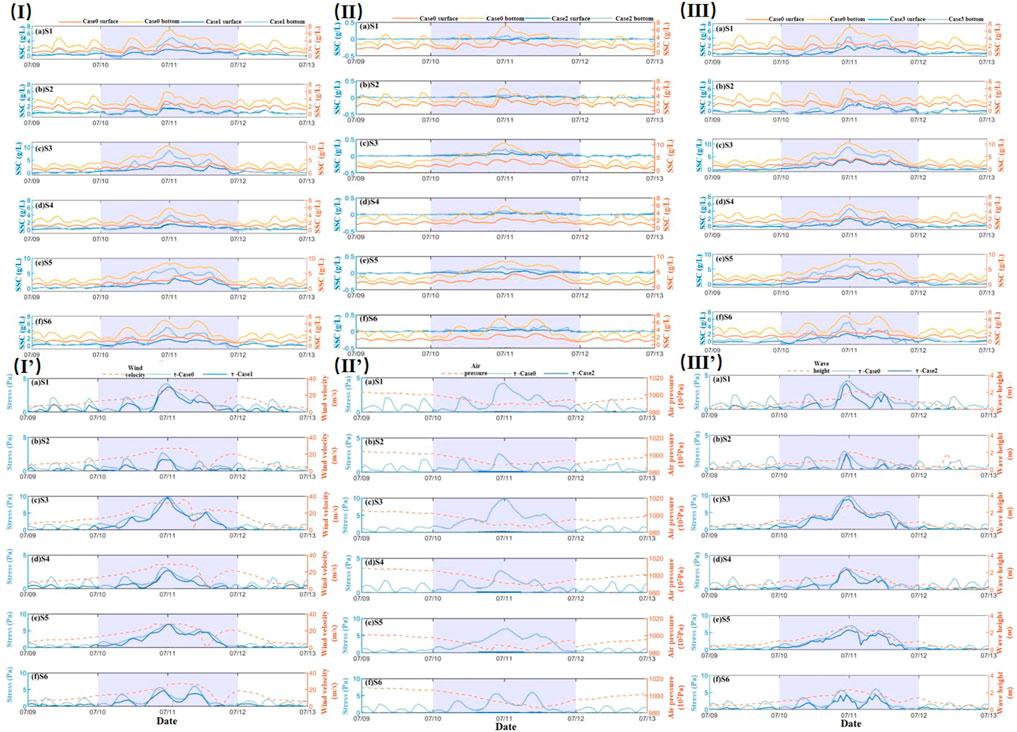
FIGURE 12. (I-I′) Comparison of SSC and bottom stress curves of Cases 0 and 1 (July 9–13, 2015). (II-II′, III-III′) The same as (I-I′), but for Cases 0 and 2, and 0 and 3, respectively.
The surface SSC and bottom SSC caused by wind stress both increased, with the latter increasing more. This is because the increase in wind force acted directly on the waves and currents, increasing the bottom stress and, thus, the bottom SSC.
Because S3 was located on the Andong Shoal, the SSC at this station was the highest, with a surface and bottom SSC of 4.3 and 10.5 g/L, respectively. The surface and bottom SSC caused by wind stress was 2.9 and 8.78 g/L, respectively. Both Cases 0 and 1 showed that the maximum SSC occurred approximately 00:00 on 11 July 2015. The maximum surface SSC caused by wind stress at stations S1–S6 were 53.8%, 46.3%, 66.9%, 60.4%, 79.5%, and 58.8% of the maximum total surface SSC value, respectively, with a mean value of 60.93%. The ratios of the bottom layer were 69.5%, 48.4%, 83.3%, 66.9%, 79.5%, 72.2%, respectively, with a mean value of 69.9% (Table 4), indicating that the wind stress had a slightly stronger effect on SSC in the bottom layer that in the surface layer.
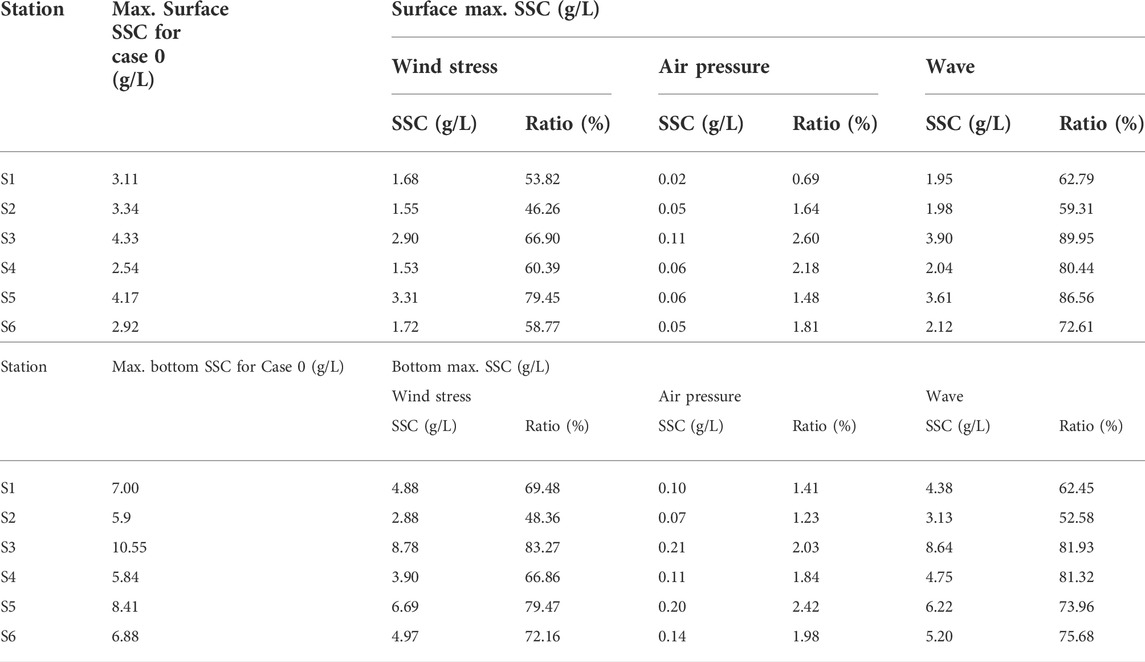
TABLE 4. Characteristic SSC caused by wind stress.
The bottom stress caused by wind was close to 0 Pa during calm weather. The wind-induced bottom stress was consistent with the increase in the wind-speed curve. The bottom stress at S1–S6 reached a maximum at approximately 00:00 on July 11, which were 3.8, 1.7, 9.7, 2.7, 6.9, and 4.6 Pa, respectively. The maximum wind-induced bottom stresses at S1–S6 were 89.8%, 63.9%, 99.7%, 85%, 98.6%, and 75.2% of the maximum bottom stress in Case 0, respectively, with a mean value of 85.4%. This indicated that wind had a strong effect on bottom stress through wave action and, thus, on the resuspension of sediment.
The effect of air pressure on the SSC was explored by comparing the results of Cases 0 and 2 (Figure 12II-II’). Compared with the effect of wind stress on SSC, the effect of air pressure on SSC was small. The SSC values in the surface and bottom layers owing to air pressure were close to 0. During the typhoon, with the fluctuation in air pressure, the value of the bottom SSC increased slightly, with a small amplitude, within 0.1 g/L.
At stations S1-S6, the ratios of the surface maximum SSC caused by air pressure to the total surface maximum SSC were 0.7%, 1.6%, 2.6%, 2.2%, 1.5%, and 1.8%, respectively, and the mean value was 1.7%. In the bottom layer, the ratios were 1.4%, 1.2%, 2%, 1.8%, 2.4%, 2%, and the mean value was 1.8%, respectively (Table 4). The maximum SSC caused by air pressure variation occurred at station S3. The value was 0.1 g/L in the surface layer and 0.2 g/L in the bottom layer.
During the typhoon, the air pressure decreased significantly, but the bottom stress caused by the air pressure variation was always close to 0, indicating that the influence of air pressure on the bottom stress was far less than that of the wind stress.
Waves have a strong sand-lifting effect, and the presence of waves significantly changes the bottom stress, thus affecting the SSC distribution. The results of SSC in cases 0 and 3 were compared and analyzed to determine the effect of the wave effect on SSC (Figure 12III-III’).
In calm weather, the SSC in the surface and bottom layers caused by wave action was similar at different stations, all below 0.5 g/L. During the typhoon, the wave action increased and the SSC increased significantly. The surface SSC increased to 4 g/L and the bottom SSC increased to approximately 3 g/L and 8 g/L, respectively, at different stations. The latter is larger than the former.
The SSC caused by wave action at S3 and S5 reached the maximum at 23:00 on 10 July 2015; the increase in the bottom SSC was 8.6 and 6.2 g/L, respectively. The maximum wave-induced SSC was reached at 00:00 on July 11 at S1, S2, S4, and S6, where the increase in surface SSC was 2, 2, 2, and 2.1 g/L and the increase in bottom SSC was 4.4, 3.1, 4.8, and 5.2 g/L, respectively. The peak surface SSC caused by wave action at S1–S6 was 62.8%, 59.3%, 90%, 80.4%, 86.6%, and 72.6% of the maximum surface SSC of Case 0, respectively, with a mean value of 75.3%. The maximum bottom SSC caused by wave action was 62.5%, 52.6%, 81.9%, 81.3%, 74%, and 75.7% of that in Case 0 at S1–S6, respectively, and the mean value was 71.32% (Table 4).
The change in the bottom stress curve positively correlated with the change in large wave height. The larger the wave height, the higher the bottom stress. The magnitude of the bottom stress was also influenced by the water depth when the wave heights were similar. So, the bottom stress at S3, where the water was shallowest, was 8.8 Pa, whereas the maximum value of bottom stress at S2, where the water was deepest, was only 2.6 Pa. The bottom stress at S1 to S6 under wave action was 3.8, 2.6, 8.78, 3, 5.8, and 4.3 Pa, respectively; the maximum bottom stresses, under full driving action, were 90.4%, 94.9%, 90.4%, 93.1%, 82.6%, and 71%, respectively, and the mean value was 87.1%.
The bottom stress increased under the combined action of waves and currents, which led to an increase in sediment resuspension. The surface SSC increased under the action of the suspension and diffusion of sediment.
Comparing Cases 0 and 1, we determined the influence of the wind waves and velocity increase on SSC. The surface and bottom SSC accounted for 60.9% and 69.9% (average value of six stations) of the SSC in Case 0, respectively. Comparing Cases 0 and 3, we determined the effects of wind waves and swells on the SSC. The surface and bottom SSC accounted for 75.3% and 71.3% (average value of six stations) of the SSC in Case 0, respectively. We found that the influence of wind waves on SSC overlapped when we compared the two groups.
So, we wanted to consider the contribution of wind waves and swells to SSC. By using PM (Pierson-Moskowitz) method (Li Y. et al., 2019), the calculated separation frequency separated the one-dimensional wave spectra of the station S1-S6. The proportion of wind waves and swells of these stations in Hangzhou Bay during the typhoon Chan-hom was obtained (Figure 13). During the typhoon, wind waves played a dominated role (∼100%) because the terrain blocked the propagation of swells into the bay. However, the wave spectrum of the station S6 showed obvious double peaks in the forerunner and aftershock period of typhoon, indicating that swells also occupied a certain proportion at these time (∼10%), because it is closer to the open sea. Hence, we believed that the influence of wave on SSC in Hangzhou Bay was almost all influenced by wind waves (75.3% and 71.3%) and accordingly, swells had almost no influence on SSC. Then, compared the contribution of waves and winds, the wind-induced velocity reduced the SSC at these six stations. This phenomenon was obvious in the surface layer (14.4%) and slight in the bottom layer (1.4%).
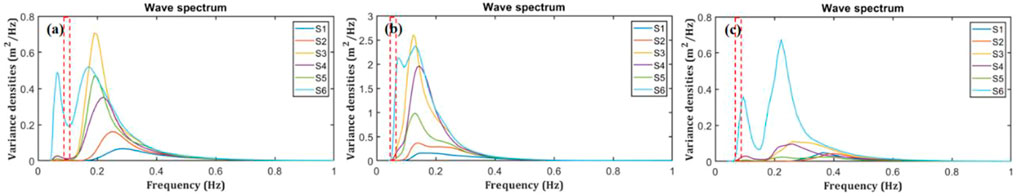
FIGURE 13. Separation of wind-wave and swell of S1-S6 of Hangzhou Bay at different time [(A): 07/10 00:00; (B) 07/11 00:00; (C) 07/12 00:00; red dotted box: S1-S6 separation frequency range].
Comparing Case 0 and 4, we determined the influence of the tidal level and tidal current on SSC. The surface and bottom SSC accounted for 37.0% and 20.3% (average value of six stations) of the SSC in Case 0, respectively. The total influence of tide, wave (almost wind wave), wind-induced current and air pressure were 99.6% (surface) and 92.0% (bottom), respectively. Hence the contribution of the interaction of tide, wave and wind-induced current on SSC were less than 10%.
Based on the three-dimensional numerical model of ocean dynamics (FVCOM) and considering the extreme weather conditions produced by Typhoon Chan-hom, we established and validated a three-dimensional wave–current–sediment coupled numerical model in Hangzhou Bay. We investigated the characteristics of suspended sediments, and examined the dynamic changes in the characteristics of sediment in Hangzhou Bay. Our main conclusions are as follows:
1) The sediment content in Hangzhou Bay was high during the typhoon, and SSC was substantially affected by waves. The high-SSC area in Hangzhou Bay was mainly concentrated at the MB and south shore of the CB. As the typhoon gradually approached, the surface and bottom SSC in the northern part of the MB reached 5 and 10 g/L, respectively. It increased from 2.5 to 4.5 g/L and 5–12 g/L at the CB, respectively, and reached 5.5 and 14 g/L at the TB, respectively. The maximum bottom SSC was at least twice the maximum surface SSC. A larger increase in bottom stress and SSC occurred at the southern shore of the CB and Qiantang River.
2) The typhoon affected the current velocity and SSC in the bay. The flow velocity at peak flood was higher than that at peak ebb; therefore, the maximum bottom SSC at peak flood (6 g/L) was higher than that at the peak ebb (5 g/L). The SSC at low and high water levels was the lowest. The maximum SSC at C1 was larger than those in C2 and C3. The SSC on the northern shore was substantially higher at peak flood and that on the south shore at peak ebb at C3. The SSC on the south shore was considerably larger than that in the north at these two times at C3 because of the shallow water.
3) During the typhoon, suspended sediment was transported through the middle and north of the MB from the sea to the bay, most of which was transported to the south shore of the MB and the Zhoushan Islands, the rest of which was transported upstream. Areas with a high SSC net flux included the southern shore of the MB and the CB, where siltation occurred.
4) SSC and bottom stress were most influenced by wave action, followed by wind stress action, and least influenced by air pressure action. The maximum SSC contributed by the waves to the peak SSC in Case 0 was 75.3% in the surface layer and 71.3% in the bottom layer; the contribution under the wind stress action was 60.9% in the surface layer and 69.9% in the bottom layer; the contribution of air pressure action was 1.7% and 1.8% in the surface and bottom layers, respectively.
The original contributions presented in the study are included in the article/supplementary material, further inquiries can be directed to the corresponding authors.
LL and ZH: manuscript writing, data analysis; methodology; modelling. FS and ZY: material collection; modelling; data analysis.
This study was partially supported by the National Key Research and Development Program of China (2021YFE0206200), the National Natural Science Foundation of China (41976157, 42076177), the Science Technology Department of Zhejiang Province (2021C03180, 2020C03012, 2022C03044).
The authors declare that the research was conducted in the absence of any commercial or financial relationships that could be construed as a potential conflict of interest.
All claims expressed in this article are solely those of the authors and do not necessarily represent those of their affiliated organizations, or those of the publisher, the editors and the reviewers. Any product that may be evaluated in this article, or claim that may be made by its manufacturer, is not guaranteed or endorsed by the publisher.
Aagaard, T., Hughes, M., Baldock, T., Greenwood, B., Kroon, A., and Power, H. (2012). Sediment transport processes and morphodynamics on a reflective beach under storm and non-storm conditions. Mar. Geol. 326, 154–165. doi:10.1016/j.margeo.2012.09.004
Allen, J. I., Somerfield, P. J., and Gilbert, F. J. (2007). Quantifying uncertainty in high-resolution coupled hydrodynamic-ecosystem models. J. Mar. Syst. 64 (1-4), 3–14. doi:10.1016/j.jmarsys.2006.02.010
Allison, M. A., Sheremet, A., Goni, M. A., and Stone, G. W. (2005). Storm layer deposition on the Mississippi-Atchafalaya subaqueous delta generated by Hurricane Lili in 2002. Cont. Shelf Res. 25 (18), 2213–2232. doi:10.1016/j.csr.2005.08.023
Booij, N., Ris, R. C., and Holthuijsen, L. H. (1999). A third-generation wave model for coastal regions - 1. Model description and validation. J. Geophys. Res. 104 (C4), 7649–7666. doi:10.1029/98jc02622
Cao, Z., and Wang, Y. (1994). Numerical simulation of hydrodynamic and sediment dynamics. Tianjing, China: Tianjin University Press.
Chen, C. S., Beardsley, R. C., Cowles, G., Qi, J., Lai, Z., Gao, G., et al. (2006). An unstructured grid, finite-volume coastal ocean model: FVCOM user manual. Boston: Smast/Umassd.
Chen, C. S., Liu, H. D., and Beardsley, R. C. (2003). An unstructured grid, finite-volume, three-dimensional, primitive equations ocean model: Application to coastal ocean and estuaries. J. Atmos. Ocean. Technol. 20 (1), 159–186. doi:10.1175/1520-0426(2003)020<0159:Augfvt>2.0.Co;2
Cong, S., Wu, X., Ge, J., Bi, N., Li, Y., Lu, J., et al. (2021). Impact of Typhoon Chan-hom on sediment dynamics and morphological changes on the East China Sea inner shelf. Mar. Geol. 440, 106578. doi:10.1016/j.margeo.2021.106578
Dai, Z., Zhang, X., Yan, H., Li, J., and Hun, C. (2009). Morphodynamic behavior of the mud coast in response to typhoon action. Ocean Eng. 27 (2), 63–69. 95. Retrieved from <Go to ISI>://CSCD:3538044. doi:10.16483/j.issn.1005-9865.2009.02.004
Goff, J. A., Allison, M. A., and Gulick, S. P. S. (2010). Offshore transport of sediment during cyclonic storms: Hurricane ike (2008), Texas gulf coast, USA. Geology 38 (4), 351–354. doi:10.1130/g30632.1
Green, M. O., Vincent, C. E., McCave, I. N., Dickson, R. R., Rees, J. M., and Pearson, N. D. (1995). Storm sediment transport - observations from the British North-sea shelf. Cont. Shelf Res. 15 (8), 889–912. doi:10.1016/0278-4343(95)80001-t
Harris, C. K., and Wiberg, P. L. (1997). Approaches to quantifying long-term continental shelf sediment transport with an example from the Northern California stress mid-shelf site. Cont. Shelf Res. 17 (11), 1389–1418. doi:10.1016/s0278-4343(97)00017-4
He, Z. G., Tang, Y. L., Xia, Y. Z., Chen, B. D., Xu, J., Yu, Z. H., et al. (2020). Interaction impacts of tides, waves and winds on storm surge in a channel-island system: Observational and numerical study in yangshan harbor. Ocean. Dyn. 70 (3), 307–325. doi:10.1007/s10236-019-01328-5
Huang, J., Li, Y., Ding, F., Zheng, T., Meadows, M. E., and Wang, Z. (2021). Sedimentary records of mid-Holocene coastal flooding at a Neolithic site on the southeast plain of Hangzhou Bay, east China. Mar. Geol. 431, 106380. doi:10.1016/j.margeo.2020.106380
Huang, S. (2017). Investigation on storm surge and erosion-deposition in Zhejiang coastal waters. Hangzhou, China: Zhejiang University. (Doctor)Available from Cnki.
Ji, R., and Lu, Y. (2007). Advances in hydrodynamic and sedimentary processes of macrotidal estuary. Hydro-Sci. Eng. 3, 64–74. doi:10.16198/j.cnki.1009-640x
Jiang, B., Zhang, x., Huang, D., Du, Y., Yang, D., and Yao, L. (2015). Retrieving high concentration of suspended sediments based on GOGI: An example of cosatal water around Hangzhou Bay, China. J. Zhejiang Univ. Sci. Ed. 42 (02), 213–220. Available at: https://kns.cnki.net/kcms/detail/33.1246.n.20150325.1529.007.html.
Jiang, C., Wu, Z., Chen, J., and Liu, J. (2014). Review of sediment transport and beach profile changes under storm surge. J. Changsha Univ. Sci. Technol. Nat. Sci. 11 (01), 1–9.
Leonardi, N., Carnacina, I., Donatell, C., Ganju, N., Plater, A., Schuerch, M., et al. (2018). Dynamic interactions between coastal storms and salt marshes: A review. Geomorphology 301, 91–107. doi:10.1016/j.geomorph.2017.11.001
Li, H., Li, Y., Zheng, B., Zhong, G., Zhang, H., Wang, H., et al. (2019a). Typhoon Soudelor (2015) induced offshore movement of sand dunes and geomorphological change: Fujian coast, China. Water 11 (6), 1191. doi:10.3390/w11061191
Li, J. (1987). Monitoring the suspended sediment content in Hangzhou Bay by using AVHRR data of NOAA satellite. Acta Oceanol. Sin. Chin. version) (01), 132–135.
Li, L., Li, Z., He, Z., Yu, Z., and Ren, Y. (2022). Investigation of a storm tides induced by super typhoon in macro-tidal Hangzhou Bay. Front. Mar. Sci.
Li, Y., Li, H., Qiao, L., Xu, Y., Yin, X., and He, J. (2015). Storm deposition layer on the Fujian coast generated by Typhoon Saola (2012). Sci. Rep. 5, 14904. doi:10.1038/srep14904
Li, Y., and Li, X. (2016). Remote sensing observations and numerical studies of a super typhoon-induced suspended sediment concentration variation in the East China Sea. Ocean. Model. 104, 187–202. doi:10.1016/j.ocemod.2016.06.010
Li, Y., Tao, A., Li, X., Zheng, X., and Yin, S. (2019b). Study on separation method of wind-wave and swell in the Taiwan Strait. Haiyang Xuebao 41 (11), 25–34.
Liu, G., Zhong, Q., Ye, Y. l., Wang, H. b., Hu, L. j., Qin, Z. k., et al. (2013). Expression of beclin 1 in bladder cancer and its clinical significance. Int. J. Biol. Markers 41 (02), 56–62. doi:10.5301/JBM.2012.9769
Liu, J., Cai, S., and Wang, S. (2011). Observations of strong near-bottom current after the passage of typhoon pabuk in the south China sea. J. Mar. Syst. 87 (1), 102–108. doi:10.1016/j.jmarsys.2011.02.023
Liu, M., Shen, F., Ge, J., and Sun, Y. (2013). Diurnal variation of suspended sediment concentration in Hangzhou Bay from geostationary satellite observation and its hydrodynamic analysis. J. Sediment Res. (01), 7–13. doi:10.16239/j.cnki.0468-155x.2013.01.003
Lu, H., Gu, F., Chen, X., and Qi, D. (2019). Effect of sea waves on sediment transport in the sea waters surrounding Zhoushan Islands, China. Periodical Ocean Univ. China 49 (08), 1–9. doi:10.16441/j.cnki.hdxb.20180116
Mellor, G. L., and Yamada, T. (1982). Development of a turbulence closure-model for geophysical fluid problems. Rev. Geophys. 20 (4), 851–875. doi:10.1029/RG020i004p00851
Murphy, A. H. (1992). Climatology, persistence, and their linear combination as standards of reference in skill scores. Weather Forecast. 7 (4), 692–698. doi:10.1175/1520-0434(1992)007<0692:cpatlc>2.0.co;2
Oberle, F. K. J., Storlazzi, C. D., and Hanebuth, T. J. J. (2014). Wave-driven sediment mobilization on a storm-controlled continental shelf (Northwest Iberia). J. Mar. Syst. 139, 362–372. doi:10.1016/j.jmarsys.2014.07.018
Palinkas, C. M., Halka, J. P., Li, M., Sanford, L. P., and Cheng, P. (2014). Sediment deposition from tropical storms in the upper Chesapeake Bay: Field observations and model simulations. Cont. Shelf Res. 86, 6–16. doi:10.1016/j.csr.2013.09.012
Pan, C., Zeng, J., Tang, Z., and Shi, Y. (2013). A study of sediment chatacteristics and riverbed erosion/deposition in Qiantang estuary. Hydro-Sci. Eng. 1, 1–7. doi:10.16198/j.cnki.1009-640x.2013.01.009
Pan, C., Zheng, J., Zeng, J., and Cheng, G. (2021). Analysis of annual maximum tidal range in Hangzhou Bay. Chin. J. Hydrodynomics 36 (2), 201–209. Retrieved from <Go to ISI>://CSCD:7010568. doi:10.16076/j.cnki.cjhd.2021.02.006
Peduzzi, P., Chatenoux, B., Dao, H., De Bono, A., Herold, C., Kossin, J., et al. (2012). Global trends in tropical cyclone risk. Nat. Clim. Chang. 2 (4), 289–294. doi:10.1038/nclimate1410
Shi, J. Z., Gu, W., and Wang, D. (2008). Wind wave-forced fine sediment erosion during the slack water periods in Hangzhou Bay, China. Environ. Geol. 55 (3), 629–638. doi:10.1007/s00254-007-1013-2
Tang, R., Shen, F., Ge, J., Yang, S., and Gao, W. (2021). Investigating typhoon impact on SSC through hourly satellite and real-time field observations: A case study of the Yangtze estuary. Cont. Shelf Res. 224, 104475. doi:10.1016/j.csr.2021.104475
Van Prooijen, B. C., and Winterwerp, J. C. (2010). A stochastic formulation for erosion of cohesive sediments. J. Geophys. Res. 115, C01005. doi:10.1029/2008jc005189
van Rijn, L. C. (2011). Coastal erosion and control. Ocean Coast. Manag. 54 (12), 867–887. doi:10.1016/j.ocecoaman.2011.05.004
Walsh, K. J. E., McBride, J. L., Klotzbach, P. J., Balachandran, S., Camargo, S. J., Holland, G., et al. (2016). Tropical cyclones and climate change. WIREs Clim. Change 7 (1), 65–89. doi:10.1002/wcc.371
Wang, B. C., and Esima, D. (1990). Supply and deposition of sediment along the north bank of Hangzhou Bay, China. Netherlands J. Sea Res. 25 (3), 377–390. doi:10.1016/0077-7579(90)90045-I
Wang, D., Cao, A., Zhang, J., Fan, D., Liu, Y., and Zhang, Y. (2018a). A three-dimensional cohesive sediment transport model with data assimilation: Model development, sensitivity analysis and parameter estimation. Estuar. Coast. Shelf Sci. 206, 87–100. doi:10.1016/j.ecss.2016.08.027
Wang, D., Zhang, J., He, X., Chu, D., Lv, X., Wang, Y. P., et al. (2018b). Parameter estimation for a cohesive sediment transport model by assimilating satellite observations in the Hangzhou Bay: Temporal variations and spatial distributions. Ocean. Model. 121, 34–48. doi:10.1016/j.ocemod.2017.11.007
Wang, F., Wang, S., Wang, X., Song, L., Xu, Q., and Zheng, H. (2014). Remote sensing inversion and dynamic analysis of suspended sediment in Hangzhou Bay. J. Central China Normal Univ. Nat. Sci. 48 (01), 112–116+135. doi:10.19603/j.cnki.1000-1190.2014.01.023
Wang, Q., Pan, C., and Pan, D. (2021). Numerical study of the effect of typhoon Yagi on the Qiantang River tidal bore. Regional Stud. Mar. Sci. 44, 101780. doi:10.1016/j.rsma.2021.101780
Wang, S., Ge, J., Kilbourne, K. H., and Wang, Z. (2020). Numerical simulation of mid-Holocene tidal regime and storm-tide inundation in the south Yangtze coastal plain, East China. Mar. Geol. 423, 106134. doi:10.1016/j.margeo.2020.106134
Wang, X. H., Byun, D. S., Wang, X. L., and Cho, Y. K. (2005). Modelling tidal currents in a sediment stratified idealized estuary. Cont. Shelf Res. 25 (5-6), 655–665. doi:10.1016/j.csr.2004.10.013
Wang, X. H. (2002). Tide-induced sediment resuspension and the bottom boundary layer in an idealized estuary with a muddy bed. J. Phys. Oceanogr. 32 (11), 3113–3131. doi:10.1175/1520-0485(2002)032<3113:Tisrat>2.0.Co;2
Wang, X., Yin, Q., and Zhang, B. (1991). Research and application of typhoon storm surge forecast model in China Sea. Adv. Water Sci. (01), 1–10.
Williams, J. J., and Rose, C. P. (2001). Measured and predicted rates of sediment transport in storm conditions. Mar. Geol. 179 (1-2), 121–133. doi:10.1016/s0025-3227(01)00191-8
Winterwerp, J. C. (2001). Stratification effects by cohesive and noncohesive sediment. J. Geophys. Res. 106 (C10), 22559–22574. doi:10.1029/2000jc000435
Wu, X., Wang, H., Bi, N., Song, Z., Zang, Z., and Kineke, G. C. (2016). Bio-physical changes in the coastal ocean triggered by typhoon: A case of typhoon meari in summer 2011. Estuar. Coast. Shelf Sci. 183, 413–421. doi:10.1016/j.ecss.2016.04.014
Xu, L. (2019). Fully coupled numerical modeling of sediment transport and bed change under currents and waves influences (Master). Hangzhou, China: Zhejiang University. Available from Cnki.
Ye, T. (2019). The multi-scale variations of suspended sediment dynamics in Hangzhou Bay and its interaction with tidal flat variations. (Master). Hangzhou, China: Zhejiang University. Available from Cnki.
Yu, Z. (2020). Hydrodynamics and sediment transport during typhoon in the Hangzhou Bay. (Master). Hangzhou, China: Zhejiang University. Available from Cnki.
Zang, Z., Xue, Z. G., Bao, S., Chen, Q., Walker, N. D., Haag, A. S., et al. (2018). Numerical study of sediment dynamics during hurricane Gustav. Ocean. Model. 126, 29–42. doi:10.1016/j.ocemod.2018.04.002
Zhang, W., Zhang, X., Jing, H., Feng, X., Yao, X., Gao, W., et al. (2013). Dynamic sedimentary environment and the provenance characteristics in Yangtze River Estuary-Hangzhou Bay and its adjacent waters. Acta Geogr. Sin. 68 (05), 640–650.
Keywords: sediment dynamics, ssc, wind, air pressure, wave, Typhoon Chan-hom, Hangzhou Bay
Citation: Li L, Shen F, He Z and Yu Z (2022) Suspended sediment dynamics in macrotidal turbid Hangzhou Bay during Typhoon Chan-hom. Front. Earth Sci. 10:932149. doi: 10.3389/feart.2022.932149
Received: 29 April 2022; Accepted: 27 July 2022;
Published: 29 August 2022.
Edited by:
Xiaolei Liu, Ocean University of China, ChinaReviewed by:
Wenfei Ni, Pacific Northwest National Laboratory, United StatesCopyright © 2022 Li, Shen, He and Yu. This is an open-access article distributed under the terms of the Creative Commons Attribution License (CC BY). The use, distribution or reproduction in other forums is permitted, provided the original author(s) and the copyright owner(s) are credited and that the original publication in this journal is cited, in accordance with accepted academic practice. No use, distribution or reproduction is permitted which does not comply with these terms.
*Correspondence: Li Li, bGlsaXpqdUB6anUuZWR1LmNu; Zhiguo He, aGV6aGlndW9Aemp1LmVkdS5jbg==
Disclaimer: All claims expressed in this article are solely those of the authors and do not necessarily represent those of their affiliated organizations, or those of the publisher, the editors and the reviewers. Any product that may be evaluated in this article or claim that may be made by its manufacturer is not guaranteed or endorsed by the publisher.
Research integrity at Frontiers
Learn more about the work of our research integrity team to safeguard the quality of each article we publish.