 Wenxuan Sun1,2
 Youyan Jiang1,3*
 Jizu Chen1*
 Wentao Du1,2Lishu Lian4
 Linlin Song5Yuling Hu1Zhen Cheng4Xiyin Zhou2,6
 Shichang Kang1,2Jichun Wu7
- 1State Key Laboratory of Cryospheric Science, Northwest Institute of Eco-Environment and Resources, Chinese Academy of Sciences (CAS), Lanzhou, China
- 2College of Resources and Environment, University of Chinese Academy Science (UCAS), Beijing, China
- 3Lanzhou Regional Climate Center, Lanzhou, China
- 4School of Geography and Tourism, Qufu Normal University, Rizhao, China
- 5Institute of Atmospheric Physics, Chinese Academy of Sciences (CAS), Beijing, China
- 6Key Laboratory of Land Surface Process and Climate Change in Cold and Arid Regions, Northwest Institute of Eco-Environment and Resources, Chinese Academy of Science (CAS), Lanzhou, China
- 7State Key Laboratory of Frozen Soil Engineering, Northwest Institute of Eco-Environment and Resources, Chinese Academy of Science (CAS), Lanzhou, China
Investigation of extreme precipitation events in arid and semiarid regions, especially for occurrence time and the associated circulation mechanisms, is vital to support the forecasting of and the advanced response to resultant disasters. In this study, the spatiotemporal pattern of occurrence time of extreme precipitation and atmospheric circulation mechanisms in the Arid Region of Northwest China (ARNC) were analyzed using two indicators (precipitation concentration degree and period) and the climate diagnosis method. Results showed that the significant scattered pattern of extreme precipitation occurrence time (EPOT) in Northern Xinjiang and the postponed pattern of maximum extreme precipitation occurrence (MEPO) from southern to northern Xinjiang are consistent with the input pathway of the Arctic air mass. During the anomaly dispersion year of EPOT and the anomaly delay year of MEPO, the Arctic air mass carried sufficient water vapor is transported to ARNC for triggering extreme precipitation events. Meanwhile, the pattern of concentration–dispersion–concentration in eastern ARNC demonstrates interaction between the westerlies and the summer monsoon. Sufficient water vapor is transported to southwestern ARNC by the southwest monsoon during the anomaly delay year of MEPO and the anomaly concentration year of EPOT. The findings of this study suggest that invasion of the Arctic air mass and the summer monsoon could influence extreme precipitation in ARNC.
1 Introduction
Extreme precipitation events not only exert damage to the ecological environment (Gariano and Guzzetti, 2016; Brunner et al., 2021) but also threaten human safety (Zou et al., 2021; Tao and Han, 2022). Globally, weather/climate-related disasters over the past 50 years have caused a daily average of 115 human fatalities and economic losses of US$202 million (WMO, 2021). In the context of increasing compound warm–wet extreme events, both the intensity and the frequency of extreme precipitation have strengthened continuously with the increasing temperature (IPCC, 2021). In the arid and semiarid regions, the magnitude of warming (Huang et al., 2017; Chen Y. et al., 2020) and extreme precipitation intensity (Donat et al., 2016) are more significant than in the humid regions, which further aggravate the vulnerable environmental carrying capacity.
The Arid Region of Northwest China (ARNC), located in the hinterland region of the Eurasian continent, is one region responding sensitively to climate warming (Chen et al., 2015). In ARNC, both the frequency and intensity of heavy precipitation have increased (Jiang et al., 2012; Wang et al., 2012; Wang et al., 2018; Cheng et al., 2021), that is, by 1.4% and 0.7% faster than in the humid regions of China (Han et al., 2019). Meanwhile, the number of consecutive dry days will decrease and the intensity of extreme precipitation will increase under the projections of three greenhouse gas scenarios (Wang Y. et al., 2017; Xu et al., 2018). Furthermore, there are regional and seasonal discrepancies in extreme precipitation in ARNC. For instance, in the mountainous regions, the increasing rate of the frequency and the intensity of extreme precipitation have been faster than in other regions (Lin et al., 2017; Hu et al., 2021; Song et al., 2022). The intensity of extreme precipitation significantly weakened in summer while significantly strengthened in winter (Wang et al., 2013; Xiao et al., 2017). Therefore, it is critical to investigate the spatiotemporal variations in occurrence time of extreme precipitation in ARNC. The advanced start timing and postponed end timing of extreme precipitation in western and central Northwest China are opposite to that in eastern Northwest China (Lu et al., 2021a). However, whether extreme precipitation events occur in a way of concentration or dispersion, and the month when the maximum extreme precipitation occurs have still not been investigated in detail, which could provide important insight into early warning of such events and resultant disaster. Therefore, it is of great scientific and societal importance to study the occurrence time of extreme precipitation in ARNC. Furthermore, extreme precipitation events are frequently accompanied by notable atmospheric circulation anomalies (Pfahl et al., 2017). After the late 1970s, cyclonic circulation anomalies over Mongolia at 850 hPa contributed to the strengthening of ascending flow over ARNC, increasing the extreme precipitation events (Zhou and Huang, 2010; Wang et al., 2018). In summer, the western ridge of the western Pacific subtropical high (WPSH) extended to the west of 110°E, which was conducive to the northwestward transport of water vapor from the Indian and Pacific oceans (Li et al., 2013; Zeng and Yang, 2020; Lu et al., 2021b; Cheng et al., 2021; Zou et al., 2021). Additionally, the Tibetan Plateau Index B, which reflects the activities of low vortexes and high pressure at 500 hPa over the Tibetan Plateau, was probably an important factor in the abrupt change of extreme precipitation in ARNC (Chen et al., 2014). Owing to the complexity of extreme precipitation, the associated driving circulations need further investigation.
The objectives of this study were to explore the occurrence time of extreme precipitation in ARNC and to investigate the associated driving circulations. Therefore, the extreme precipitation concentration degree (EPCD) and the extreme precipitation concentration period (EPCP) were adopted as indicators to describe the distribution of occurrence time of extreme precipitation and to determine the maximum extreme precipitation event, respectively. On this basis, the spatiotemporal pattern, abrupt changes, and oscillations were analyzed. Furthermore, the anomalous atmospheric circulation patterns of extreme years and abrupt change were also investigated.
2 Study Area
Located within continental Eurasia, ARNC comprises Xinjiang Province, the Hexi Corridor (Gansu Province), the Qaidam Basin (Qinghai Province), and the Alashan Plateau (Inner Mongolia) (Figure 1). Although mid-latitude westerlies mainly dominate ARNC, the climate of easternmost ARNC is interactively affected by the westerlies and the East Asian summer monsoon (EASM) (Li et al., 2020). Owing to the long distance from oceans, the presence of many high mountain ranges such as (from north to south) the Altai, Tianshan, Qilian, and Kunlun Mountains, and the adjacent Qinghai–Tibet Plateau, moisture flow over ARNC is strongly blocked, resulting in mean annual precipitation amount of <200 mm in ARNC (Chen et al., 2014; Wang Y. et al., 2017).
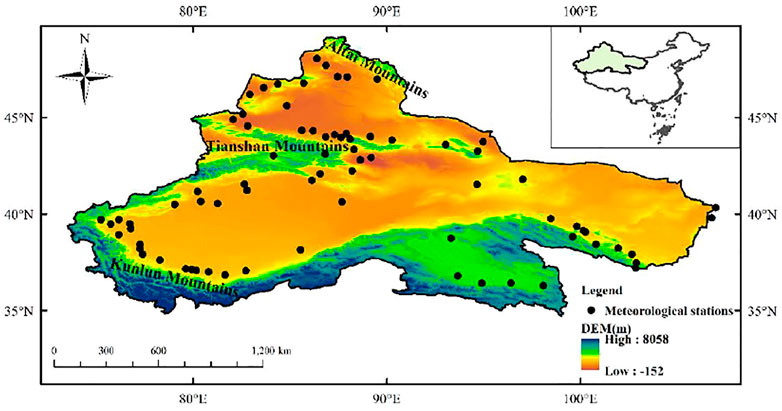
FIGURE 1. Location of the study area and the distribution of the meteorological stations.
3 Data and Methods
3.1 Data
3.1.1 Meteorological Data
Daily precipitation data from 77 stations in ARNC for the period 1968–2020 were obtained from the National Meteorological Science Data Center of the China Meteorological Administration (http://data.cma.cn/). Data quality was strictly controlled, including inspection of climate threshold values and extremes, and consistency checks (i.e., internal, spatial, and temporal consistency). Moreover, erroneous data were manually checked, validated, and corrected or removed. A quality control flag was provided in the dataset and the threshold for missing data was set at <20% for each site. In this study, valid data (flag = 0) were adopted, while data with other flags and records from sites with more than 20% missing data were excluded. Missing data over one day or 2 days were filled using average precipitation values of neighboring days, while if consecutive days had missing data, the missing values were replaced with the long-term averages of the same days (Zhang et al., 2013).
3.1.2 Reanalysis Data
The National Centers for Environmental Prediction/National Center for Atmospheric Research reanalysis dataset was used in this study because it has been verified to have better applicability in representing the climatology and prominent interannual variations of the atmospheric circulation over ARNC (Li and Ma, 2018; Wang et al., 2018; Yin and Zhou, 2018). The specific reanalysis data comprised mean monthly wind fields, specific humidity, and geopotential height (GH) (https://psl.noaa.gov/), which were obtained on a 2.5° × 2.5° global grid with 17 pressure levels covering the period from January 1948 to the present.
3.2 Methods
3.2.1 Definition of Extreme Precipitation Threshold
This study adopted the percentile method (Zhai and Pan, 2003), which is one of the most widely used approaches for identification of climate/weather events (Zhai et al., 2005; Shi et al., 2021). Because of the huge differences among the different stations, extreme events are difficult to define using unified and fixed daily precipitation standards. Therefore, we used the 30-year mean value of the 95th percentile value of the annual daily precipitation series during 1971–2000 to determine the threshold of extreme precipitation. When the daily precipitation exceeded the threshold, it was identified as an extreme precipitation event. The sum of all extreme precipitation amounts at a station in a given year was regarded as the annual extreme precipitation amount, which was further employed to calculate the EPCD and EPCP.
3.2.2 Definition of Extreme Precipitation Concentration Degree and Concentration Period
The temporal distribution of the extreme precipitation occurrence time (EPOT) during a year is described as the EPCD (Li et al., 2010), and the EPCP represents the month in which the maximum extreme precipitation occurred (Dong et al., 2020). Based on vector analysis, the extreme precipitation amount of each month in a year can be taken as a vector, which can then be decomposed into two components in the horizontal and vertical directions. The monthly extreme precipitation amount can be viewed as the length of the vector. The direction for a year can be seen as a cycle (360°), whereas the vector direction for each month is that of the corresponding month order (starting from 0) multiplied by 30° (Zhang and Qian, 2003). The sum of the vertical and horizontal components of extreme precipitation at a certain station (i.e., Rxi and Ryi, respectively) can be expressed as follows:
Where, rij is the extreme precipitation during month j in year i, and θj is the azimuth of the month j. Thus,
And
where Ri is the extreme precipitation during the year i.
If all extreme precipitation occurred only in one month of a year, the ratio of the synthetic component concerning the annual extreme precipitation would be 1, referred to as the maximum value. If the same extreme precipitation occurred every month of a year, the two summations of the separate additive components in the horizontal and vertical directions should be zero, referred to as the minimum value. Therefore, EPCD can reflect the concentration or dispersion degree of EPOT in a year. Additionally, EPCP indicates the month in which the maximal extreme precipitation during a year occurs, that is, the maximum extreme precipitation occurrence (MEPO). The corresponding relationship between EPCP and month is presented in Table 1.
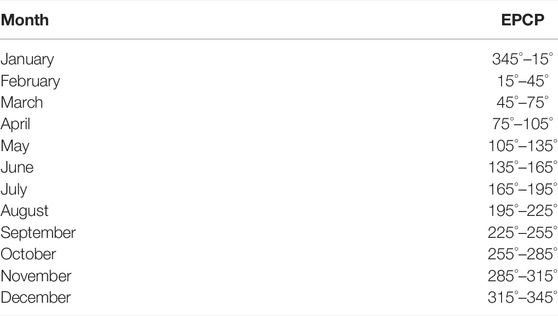
TABLE 1. Corresponding relationship between extreme precipitation concentration period (EPCP) and month.
EPCD can well reflect the inhomogeneity of extreme precipitation and thus improve the accuracy of drought and flood prediction (Li and Qian, 2006). However, the calculation of both EPCD and EPCP is complicated. Generally, larger time scales (month) can better describe the overall pattern, while smaller time scales (10-d and pentad) better describe the regional pattern (Wang et al., 2019). Moreover, EPCP reflects only the maximum extreme precipitation in a fixed period and it ignores the maximum extreme precipitation between periods (Wang et al., 2019).
4 Results
We found that the contribution of extreme precipitation to the annual precipitation amount in ARNC has undergone a gradual increase during 1968–2021. Moreover, almost extreme precipitation events mainly occurred in June, July, August, and September, while only a few extreme heavy precipitation events occurred in other months such as January, and February, indicating potential drivers of precipitation, such as the Arctic air mass. Thus, the multi-insights of occurrence time of extreme precipitation were investigated as follows:
4.1 Extreme Precipitation Occurrence Time
4.1.1 Spatial Pattern of Extreme Precipitation Occurrence Time
The spatial heterogeneity of EPCD across ARNC is evident in Figure 2. Owing to the special structure of the terrain of “three mountains and two basins” in Xinjiang, notable differences in the spatial distribution of EPOT are evident. In southern Xinjiang, EPCD is largest in the central parts and decreases outward, which indicates that EPOT gradually disperses outward. This broadly circular distribution in southern Xinjiang is similar to the pattern of increasing precipitation from the desert toward the oasis, which might be attributable to interacting mechanisms between the local oasis cold-wet and water vapor transport (Zhou and Lei, 2018). In northern Xinjiang, the EPCD value is higher in mountainous areas than in the Junggar Basin and surrounding areas, which indicates EPOT of mountainous areas is concentrated. This regional discrepancy might be related to the fact that persistent extreme precipitation is more frequent in basins (except in summer) than in mountainous areas (Zhao et al., 2011), and it is considered that the future frequency of extreme precipitation will exhibit the same characteristics (Tang et al., 2020).
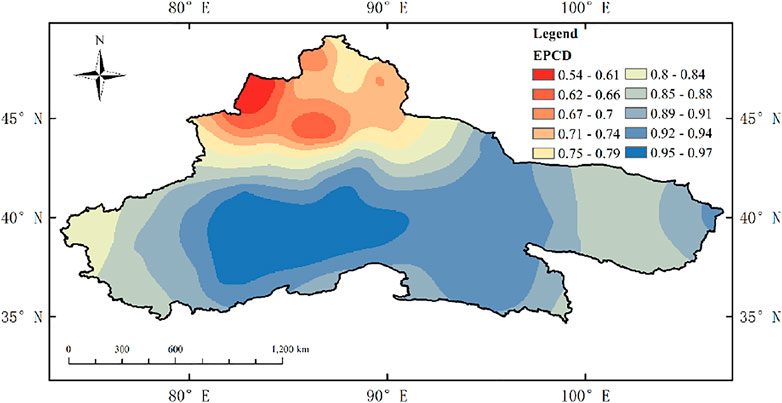
FIGURE 2. Spatial distribution of mean annual extreme precipitation concentration degree (EPCD) during 1968–2021.
Furthermore, in northern Xinjiang, the EPCD value is less than that in southern Xinjiang, indicating that EPOT of northern Xinjiang is more dispersed, especially in Tacheng, which is similar to the distribution of water vapor supply. Specifically, abundant water vapor from the Arctic region and western Eurasia (Wang et al., 2020) is transported to northern Xinjiang and the Tianshan Mountains by Arctic air mass (Tian et al., 2007) and mid-latitude westerlies, resulting in most extreme precipitation occurring in months other than in summer. Additionally, the pattern in northern Xinjiang is in accord with the input pathway of the Arctic air mass. This might cause the dispersion of EPOT of northern Xinjiang and the Tianshan Mountains. Conversely, EPOT of southern Xinjiang is more concentrated because of the minimal source of moisture supply. Under the combined influence of the Iranian vortex and the equatorial vortex, water vapor from the Arabian Sea is transported by the South Asian summer monsoon to southern Xinjiang, which is a crucial input of water vapor at certain times in summer (Huang et al., 2015; Gao et al., 2020; Yao et al., 2020).
In eastern ARNC, including the Hexi Corridor, Qaidam Basin, and Alashan Plateau, EPCD gradually decreases from east to west, indicating that EPOT gradually disperses along the west–east direction but becomes concentrated over the eastern Alashan Plateau. This pattern of change is possibly caused by interaction between the westerlies and the summer monsoon. In the Qaidam Basin and the northern Hexi Corridor, water vapor is mainly transported by the westerlies. Further east, extreme precipitation is interacted by the westerlies and the summer monsoon (Li et al., 2015; Du et al., 2020). In summer, blocked by the Tianshan and Altai mountains, EASM provides abundant water vapor and causes precipitation over the eastern Alashan Plateau (Li et al., 2020).
4.1.2 Interannual Variation of Spatial Pattern of Extreme Precipitation Occurrence Time
Over the past 54 years, EPCD in ARNC has decreased slightly (Figure 3), reflecting that the extreme precipitation events have become more scattered over several months throughout the whole year, which is in accord with the advance of the start date and delay in the end date of extreme precipitation in ARNC (Lu et al., 2021a). EPOT of Xinjiang is concentrated from the north to the south, and matches well with the input pathway of a southward-moving air mass, indicating the potential influence of the Arctic air mass. Specifically, those stations that passed the significance test at the 95% level are mainly in northern Xinjiang, and the pattern is the same as the increase of number days of extreme precipitation (Wang et al., 2014), further reflecting the reliability of the pattern as well as the potential influence of the Arctic air mass. In eastern ARNC, EPOT gradually scatters from southeast to northwest, coincident with the input path of EASM, and it might be related to the prolonged duration of EASM (Ha et al., 2020).
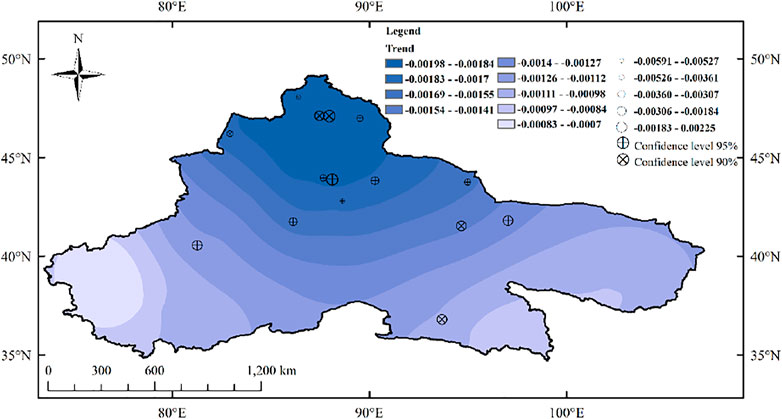
FIGURE 3. Interannual variation of the spatial pattern of extreme precipitation concentration degree (unit:/a).
4.2 Occurrence Time of Maximum Extreme Precipitation
4.2.1 Spatial Pattern of Maximum Extreme Precipitation Occurrence Time
The range of EPCP in ARNC is 160°–195°, revealing that MEPO occurs mainly in July (Figure 4; refer to Table 1), however, MEPO varies widely in different subregions. MEPO occurs in late July on the Alashan Plateau and in the eastern Hexi Corridor, coincident with the time of peak EASM (Wang and LinHo, 2002), indicating the potential influence of EASM. On the other hand, in Xinjiang, the MEPO is delayed from the south to the north; that is, it is in mid-July in the Altai Mountains and surrounding areas, in early July in the Junggar Basin and northern Tarim Basin, and in late June in southern Tarim Basin. The pattern of MEPO in Xinjiang is similar to the pathway of southward invasion of the Arctic air mass, indicating the potential influence of the Arctic air mass. Arctic air mass influences the mid-latitude weather/climate in early summer, owing to hemispheric-scale adjustments in the longwave structure of the tropospheric GH field (Hanna et al., 2013; Overland et al., 2016; Francis et al., 2017). It should be noted that the Gurbantunggut Desert in the Junggar Basin exhibits an anomaly; that is, MEPO is advanced in comparison with surrounding areas, which might be related to the regional topography and type of underlying surface, and it represents a subject that should be investigated further using model simulations.
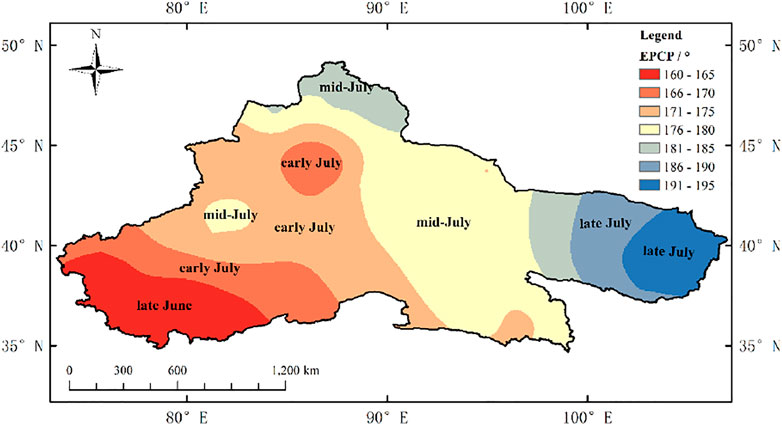
FIGURE 4. Annual mean spatial distribution of extreme precipitation concentration period (EPCP).
4.2.2 Interannual Variation of Spatial Pattern of Maximum Extreme Precipitation Occurrence Time
By definition, the existence of a positive change rate of EPCP corresponds to delay of MEPO, and vice versa. As shown in Figure 5, the change of MEPO presents a pattern of advance–delay–advance–delay from east to west over ARNC, for which only 11.7% (9) of the stations passed the significance test at the 95% level. MEPO has become delayed by < 4 d/10a in the western margins of the Qaidam Basin and the Qilian Mountains, while it has advanced at a rate of between 2 and 8 d/10a from west to east in eastern ARNC (only three of the stations passing the significance test at the 95% level), which might be associated with the fact that the change of heavy precipitation in summer has been less intense than that in spring and autumn (Wang et al., 2015). The change of MEPO in eastern ARNC is also consistent with the input pathway of the EASM. Moreover, the advance of MEPO has gradually decreased at a rate of between 2 and 8 d/10a from south to north in eastern Xinjiang (only two of the stations passing the significance test at the 95% level), except for a delay of <4 d/10a in the northern margins of Xinjiang, reflecting the influence of the invasion of the Arctic air mass. Among these changes, MEPO delay in northern Xinjiang is similar to the increases in precipitation and extreme precipitation intensity during winter time in northern Xinjiang (He et al., 2020; Tang et al., 2020). In contrast, MEPO has become delayed by < 4 d/10a in western Xinjiang, for which only two of the stations passed the significance test at the 95% level. This regional difference is similar to the changes in the intensity of extreme precipitation in Xinjiang, with strong precipitation extreme in western Xinjiang and weak precipitation extreme in eastern Xinjiang (Zhang et al., 2012).
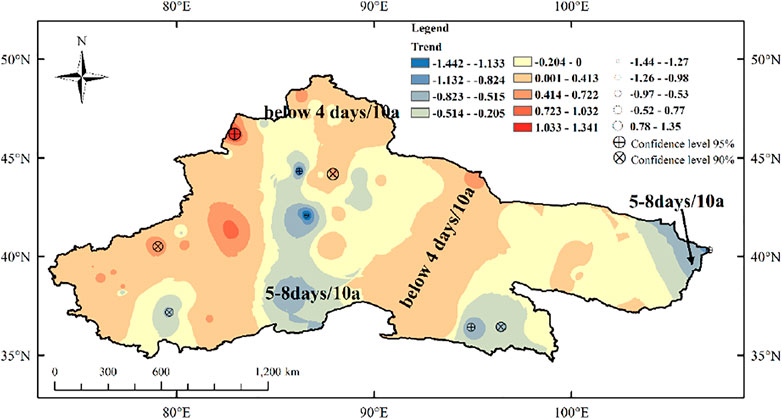
FIGURE 5. Interannual variation of the spatial pattern of the extreme precipitation concentration period (unit: °/a).
4.3 Abrupt Change of Occurrence Time of Extreme Precipitation and Maximum Extreme Precipitation
The Mann–Kendall test was used to identify abrupt signals and trends of EPOT and MEPO (figures not shown), and the moving t-test was conducted to examine the accuracy (figures not shown). The UF curve of EPOT presents a trend of decrease since the early 1980s, especially after 2004 (passing the significance test at the 95% level), indicating that EPOT in ARNC has been more dispersed in the past 54 years. MEPO mainly increased except during 1988–2004, suggesting that MEPO has been delayed over the past 54 years.
No significant abrupt change was detected for EPOT, indicating that regional abrupt variation has not occurred. However, an abrupt change in MEPO in the early 1990s was detected (abrupt point: 1993, passing the significant test at the 95% level), which is in accord with the trends of increasing intensity and frequency of extreme precipitation in Xinjiang after the 1990s (Hu et al., 2021) and the decadal change in summer precipitation in 1991 in ARNC, indicating that it might be affected by the significantly enhanced northward transport of water vapor from low-latitude sea areas (Li and Ma, 2018).
4.4 Oscillations of Occurrence Time of Extreme Precipitation and Maximum Extreme Precipitation on Various Temporal Scales
The oscillations of both EPOT and MEPO were investigated using the power spectrum analysis and wavelet analysis, which are tools used universally for analyzing overall and local oscillation, respectively (Torrence and Compo, 1998; Wang X. et al., 2017; Tan et al., 2018). A quasi-2-years oscillation for EPOT and quasi-6-years oscillation for MEPO were identified via power spectrum analysis (Figures 6A,B), passing the significance test at the 99% and 90% levels, respectively.
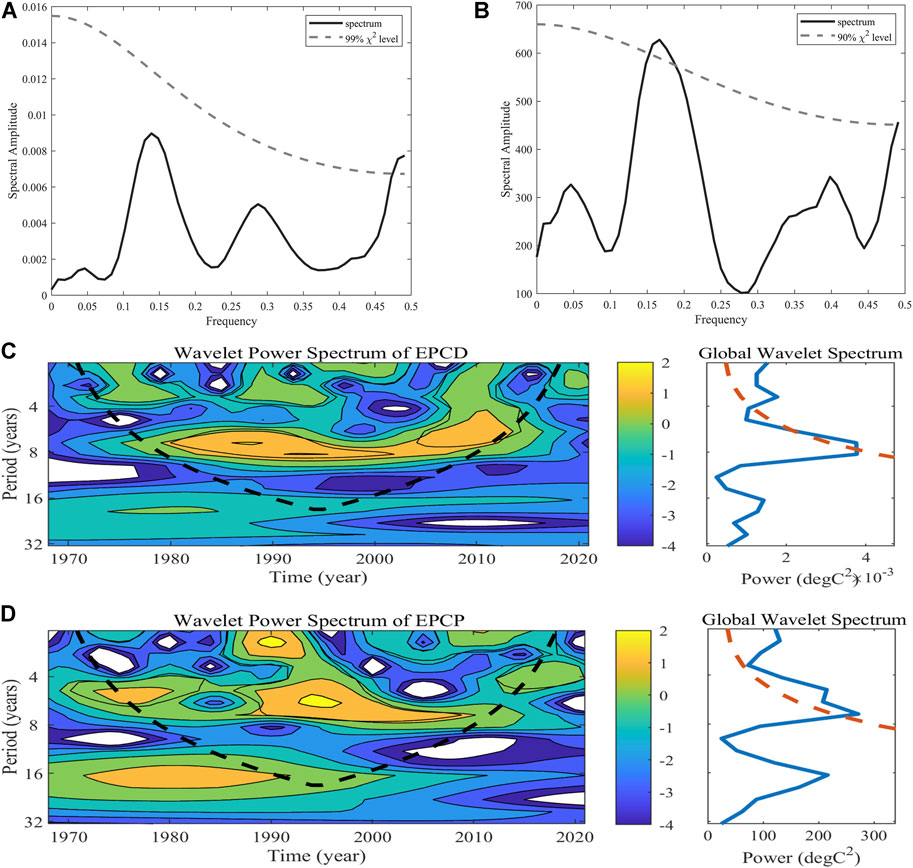
FIGURE 6. Oscillations of extreme precipitation concentration degree (EPCD) and extreme precipitation concentration period (EPCP). Power spectrum analyses of (A) EPCD and (B) EPCP. Wavelet power spectrum and global wavelet spectrum of (C) EPCD and (D) EPCP. Black closed contours of the wavelet power spectrum and red dashed curve of the global wavelet spectrum designate the 95% significance level against red noise, and the cone of influence where edge effects might cause distortion is shown by the U-shaped dashed curve.
A quasi-7-years oscillation for EPOT was identified from the 1980s to the early 2000s (Figure 6C). Meanwhile, a quasi-7-years oscillation for MEPO was identified from the 1990s to the early 2010s (Figure 6D). A quasi-6-years oscillation for MEPO was found to exist from the early 1970s to the early 1980s, consistent with the results from the power spectrum analysis, indicating that the localized oscillation was the same as the overall oscillation. All of the aforementioned oscillations passed the significance test at the 95% level. Moreover, a quasi-16-years oscillation for MEPO was identified during 1970–1990, which failed to pass the significance test at the 95% level.
Precipitation in ARNC is affected by many factors that include the South Asian high (Wei et al., 2017), Asian subtropical westerly jet (Zhao et al., 2013), Indian Ocean Dipole (Hu et al., 2021), El Niño–Southern Oscillation (ENSO) (Lu et al., 2019a), and WPSH (Cheng et al., 2021). The findings regarding EPOT periodicity confirm that oscillations such as those with 2- and 7-year periods are associated with the classical bandwidth of ENSO (Branstator et al., 2008), WPSH (Sui et al., 2007; Feng et al., 2016; Li et al., 2016), and EASM (Yang et al., 2011; Ding et al., 2019), and that the 6-years oscillation of MEPO is also related to the classical bandwidth of ENSO, indicating a potential relationship.
4.5 Relationship Between Anomalous Circulation and Extreme Precipitation
Determination of whether the annual EPCD/EPCP is greater/less than the sum/difference between the mean value and two standard deviations was used to define an extreme event. For EPCD, extreme high years and low years were recognized in 1975 and 2010, respectively. Meanwhile, extreme high years of EPCP were recognized in 1989 and 1995. To further investigate driving circulation, the anomalies of GH, wind, water vapor flux, and water vapor flux divergence at 300, 500, and 700 hPa were calculated separately. It should be noted that the anomalies were derived from the difference between the average for extreme years and the average for the entire study period of 1968–2021, and the difference between the average for the period 1993–2021 and the average for the period 1968–1992. Given that the anomalies of the atmospheric circulation at 700 and 300 hPa were found similar to those at 500 hPa, the following discussion focuses only on the results for the 500–hPa level.
4.5.1 Driving Circulation of EPCP Abrupt Change
Based on the result of the abrupt point of MEPO in 1993, the differences in the atmospheric parameters between 1968–1992 and 1993–2021 were analyzed. As shown in Figure 7A, a positive anomaly of GH appears in the high latitudes of the Northern Hemisphere, which weakens the polar vortex and drives southward the input of the Arctic air mass. Meanwhile, the northeasterly airflow caused by the cyclone over the Japan Sea transports water vapor that converges with the Arctic air mass at 120°E (Figure 7B). Furthermore, the enhanced anticyclone with a positive anomaly of GH centered over Mongolia strengthens the transport of water vapor toward the study region. Moreover, the northwesterly airflow associated with the Iranian Plateau anticyclone and the westerly airflow associated with the Siberia cyclone also strengthens the transport of water vapor toward the study region. Consequently, abundant water vapor converges over the study region (Figures 7C,D). These two main pathways of water vapor transport provide abundant water vapor for triggering extreme precipitation events in the study region.
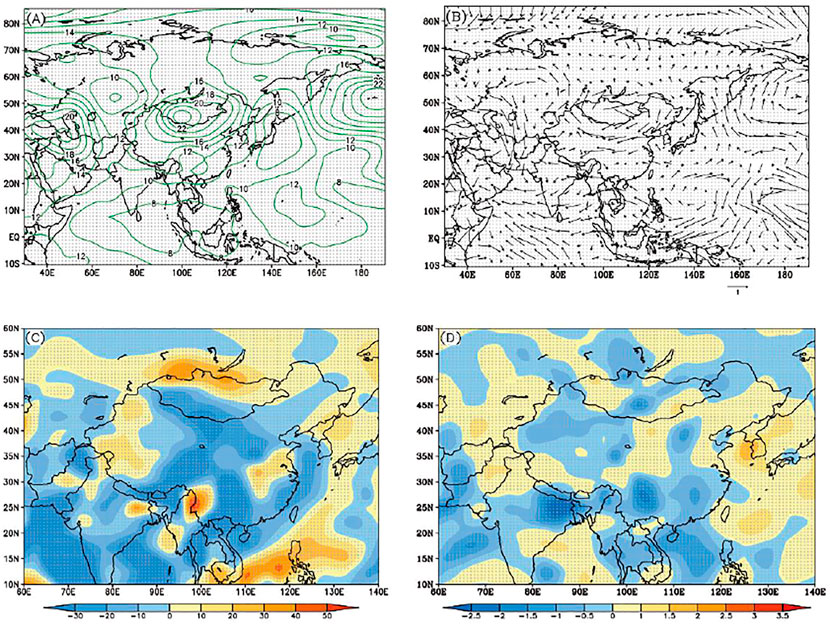
FIGURE 7. Difference in (A) geopotential height, (B) wind at 500 hPa, (C) vertically integrated water vapor flux (surface to 300 hPa), and (D) vertically integrated water vapor flux divergence (surface to 300 hPa) between 1993–2021 and 1968–1992. Gray dots indicate significance at the 0.05 level (two-tailed Student’s t-test).
4.5.2 Driving Circulation With the Highest EPCD
The highest EPCD indicates the most concentrated EPOT, which reflects scarce water vapor sources. As shown in Figure 8A, a negative anomaly is evident in the high latitudes of the Northern Hemisphere, which means a deeper polar vortex. An anticyclone with a positive anomaly of GH over the Okhotsk Sea, together with a cyclone with a negative anomaly of GH over the Barents Sea, suppresses the southward input of the Arctic air mass (Figure 8B). Moreover, the negative anomaly of GH over the Indian subcontinent strengthens the southwesterly airflow. However, owing to the northward input of the southwesterly airflow being impeded by the negative anomaly of GH over the northwestern ARNC, it ultimately only reaches eastern ARNC. Consequently, water vapor is scarce and it diverges within the study region (Figures 8C,D), which is unfavorable for the occurrence of precipitation. We infer that extreme precipitation might be related to recycled moisture over local regions of ARNC (Wu et al., 2012; Peng and Zhou, 2017; Zhang et al., 2021).
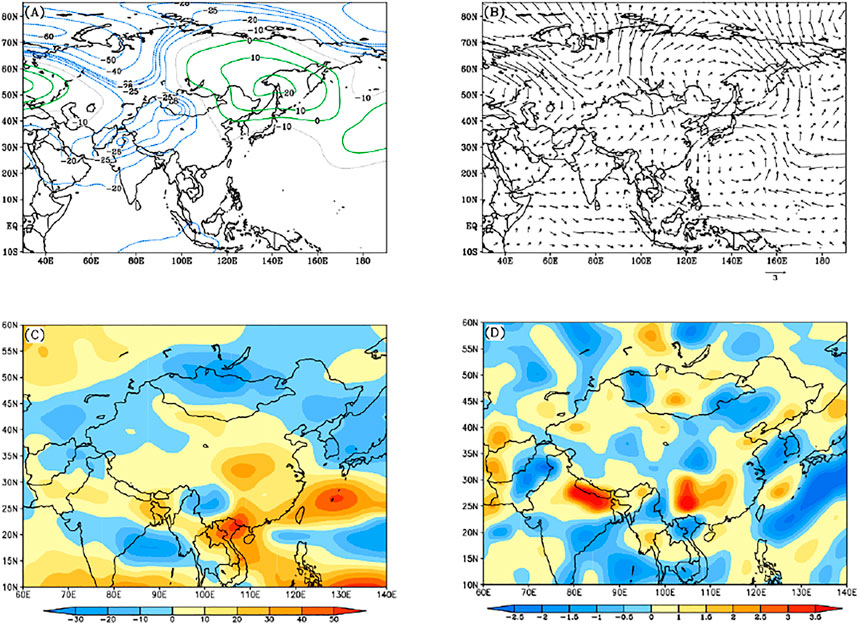
FIGURE 8. Difference in (A) geopotential height, (B) wind at 500 hPa, (C) vertically integrated water vapor flux (surface to 300 hPa), and (D) vertically integrated water vapor flux divergence (surface to 300 hPa) during the year with the highest concentration of extreme precipitation.
4.5.3 Driving Circulation With the Lowest EPCD
The lowest EPCD indicates the most scattered EPOT, which reflects abundant water vapor sources. As shown in Figures 9A,B, the zonal wave pattern is positive–negative–positive with anticyclones with positive anomalies GH over the Eastern Europe Plain and northwestern Pacific, as well as a cyclone with anomalous negative GH over western Siberian in between, bringing water vapor to ARNC (Wu et al., 2017). Therefore, the northwesterly airflow caused by the anticyclone over the Eastern Europe Plain and the northeasterly airflow caused by the cyclone over western Siberian act together to strengthen the transport of water vapor toward the study region, consistent with the transport pathway of summer extreme precipitation events in Xinjiang (Ning et al., 2021). Abundant water vapor is transported toward the study region (Figure 9C) and converges over western Xinjiang (Figure 9D), which is favorable for the occurrence of precipitation. Consequently, the occurrence of extreme precipitation events is scattered in this year.
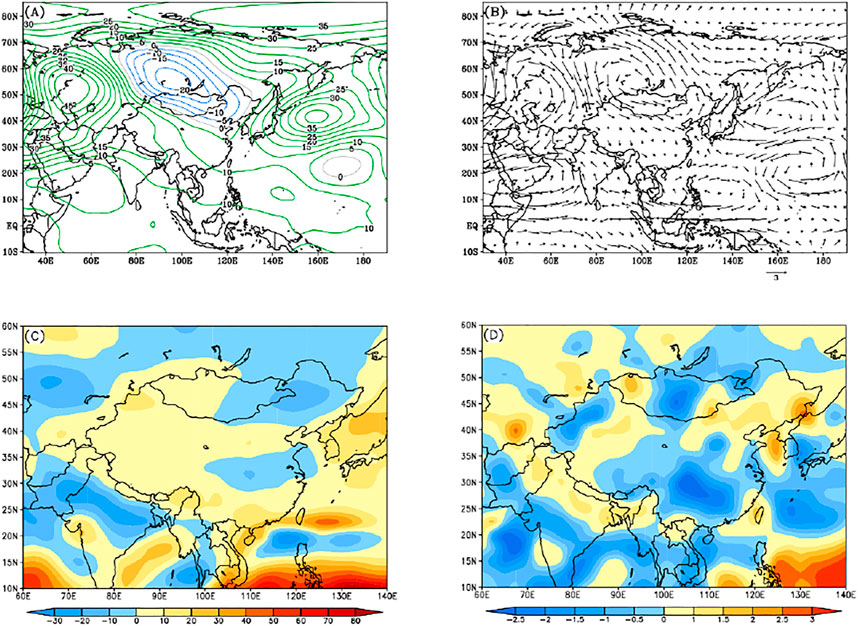
FIGURE 9. Difference in (A) geopotential height, (B) wind at 500 hPa, (C) vertically integrated water vapor flux (surface to 300 hPa), and (D) vertically integrated water vapor flux divergence (surface to 300 hPa) during the year with the lowest concentration of extreme precipitation.
4.5.4 Driving Circulation With the Highest EPCP
The highest EPCP indicates that MEPO is later than in other years and occurs in August. As shown in Figure 10A, a negative anomaly of GH develops over the high latitudes in the Northern Hemisphere, but a positive anomaly centered over western Siberia extends northwestward to 70°N, which strengthens the southward input of the Arctic air mass (Figure 10B). The southern flank of an anticyclone with a positive anomaly of GH over Northeast China causes an easterly wind that transports water vapor toward the study region. Moreover, the cyclone with a negative anomaly of GH over the Iranian Plateau strengthens the southwesterly airflow transporting water vapor to ARNC. These main two water vapor channels provide water vapor to the northern margins of Xinjiang and the southern margins of ARNC (Figure 10C). In particular, water vapor converges over the southern margins of ARNC (Figure 10D), enhancing the occurrence of precipitation.
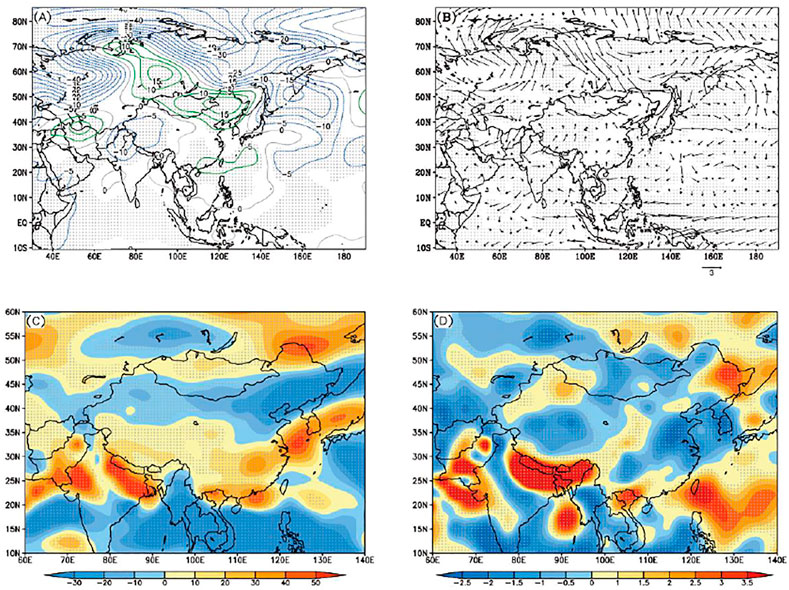
FIGURE 10. Difference in (A) geopotential height, (B) wind at 500 hPa, (C) vertically integrated water vapor flux (surface to 300 hPa), and (D) vertically integrated water vapor flux divergence (surface to 300 hPa) during August in the years with the highest extreme precipitation concentration period. Gray dots indicate significance at the 0.05 level (two-tailed Student’s t-test).
5 Discussion and Conclusion
In comparison with other indexes of extreme precipitation in ARNC, understanding extreme precipitation occurrence time is more useful for early warning of resultant disasters, but it still needs further investigation. The findings of this study indicate relationships between the spatiotemporal patterns of EPOT and MEPO and the summer monsoon and the westerlies. Quasi-2- and 7-year oscillations of EPOT and a quasi-6-years oscillation of MEPO were found, which indicate a potential relationship between EPOT and ENSO, WPSH, and EASM, and between MEPO and ENSO. Furthermore, we found strong negative correlation (–0.45) between EPOT and WPSH intensity (p < 0.01) and strong positive correlation (0.43) between EPOT and the western position of WPSH (p < 0.01). Monsoonal transport is related to a weakened EASM that is accompanied by increasing frequency of activity of the Mongolia anticyclone and persistent westward displacement of the WPSH (Chen C. et al., 2020; Chen et al., 2021). It indicates that EASM might indirectly impact EPOT in ARNC through changes in the intensity and the position of WPSH. Therefore, further research on the physical mechanism of EASM is warranted, especially through the use of model simulations. The lag effect of ENSO, which is related to the summer precipitation in ARNC, could induce Indian Ocean warming that persists into boreal spring and summer, even though ENSO itself might have dissipated, which allows more water vapor from the tropical Indian Ocean to be transported toward central Asia (Lu et al., 2019a). Moreover, water vapor transport from the Arctic Ocean contributes to the increase of summer precipitation over ARNC, especially in the year of ENSO (Wu et al., 2017).
In recent years, extreme weather/climate events in the mid-latitudes of the Northern Hemisphere have been ascribed to Arctic Amplification and Arctic sea ice loss (Francis and Vavrus, 2012; Tang et al., 2013; Wu and Li, 2021). Arctic sea ice loss is linked specifically with the atmospheric circulation of the mid-latitudes (Nakamura et al., 2015). Decline in Arctic sea ice has led to an increase in the number of days of wintertime snowstorms in the Altai region (Sun et al., 2021), the amount of early winter precipitation in ARNC (Liu et al., 2016), and the amount of summer precipitation in eastern parts of Northwest China (Liu et al., 2019). However, researches on the link between Arctic Sea ice loss and the occurrence time of extreme precipitation are scarce. In our study, the spatial patterns of EPOT and MEPO in northern Xinjiang indicate the potential influence of the Arctic air mass. In the interannual spatial pattern of EPOT, those stations that passed the significance test at the 95% level are mainly in northern Xinjiang, further verifying the reliability of the signals and revealing the importance of the Arctic air mass. Additionally, the anomalous atmospheric circulation might reinforce the input of the Arctic air mass, which has a role in extreme precipitation via its impact on water vapor transport to ARNC, during the anomaly dispersion year of EPOT and the anomaly postponement year of MEPO. Although these findings provide a foundation regarding the effect of Arctic Sea ice on EPOT and MEPO in ARNC, further investigation is required. Additionally, decline in sea ice concentration in the Barents Sea has a significant negative effect on the number of days with extremely low temperature in China (Ge et al., 2019), and the winter temperature in Xinjiang also has a significant correlation with the ice index of the Barents–Kara seas (Lu et al., 2019b). The Barents–Kara seas sea ice loss could enhance the winter Tibetan Plateau warming (Duan et al., 2022). This could be considered further support regarding the effect of Arctic Sea ice on extreme weather/climate events in ARNC. Therefore, further research is needed to confirm this supposition.
Data Availability Statement
The data analyzed in this study is subject to the following licenses/restrictions: Because the daily precipitation data is now confidential data, not free to spread. Requests to access these datasets should be directed to YJ, amlhbmd5b3V5YW4xOTgxQDE2My5jb20=.
Author Contributions
WS: Software, Formal analysis, Writing—Original Draft. YJ: Software, Resources, Formal analysis. JC: Software, Formal analysis, Writing—Review and Editing. WD: Conceptualization, Formal analysis, Writing—Review and Editing. LL: Conceptualization. LS: Software. YH: Formal analysis. ZC: Resources. XZ: Formal analysis. SK: Discussion. JW: Revision in Introduction, Discussion and language.
Funding
This work is jointly supported by the following research projects: Supported by National Natural Science Foundation of China (42071018, 42101139), CAS “Light of West China” Program, and State key laboratory of frozen soil engineering, Northwest Institute of Eco-Environment and Resources, Chinese Academy Sciences (Grant Number: SKLFSE202006).
Conflict of Interest
The authors declare that the research was conducted in the absence of any commercial or financial relationships that could be construed as a potential conflict of interest.
The handling editor ZD declared a shared affiliation with the authors WS, YJ, JC, WD, LS, YH, XZ, and SK at the time of review.
Publisher’s Note
All claims expressed in this article are solely those of the authors and do not necessarily represent those of their affiliated organizations, or those of the publisher, the editors, and the reviewers. Any product that may be evaluated in this article, or claim that may be made by its manufacturer, is not guaranteed or endorsed by the publisher.
Acknowledgments
We thank James Buxton, MSc, from Liwen Bianji (Edanz) (www.liwenbianji.cn/), for editing the English text of a draft of this manuscript.
References
Brunner, M. I., Swain, D. L., Wood, R. R., Willkofer, F., Done, J. M., Gilleland, E., et al. (2021). An Extremeness Threshold Determines the Regional Response of Floods to Changes in Rainfall Extremes. Commun. Earth Environ. 2 (1), 173. doi:10.1038/s43247-021-00248-x
Chen, C., Zhang, X., Lu, H., Jin, L., Du, Y., and Chen, F. (2020a). Increasing Summer Precipitation in Arid Central Asia Linked to the Weakening of the East Asian Summer Monsoon in the Recent Decades. Int. J. Climatol. 41 (2), 1024–1038. doi:10.1002/joc.6727
Chen, F., Chen, J., and Huang, W. (2021). Weakened East Asian Summer Monsoon Triggers Increased Precipitation in Northwest China. Sci. China Earth Sci. 64 (5), 835–837. doi:10.1007/s11430-020-9731-7
Chen, Y., Deng, H., Li, B., Li, Z., and Xu, C. (2014). Abrupt Change of Temperature and Precipitation Extremes in the Arid Region of Northwest China. Quat. Int. 336, 35–43. doi:10.1016/j.quaint.2013.12.057
Chen, Y., Li, Z., Fan, Y., Wang, H., and Deng, H. (2015). Progress and Prospects of Climate Change Impacts on Hydrology in the Arid Region of Northwest China. Environ. Res. 139, 11–19. doi:10.1016/j.envres.2014.12.029
Chen, Y., Zhang, X., Fang, G., Li, Z., Wang, F., Qin, J., et al. (2020b). Potential Risks and Challenges of Climate Change in the Arid Region of Northwestern China. Reg. Sustain. 1 (1), 20–30. doi:10.1016/j.regsus.2020.06.003
Cheng, Q., Zhong, F., and Wang, P. (2021). Potential Linkages of Extreme Climate Events with Vegetation and Large-Scale Circulation Indices in an Endorheic River Basin in Northwest China. Atmos. Res. 247, 105256. doi:10.1016/j.atmosres.2020.105256
Ding, Z., Lu, R., and Wang, Y. (2019). Spatiotemporal Variations in Extreme Precipitation and Their Potential Driving Factors in Non-monsoon Regions of China during 1961-2017. Environ. Res. Lett. 14 (2), 024005. doi:10.1088/1748-9326/aaf2ec
Donat, M. G., Lowry, A. L., Alexander, L. V., O’Gorman, P. A., and Maher, N. (2016). More Extreme Precipitation in the World's Dry and Wet Regions. Nat. Clim. Change 6 (5), 508–513. doi:10.1038/nclimate2941
Dong, Q., Wang, W., Kunkel, K. E., Shao, Q., Xing, W., and Wei, J. (2020). Heterogeneous Response of Global Precipitation Concentration to Global Warming. Int. J. Climatol. 41 (S1), 6851. doi:10.1002/joc.6851
Du, W., Kang, S., Qin, X., Ji, Z., Sun, W., Chen, J., et al. (2020). Can Summer Monsoon Moisture Invade the Jade Pass in Northwestern China? Clim. Dyn. 55 (5), 3101–3115. doi:10.1007/s00382-020-05423-y
Duan, A., Peng, Y., Liu, J., Chen, Y., Wu, G., Holland, D. M., et al. (2022). Sea Ice Loss of the Barents-Kara Sea Enhances the Winter Warming over the Tibetan Plateau. npj Clim. Atmos. Sci. 5 (1), 245. doi:10.1038/s41612-022-00245-7
Feng, Q., Li, Z., Liu, W., Li, J., Guo, X., and Wang, T. (2016). Relationship between Large Scale Atmospheric Circulation, Temperature and Precipitation in the Extensive Hexi Region, China, 1960-2011. Quat. Int. 392, 187–196. doi:10.1016/j.quaint.2015.06.015
Francis, J. A., Vavrus, S. J., and Cohen, J. (2017). Amplified Arctic Warming and Mid‐latitude Weather: New Perspectives on Emerging Connections. WIREs Clim. Change 8 (5), e474. doi:10.1002/wcc.474
Francis, J. A., and Vavrus, S. J. (2012). Evidence Linking Arctic Amplification to Extreme Weather in Mid-latitudes. Geophys. Res. Lett. 39 (6), L06801. doi:10.1029/2012gl051000
Gao, H., Bao, D., Emer, M., Fan, S., and Zheng, Z. (2020), Analysis of the Contribution of Water Vapor from the Arabian Sea to the Local Rainstorm Process in Southern Xinjiang. Earth Sci. 9 (6). doi:10.11648/j.earth.20200906.12
Gariano, S. L., and Guzzetti, F. (2016). Landslides in a Changing Climate. Earth-Science Rev. 162, 227–252. doi:10.1016/j.earscirev.2016.08.011
Ge, F., Yan, T., Zhou, JL., Jiang, Y., Li, LW., Fan, Y., et al. (2019). Impact of Sea Ice Decline in the Arctic Ocean on the Number of Extreme Low‐Temperature Days Over China. Int. J. Climatol. 40 (3), 1421–1434. doi:10.1002/joc.6277
Ha, K. J., Moon, S., Timmermann, A., and Kim, D. (2020). Future Changes of Summer Monsoon Characteristics and Evaporative Demand Over Asia in CMIP6 Simulations. Geophys. Res. Lett. 47 (8), 87492. doi:10.1029/2020gl087492
Han, J., Du, H., Wu, Z., and He, H. S. (2019). Changes in Extreme Precipitation Over Dry and Wet Regions of China During 1961‐2014. J. Geophys. Res. Atmos. 124 (5895), 1–13. doi:10.1029/2018jd029974
Hanna, E., Jones, J. M., Cappelen, J., Mernild, S. H., Wood, L., Steffen, K., et al. (2013). The Influence of North Atlantic Atmospheric and Oceanic Forcing Effects on 1900-2010 Greenland Summer Climate and Ice Melt/runoff. Int. J. Climatol. 33 (4), 862–880. doi:10.1002/joc.3475
He, B., Sheng, Y., Cao, W., and Wu, J. (2020). Characteristics of Climate Change in Northern Xinjiang in 1961-2017, China. Chin. Geogr. Sci. 30 (2), 249–265. doi:10.1007/s11769-020-1104-5
Hu, W., Yao, J., He, Q., and Chen, J. (2021). Changes in Precipitation Amounts and Extremes across Xinjiang (Northwest China) and Their Connection to Climate Indices. PeerJ 9, e10792. doi:10.7717/peerj.10792
Huang, J., Yu, H., Dai, A., Wei, Y., and Kang, L. (2017). Drylands Face Potential Threat under 2 °C Global Warming Target. Nat. Clim. Change 7 (6), 417–422. doi:10.1038/nclimate3275
Huang, W., Feng, S., Chen, J., and Chen, F. (2015). Physical Mechanisms of Summer Precipitation Variations in the Tarim Basin in Northwestern China. J. Clim. 28 (9), 3579–3591. doi:10.1175/jcli-d-14-00395.1
IPCC (2021). Climate Change 2021: The Physical Science Basis. Contribution of Working Group I to the Sixth Assessment Report of the Intergovernmental Panel on Climate Change. New York, NY, United States: Cambridge University Press.
Jiang, F.-q., Hu, R.-J., Wang, S.-P., Zhang, Y.-W., and Tong, L. (2012). Trends of Precipitation Extremes during 1960-2008 in Xinjiang, the Northwest China. Theor. Appl. Climatol. 111 (1-2), 133–148. doi:10.1007/s00704-012-0657-3
Li, B., Chen, Y., Chen, Z., Xiong, H., and Lian, L. (2016). Why Does Precipitation in Northwest China Show a Significant Increasing Trend from 1960 to 2010? Atmos. Res. 167, 275–284. doi:10.1016/j.atmosres.2015.08.017
Li, J., Li, J., Du, L., Zhang, Y., and Wang, S. (2013). General Situation of Heavy Rain in Northwest China and Analysis of a Case. J. Lanzhou Univ. Nat. Sci. 49 (04), 474–482. doi:10.13885/j.issn.0455-2059.2013.04.020
Li, M., and Ma, Z. (2018). Decadal Changes in Summer Precipitation over Arid Northwest China and Associated Atmospheric Circulations. Int. J. Climatol. 38 (12), 4496–4508. doi:10.1002/joc.5682
Li, S., and Qian, Y. F. (2006). New Methods to Research the General Features of Precipitation in China. Nanjing: Journal of Nanjing Institute of Meteorology.
Li, X., Jiang, F., Li, L., and Wang, G. (2010). Spatial and Temporal Variability of Precipitation Concentration Index, Concentration Degree and Concentration Period in Xinjiang, China. Int. J. Climatol. 31 (11), 1679–1693. doi:10.1002/joc.2181
Li, Z., Wei, M., Zhou, J., and Tian, X. (2020). Arid-humid Variations in the Summer Climate and Their Influence Mechanism in Asian Monsoon Margin of Northwest China during 1960-2010: A Case Study in the Alashan Plateau. Int. J. Climatol. 40 (15), 6574–6586. doi:10.1002/joc.6599
Lin, P., He, Z., Du, J., Chen, L., Zhu, X., and Li, J. (2017). Recent Changes in Daily Climate Extremes in an Arid Mountain Region, a Case Study in Northwestern China's Qilian Mountains. Sci. Rep. 7 (1), 2245. doi:10.1038/s41598-017-02345-4
Liu, N., Lin, L., Kong, B., Wang, Y., Zhang, Z., and Chen, H. (2016). Association between Arctic Autumn Sea Ice Concentration and Early Winter Precipitation in China. Acta Oceanol. Sin. 35 (5), 73–78. doi:10.1007/s13131-016-0860-7
Liu, Y., Zhu, Y., Wang, H., Gao, Y., Sun, J., Wang, T., et al. (2019). Role of Autumn Arctic Sea Ice in the Subsequent Summer Precipitation Variability over East Asia. Int. J. Climatol. 40 (2), 706–722. doi:10.1002/joc.6232
Lu, B., Li, H., Wu, J., Zhang, T., Liu, J., Liu, B., et al. (2019a). Impact of El Niño and Southern Oscillation on the Summer Precipitation over Northwest China. Atmos. Sci. Lett. 20 (12), 928. doi:10.1002/asl.928
Lu, C., Li, K., Xie, S., Wang, Z., and Qin, Y. (2019b). Month-to-Month Variability of Autumn Sea Ice in the Barents and Kara Seas and Its Relationship to Winter Air Temperature in China. Adv. Meteorol. 2019, 1–13. doi:10.1155/2019/4381438
Lu, S., Hu, Z., Yu, H., Fan, W., Fu, C., and Wu, D. (2021a). Changes of Extreme Precipitation and its Associated Mechanisms in Northwest China. Adv. Atmos. Sci. 38 (10), 1665–1681. doi:10.1007/s00376-021-0409-3
Lu, S., Xu, D., Yan, X., Mai, Z., and Ding, Y. (2021b). Analysis of the Water Vapor Tracking on a Rainstorm in Midsummer and in Semi-arid Region of Northwest China. J. Nat. Disasters 30 (05), 122–134. doi:10.13577/j.jnd.2021.0511
Meehl, G. A., Arblaster, J. M., Branstator, G., and van Loon, H. (2008). A Coupled Air-Sea Response Mechanism to Solar Forcing in the Pacific Region. J. Clim. 21 (12), 2883–2897. doi:10.1175/2007jcli1776.1
Nakamura, T., Yamazaki, K., Iwamoto, K., Honda, M., Miyoshi, Y., Ogawa, Y., et al. (2015). A Negative Phase Shift of the Winter AO/NAO Due to the Recent Arctic Sea‐ice Reduction in Late Autumn. J. Geophys. Res. Atmos. 120 (8), 3209–3227. doi:10.1002/2014jd022848
Ning, G., Luo, M., Zhang, Q., Wang, S., Liu, Z., Yang, Y., et al. (2021). Understanding the Mechanisms of Summer Extreme Precipitation Events in Xinjiang of Arid Northwest China. JGR Atmos. 126 (15), 34111. doi:10.1029/2020jd034111
Overland, J. E., Dethloff, K., Francis, J. A., Hall, R. J., Hanna, E., Kim, S.-J., et al. (2016). Nonlinear Response of Mid-latitude Weather to the Changing Arctic. Nat. Clim. Change 6 (11), 992–999. doi:10.1038/nclimate3121
Peng, D., and Zhou, T. (2017). Why Was the Arid and Semiarid Northwest China Getting Wetter in the Recent Decades? J. Geophys. Res. Atmos. 122 (17), 9060–9075. doi:10.1002/2016jd026424
Pfahl, S., O’Gorman, P. A., and Fischer, E. M. (2017). Understanding the Regional Pattern of Projected Future Changes in Extreme Precipitation. Nat. Clim. Change 7 (6), 423–427. doi:10.1038/nclimate3287
Shi, X., Li, K., Yang, M., and Lu, X. (2021). Spatial-Temporal Distribution of Summer Extreme Precipitation in South China and Response of Tropical Ocean. Gep 09 (03), 249–261. doi:10.4236/gep.2021.93015
Song, L., Tian, Q., Li, Z., Lv, Y. M., Gui, J., Zhang, B., et al. (2022). Changes in Characteristics of Climate Extremes from 1961 to 2017 in Qilian Mountain Area, Northwestern China. Environ. Earth Sci. 81 (6), 10297. doi:10.1007/s12665-022-10297-w
Sui, C.-H., Chung, P.-H., and Li, T. (2007). Interannual and Interdecadal Variability of the Summertime Western North Pacific Subtropical High. Geophys. Res. Lett. 34 (11), 29204. doi:10.1029/2006gl029204
Sun, Q., Daryin, A., Zhao, J., Xie, M., Darin, F., Rakshun, Y., et al. (2021). High‐Resolution Elemental Record From the Holocene Sediments of an Alpine Lake in the Central Altai Mountains: Implications for Arctic Sea‐Ice Variations. Earth Space Sci. 8 (8), 1810. doi:10.1029/2021ea001810
Tan, L., Cai, Y., Cheng, H., Edwards, L. R., Lan, J., Zhang, H., et al. (2018). High Resolution Monsoon Precipitation Changes on Southeastern Tibetan Plateau over the Past 2300 Years. Quat. Sci. Rev. 195, 122–132. doi:10.1016/j.quascirev.2018.07.021
Tang, Q., Zhang, X., and Francis, J. A. (2013). Extreme Summer Weather in Northern Mid-latitudes Linked to a Vanishing Cryosphere. Nat. Clim. Change 4 (1), 45–50. doi:10.1038/nclimate2065
Tao, Z., and Han, L. (2022). Emergency Response, Influence and Lessons in the 2021 Compound Disaster in Henan Province of China. Ijerph 19 (1), 488. doi:10.3390/ijerph19010488
Tian, L., Yao, T., MacClune, K., White, J. W. C., Schilla, A., Vaughn, B., et al. (2007). Stable Isotopic Variations in West China: A Consideration of Moisture Sources. J. Geophys. Res. 112 (D10), 7718. doi:10.1029/2006jd007718
Torrence, C., and Compo, G. P. (1998). A Practical Guide to Wavelet Analysis. Bull. Amer. Meteor. Soc. 79 (1), 61–78. doi:10.1175/1520-0477(1998)079<0061:Apgtwa>2.0.Co
Wang, B., and LinHo, (2002). Rainy Season of the Asian-Pacific Summer Monsoon*. J. Clim. 15 (4), 386–398. doi:10.1175/1520-0442(2002)015<0386:rsotap>2.0.co;2
Wang, B., Zhang, M., Wei, J., Wang, S., Li, S., Ma, Q., et al. (2013). Changes in Extreme Events of Temperature and Precipitation over Xinjiang, Northwest China, during 1960-2009. Quat. Int. 298, 141–151. doi:10.1016/j.quaint.2012.09.010
Wang, C.-b., Li, S.-s., Yan, J.-p., and Wu, Y.-q. (2019). Spatiotemporal Variation of Extreme Precipitation Regimes in the Hanjiang River Basin during 1970-2015. J. Nat. Resour. 34 (6), 1209–1222. doi:10.31497/zrzyxb.20190607
Wang, H., Chen, Y., Xun, S., Lai, D., Fan, Y., and Li, Z. (2012). Changes in Daily Climate Extremes in the Arid Area of Northwestern China. Theor. Appl. Climatol. 112 (1-2), 15–28. doi:10.1007/s00704-012-0698-7
Wang, H., Gao, T., and Xie, L. (2018). Extreme Precipitation Events during 1960-2011 for the Northwest China: Space-Time Changes and Possible Causes. Theor. Appl. Climatol. 137 (1-2), 977–995. doi:10.1007/s00704-018-2645-8
Wang, S., Jiang, F., and Ding, Y. (2015). Spatial Coherence of Variations in Seasonal Extreme Precipitation Events over Northwest Arid Region, China. Int. J. Climatol. 35 (15), 4642–4654. doi:10.1002/joc.4313
Wang, S., Jiang, F., Wu, X., and Hu, R. (2014). Temporal and Spatial Variability of the Extreme Precipitation Indices Overthe Arid Regions in Northwest China from 1961 to 2010. J. Glaciol. Geocryol. 36 (2), 318–326. doi:10.7522/j.issn.1000-0240.2014.0039
Wang, W., Li, H., Wang, J., and Hao, X. (2020). Water Vapor from Western Eurasia Promotes Precipitation during the Snow Season in Northern Xinjiang, a Typical Arid Region in Central Asia. Water 12 (1), 141. doi:10.3390/w12010141
Wang, X., Hou, X., and Wang, Y. (2017a). Spatiotemporal Variations and Regional Differences of Extreme Precipitation Events in the Coastal Area of China from 1961 to 2014. Atmos. Res. 197, 94–104. doi:10.1016/j.atmosres.2017.06.022
Wang, Y., Zhou, B., Qin, D., Wu, J., Gao, R., and Song, L. (2017b). Changes in Mean and Extreme Temperature and Precipitation over the Arid Region of Northwestern China: Observation and Projection. Adv. Atmos. Sci. 34 (3), 289–305. doi:10.1007/s00376-016-6160-5
Wei, W., Zhang, R., Wen, M., and Yang, S. (2017). Relationship between the Asian Westerly Jet Stream and Summer Rainfall over Central Asia and North China: Roles of the Indian Monsoon and the South Asian High. J. Clim. 30 (2), 537–552. doi:10.1175/jcli-d-15-0814.1
Wu, B., and Li, Z. (2021). Possible Impacts of Anomalous Arctic Sea Ice Melting on Summer Atmosphere. Intl J. Climatol. 42, 1818–1827. doi:10.1002/joc.7337
Wu, P., Ding, Y., and Liu, Y. (2017). A New Study of El Nino Impacts on Summertime Water Vapor Transport and Rainfall in China. Acta Meteorol. Sin. 75 (03), 371. doi:10.11676/qxxb2017.033
Wu, Y.-p., Shen, Y.-p., and Larry Li, B. (2012). Possible Physical Mechanism of Water Vapor Transport over Tarim River Basin. Ecol. Complex. 9, 63–70. doi:10.1016/j.ecocom.2011.12.002
Xiang-ling, T., Xin, L., and Yanwei, Z. (2020). Estimation of Future Extreme Precipitation Changes in Xinjiang Based on RegCM4.4 Simulations. Nat. Hazards 102 (1), 201–218. doi:10.1007/s11069-020-03920-1
Xiao, M., Zhang, Q., and Singh, V. P. (2017). Spatiotemporal Variations of Extreme Precipitation Regimes during 1961-2010 and Possible Teleconnections with Climate Indices across China. Int. J. Climatol. 37 (1), 468–479. doi:10.1002/joc.4719
Xu, Y., Gao, X., Giorgi, F., Zhou, B., Shi, Y., Wu, J., et al. (2018). Projected Changes in Temperature and Precipitation Extremes over China as Measured by 50-yr Return Values and Periods Based on a CMIP5 Ensemble. Adv. Atmos. Sci. 35 (4), 376–388. doi:10.1007/s00376-017-6269-1
Yang, H., Zhi, X., Gao, J., and Liu, Y. (2011). Variation of East Asian Summer Monsoon and its Relationship with Precipitation of China in Recent 111 Years. Agric. Sci. Technol. 12, 1711. doi:10.16175/j.cnki.1009-4229.2011.11.012
Yao, S., Jiang, D., and Zhang, Z. (2020). Lagrangian Simulations of Moisture Sources for Chinese Xinjiang Precipitation during 1979-2018. Int. J. Climatol. 41 (S1), 6679. doi:10.1002/joc.6679
Yin, X., and Zhou, L.-T. (2018). Dominant Modes of Wintertime Precipitation Variability in Northwest China and the Association With Circulation Anomalies and Sea Surface Temperature. Int. J. of Climatol. 38 (13), 4860–4874. doi:10.1002/joc.5703
Zeng, Y., and Yang, L. (2020). Triggering Mechanism of an Extreme Rainstorm Process Near the Tianshan Mountains in Xinjiang, an Arid Region in China, Based on a Numerical Simulation. Adv. Meteorology 2020, 1–12. doi:10.1155/2020/8828060
Zhai, P., and Pan, X. (2003). Change in Extreme Temperature and Precipitation over Northern China During the Second Half of the 20th Century. Acta Geogr. Sin. 58 (S1), 1. doi:10.11821/xb20037s001
Zhai, P., Zhang, X., Wan, H., and Pan, X. (2005). Trends in Total Precipitation and Frequency of Daily Precipitation Extremes over China. J. Clim. 18 (7), 1096–1108. doi:10.1175/jcli-3318.1
Zhang, L., and Qian, Y. (2003). Annual Distribution Features of Precipitation in China and Theri Interannual Variations. Acta Meteorol. Sin. 17 (02), 146.
Zhang, Q., Li, J., Singh, V. P., and Xiao, M. (2013). Spatio-temporal Relations between Temperature and Precipitation Regimes: Implications for Temperature-Induced Changes in the Hydrological Cycle. Glob. Planet. Change 111, 57–76. doi:10.1016/j.gloplacha.2013.08.012
Zhang, Q., Singh, V. P., Li, J., Jiang, F., and Bai, Y. (2012). Spatio-temporal Variations of Precipitation Extremes in Xinjiang, China. J. Hydrology 434-435, 7–18. doi:10.1016/j.jhydrol.2012.02.038
Zhang, Z., Zhao, Q., and Zhang, S. (2021). Abundant Precipitation in Qilian Mountains Generated from the Recycled Moisture over the Adjacent Arid Hexi Corridor, Northwest China. Water 13 (23), 3354. doi:10.3390/w13233354
Zhao, Y., Huang, D., Zhu, J., and Yang, Q. (2011). The Feature Analysis of Regional and Persistent Extreme Precipitation Events in Northern Xinjiang Region. J. Glaciol. Geocryol. 33 (3), 8.doi:10.1007/s00376-010-1000-5
Zhao, Y., Wang, M., Huang, A., Li, H., Huo, W., and Yang, Q. (2013). Relationships between the West Asian Subtropical Westerly Jet and Summer Precipitation in Northern Xinjiang. Theor. Appl. Climatol. 116 (3-4), 403–411. doi:10.1007/s00704-013-0948-3
Zhou, L.-T., and Huang, R.-H. (2010). Interdecadal Variability of Summer Rainfall in Northwest China and its Possible Causes. Int. J. Climatol. 30 (4), 549–557. 10.1002/joc.1923.
Zhou, X., and Lei, W. (2018). Hydrological Interactions between Oases and Water Vapor Transportation in the Tarim Basin, Northwestern China. Sci. Rep. 8 (1), 13431. doi:10.1038/s41598-018-31440-3
Zongxing, L., Yan, G., Yamin, W., Yanhui, P., Jianguo, L., Aifang, C., et al. (2015). Can Monsoon Moisture Arrive in the Qilian Mountains in Summer? Quat. Int. 358, 113–125. doi:10.1016/j.quaint.2014.08.046
Keywords: extreme precipitation, concentration degree, concentration period, spatiotemporal pattern, circulation mechanism
Citation: Sun W, Jiang Y, Chen J, Du W, Lian L, Song L, Hu Y, Cheng Z, Zhou X, Kang S and Wu J (2022) Spatiotemporal Pattern of Occurrence Time of Extreme Precipitation and Circulation Mechanisms in the Arid Region of Northwest China. Front. Earth Sci. 10:931916. doi: 10.3389/feart.2022.931916
Received: 03 May 2022; Accepted: 08 June 2022;
Published: 14 July 2022.
Edited by:
Zhiwen Dong, Chinese Academy of Sciences (CAS), ChinaReviewed by:
Baojuan Huai, Shandong Normal University, ChinaXiping Cheng, Southwest Forestry University, China
Xiaoli Liu, Henan University, China
Copyright © 2022 Sun, Jiang, Chen, Du, Lian, Song, Hu, Cheng, Zhou, Kang and Wu. This is an open-access article distributed under the terms of the Creative Commons Attribution License (CC BY). The use, distribution or reproduction in other forums is permitted, provided the original author(s) and the copyright owner(s) are credited and that the original publication in this journal is cited, in accordance with accepted academic practice. No use, distribution or reproduction is permitted which does not comply with these terms.
*Correspondence: Youyan Jiang, amlhbmd5b3V5YW4xOTgxQDE2My5jb20=; Jizu Chen, Y2hlbmppenVAbHpiLmFjLmNu