 Molly M. Gallahue1*
 Leah Salditch2Madeleine C. Lucas3
 James Neely1,4
 Seth Stein1,4Norman Abrahamson5Tessa Williams5
 Susan E. Hough6
- 1Northwestern University, Department of Earth and Planetary Sciences, Evanston, IL, United States
- 2U.S. Geological Survey, Geologic Hazards Science Center, United States Geological Survey, Golden, CO, United States
- 3University of Washington, Department of Earth and Space Sciences, Seattle, WA, United States
- 4Northwestern University, Institute for Policy Research, Evanston, IL, United States
- 5University of California, Berkeley, Department of Civil and Environmental Engineering, Berkeley, CA, United States
- 6U.S. Geological Survey, Earthquake Science Center, Pasadena, CA, United States
Prior studies have repeatedly shown that probabilistic seismic hazard maps from several different countries predict higher shaking than that observed. Previous map assessments have not, however, considered the influence of site response on hazard. Seismologists have long acknowledged the influence of near-surface geology, in particular low-impedance sediment layers, on earthquake ground-motion at frequencies of engineering concern. Although the overall effects of site response are complex, modern ground-motion models (GMMs) account for site effects using terms based on VS30, the time-averaged shear-wave velocity in the upper 30 m of the Earth’s surface. In this study, we consider general implications of incorporating site terms from modern GMMs using site-specific VS30 as a proxy in probabilistic seismic hazard maps for California. At the long periods (1–5 s) that affect tall buildings, site terms amplify the mapped hazard by factors of 1–3 at many sites relative to maps calculated for the standard reference soft-rock site condition, VS30 = 760 m/s. However, at the short periods of ground-motion that are the main contributors to peak ground acceleration (PGA) and thus affect smaller structures, only negligible effects occur due to nonlinear deamplification of strong ground-motion at high frequencies. Nonlinear deamplification increases as the shaking level increases. For very strong shaking, deamplification can overcome the linear amplification, yielding net deamplification. We explore the implications of these results for the evaluation of hazard maps. Because site effects do not change the maps appreciably at short periods, we can exclude site response as an explanation for why the maps overpredict historically observed shaking as captured by the California Historical Intensity Mapping Project (CHIMP) dataset. The results are expected to be generalizable to regions that are comparable to California in terms of structure and seismicity rates. In low-to-moderate-seismicity regions where the hazard reflects weaker shaking, nonlinear site response is expected to be less important for the hazard.
Introduction
Probabilistic seismic hazard analyses (PSHA) forecast the level of earthquake shaking that will be exceeded with a certain probability over a given period of time, providing a critical product for earthquake hazard assessment and risk mitigation (Cornell, 1968). PSHA models and corresponding maps are based on assumptions about the rates, spatial distribution, and sizes of potential future earthquakes and the resulting shaking as a function of distance, as described by ground-motion models (GMMs) that cover broad geologic regions. These maps seek to forecast future shaking, so some degree of inaccuracy is expected, as that arises for weather forecasts. Published hazard maps appear to overpredict shaking relative to historical data for shaking datasets and hazard maps developed by different groups and using different approaches.
An important question is how these maps can best incorporate the effects of conditions at a specific site. Since the 1906 San Francisco earthquake, seismologists have recognized that unconsolidated material with low seismic velocity could amplify shaking (e.g., Wood, 1908; Kanai and Yoshizawa, 1956; Gutenberg 1957; Borcherdt, 1970). Although site effects will modify ground-motion in more complicated ways than a GMM site term alone can capture, present models incorporate site effects using VS30, the time-averaged shear-wave velocity in the top 30 m of soil, as a proxy (Abrahamson et al., 2008; Borcherdt, 2014; Gregor et al., 2014). Although ground-motion can also be affected by factors other than local site conditions (Olsen, 2000), in the development of national hazard maps using ergodic GMMs, the effect of the complexity of the site amplification beyond VS30 is represented by the aleatory standard deviation of the GMM. Thus, as site factor models are now widely used, we consider their implications for PSHA maps. Here, the term “ground-motion” refers to response spectral acceleration.
The 2018 USGS National Hazard map is calculated with a uniform reference VS30 of 260 and 760 m/s. VS30 = 760, a common reference value, is about that of dense soil or soft rock (Seyhan and Stewart, 2012; Petersen et al., 2020). This VS30 value corresponds to a National Earthquake Hazards Reduction Program (NEHRP) site class B/C (BSSC, 2020). The U.S. Geological Survey (USGS) publishes maps for more site classes but does not include detailed site-specific effects. In this study, we refer to these maps for constant VS30 = 760 m/s as reference maps. Because the maps are intended for use with site-specific factors (U.S. Geological Survey, 2021), the reference maps allow simple site-specific adjustments for VS30, which varies considerably based on site conditions (Borcherdt, 1970; Petersen et al., 2020). Maps are available for shaking for response spectral values at various spectral periods. The most commonly used ground-motion parameter, peak ground acceleration (PGA), corresponds to the response spectral acceleration at a period of T = 0.0 s. Using the Next-Generation Attenuation West 2 (NGA-West2) GMMs for California, the 5%-damped response spectra are nearly flat at T=0.01 s. We use the response spectral acceleration at T=0.01 s as an estimate of the PGA, which is consistent with the approach of two of the NGA-W2 GMMs (Abrahamson et al., 2014; Chiou and Youngs, 2014).
In this article, we explore the implications of site terms from current GMMs with VS30 as a proxy on hazard maps for California, which contain a range of sites in different geologic environments with well-documented site conditions. A range of GMMs that include site effect terms has been developed for the area. To explore the resulting effects, we estimate site-specific VS30 values for California using the results of Wills et al. (2015) (Figure 1). Most sites have VS30 equal to or lower than the reference value, 760 m/s. Lower VS30 values are found in the Los Angeles Basin, San Francisco Bay Area, and Central Valley, whereas relatively high VS30 values are present throughout the Sierra Nevada. To consider the effect of site-specific VS30 on the reference USGS maps, we use the site terms in the four NGA-West2 models that were averaged to create the maps (Abrahamson et al., 2014 (ASK14), Boore et al., 2014 (BSSA14), Campbell and Borzorgnia, 2014 (CB14), and Chiou and Youngs, 2014 (CY14)). The resulting site-specific maps are expected to capture first-order site effects.
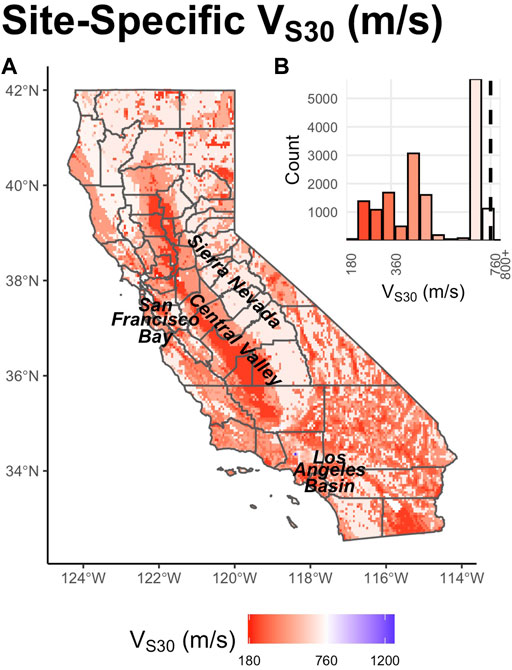
FIGURE 1. (A) Map of median VS30 in 10 × 10 km grid cells for California. (B) Histogram of median VS30 values. Most sites have VS30 < 760 m/s, the reference value used in USGS hazard maps.
Site effects in NGA-West2 models
Each of the four NGA-West2 GMMs includes a site amplification term that amplifies or deamplifies shaking relative to the model’s reference VS30. Because the reference VS30 values vary among the four GMMs (ASK14 uses 1,180 m/s (Figure 2A), BSSA14 uses 760 m/s (Figure 2B), CB14 uses 1,100 m/s (Figure 2C), and CY14 uses 1,130 m/s (Figure 2D)), we first normalize the models to the USGS maps’ reference value of 760 m/s by scaling by the ratio of the GMM’s amplifications at 760 m/s and the GMM’s amplification at each model’s reference velocity.
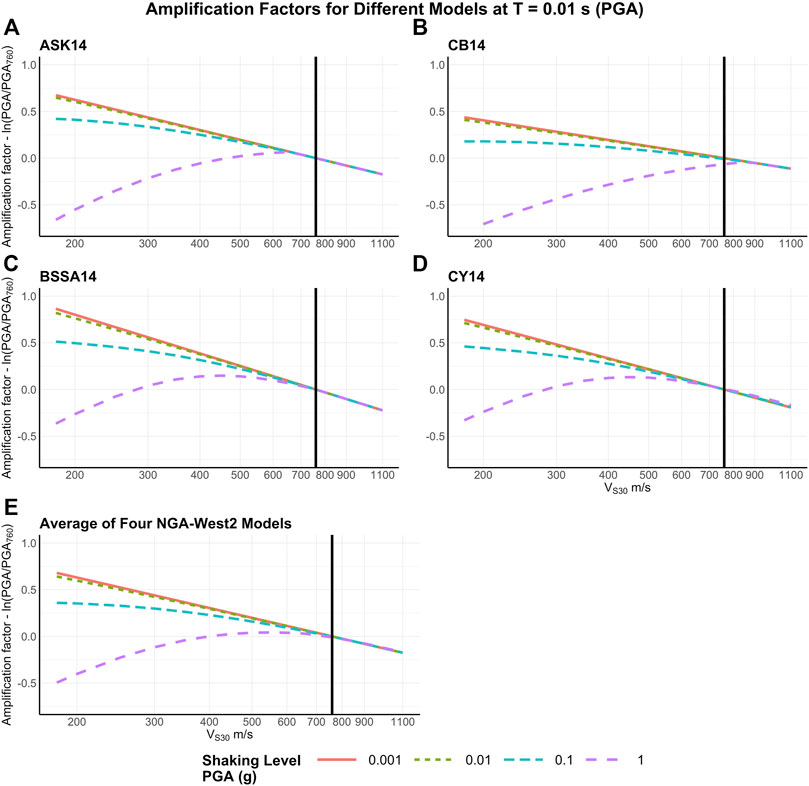
FIGURE 2. A) Linear amplification and nonlinear deamplification effects for PGA as a function of VS30 and shaking level, calculated using relations from (A) ASK14, (B) CB14, (C) BSSA14, (D) CY14, and (E) a model averaging the four models. The models have consistent trends but vary in the net amplification or deamplification. Amplification factors are given relative to shaking at a site with the reference VS30 = 760 m/s (vertical black line). An amplification factor of 0.0 indicates that the shaking with site effects is the same as that without site effects. Different lines indicate various shaking levels.
The three models requiring VS30 normalization (ASK14, CB14, and CY14) each contain a site response model. Scale factors can be applied to the spectral acceleration at the model’s reference VS30 (Vref) to obtain the relative amplification at VS30 = 760 m/s. These scale factor computations depend on the model.
For ASK14, when 760 > Vlin, the velocity specified by the aforementioned model whose linear behavior is observed, we simply calculate the scale factor for VS30 = 760 m/s from a Vref = 1,180 m/s to equal exp (c ln (1,180/760)) as defined in the GMM. The other two models have different reference velocities: Vref = 1,100 for CB14 m/s and 1,130 m/s for CY14. For a given spectral acceleration, SA, we compute f (SA, 760) and f (SA, Vref), where f (SA, VS30) is the site response term (in ln units) for each GMM. The scale factor to normalize each GMM to 760 m/s is thus exp (f (SA, Vref) - f (SA, 760), where f (SA, 760) is defined in the GMM.
After obtaining the scale factors to normalize each GMM to VS30 = 760 m/s, we calculate site amplifications or deamplifications to PGA relative to those for a site with the reference VS30 = 760 m/s using the four GMMs. Again, site amplification depends upon VS30, period, and shaking level (Figure 2). For ASK14 and CY14, we use coefficients given for PGA, which are equivalent to those for spectral acceleration at a period of T = 0.01 s. Thus, for consistency, we use coefficients given for T = 0.01 s for CB14 and BSSA. Because PGA is approximately equivalent to the spectral acceleration with a ground-motion period of 0.01 s (Booth, 2007), using this period for PGA gives consistency between models and with known relations between PGA and spectral acceleration.
Intuitively, site effects are expected to amplify the predicted shaking because most sites have VS30 lower than the reference velocity of 760 m/s, and low-impedance sediments are expected to amplify shaking relative to that on higher-impedance materials. However, this is not always the case due to nonlinear damping in soil at strong shaking levels. Nonlinearity in stress–strain relations was initially predicted from laboratory tests (see Beresnev et al., 1995) and was confirmed observationally as on-scale strong motion data became increasingly available (Beresnev et al., 1995; Field et al., 1997; Bonilla et al., 2005).
Figure 2 shows the combined effects of amplification and deamplification in terms of the predicted spectral acceleration relative to that for a site with the reference velocity VS30 = 760 m/s, for each of the four GMMs and their average. The values shown are relative to the predicted maximum shaking from the reference hazard map for very short period (T = 0.01 s) motion corresponding to PGA and several levels of shaking (PGA = 0.001, 0.01, 0.1, and 1 g).
Positive amplification values correspond to net amplification, and negative values correspond to net deamplification. For clarity, we refer to “amplification” and “deamplification,” although in the literature both are often jointly termed “amplification.” At sites with VS30 below 760 m/s, linear models predict amplification for all shaking levels due to the low-impedance effect. However, because current GMMs incorporate nonlinear effects, at sites with low velocities, the predicted linear amplification can be offset by nonlinear deamplification resulting from soil damping. Nonlinear deamplification increases as the shaking level increases. For very strong shaking, deamplification can overcome the linear amplification, yielding net deamplification.
The net predicted effect also depends on the response spectral period (T), as illustrated in Figures 3, 4 for the average model at four different spectral periods and shaking levels. The two figures present the results in complementary representations. Nonlinear effects are the strongest for spectral periods below 0.2 s (Yu et al., 1992), causing appreciable deamplification (Figures 3B, 4B). The nonlinear effect is much smaller for the long periods of ground-motion that affect tall buildings, as shown for 1-second-period spectral acceleration (Figures 3C, 4C). Even longer periods, such as T = 5 s, experience no nonlinear effects because the effect of increases on soil damping effects from these models is negligible at these periods (Figures 3D, 4D).
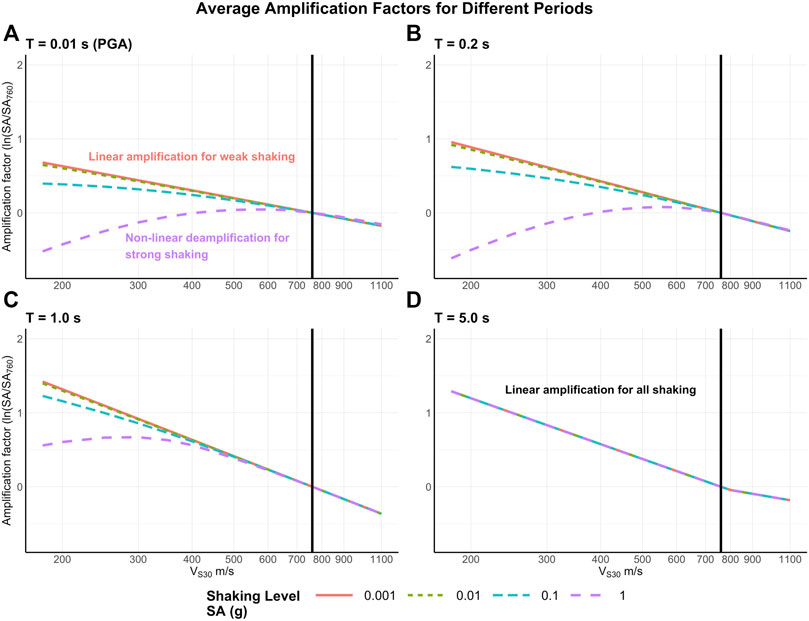
FIGURE 3. Site amplifications and deamplifications versus VS30 for different periods (A) T = 0.01 s (PGA), (B) T = 0.2 s, (C) T = 1.0 s and (D) T = 5.0 s and the average ground-motion model. Nonlinear effects decrease for longer-period shaking. The vertical black line corresponds to VS30 = 760 m/s. An amplification factor of 0.0 indicates that the shaking with site effects is the same as that without site effects. Different lines indicate various shaking levels. Periods of 1.0 s correspond roughly to a 10-story building. SA is spectral acceleration.
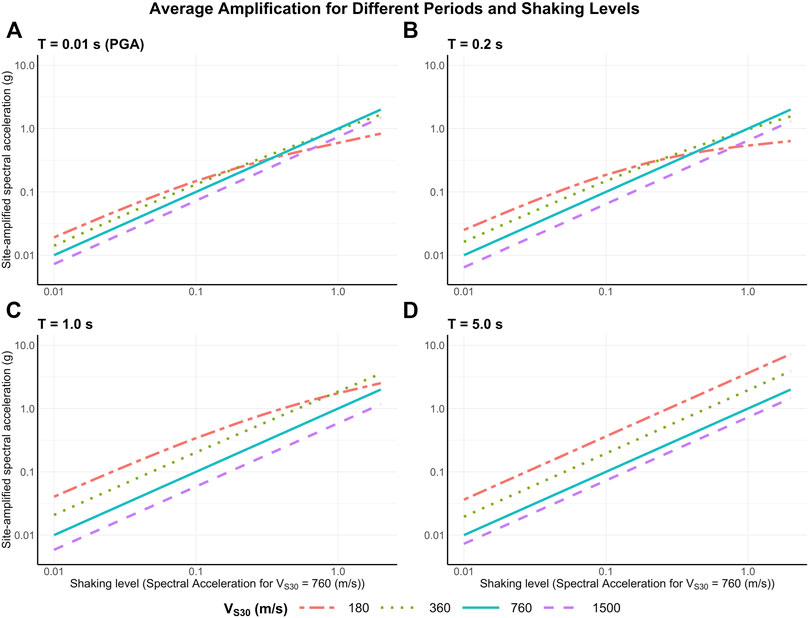
FIGURE 4. Amplification or deamplification effects versus shaking level, given as spectral acceleration for VS30 = 760 m/s, for various periods (A) T = 0.01 s (PGA), (B) T = 0.2 s, (C) T = 1.0 s and (D) T = 5.0 s. In (A), linear amplification arises for weak shaking and nonlinear deamplification for strong shaking. In (D), linear amplification arises for all shaking. For all periods, no amplification or deamplification occurs when VS30 = 760 m/s, as shown by the solid, 1-1 line. For VS30 > 760 m/s, deamplification is linear (purple dashed line). Linear amplification arises for VS30 < 760 with long-period shaking, for e.g., (D). Nonlinear deamplification arises for VS30 < 760 m/s, with strong, short-period shaking (e.g., A).
Nonlinear deamplification is the strongest for shorter periods and higher levels of shaking. Thus, deamplification is a major effect for very short-period (T = 0.01 s) ground-motion corresponding to PGA, especially for sites with low VS30 (< ∼ 300 m/s) that experience strong shaking(e.g., Figures 3A, 4A). For very strong shaking, deamplification due to increased damping can overcome the linear amplification due to softer soil, yielding net deamplification. Hence, although low levels of short-period shaking are amplified at sites with low VS30, as often noted (e.g., Hough et al., 1990), the higher levels of shaking that are reflected in hazard maps are deamplified (Figures 4A,B).
The fact is that for higher levels of short-period shaking (PGA, T = 0.01 s), nonlinear deamplification partly or totally offsets the linear amplification and reduces the net effect of soil conditions on hazard maps. Because most sites in California have VS30 below 760 m/s (Figure 1), these effects are important to consider for hazard maps.
Complete inclusion of site effects in hazard maps
Our approach incorporates site effects into the standard hazard maps. A complete inclusion of site effects would require implementing site-specific VS30 during the calculation of hazard curves that inform the maps. Doing so would affect both the median and variance of ground-motion, which both influence predictions; changes to the median shift the hazard curve, whereas changes to variance would affect the slope of the hazard curve. However, developing hazard maps involves extensive computations, so in practice it is often not justifiable to compute hazard maps for every site condition. Furthermore, nonlinear site effects on the variance are small for most site conditions. Thus, such approximate methods used here are commonly used (American Society of Civil Engineers, 2017). Current practice approximates site effects by scaling the median ground-motion using nonlinear scale factors and ignoring changes to variance (American Society of Civil Engineers, 2017).
Figure 5 shows the effect of different approaches. At typical site conditions of VS30 (∼400 m/s), the approximate approach is consistent with the complete inclusion of VS30 (Figure 5). For context, the median VS30 in California is approximately 500 m/s, so different approaches have little effect on the final hazard prediction (Figure 1, Figure 5). At low VS30 (∼200 m/s), the approximate approach follows the trend of the complete inclusion but with an even stronger effect due to the change in the variance. Because the effect is stronger, our approximate values reduce the discrepancy between the hazard map and historical shaking more than the complete inclusion of VS30. Because our analysis is prompted by the discrepancy, this article uses the approximation that is consistent with current practice.
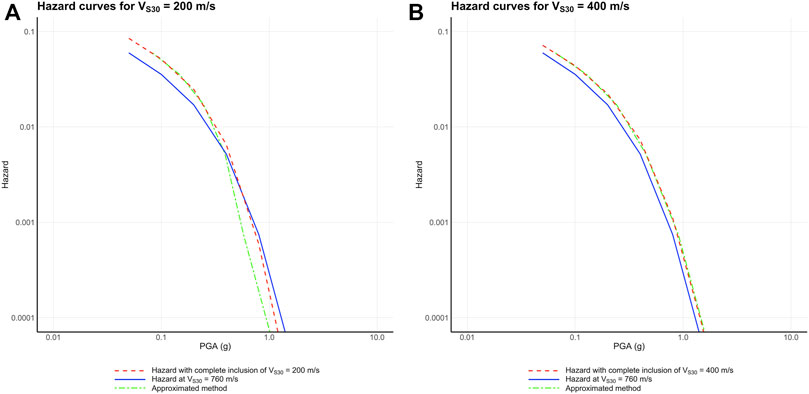
FIGURE 5. (A) Hazard curves for 760 m/s (blue lines) compared to those computed via the complete method for site-specific VS30 of 200 m/s (red dashed line) and approximate method (green dashed line). (B) Similar comparison for Vs30 = 400 m/s. At VS30 = 400 m/s, the approximate and complete methods are indistinguishable. At VS30 = 200 m/s, the approximate hazard curve has a larger effect than the complete method, which would further reduce the discrepancy between the map and the observed shaking.
Approximating site effects in hazard maps
We produced approximated site-specific hazard maps from the 2018 USGS reference PGA hazard maps by including the effect of site-specific VS30 (Figure 1) using the average of the four NGA-West2 models for T = 0.01 s (Figure 2E). The reference (constant VS30 = 760 m/s) maps are shown in Figures 6A,D. Site-specific VS30 hazard maps including amplification and deamplification are shown in Figures 6B,E. Although this method is an approximation for the full inclusion of site effects in the hazard map, it is consistent with standard practice in engineering purposes for the building design.
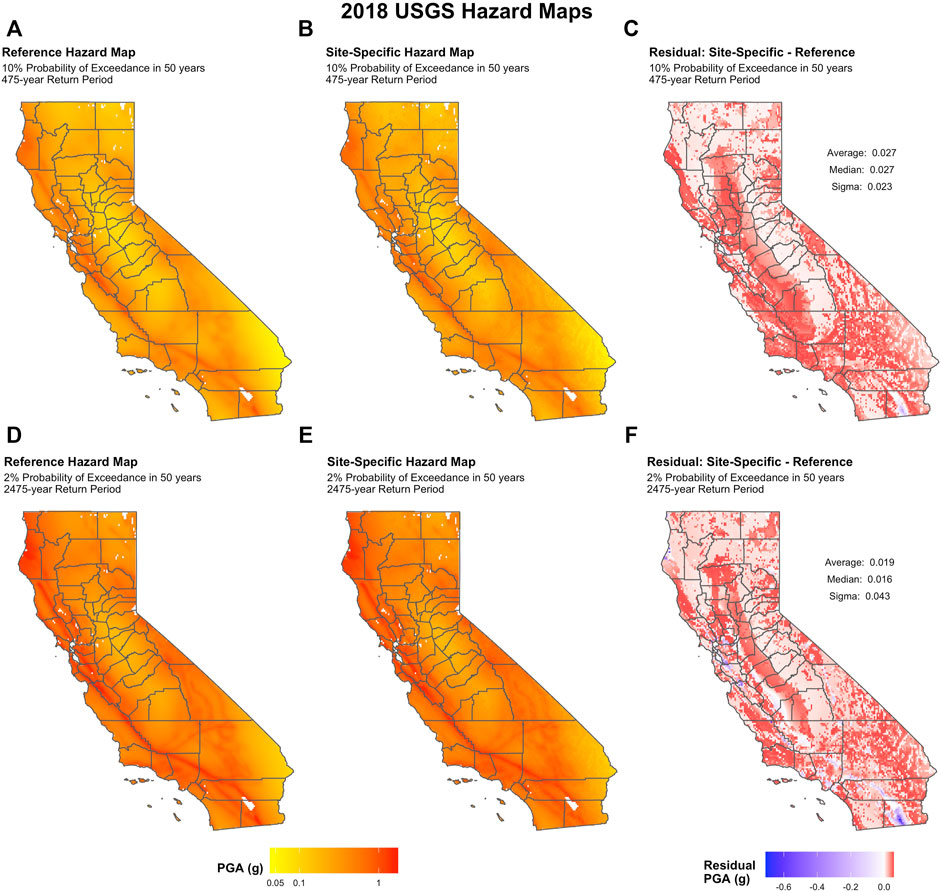
FIGURE 6. (A) 2018 USGS reference hazard map for PGA with constant VS30 = 760 m/s for a 10% probability of exceedance in 50 years (475-year return period). (B) Corresponding site-specific VS30 map and a residual map showing the differences (C). (D) 2018 USGS reference hazard map for a 2% probability of exceedance in 50 years compared to a site-specific map (E), with residuals (F). Most locations have a slight increase in predicted PGA.
Only minor differences arise when the PGA hazard maps are corrected for site-specific VS30 (Figures 6C,F). Most locations only see a slight increase in predicted PGA, with the average PGA increase being 0.027 and 0.019 g for the 475-year and 2475-year return-period maps (Figure 6). Although most sites have VS30 of less than 760 m/s, the change is small because the predicted linear amplification is largely offset by nonlinear deamplification at the strong shaking levels reflected in the maps.
Figure 7 shows net amplification/deamplification factors (Figure 3) for shaking with periods of T = 0.01 s, 0.2 s, 1.0 s, and 5.0 s. The nonlinear effects depend on the shaking level, so amplification/deamplification is shown for maps with two different return periods because maps with longer return periods predict higher shaking.
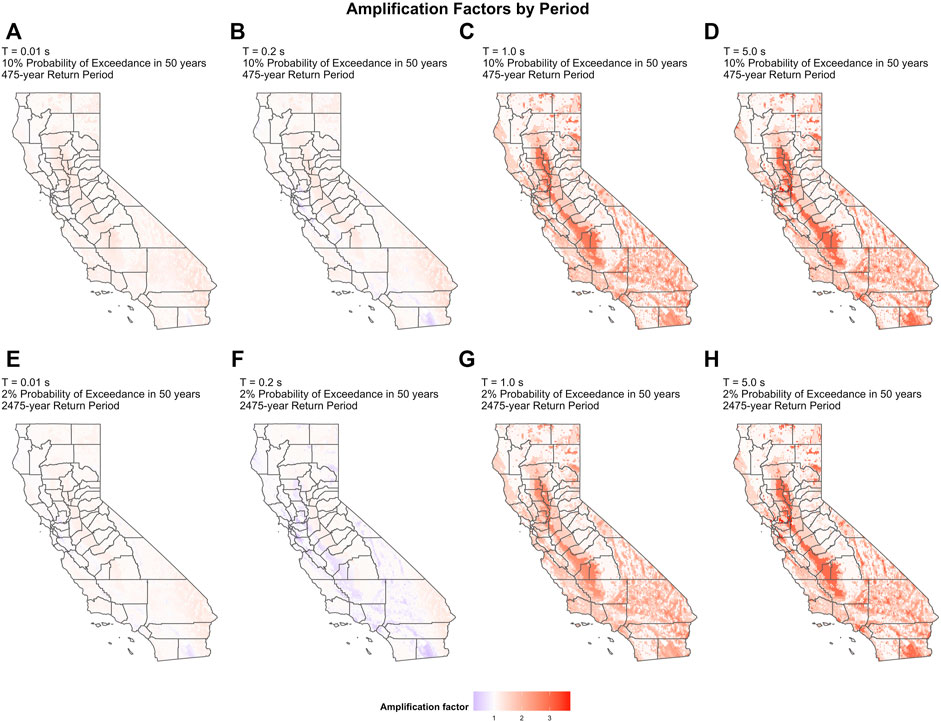
FIGURE 7. Amplification factors, as in Figure 3, relative to a reference VS30 = 760 m/s due to site-specific VS30 for two hazard maps with different return periods and shaking with periods of 0.01 s (A,E), 0.2 s (B,F), 1.0 s (C,G), and 5.0 s (D,H). Only slight amplifications arise in the PGA maps (A,E). Appreciable amplifications arise in longer-period maps (1.0 s and 5.0 s) because little to no nonlinear deamplification occurs. Only linear amplification occurs for 5.0 s period, making (D) and (H) identical. Nonlinear effects are the strongest for spectral periods below 0.2 s (Yu et al., 1992). An amplification factor of 1.0 indicates that shaking with site effects is the same as that without site effects.
Net amplification from site effects is considerably larger at longer ground-motion periods (T = 1.0 and 5.0 s) (Figure 7). At these periods, damping is less and thus the nonlinear effect causing deamplification is less (or none) (Figure 3). For T = 5.0 s, only linear amplifications (for VS30 < 760 m/s) and deamplifications (for VS30 > 760 m/s) relative to the reference map are predicted.
Comparison with historical intensity data
Site-specific hazard maps are important for many reasons. We now consider whether site-specific maps are more or less consistent with historically observed shaking intensities than reference maps. Seismologists have recently begun assessing how well PSHA models and maps forecast the shaking that actually occurs. The problem is challenging because of both limitations in the available data and conceptual issues in how to assess the performance of probabilistic forecasts (Gneiting and Katzfuss, 2014; Marzocchi and Jordan, 2014; Stein et al., 2015; Wang, 2015; Vanneste et al., 2018; Brooks et al., 2019).
In particular, shaking data recorded since a typical probabilistic seismic hazard model was made span a time period that is short compared to the return period of the hazard map (e.g., 475 or 2,745 years). Hence, typically few of the largest earthquakes that control hazard for a given area have occurred since the map was made. Retrospective assessment, or hindcasting, using compilations of historical shaking data spanning hundreds of years, provides one approach to address this problem (Stirling and Petersen, 2006; Stirling and Gerstenberger, 2010; Mak et al., 2014; Nekrasova et al., 2014; Stein et al., 2015; Brooks et al., 2016, 2017, 2018; Mak and Schorlemmer, 2016).
Recently, the California Historical Intensity Mapping Project (CHIMP) presented the first systematically compiled dataset of observed seismic intensities from the largest earthquakes in California over a 162-year period between 1857 and 2019 (Salditch et al., 2020) measured on the Modified Mercalli Intensity (MMI) scale (Wood and Neumann, 1931). Salditch et al. (2020) used CHIMP data for an initial assessment of the performance of the 2018 USGS time-independent seismic hazard models and maps for California (Rukstales and Petersen, 2019). This previous assessment used several simplifying assumptions. Among these, the mapped ground-motion values for a reference VS30 of 760 m/s were assumed to be comparable with observations from sites on different ground conditions. Based on these assumptions, reference maps with both a 10% probability of exceedance in 50 years (475-year return period) and a 2% probability of exceedance in 50 years (2475-year return period) overpredict shaking relative to the CHIMP data. Qualitatively, similar overestimations have been observed in comparisons of hazard maps with historical data for Italy and Japan (Stein et al., 2015; Brooks et al., 2016; Allen et al., 2021). Thus, this inconsistency between data and estimations arises in different regions for shaking datasets and hazard maps developed by different groups and using different approaches.
Our results imply that the apparent overestimations of the 2018 hazard maps cannot be explained by site effects because site effects as characterized by the modern GMMs do not appreciably change the PGA maps at these return periods. The predicted ground-motions, which are generally higher than observed, are amplified slightly at most sites, increasing the inconsistency.
We repeated Salditch et al.’s (2020) assessment using the CHIMP data and the site-specific hazard maps generated in this study. Stein et al. (2015) defined the fractional exceedance metric, M0 =| f-p |, where f and p are the observed and predicted fractions of site exceedances, respectively. Hazard map assessment is a relatively new enterprise, so no threshold is currently available for a “good” M0 metric (Salditch et al., 2020). A map for which the predicted fraction of site exceedances is greater than that observed (p > f, or f—p is negative) overpredicts the shaking from past earthquakes.
Figure 8 compares the CHIMP data to the reference and site-specific hazard maps. Both maps are converted from PGA to MMI via Worden et al.’s (2012) ground-motion intensity conversion equation. The 475- and 2475-year return-period reference maps predict 718 and 156 exceedances, respectively, in 162 years, far more than observed. The site-specific amplified hazard maps perform slightly worse (higher M0) than the reference maps because the higher predicted shaking yields fewer observed exceedances. In both cases, the fraction, f, of sites, where the largest shaking exceeds that predicted from the map is much lower than predicted. For the 475-year map, which predicts p = 0.289 (718 exceedances), f decreases from 0.06 (148 exceedances) to 0.044 (109 exceedances) when the map is adjusted for site-specific VS30. This represents a decrease of ∼26%, or 39 sites. Similarly, f for the 2475-year map, which predicts p = 0.063 (156 exceedances), decreases from 0.007 (18 exceedances) to 0.006 (15 exceedances), a decrease of ∼17%, or 3 sites. The longer return-period map likely sees a smaller percent decrease because the original fractional exceedance (f) is already so low. The M0 values for the reference maps were 0.229 and 0.056 for the 10% probability of exceedance in 50 years and the 2% probability of exceedance in 50 years map, respectively, lower than the values for the site-specific maps, 0.245 and 0.057.
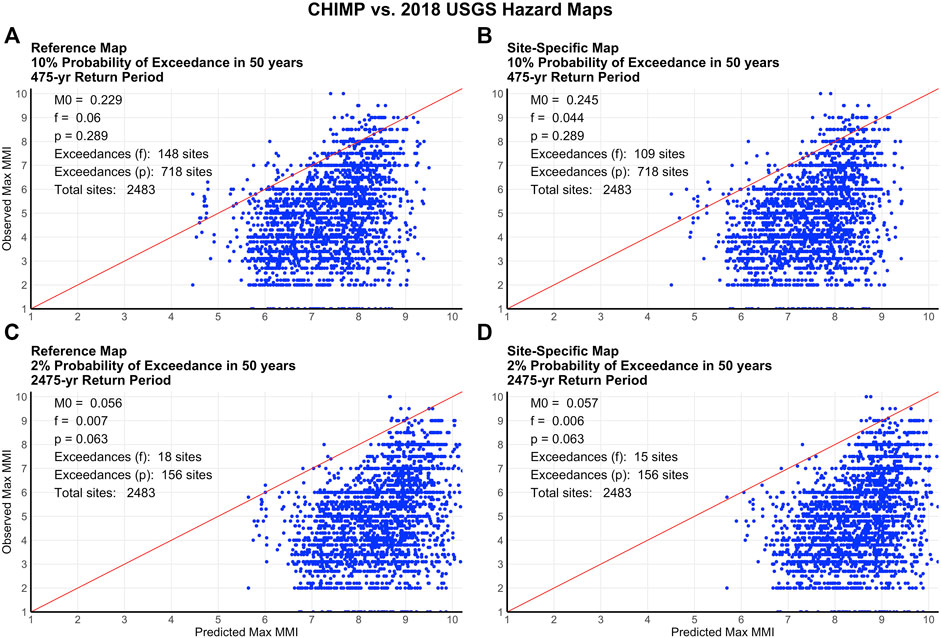
FIGURE 8. Predicted versus observed shaking for the 2018 reference USGS hazard map with a 10% probability of exceedance in 50 years (A) and a site-specific hazard map (B) and for the 2018 USGS hazard map with a 2% probability of exceedance in 50 years (C) and a site-specific hazard map (D). 1:1 line is shown in red.
We estimate that the uncertainty of the number of observed exceedances using a simple model that assumes the number of exceedances in 162 years is governed by a Poisson probability model:
where t is the length of the interval (162 years), τ is the average number of years between each exceedance (equal to 162/N, where N is the observed number of exceedances, equal to 109 for the 475-year and 15 for the 2475-year return-period site-specific maps). We compute 5 and 95% uncertainty ranges on N by finding N0.05 and N0.95 such that P (m ≤ N0.05)=0.05 and P (m ≤ N0.95)=0.95. Then, N0.05/2,483 and N0.95/2,483 are the lower and upper ranges of f, respectively, for the 2,483 total 10×10 km sites (Figure 8). The uncertainty intervals on f are [0.037, 0.051] and [0.004, 0.009] for the 475-year and 2475-year return-period maps, respectively. In both cases, the observed fractions of site exceedances, f, and their 5–95% uncertainty intervals are lower than the predicted fraction of site exceedances, p = 0.289 and 0.063 (corresponding to an expected 718 and 156 exceedances). Hence, the GMMs and corresponding maps still overpredict CHIMP data when site-specific VS30 is considered. Because f is lower when site conditions are considered, the amplified hazard maps have a slightly greater overestimation than the reference maps.
Although predicted nonlinearity reduces amplification and causes deamplification of hazard in some areas, the effect is not strong enough to improve the comparison between predicted and historically observed shaking. Because the CHIMP data overwhelmingly reflect short-period shaking—i.e., the effects on small structures (Sokolov and Chernov, 1998)—we cannot use them directly to assess the performance of hazard maps for longer-period shaking.
Conclusion
A long-held tenet is that site response, especially the amplification of shaking by soft near-surface sediments, contributes appreciably to seismic hazard (Borcherdt, 1970). Examples abound of damage associated with sediment-induced amplification, dating back to seminal work of Borcherdt (1970) and even earlier (Wood, 1908; Kanai and Yoshizawa, 1956; Gutenberg, 1957). Our results show, however, that modern GMMs including nonlinear deamplification predict that site effects do not strongly affect predicted hazard maps at high frequencies (Figure 5, Figure 6). We note here that, gross nonlinear site response, i.e., liquefaction, can pose a substantial additional hazard at sites underlain by sediments that are susceptible to liquefaction (Seed and Idriss, 1967). The GMMs show that site response has greater effects at longer periods due to the linear site amplification effects being larger and the nonlinear effects being small or absent.
When site effects are included in the GMMs that are used in the 2018 USGS hazard maps, predicted high-frequency PSHA levels are amplified very slightly at most sites, and even deamplified at some sites. More generally, incorporating site-specific VS30 does not appreciably change hazard maps for PGA because at the relevant short periods (0.01 s) and strong shaking, nonlinear deamplification due to increased soil damping largely offsets linear amplification due to low VS30. Our method is an approximation, but we note that, as discussed, the full inclusion of site effects would have an even smaller effect. Accordingly, we find that the apparent overpredictions of the 2018 USGS hazard maps relative to the CHIMP database of historically observed intensities are not explained by incorporating site response via VS30 into the maps. We expect our results to be generalizable to other regions with seismicity rates and a range of site conditions comparable to those in California. The overall effects of nonlinear deamplification are expected to be lower, however, in regions where seismicity is lower and hazard is controlled more by shaking from source zones at regional distances.
Data availability statement
The original contributions presented in the study are included in the article/Supplementary Material; further inquiries can be directed to the corresponding author. The CHIMP dataset is available as an electronic supplement to Salditch et al. (2020) and is accessible at https://github.com/salditch/CHIMP. The USGS hazard maps were downloaded from https://www.sciencebase.gov/catalog/item/5d559869e4b01d82ce8e3ff4, last accessed February 22, 2022.
Author contributions
All authors contributed to the concept and design. MG, LS, and TW participated in data collection. SS, NA, and SH assisted in analysis and interpretation. MG, SS, and SH prepared the manuscript, with contributions from all authors.
Funding
This work was partially supported by funding from the PG&E Geosciences Department’s Long-Term Seismic Program and the U.S. Geological Survey Contract Number G19AC00104. Portions of this work were also supported by Northwestern University’s Institute for Policy Research.
Acknowledgments
The authors would like to thank numerous reviewers who provided feedback for this article, including Mark Petersen, Gail Atkinson, Sarah Minson, Ryan Gold and Janet Carter. We also thank the editors for stewardship of the journal.
Conflict of interest
The authors declare that the research was conducted in the absence of any commercial or financial relationships that could be construed as a potential conflict of interest.
Publisher’s note
All claims expressed in this article are solely those of the authors and do not necessarily represent those of their affiliated organizations, or those of the publisher, the editors, and the reviewers. Any product that may be evaluated in this article, or claim that may be made by its manufacturer, is not guaranteed or endorsed by the publisher.
References
Abrahamson, N., Atkinson, G., Boore, D., Bozorgnia, Y., Campbell, K., Chiou, B., et al. (2008). Comparisons of the NGA ground-motion relations. Earthq. Spectra 24, 45–66. doi:10.1193/1.2924363
Abrahamson, N., Silva, W., and Kamai, R. (2014). Summary of the ASK14 ground-motion relation for active crustal regions. Earthq. Spectra 30, 1025–1055. doi:10.1193/070913EQS198M
Allen, T., Ghasemi, H., and Griffin, J. (2021). Exploring Australian hazard map exceedance using an atlas of historical shakemaps. Australian Earthquake Engineering Society.
American Society of Civil Engineers, (2017). Minimum design loads and associated criteria for buildings and other structures. Ch. 21 ASCE/SEI 7-16(PDF): 9780784479964. doi:10.1061/9780784414248
Beresnev, I. A., Wen, K.-L., and Yeh, Y. T. (1995). Nonlinear soil amplification: Its corroboration in taiwan. Bull. Seism. Soc. Am. 85, 496–515. doi:10.1785/BSSA0850020496
Bonilla, L. F., Archuleta, R. J., and Lavellée, D. (2005). Hysteretic and dilatant behavior of cohesionless soils and their effects on nonlinear site response: Field data observations and modeling. Bull. Seismol. Soc. Am. 95, 2373–2395. doi:10.1785/0120040128
Boore, D. M., Stewart, J. P., Seyhan, E., and Atkinson, G. M. (2014). NGA-West2 equations for predicting PGA, PGV, and 5% damped PSA for shallow crustal earthquakes. Earthq. Spectra 30, 1057–1085. doi:10.1193/070113EQS184M
Booth, E. (2007). The estimation of peak ground-motion parameters from spectral ordinates. J. Earthq. Eng. 11, 13–32. doi:10.1080/13632460601123156
Borcherdt, R. D. (1970). Effects of local geology on ground motion near San Francisco Bay. Bull. Seism. Soc. Am. 60, 29–61. doi:10.1785/BSSA0600010029
Borcherdt, R. D. (2014). Implications of next generation attenuation ground motion prediction equations for site coefficients used in earthquake resistant design. Earthq. Eng. Struct. Dyn. 43, 1343–1360. doi:10.1002/eqe.2400
Brooks, E. M., Neely, J., Stein, S., Spencer, B. D., and Salditch, L. (2019). Assessments of the performance of the 2017 one-year seismic hazard forecast for the Central and Eastern United States via simulated earthquake shaking data. Seismol. Res. Lett. 90, 1155–1167. doi:10.1785/0220190007
Brooks, E., Stein, S., and Spencer, B. D. (2016). Comparing the performance of Japan’s earthquake hazard maps to uniform and randomized maps. Seismol. Res. Lett. 87, 90–102. doi:10.1785/0220150100
Brooks, E., Stein, S., Spencer, B. D., Salditch, L., Petersen, M. D., and McNamara, D. E. (2018). Assessing earthquake hazard map performance for natural and induced seismicity in the central and eastern United States. Seismol. Res. Lett. 89, 118–126. doi:10.1785/0220170124
Brooks, E., Stein, S., and Spencer, B. (2017). Investigating the effects of smoothing on the performance of earthquake hazard maps. Int. J. Earthq. Impact Eng. 2, 121–134. doi:10.1504/IJEIE.2017.089039
Building Seismic Safety Council (Bssc) (2020). 2020 edition, NEHRP recommended seismic provisions for new buildings and other structures, FEMA-P-2080-1, Part 1 (provisions): Developed for the. Washington, D.C: Federal Emergency Management Agency.
Campbell, K. W., and Borzorgnia, Y. (2014). NGA-West2 ground motion model for the average horizontal components of PGA, PGV and 5% damped linear acceleration response spectra. Earthq. Spectra 30, 1087–1115. doi:10.1193/062913EQS175M
Chiou, B. S. J., and Youngs, R. R. (2014). Update of the Chiou and Youngs NGA model for the average horizontal component of peak ground motion and response spectra. Earthq. Spectra 30, 1117–1153. doi:10.1193/072813EQS219M
Cornell, A. (1968). Engineering seismic risk analysis. Bull. Seismol. Soc. Am. 58, 1583–1606. doi:10.1785/BSSA0580051583
Field, E. H., Johnson, P. A., Beresnev, I. A., and Zeng, Y. (1997). Nonlinear ground motion amplification by sediments during the 1994 Northridge earthquake. Nature 390, 599–602. doi:10.1038/37586
Gneiting, T., and Katzfuss, M. (2014). Probabilistic forecasting. Annu. Rev. Stat. Appl. 1, 125–151. doi:10.1146/annurev-statistics-062713-085831
Gregor, N., Abrahamson, N. A., Atkinson, G. M., Boore, D. M., Bozorgnia, Y., Campbell, K. W., et al. (2014). Comparison of NGA-WEST2 GMPEs. Earthq. Spectra 30, 1179–1197. doi:10.1193/070113EQS186M
Gutenberg, B. (1957). Effects of ground on earthquake motion. Bull. Seismol. Soc. Am. 47, 221–250. doi:10.1785/BSSA0470030221
Hough, S. E., Friberg, P. A., Busby, R., Field, E. F., Jacob, K. H., and Borcherdt, R. D. (1990). Sediment-induced amplification and the collapse of the nimitz freeway. Nature 344, 853–855. doi:10.1038/344853a0
Kanai, K., and Yoshizawa, S. (1956). Relation between the amplitude of earthquake motions and the nature of surface layer. Bull. Earthq. Res. Inst. 34, 168–184.
Mak, S., Clements, R. A., and Schorlemmer, D. (2014). The statistical power of testing probabilistic seismic-hazard assessments. Seismol. Res. Lett. 85, 781–783. doi:10.1785/0220140012
Mak, S., and Schorlemmer, D. (2016). A comparison between the forecast by the United States national seismic hazard maps with recent ground‐motion records. Bull. Seismol. Soc. Am. 106, 1817–1831. doi:10.1785/0120150323
Marzocchi, W., and Jordan, T. H. (2014). Testing for ontological errors in probabilistic forecasting models of natural systems. Proc. Natl. Acad. Sci. U. S. A. 111, 11973–11978. doi:10.1073/pnas.1410183111
Nekrasova, A., Kossobokov, V., Peresanand, A., and Magrin, A. (2014). The comparison of the NDSHA, PSHA seismic hazard maps and real seismicity for the Italian territory. Nat. Hazards (Dordr). 70, 629–641. doi:10.1007/s11069-013-0832-6
Olsen, K. B. (2000). Site amplification in the Los Angeles Basin from three-dimensional modeling of ground motion. Bull. Seismol. Soc. Am. 90, S77–S94. doi:10.1785/0120000506
Petersen, M. D., Shumway, A. M., Powers, P. M., Mueller, C. S., Moschetti, M. P., Frankel, A. D., et al. (2020). The 2018 update of the US national seismic hazard model: Overview of model and implications. Earthq. Spectra 36, 5–41. doi:10.1177/8755293019878199
Rukstales, K. S., and Petersen, M. D. (2019). Data release for 2018 update of the U.S. National seismic hazard model. U.S. Geological Survey release [dataset. doi:10.5066/P9WT5OVB
Salditch, L., Gallahue, M. M., Lucas, M. C., Neely, J. S., Hough, S. E., and Stein, S. (2020). California historical intensity mapping Project (CHIMP): A consistently reinterpreted dataset of seismic intensities for the past 162 yr and implications for seismic hazard maps. Seismol. Res. Lett. 91, 2631–2650. doi:10.1785/0220200065
Seed, H. B., and Idriss, I. M. (1967). Analysis of soil liquefaction: Niigata earthquake. J. Soil Mech. Found. Div. 93, 83–108. doi:10.1061/jsfeaq.0000981
Seyhan, E., and Stewart, J. P. (2012). Site response in NEHRP provisions and NGA models. Geotechnical Eng. State Art Pract. 1, 1–21. Available at: https://escholarship.org/uc/item/0r59p7bk.
Sokolov, V. Y., and Chernov, Y. K. (1998). On the correlation of seismic intensity with Fourier amplitude spectra. Earthq. Spectra 14, 679–694. doi:10.1193/1.1586022
Stein, S., Spencer, B. D., and Brooks, E. M. (2015). Metrics for assessing earthquake hazard map performance. Bull. Seismol. Soc. Am. 105, 2160–2173. doi:10.1785/0120140164
Stirling, M., and Gerstenberger, M. (2010). Ground motion-based testing of seismic hazard models in New Zealand. Bull. Seismol. Soc. Am. 100, 1407–1414. doi:10.1785/0120090336
Stirling, M. W., and Petersen, M. (2006). Comparison of the historical record of earthquake hazard with seismic-hazard models for New Zealand and the continental United States. Bull. Seismol. Soc. Am. 96, 1978–1994. doi:10.1785/0120050176
U.S. Geological Survey (2021). Documentation & help.” earthquake hazards Program: Unified hazard tool. Available at: https://earthquake.usgs.gov/hazards/interactive/documentation.php (Accessed: July 8, 2021).
Vanneste, K., Stein, S., Camelbeeck, T., and Vleminckx, B. (2018). Insights into earthquake hazard map performance from shaking history simulations. Sci. Rep. 8, 1855. doi:10.1038/s41598-018-20214-6
Wang, Z. (2015). Predicting or forecasting earthquakes and the resulting ground motion hazards: A dilemma for Earth scientists. Seismol. Res. Lett. 86, 1–5. doi:10.1785/0220140211
Wills, C. J., Gutierrez, C. I., Perez, F. G., and Branum, D. M. (2015). A next GenerationVS30Map for California based on geology and topography. Bull. Seismol. Soc. Am. 105, 3083–3091. doi:10.1785/0120150105
Wood, H. O. (1908). “Distribution of apparent intensity in san Francisco,” in The California earthquake of april 18, 1906 (Washington D.C.: Carnegie), 220–227.
Wood, H. O., and Neumann, F. (1931). Modified Mercalli intensity scale of 1931. Bull. Seismol. Soc. Am. 21, 277–283. doi:10.1785/BSSA0210040277
Worden, C. B., Gerstenberger, M. C., Rhoades, D. A., and Wald, D. J. (2012). Probabilistic relationships between ground-motion parameters and modified Mercalli intensity in California. Bull. Seismol. Soc. Am. 102, 204–221. doi:10.1785/0120110156
Keywords: site effects, Vs30, probabilistic seismic hazard maps, linear and nonlinear effects, ground-motion
Citation: Gallahue MM, Salditch L, Lucas MC, Neely J, Stein S, Abrahamson N, Williams T and Hough SE (2022) A study on the effect of site response on California seismic hazard map assessment. Front. Earth Sci. 10:931340. doi: 10.3389/feart.2022.931340
Received: 28 April 2022; Accepted: 23 August 2022;
Published: 26 September 2022.
Edited by:
Stefano Parolai, Istituto Nazionale di Oceanografia e di Geofisica Sperimentale, ItalyReviewed by:
Valerio Poggi, Istituto Nazionale di Oceanografia e di Geofisica Sperimentale, ItalyJawad Fayaz, University College London, United Kingdom
Copyright © 2022 Gallahue, Salditch, Lucas, Neely, Stein, Abrahamson, Williams and Hough. This is an open-access article distributed under the terms of the Creative Commons Attribution License (CC BY). The use, distribution or reproduction in other forums is permitted, provided the original author(s) and the copyright owner(s) are credited and that the original publication in this journal is cited, in accordance with accepted academic practice. No use, distribution or reproduction is permitted which does not comply with these terms.
*Correspondence: Molly M. Gallahue, bW9sbHlAZWFydGgubm9ydGh3ZXN0ZXJuLmVkdQ==