 Yue Cui
 Xizhe Li1,2,3*
95% of researchers rate our articles as excellent or good
Learn more about the work of our research integrity team to safeguard the quality of each article we publish.
Find out more
ORIGINAL RESEARCH article
Front. Earth Sci. , 27 June 2022
Sec. Economic Geology
Volume 10 - 2022 | https://doi.org/10.3389/feart.2022.931012
Wells with low gas content and low resistivity in the Changning area, southern Sichuan Basin were selected for this study. The burial-thermal history was reconstructed and the characteristics of multi-phase fluid activity were clarified using microscopic observation and testing of fluid inclusions in the Longmaxi shale fracture veins. Compared with wells with a high gas content and high resistivity, the influence of fluid activity on resistivity was analyzed. The results showed that the thermal evolution of the bituminous inclusions trapped in the veins has reached the stage of carbonaceous-metamorphic bitumen, and the organic matter is fully cracked for gas generation, with some organic matter exhibiting the phenomenon of “graphitization.” The synchronous fluid with bitumen was existed due to shallow burial with a middle-low maturity stage of about 280 and 292 Ma. Two phases of fluids existed in the deep burial stage, thus maturing for about 103 Ma, and the uplift stage at about 28 and 32 Ma, with high homogenization temperatures (Th) (varying from 185 to 195°C and 165–180°C). The corresponding pressure coefficients varied between 1.67 and 2.09, 1.56 and 1.92 in a moderate-strong high-pressure state. The last two phases of fluid formation in the late uplift stage for about 4 to 19 Ma and 6 to 10 Ma were characterized by low salinity at medium-low Th (varied from 140 to 155°C and 120–135°C), with pressures of 57.47–74.50 MPa and 51.44–59.41 MPa (pressure coefficients of 1.09–1.41 and 1.18–1.37), in an atmospheric-weak overpressure state. In the initial uplift stage after deep burial, the fluid closure in the Changning area was good. In contrast, the wells are filled with low gas content because of the strong tectonic forces causing the shale gas to be released and the multi-phase fluid activity that happens during the late uplift stage. New evidence indicates that the emergence of low resistance in the localized Changning area is not only related to the high degree of evolution of organic matter but is also affected by the multi-phase fluid modification in the late uplift stage.
The southern Sichuan Basin in China is a typical demonstration area with remarkable achievements in marine shale gas exploration and development. Shale gas is mainly enriched in the Upper Ordovician (Wufeng formation)—Lower Silurian (Longmaxi formation) shales (Ma and Xie, 2018; Yang et al., 2019; Gou et al., 2021; Han et al., 2022). Nevertheless, with relatively similar initial sedimentary conditions, exploration wells with low or even no gas content have emerged in some high gas content areas (Bachrach, 2011; Wang et al., 2014; Yang et al., 2015; Xu et al., 2020a; Xu et al., 2020b; Jia et al., 2021). The organic shale sections in the failed exploration wells often exhibit extremely low resistivity logging, with logging resistivities below 10 Ωm, and some even below 1 Ωm. In most studies related to shale gas, attention has been given to this special phenomenon (Hou et al., 2021).
Since the time of deposition, marine shales in the Changning area, southern Sichuan Basin have generally undergone the modifications of deep burial, diagenesis, and hydrocarbon generation. However, multi-stage and complex tectonic processes have led to different degrees of fluid activities and tectonic deformation among different tectonic units, resulting in significant differences in shale gas preservation conditions and huge differences in shale gas shows or production of exploration and development wells (Zhu et al., 2018; Nie et al., 2020), with low-producing wells often accompanied by low resistivity characteristics. Several studies have been conducted about high clay content, very mature organic matter, high pyrite content, high water salinity, poor physical properties in the reservoir and excellent geological conditions which cause abnormally low resistance in the reservoir (Sun et al., 2018; Hou et al., 2021). However, the influencing factors vary in different regions and reservoirs. Most researchers believe that the “carbonization” of organic matter is the main cause of the phenomenon of low resistivity in the Changning region (Wang et al., 2014; Wang et al., 2018; Hou et al., 2021), but some researchers still hold different views and believe that the mosaic of rock particles in close contact with each other is the main cause (Gao et al., 2016). The above studies are mostly based on the properties of the reservoir rock itself. Low resistivity as a parameter for characterizing shale gas content needs to be further researched from the perspective of the relationship between the changes in shale gas content caused by fluid activities in the reservoir as well as low resistivity. As the carrier of original information regarding geological fluids, fluid inclusion (FI) has become an important means of studying paleo-fluid activities (Chen et al., 2002; Liu et al., 2010; Xu et al., 2020c; Wang et al., 2020).
To clarify the influence of fluid activity on gas bearing property and resistivity, wells with extremely low gas content and resistivity in the Changning area were selected for this study. By using microscopic observation, homogenization temperature (Th) measurement of fluid inclusion assemblages (FIAs), and Raman spectroscopy testing, this study focuses on analyzing the tectonic evolution characteristics of low-producing wells, defines the multi-phases fluid properties and activities, and compares and analyzes the fluid activity characteristics of previously studied wells with high gas content and resistivity.
Sichuan Basin is located in Southwest China, east of the Qinghai Tibet Plateau. It belongs to the first-class tectonic-sedimentary basin in the northwest of the Upper Yangtze platform. The Longmenshan fold orogenic belt is situated in its northwest direction; in the north, there is Micangshan-Dabashan fold orogenic belt; the Qiyueshan fold belt is in the southeast and the Daloushan-Daliangshan fold belt is in the south, creating an overall rhombic NE trend. The Changning area is located on the low and steep deformation belt of the southern margin of Sichuan Basin and the Daloushan-Daliangshan fold belt (Figure 1A). Bounded by the Changning anticline, the northern part belongs to the low and gentle fold belt of southern Sichuan Basin, and the Daloushan-Daliangshan fold belt is in the south (He et al., 2019). The study area has mainly existed east-west, northwest and northeast structures, including Xuyong, Jianwu, Luochang, and Shuanglongchang synclines and the Changning anticline. The folded shape is relatively wide and gentle (Figure 1B).
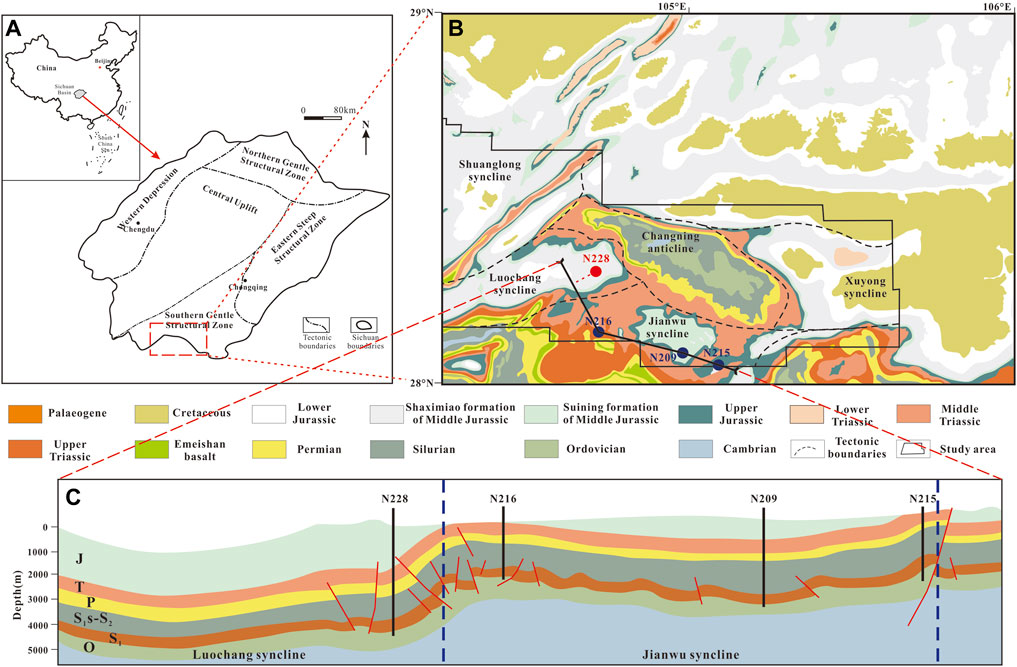
FIGURE 1. (A) Location of Sichuan Basin in China and the Changning area of Sichuan Basin; (B) sub-tectonic units and the surface geological map of the Changning area, in which the wells N228, N209, N215, and N216 are located; (C) geological section of Luochang and Jianwu synclines. J, T, P, S1s-S2, S1, and O are the Jurassic, Triassic, Permian, and other formations of Silurian except for Longmaxi Formation, Longmaxi Formation of early Silurian, and Ordovician strata.
The study area was subjected to tectonic transformation in many stages and different directions during its geological history (Huang et al., 2018; Liu et al., 2021). The early Caledonian movement led to the extension of the Craton Basin in southern China, the development of large tensile faults in the basement, and the extensional tectonic stress in the Changning area. The strong Dongwu uplift caused the Qianzhong paleouplift to transport from south to north, and the whole Changning area was in the uplift stage. After entering the Indosinian tectonic period, the Changning area received stable sedimentation. The paleouplift ceased with the north-south tectonic form being laid down. During the Yanshanian and Himalayan periods, the Changning area was compressed by the Dabashan in the east to north-south, and the structure was deformed into an east-west structure in the south of the Changning area, finally evolving into the present-day fault-fold belt (Feng et al., 2022). The multi-stage structural superposition causes the reverse faults that existed in the Changning area, and their scale is mainly small-medium faults, most of which disappear within the Silurian strata (Figure 1C).
The surface of the study area is covered by sedimentary rocks, except for the Permian Emeishan basalt, which is outcropped sporadically in the southwest. The overall stratigraphic sequence is normal, lacking the Carboniferous and Devonian layers, and the exposed strata on the surface have existed from the Cambrian to Paleogene periods. The Silurian is denuded in the core of the Changning anticline, and the Cambrian strata are exposed (Figure 1B).
The buried depth of the Longmaxi formation in the Changning area is mainly between 1,500 and 4,000 m. The burial depth is generally less than 3,500 m in the high part of the Changning structure and the south flank, and gradually increases to the north and west. The Longmaxi formation received marine fine-grained sedimentation and existed members 1 and 2 from bottom to top. Among them, sub-member 1 of member 1 mainly existed in deep-water shelf facies organic matter rich shale, with a high organic carbon content (>3%). The degree of thermal evolution is in the stage of high and over maturity, experiencing complex thermal evolution processes such as oil generation, oil cracking gas, and kerogen cracking gas (Ma and Xie, 2018).
When considering the differences in resistivity and gas production of different exploration wells in the Changning area, well N228 located in the Luochang syncline with extremely low resistivity and almost no gas production was selected for the research. This selection was based on the collection and summary of the fracture veins of the shales studied by previous researchers (Gong, 2019; Liang et al., 2021). Five core samples from five veins of the Longmaxi shales at depths ranging from 3,456.3 to 3,479.4 m were tested (Figure 2). The Luochang syncline where well N228 occurs is in the Changning deep depressional area, and the buried depth of the Longmaxi shales in this area is more than 3,500 m. Wells N209, N215, and N216 which were studied by previous researchers are in the Jianwu syncline, in the shallow depression of the Changning region. The buried depth of Longmaxi shales is between 2,000 and 3,500 m. The bottom depth of the Longmaxi formation of well N228 is 3,480 m whereas the bottom depths of the Longmaxi formation of wells N209, N215, and N216 in Jianwu syncline are 3,170, 2,950, and 2,600 m, respectively.
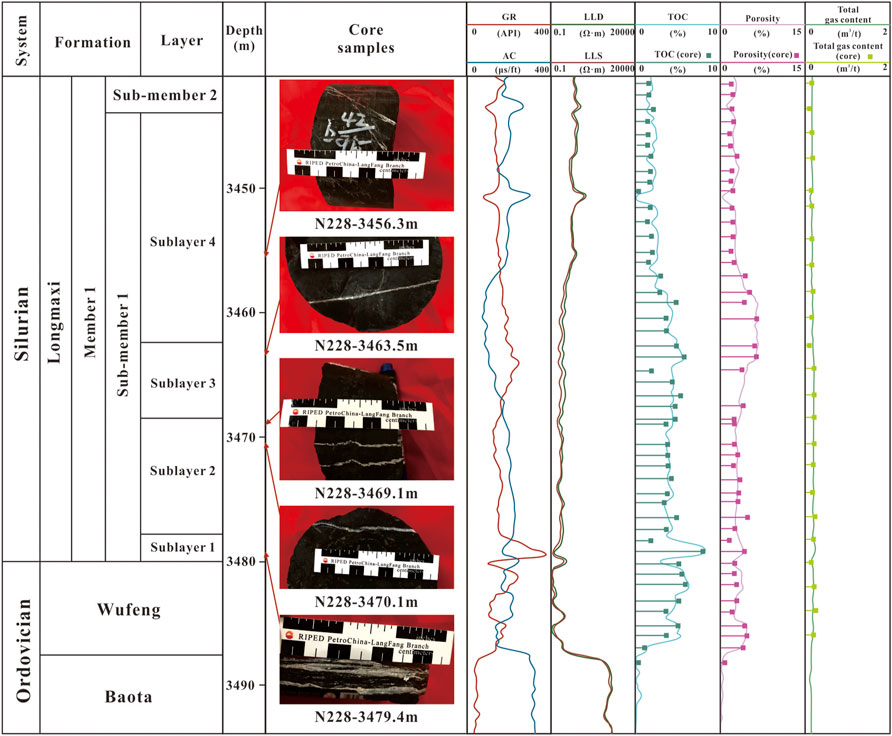
FIGURE 2. Stratigraphic columnar diagram of well N228 in the Changning area, southern Sichuan Basin, with samples positions, resistivity logs, TOC distribution, porosity, and total gas content distribution.
Fluid inclusion analysis was performed after the thin sections of the shale fracture vein sample were doubly polished. The characteristics, types, and occurrence minerals with different generations of fluid inclusions were observed by transmission polarized light microscopy, cathode luminescence microscopy, fluorescence microscopy, and Raman spectral. All experiments were conducted in the Experimental Research Center, School of Geosciences, Yangtze University, Wuhan, China.
The experimental equipment used for transmission polarization and fluorescence is a Nikon Eclipse 80i dual-channel fluorescence-transmission light microscope with a UV excitation wavelength of 330–380 nm. The equipment used for cathode luminescence is the CL8200 MK5 cathode luminometer. Under the conditions of 14–15 kV and 300–350 mA, it emits light onto the thin-section to determine the formation period of the veins. Hydrocarbon inclusions usually emit different colors of fluorescence under UV excitation. The organic molecular structure in the inclusions controls the color and intensity of fluorescence, reflecting the characteristics of the mixture (Barres et al., 1987; Pradier et al., 1990; Permanyer et al., 2002; Li et al., 2004). For the gas inclusions in these samples, a LabRAM HR800 laser Raman spectrometer with a YAG solid-state laser at a wavelength of 532 nm was used for non-destructive characterization of individual inclusions larger than 1 μm to verify the gas-phase components. A different period of aqueous inclusions was selected to determine the Th, and the measured minimum Th of FIA was used to approximate the formation temperature at the time when oil and gas inclusions were trapped. Based on the homogeneous method and the freezing method, the Th and the ice melting temperatures (Tm) were determined by using the Linkam THMSG600 microscope cold-heat table, and the error of the temperature measurement results was controlled to about ± 0.1°C. The Th of methane inclusions can be determined by rapidly cooling the inclusions to the phase change point using liquid nitrogen, continuing cooling the inclusions to observe bubble changes, and then increasing the temperature to reach a homogeneous phase of the methane inclusions and recording the Th.
The Longmaxi shales are mostly buried at depths greater than 3,500 m in the Luochang syncline, located in the deep depressional area of the Changning area, whereas the Jianwu syncline is in the shallow depression of the Changning area where the Longmaxi shales are buried at depths between 2,000 and 3,500 m. The Longmaxi shales of well N228 are black and grayish-black with foliation formation. Many natural fractures can be observed in the core, some of which are filled with calcite, mainly in a high-angle attitude and some in a horizontal attitude. The horizontal vein is wider than the high angle vein, with the width of the high angle vein being approximately 0.2 cm, and that of the horizontal vein being approximately 1 cm. High-angle calcite veins mostly appear in groups, and some can develop in conjugate X-type formations (Figure 2).
For macroscopic observation, the shale veins were sliced and microscopic petrographic observation was conducted to clarify the mineral composition, symbiotic relationship, formation phase, and other information. It is evident from the results that the calcite in the direct contact part between the edge of the vein and the surrounding rock is irregular and the cleavage is not obvious. According to the crystal size, it is considered to be fine crystal calcite (Figure 3C). The calcite crystals become larger toward the formation direction inside the vein, which is coarse crystal calcite, and the surrounding rock fragments are a mixture of calcites (Figure 3A). The cleavage inside the crystal is obvious and more than 1–2 groups have existed. The edges of some coarse crystal calcites are rough and existed in a zigzag shape. In addition, calcite veinlets connected with the main vein have existed in some surrounding rocks (Figure 3C).
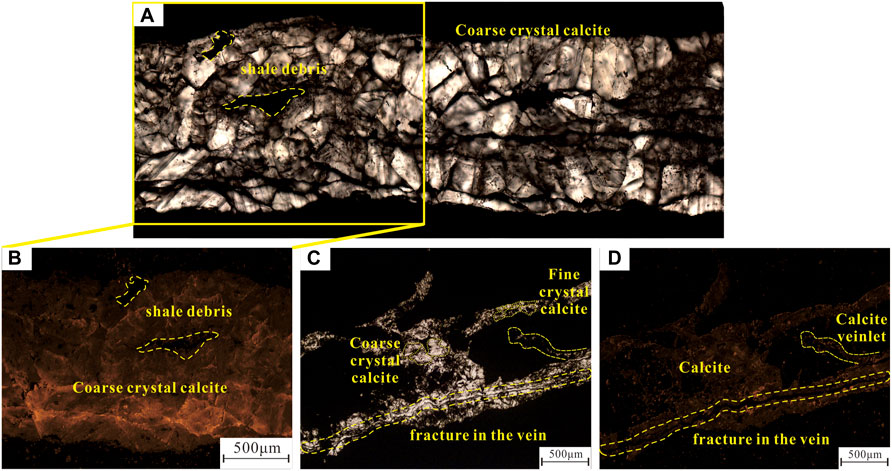
FIGURE 3. Micrograph of calcite veins under (A) and (C) transmission light and (B) and (D) cathodoluminescence. (A) Coarse crystal calcite existed in veins of sample N228-3463.5 m, with shale debris mixed between calcites; (B) Calcites formed at different phases of fluid evolution of sample N228-3463.5 m; (C) Fine crystal calcite in the direct contact part between the edge of the vein and the surrounding rock, and coarse crystal calcite toward the formation direction inside the vein of sample N228-3456.3 m, which fracture existed in, and calcite veinlets connected with the main vein existed in some surrounding rocks; (D) Calcite vein with dark-colored cathodoluminescence of sample N228-3456.3 m.
For ascertaining the different phases of calcite, cathodoluminescence detection of different veins was conducted since it would be affected by Fe2+ and Mn2+ in the fluid (Pierson, 1981; Ten-Have and Heijnen, 1985). Some calcite veins emit overall dark cathodoluminescence, and the cathodoluminescence of sample N228-3463.5 m is enhanced from the surrounding rock to the interior of the vein (Figures 3A,B). Comparing the cathodoluminescence of different calcite crystals from different samples, it was found that some coarse crystal calcites with brightly colored cathodoluminescence may have high Fe2+ and Mn2+ content (Huang, 1992; Huang et al., 2008). Different cathodoluminescence indicates that the fluid composition changed during the crystal growth. Additionally, combined with the observation results of cathodoluminescence and transmitted light, it was found that coke bitumen existed simultaneously at the edge of the crystal, while fracture formation was visible inside the vein (Figures 3C,D).
Fluid inclusions can be divided into primary, secondary, and pseudo-secondary inclusions according to their genesis. They can also be divided into gas, liquid, solid and multiphase inclusions according to the phase state, and can be divided into aqueous, hydrocarbon, CO2 inclusions, etc., (Liu, 2005). In this study, the fluid inclusions are existed in euhedral and semi-euhedral calcite crystals. Hydrocarbon inclusions are mainly methane inclusions in a single gas phase, methane-bearing bituminous inclusions in solid-gas phases, and bituminous inclusions in a single solid phase (Figure 4). The symbiotic relationship between them and aqueous inclusions can be classified into the following six types.
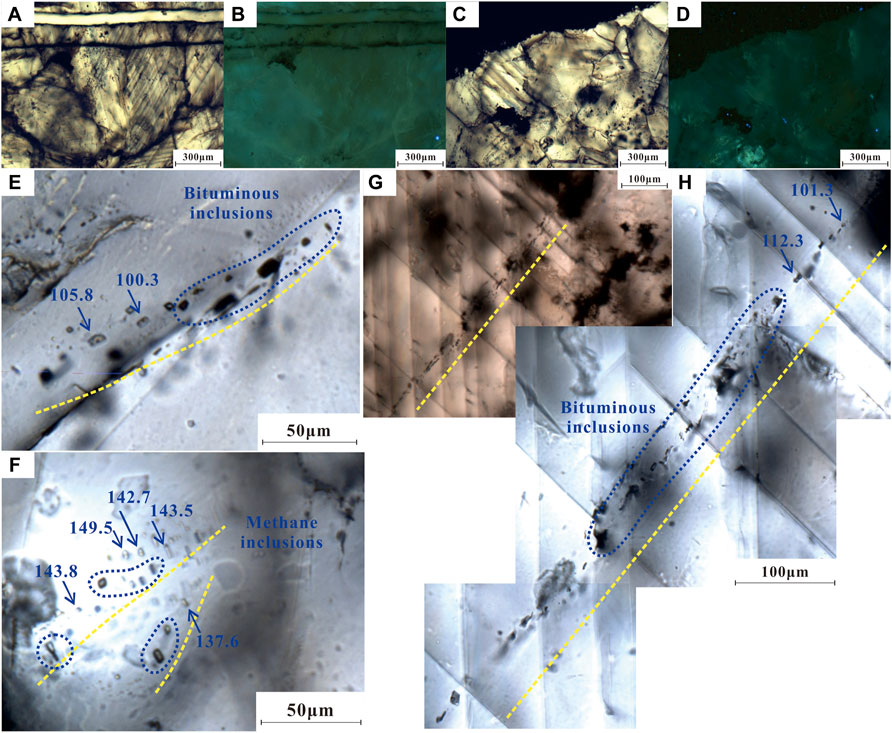
FIGURE 4. (A) and (B) Micrographs under the transmitted light and fluorescence of sample N228-3479.4 m, methane inclusions do not fluoresce; (C) and (D) micrographs under the transmitted light and fluorescence of sample N228-3470.1 m, bituminous inclusions do not fluoresce; (E) black secondary bituminous inclusions in sample N228-3469.1 m, and Th of the gas–liquid two-phase aqueous inclusions symbiotic with bituminous inclusions varies from 100.3 to 105.8°C; (F) bright in the middle and surrounded by light gray secondary methane inclusions in sample N228-3456.3 m, and Th of the gas–liquid two-phase aqueous inclusions symbiotic with methane inclusions vary from 137.6 to 149.5°C; (G) and (H) secondary FIA at different magnification in sample N228-3470.1 m with Th ranges from 101.3 to 112.3°C.
The first type is gas–liquid two-phase aqueous inclusions, which are linear, clustered, densely distributed, or existed separately, with a quadrilateral or elliptical morphology and a long axis of 3–20 μm. The gas–liquid ratio is of two kinds, one is larger, between 15% and −30%, and the other is smaller, between 5% and −10%. The second is linear methane inclusions clustered, densely distributed, or existing separately, with a quadrilateral, elliptical or irregular shape and a long axis between 3 and −30 μm. The methane inclusions with high-density characteristics are uniformly translucent-transparent under the transmitted light, bright in the middle and surrounded by light gray, while other methane inclusions are less transparent and gray in transmitted light (Liu et al., 2009). Not all methane inclusions are fluorescent (Figures 4A,B). The third is the symbiosis of gas–liquid two-phase aqueous inclusions and methane inclusions. This combination is referred to as a group of FIA in micro-temperature measurement, in which the methane inclusions are densely existed in lines or clusters, with a regular shape (quadrilateral or elliptical), and the long axis being between 3 and −15 μm. The fourth is bituminous inclusions, whose size and distribution characteristics are like those of the second type, which are gray-black or black under transmitted light, opaque and non-fluorescent (Figures 4C,D). The fifth is the symbiosis of gas–liquid two-phase aqueous inclusions and bituminous inclusions, which is called a group of FIA in micro-temperature measurement. The size and distribution characteristics of these are like those of the third type (Figures 4E,G,H). The sixth is methane-bearing bituminous inclusions. The bitumen is attached to the sidewalls of the inclusions with methane in the center. Under transmitted light, the inclusions have one or more black lines on the sidewalls and are brighter in the middle, but remain gray-black and non-fluorescent, with similar size and distribution characteristics to the second type of methane inclusions.
Raman spectroscopy allows qualitative analysis of the composition of inclusions as well as the host mineral composition (Figure 5). The Raman scattering peak shifts of methane inclusions measured in this experiment have a wide range of displacement, between 2,909.07 cm−1 and 2,915.49 cm−1 (Figure 5B). Since the Raman scattering peak of pure methane inclusion is closely related to the internal pressure, the methane Raman scattering peak deviates to 2,910.00 cm−1 which indicates supercritical high-density inclusion, and that deviates to 2,918.00 cm−1 which usually indicates low-pressure gas-phase methane (Lu et al., 2007), with generally less than 2,912.00 cm−1 being supercritical state high-density methane inclusions (Liu et al., 2009).
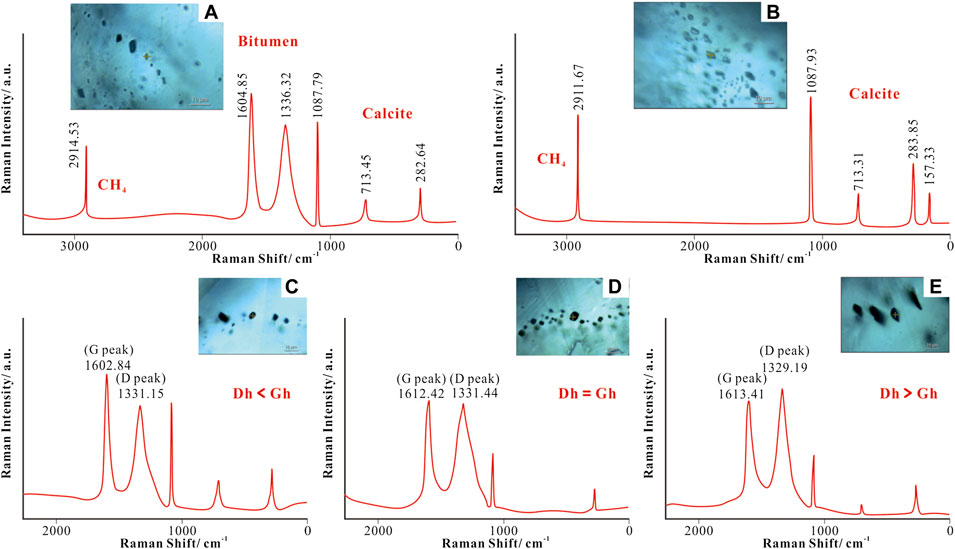
FIGURE 5. Raman spectrum of FI. (A) Methane-bearing bituminous inclusions existed in calcite, and the inclusions have one or more black lines on the sidewalls and are brighter in the middle (sample N228-3470.1 m). (B) Methane inclusions existed in calcite, with bright in the middle and surrounded by light gray (sample N228-3479.4 m). (C) Carbonaceous bituminous inclusions with Dh < Gh. (D) Carbonaceous-metamorphic bituminous inclusions with Dh = Gh. (E) Metamorphic bituminous inclusions with Dh > Gh.
Meanwhile, the methane Raman scattering peak of methane-bearing bituminous inclusions are like those of pure methane inclusions, ranging from 2,907.05 cm−1 to 2,917.14 cm−1. It also shows a pair of bitumen Raman characteristic peaks, with Raman shifts near 1,355 cm−1 (D-peak) and 1,580 cm−1 (G-peak) (Figure 5A).
The Raman spectrum of the bituminous inclusions trapped in well N228 shows a pair of strong carbonaceous bitumen Raman characteristic peaks, with Raman shifts near 1,355 cm−1 (D-peak) and 1,580 cm−1 (G-peak). According to the variation pattern of D-peak and G-peak heights in the thermal evolution of bitumen obtained by Liu et al. (2013), the bituminous inclusions in the study area can be divided into three types.
The D peak height (Dh) of the first type of inclusions is significantly lower than the G-peak height (Gh), and the shape of the G-peak is relatively obvious, which is the stage of carbonaceous bitumen (Figure 5C); The Dh of the second type of inclusion is like the Gh, which is the stage of carbonaceous-metamorphic bitumen (Figure 5D); the Dh of the third type of inclusion is significantly higher than the Gh, and the shape of the D-peak is relatively obvious, and this is the stage of metamorphic bitumen (Figure 5E).
Meanwhile, the Raman spectrum can reflect the atomic and molecular vibration information in the structure of aromatic carbon rings of organic matter, that is, the spectral peak parameters of the Raman spectrum of organic matter have a good response relationship with the changes in the chemical structure of organic matter during thermal evolution, and thus characterize the maturity (Kelemen and Fang, 2001; Zhou et al., 2014). Vitrinite reflectance of kerogen is the most intuitive parameter to characterize the maturity of organic matter (Hunt, 1996), which is not contained in the highly mature hydrocarbon source rocks of the Lower Paleozoic, and therefore cannot be used to evaluate the maturity of its hydrocarbon source rocks. However, solid bitumen is the residue left after oil cracking, and the peak spacing between G- and D-peaks has been proven to be the most reliable maturity index (Kelemen and Fang, 2001; Liu et al., 2013; Zhou et al., 2014). Therefore, the bitumen reflectance can be converted into vitrinite reflectance to evaluate the maturity of Lower Paleozoic hydrocarbon source rocks. Use the following formula to calculate the same (Liu et al., 2013):
where RmcRo% is the reflectivity calculated by Raman analysis parameters, %; d (G-D) is the peak spacing of Raman shift. According to Formula 1, we calculated the equivalent vitrinite reflectance of shale bitumen as well as bituminous inclusions in the Longmaxi Formation in the Changning area, which ranges from 2.73% to 3.91%.
In contrast, the peak spacing is no longer considered to change at the over-mature stage observed in previous studies, which is only suitable for the calculation of high-over mature bituminous inclusions. In contrast, the peak height is suitable for the calculation of the maturity of solid organic matter from the over-mature to the pre-graphite stage. Therefore, Liu et al. (2013) proposed a new formula:
where RmcRo% is the reflectivity calculated by Raman analysis parameters, %; h (Dh/Gh) is the peak height ratio (Dh is the D-peak height and Gh is the G-peak height). According to Formula 2, the maturity ranges from 3.54% to 4.05%. The results calculated by the two methods are similar, indicating that the maturity of organic matter in the study area is extremely high and reaches the stage of carbonaceous-metamorphic bitumen.
Single-phase methane inclusions or bituminous inclusions are commonly found around the gas–liquid two-phase aqueous inclusions in the vein, indicating that these types of inclusions were formed in an immiscible two-phase system with saturated hydrocarbons. The Th and salinity of the gas–liquid two-phase aqueous inclusions represent the capture temperature and salinity of hydrocarbon inclusions. Therefore, the gas–liquid two-phase aqueous inclusions symbiotic with hydrocarbon inclusions FIA were selected for micro-temperature measurement in this study. The measured Th and salinity are shown in Figures 6, 7 and Table 1.
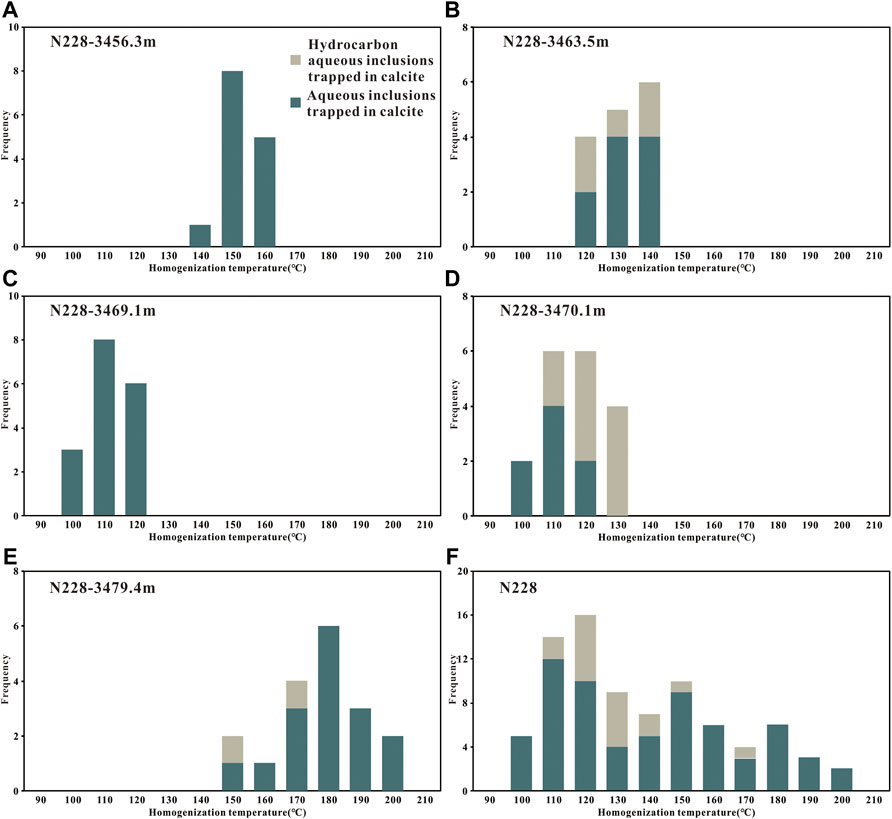
FIGURE 6. Th histogram of well N228 in the Changning area, southern Sichuan Basin. (A), (B), (C), (D), (E), and (F) Th histograms of samples N228-3456.3 m, N228-3463.5 m, N228-3469.1 m, N228-3470.1 m, N228-3479.4 m, and summary of all samples.
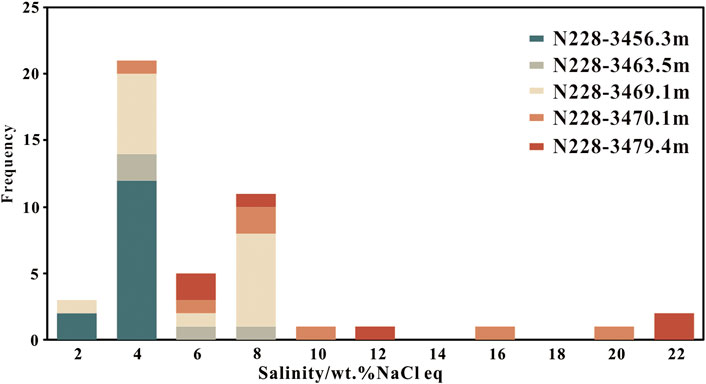
FIGURE 7. Salinity histogram of well N228 in the Changning area, southern Sichuan Basin.
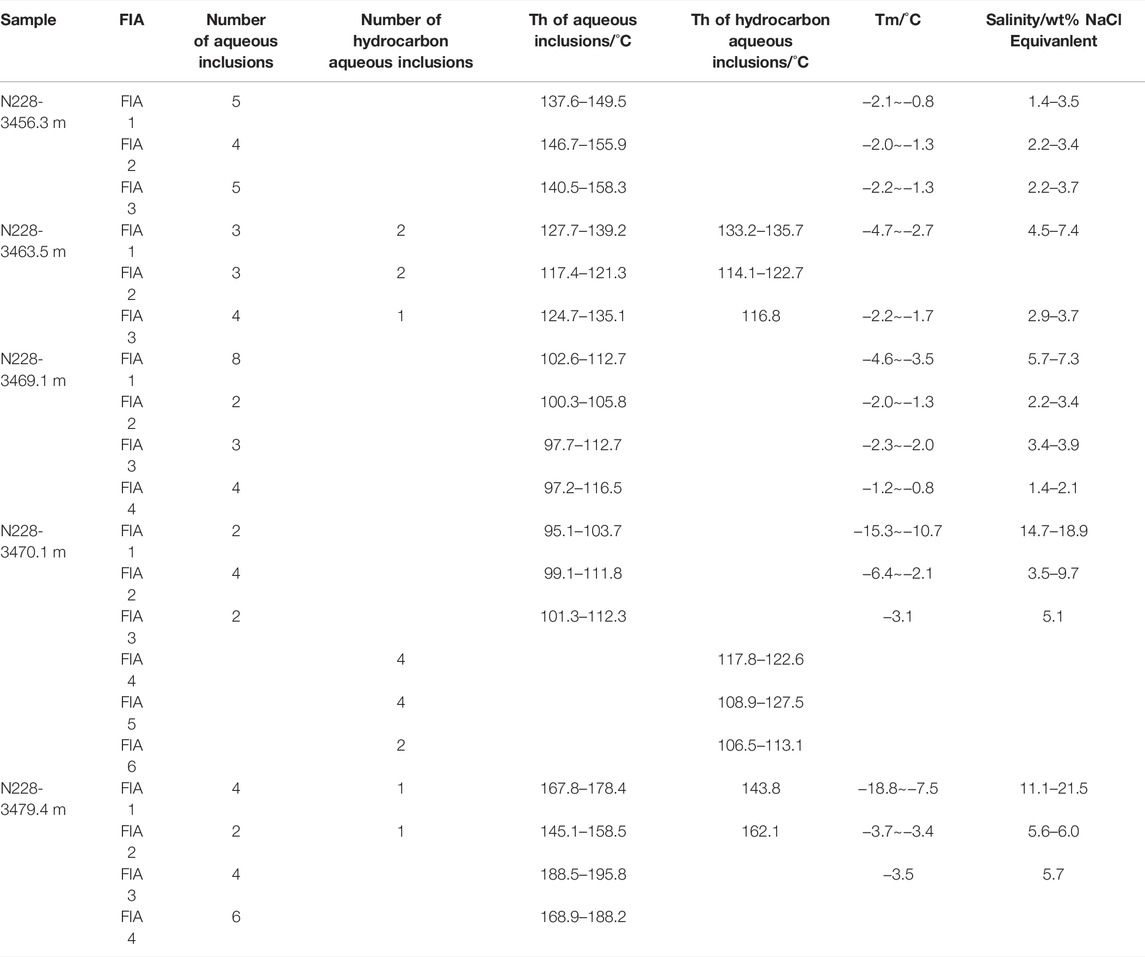
TABLE 1. Measured Th, Tm, and calculated salinity of aqueous and hydrocarbon aqueous inclusions symbiotic with bituminous and methane inclusions of all samples in well N228 of the Changning area.
The Th of the aqueous inclusions in samples N228-3456.3 m, N228-3463.5 m, N228-3469.1 m, N228-3470.1 m, and N228-3479.4 m ranges from 137.6 to 158.3°C, 116.8 to 139.2°C, 97.2 to 116.5°C, 95.1 to 112.3°C, and 145.1 to 195.8°C, respectively. Combining the microscopic observation and temperature measurement results, it is concluded that the Th aqueous inclusions, which are symbiotic with the bituminous inclusions, are between 95.1 and 116.5°C, and t methane inclusions can be seen between 116.8 and 195.8°C. The Th of 195.8°C proves that the Longmaxi shales have experienced deep burial. Based on the results, it is found that the Th of aqueous inclusions in horizontal calcite veins is greater than that of high angle calcite veins, indicating the difference between the formation time of veins and the ground temperature at the time of formation.
Since some of the inclusions may be metastable, not all aqueous inclusions can be converted to salinity by measuring the Tm (salinity calculation based on Bodnar, 1993). Therefore, the salinity of the aqueous inclusions in samples N228-3456.3 m, N228-3463.5 m, N228-3469.1 m, N228-3470.1 m, and N228-3479.4 m ranges from 1.4 to 3.7 wt% NaCl equivalent, 2.9 to 7.4 wt% NaCl equivalent, 1.4 to 7.3 wt% NaCl equivalent, 3.1 to 18.9 wt% NaCl equivalent, and 5.6 to 21.5 wt% NaCl equivalent, respectively. A salinity greater than 5 wt% NaCl equivalent is considered a highly saline fluid. The salinity of some aqueous inclusions measured in the experiment is high, which indicates that the shale is a good sealant. In contrast, the low salinity may be affected by the external fluid, that is, atmospheric fresh water.
Methane inclusion is an isovolumetric system and its thermodynamic change occurs under the isovolumetric condition; hence, the phase transition point (Th) of methane inclusion can be used to determine its density (Liu and Shen, 1999; Liu, 2005).
In the process of micro-temperature measurement of methane inclusions, according to the micro-temperature measurement method of methane-rich inclusions proposed by previous studies (Kerkhof, 1990; Kerkhof and Thiéry, 2001), the slightly larger and easily observable methane inclusion was selected under the microscope and rapidly frozen using liquid nitrogen. The lowest temperature that can be achieved in the test is −196°C, and the three-phase point temperature of methane is −182.5°C. Theoretically, the appearance of the methane solid phase should be observed during the measurement of the pure methane inclusions, but this phenomenon is difficult to observe owing to the metastable state of the system (Liu, 2005).
Therefore, during the micro-temperature measurement of methane inclusions, the low-temperature phase transition process of methane inclusions was observed. Liquid nitrogen was used to rapidly freeze the methane inclusion, and when frozen to approximately −100°C, a small bubble pops out from the single-phase methane inclusion. There is no other phenomenon in the methane inclusion except that the bubble volume becomes larger when cooling is continued to −190°C, which is still a gas–liquid two-phase methane inclusion. The bubbles gradually decrease until they disappear and finally homogenize into the liquid phase when the temperature is slowly increased (Figure 8).
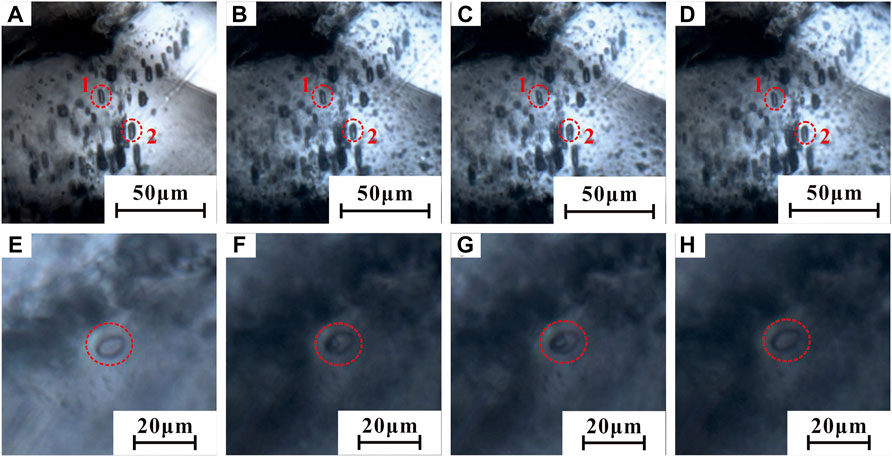
FIGURE 8. Low temperature phase transformation of methane inclusions of sample N228-3479.4 m. (A–D) Micrographs of methane inclusions at 20°C, −104.5°C, 180.9°C, and −93.7°C, and the Th of number 1 methane inclusion is −94.6°C, while that of number 2 is −93.7°C; (E–H) Micrographs of methane inclusions at 20°C, −116.6°C, 176.5°C, and −92.1°C, and the Th of methane inclusion is −92.1°C.
Therefore, the Th measurement results of the methane inclusions in this study varied from −93.9 to −92.1°C (Figure 8). From the low-temperature phase transformation process of methane inclusions, most methane inclusions in calcite veins in the Changning area appear to be pure methane inclusions, and the Th of this kind of inclusion is close to that of a pure methane system (−82.6°C) (Andersen and Burke, 1996).
The density of methane inclusions can be determined by methane inclusions Th (Liu and Shen, 1999):
where ρ is the density of methane inclusions, g/cm3; Th is the homogenization temperature of methane inclusions, °C. The results calculated by Formula 3 show that the methane inclusions density in Longmaxi shales fracture calcite veins in well N228 varied from 0.275 to 0.285 g/cm3, with an average of 0.281 g/cm3 (Figure 9; Table 2).
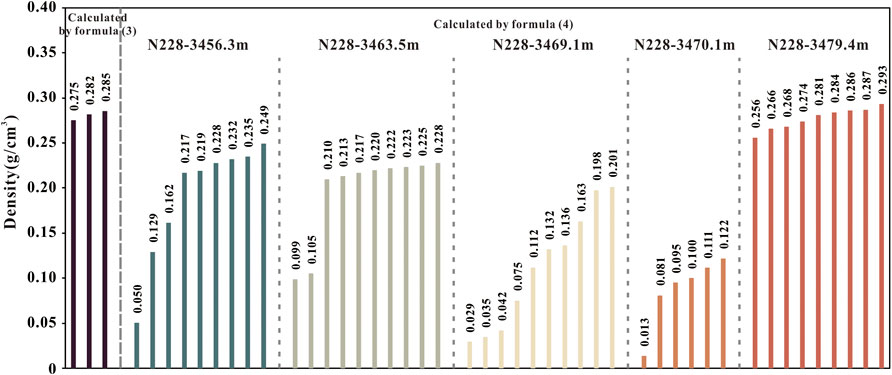
FIGURE 9. Density distribution calculated by low-temperature method and Raman spectroscopy method.
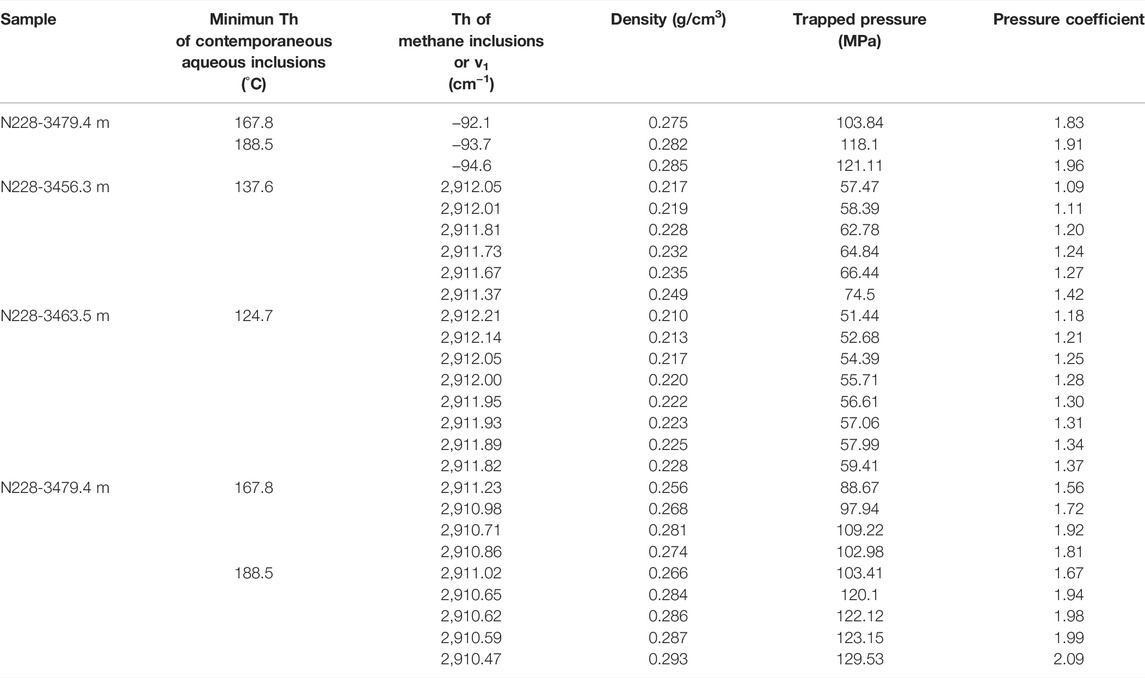
TABLE 2. Density calculated by low-temperature method and Raman spectroscopy method, measured minimum Th of FIAs, corresponding pressure, and pressure coefficient of methane inclusions in samples N228-345.3 m, N228-3463.5 m, and N228-3479.4 m.
As discussed above, the reliable acquisition of the traditional calculation of methane inclusion density data requires the selection of methane inclusions with regular morphology and long axis lengths greater than 6 μm for Th testing. Moreover, there are too many test steps that take a long time, and do not apply to all methane inclusions. Therefore, previous studies used the Raman scattering peak v1 of methane inclusions to calculate the density (Seitz et al., 1996; Lin et al., 2007; Lu et al., 2007; Hansen and Berg, 2009). Lu et al. (2007) fitted a good linear relationship between the v1 shift of methane Raman scattering peak and methane density, which is suitable for the density calculation of methane inclusions with methane content of 90%–100%, and the correlation coefficient is 0.9987:
where ρ is the density of methane inclusions, g/cm3; D = v1 − v0, v1 is the measured methane Raman scattering peak of methane inclusions, and v0 is the methane Raman scattering peak of methane inclusions when the pressure is close to 0. The value of v0 varies in different laboratories because of different calibration methods. In this study, the value of v0 is calibrated by the Raman Laboratory in the Key Laboratory of the School of Geosciences, Yangtze University. Based on Formula 3, the density of methane inclusions varies greatly and can be divided into low-pressure gas-phase methane inclusions and supercritical high-density methane inclusions, taking the density of 0.162 g/cm3 as the boundary. The density of low-pressure gas-phase methane inclusions ranges from 0.050 to 0.162 g/cm3, and that of supercritical high-density methane inclusions ranges from 0.210 to 0.293 g/cm3, with an average of 0.245 g/cm3; whereas the density of methane-bearing bituminous inclusions ranges from 0.013 to 0.201 g/cm3 (Figure 9; Table 2). The density of methane inclusions trapped in sample N228-3479.4 m calculated by this method is similar to that obtained by the micro-temperature measurement of methane inclusions.
The trapped temperature and pressure of fluid inclusions record the paleo-temperature and paleo-pressure of the formation (Chen et al., 2002). The calculation of the trapped pressure is based on the equation of state applicable for the supercritical methane system established by Duan et al. (1992):
where
The calculation of this formula requires the supercritical high-density methane inclusions. Therefore, the trapped pressure of well N228 calculated using Formula 5 ranges from 51.44 to 129.53 MPa (Table 2). The Th of FIAs trapped in well N209 studied by previous researchers is divided into two stages, ranging from 127.7 to 143.5°C and 159.2–171.2°C, with the corresponding pressures being 36–39 MPa and 45–47 MPa, respectively. The Th of FIAs trapped in well N215 studied by previous researchers range from 169.8 to 196.0°C, with corresponding pressure of 71.78 and 96.31 MPa. And that of well N216 ranges from 169.8 to 190.2°C, with corresponding pressure of 74.16 and 81.50 MPa (Gong, 2019; Liang et al., 2021). Since the high Th of FIA trapped in well N228 and concentrated at 188.5–195.8°C, and the high Th of FIAs trapped in wells N215 and N216 and concentrated at 170–190°C, it is considered that the formation depth of shale fracture calcite veins is considerable in the Changning area, southern Sichuan Basin. Referring to previous studies on the measurement of the highest paleotemperature and the recovery of stratum denudation thickness before Yanshanian uplift by rock thermoacoustic emission (Zhang et al., 2014; Gao et al., 2017), it is roughly calculated that the pressure coefficient at the maximum buried depth of Longmaxi shale in the Changning area before or at the initial stage of the Yanshanian uplift was between 1.51 and 1.88, and the shale was in a medium-strong overpressure state.
BasinMod basin simulation software was employed to restore the burial-thermal evolution history of Longmaxi shales in the deep depressional area of the Changning area, and to study the fluid evolution history of key drilling wells in combination with the results of fluid inclusions tests. For the burial history simulation of well N228, the data of drilling stratification and depth, the content of sandstone, mudstone and limestone of each layer, geothermal gradient, rock thermal conductivity, the measured TOC value of Wufeng-Longmaxi formation, kerogen type and hydrocarbon generation potential coefficient were mainly based on the actual data of the oilfield. The paleo-denudation amounts of Caledonian, Hercynian, and Indosinian were set as 200, 150 and 200 m, respectively (Zhu et al., 2009; Yuan et al., 2013; Huang et al., 2019). The amount of uplift and denudation in the late Mesozoic and Cenozoic was based on the apatite fission-track results of previous studies (Zhu et al., 2010; Liang et al., 2021), and the collected vitrinite reflectance was taken as a constraint.
The burial history of the Changning shale gas field represented by well N228 reveals that the sedimentary process of the Wufeng-Longmaxi formation in the region has the sedimentary evolution characteristics of a typical multicycle craton basin (Liu et al., 2020; Qiu et al., 2020) (Figure 10). After the initial deposition of the Longmaxi formation, it entered the rapid burial stage, with a burial depth of 1,800 m. Subsequent Garidonian tectonic movement in the middle-late Silurian led to the overall uplift and denudation of the strata, and the sedimentation and subsidence rate decreased rapidly. The strata re-entered the sedimentary subsidence stage after the Permian, while the Dongwu movement in the middle-Late Permian of Hercynian caused a brief uplift of the strata, and then it re-entered the sedimentary subsidence stage, which had the maximum stratum subsidence rate. Affected by the Indosinian movement in the middle-Late Triassic, the strata were briefly uplifted again. Later, the strata of the middle Triassic were denuded to different degrees at this stage. From the Late Triassic to Late Cretaceous, the Longmaxi formation continued to subside, with a maximum buried depth of about 6,600 m. At the end of the Late Cretaceous, the strata deposited from the Middle Jurassic to the Late Cretaceous were completely denuded by the influence of Himalayan tectonics. Some strata of the early Jurassic are currently exposed, and the bottom of the Longmaxi formation of well N228 is buried at a depth of 3480 m.

FIGURE 10. Burial-thermal evolution history of Longmaxi shales of well N228 in the deep depressional area of the Changning area.
The formation and evolution of the Emeishan mantle plume in the Late Permian led to a high heat flow (i.e., 60–80 mW m−2) in local areas of the Sichuan Basin. However, in general, the basin in the Paleozoic Cenozoic had a relatively stable geothermal flow (i.e., 60–65 mW m−2) and geothermal field characteristics (Zhu et al., 2010). Therefore, the simulation of the hydrocarbon generation history of the Longmaxi shales in the Changning area reveals that it began to enter a low maturity stage with Ro ranging from 0.5% to 0.7% at the end of the Early Silurian at about 420 Ma. However, controlled by Caledonian tectonic movement, the thermal evolution rate in the Early Paleozoic was slow. In the early Permian, at about 290 Ma, the Longmaxi shales entered a medium maturity stage with Ro ranges from 0.7% to 1.3%, during which a large amount of oil was generated from the source rock. This was proven by a large amount of bitumen observed in the veins and symbiotic aqueous inclusions, with bituminous inclusions measured in the veins (Figure 4). This oil generation stage lasted until the Middle Triassic for about 220 Ma. Subsequently, the organic matter entered a high maturity stage with Ro ranges from 1.3% to 2.0%, and the former oil was cracked to generate natural gas. Until the deep burial period in the early Cretaceous for about 135 Ma, the organic matter entered an over maturity stage with a Ro over 2.0%, and many chemical bonds of heavy hydrocarbons being broken to generate light hydrocarbons. Methane existed as a separate immiscible in the formation owing to supersaturation, a process evidenced by the observed methane inclusions. After the end of the Late Cretaceous, controlled by uplift and denudation, the earlier generated fracture veins opened, and the shale gas entered a stage of dynamic adjustment. The tectonic compression during the Himalayan period formed a series of tectonic fractures, making the migration, adjustment, and dissipation of shale gas in this area more intense. A series of low-temperature aqueous inclusions symbiotic with methane inclusions recorded the fluid activity information in this period (Figure 4; Table 1).
Horizontal and high angle calcite veins are common in the Longmaxi black shales, and aqueous inclusions symbiotic with hydrocarbon inclusions have existed in the veins, all of which trapped the original fluids during the hydrocarbon generation and enrichment of the shale. This reflects the paleotemperature-pressure and salinity characteristics of the formation in different tectonic periods. The Th of FIAs trapped in well N228 has five peak characteristics of 95–115°C, 120–135°C, 140–155°C, 165–180°C, and 185–195°C, respectively. Combined with burial-thermal history, the trapped depth was defined and the time axis projection was made. The projection results were shown in Figure 11. The green arrow represents the trapped time of bituminous inclusion, that is, the trapped time of oil, and the red arrow represents the trapped time of the methane inclusion.
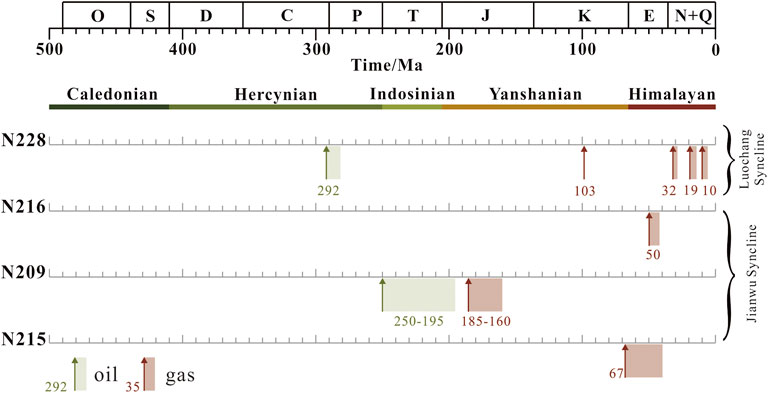
FIGURE 11. Trapping time of FI of wells N228, N216, N209, and N215 in different synclines of the Changning area, southern Sichuan Basin. The data of wells N209, N215, and N216 collected by Gong (2019) and Liang et al. (2021).
The gas–liquid two-phase aqueous inclusions symbiotic with bituminous inclusions of the first phase were enriched in the high angle fractured calcite veins, and the Th ranges from 95 to 115°C, indicating that they were trapped in the low-middle maturity stage of early shallow burial. The corresponding salinity has the characteristics of low salinity (1.4–3.9 wt% NaCl equivalent) and high salinity (5.1–18.9 wt% NaCl equivalent) (Figure 12), indicating that it may be affected by the contamination of high and low salinity fluids, that is, it can be significantly different from high Th—high salinity fluids and medium Th—low salinity fluids due to the mixing of freshwater fluids (Gao et al., 2017; Nie et al., 2020). This phase of fluid filling occurred during 280–292 Ma (Figure 11). Therefore, it is ascribed to the Caledonian tectonic deformation and uplift denudation, resulting in the exposure of some faults to the surface, which is partially connected with shallow atmospheric freshwater.
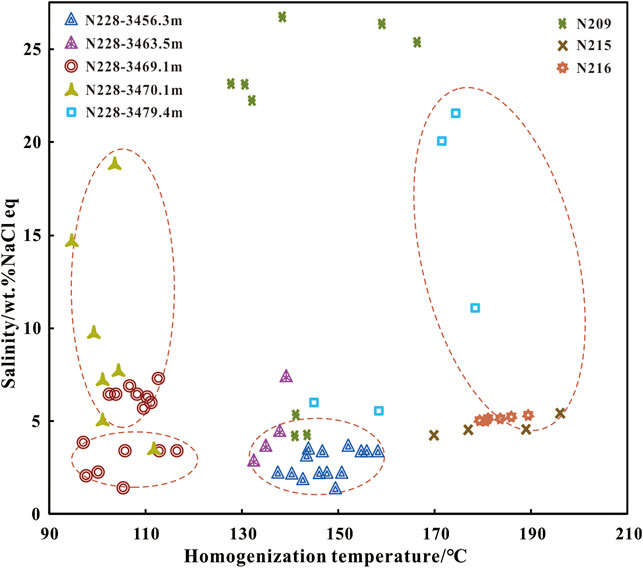
FIGURE 12. Scatter diagram of Th-salinity of FI trapped in wells N228, N216, N209, and N215, and data of wells N209, N215, and N216 collected by Gong (2019) and Liang et al. (2021).
The gas–liquid two-phase aqueous inclusions symbiotic with high-density methane inclusions of the second phase were enriched in horizontal fractured calcite veins, and the Th ranges from 185 to 195°C, the corresponding pressure ranges from 103.41 to 129.53 MPa, with the pressure coefficient ranges from 1.67 to 2.09, illustrating that they were trapped in the over maturity stage of deep burial. They were then trapped for about 103 Ma before the uplift, with the corresponding salinity being characterized by high salinity of 5.7 wt% NaCl equivalent. This demonstrates a better closure of the Longmaxi shales during the deep burial and a relatively closed fluid system. The formation was in a medium-strong overpressure state, that is, the starting point of pressure evolution was a medium-strong overpressure state.
The gas–liquid two-phase aqueous inclusions symbiotic with high-density methane inclusions of the third phase were enriched in the same horizontal fractured calcite veins, and the Th ranges from 165 to 180°C, and the corresponding pressure ranges from 88.67 to 109.22 MPa, with the pressure coefficient ranges from 1.56 to 1.92, manifesting that they were trapped in the uplift stage after deep burial. They were trapped for about 28 to 32 Ma, with the corresponding salinity being high at 11.1–21.5 wt% NaCl equivalent. This shows that in the uplift stage after deep burial, although the gas escape adjustment is caused by the opening fractures, it was still in a relatively closed fluid system and the formation is still in a medium-strong overpressure state.
The gas–liquid two-phase aqueous inclusions symbiotic with high-density methane inclusions of the fourth and fifth phases were enriched in the high angle fractured calcite veins, and the Th ranges from 140 to 155°C and 120 to 135°C. The corresponding pressure ranges from 57.47 to 74.50 MPa and 51.44 to 59.41 MPa, with the pressure coefficient ranging from 1.09 to 1.41 and 1.18 to 1.37, respectively. They were trapped for about 14 to 19 Ma and 6 to 10 Ma at the end of the uplift stage. The salinity corresponding to these two phases was low, indicating that in the later stage of uplift, owing to the openness of the fluid system and the uncertainty of preservation conditions, the underground fluid was affected by atmospheric freshwater to a certain extent, and the formation was in the state of the atmospheric-weak overpressure.
The trapping time and Th-salinity of wells N209, N215, and N216 in the shallow depressional area studied by previous researchers are projected in Figures 11, 12. As can be identified from Figures 11, 12, like well N228, these three wells have the same characteristics of low Th with high and low salinity in the early oil generation stage. It shows that during the Caledonian and Indosinian periods, due to the strata uplift, the fault may be connected to the surface, so it was affected by the contamination of atmospheric freshwater to a certain extent, while in the gas generation period after deep burial, the strata had good closure. Unlike well N228 deep in the depressional area, the wells in the shallow depressional area only experienced fluid filling and migration in the earliest stage of uplift after deep burial, with salinity ranging from 4.51 wt% NaCl equivalent to 5.41 wt% NaCl equivalent with a pressure coefficient ranging from 1.48 to 2.01, indicating that the formation closure was still good and the formation was in a medium-strong overpressure state in the early stage of Yanshanian uplift.
In the Changning area of the southern Sichuan Basin, it is found that the gas content is low or almost non-gaseous in the deeper buried Longmaxi shales of Luochang syncline, and high in the shallower buried Longmaxi shales of Jianwu syncline. That is, the gas content of well N228 located in the Luochang syncline is only 0.17 m3/t, whereas the gas content of wells N209, N215, and N216 located in the Jianwu syncline is high, being 2.99, 2.05, and 2.03 m3/t, respectively. In addition, low resistivity is found in wells with low or no gas content, compared to that of wells with high gas content is higher. The resistivity of wells N228, N209, N215, and N216 is 0.49 Ωm, 43.5 Ωm, 144.75 Ωm, and 61.05 Ωm, respectively (Figure 13). In view of this phenomenon, two main controlling factors were proposed. One is that the low resistance is caused by the high conductivity mineral graphite produced by high evolution (Wang et al., 2018; Zhao et al., 2018), and the other is that the low resistance is mainly caused by inlaid close contact between particles due to diagenesis, resulting in lower gas saturation, increased water saturation, and increased mineralization within the shale to enhance conductivity (Gao et al., 2016; Liang et al., 2021).
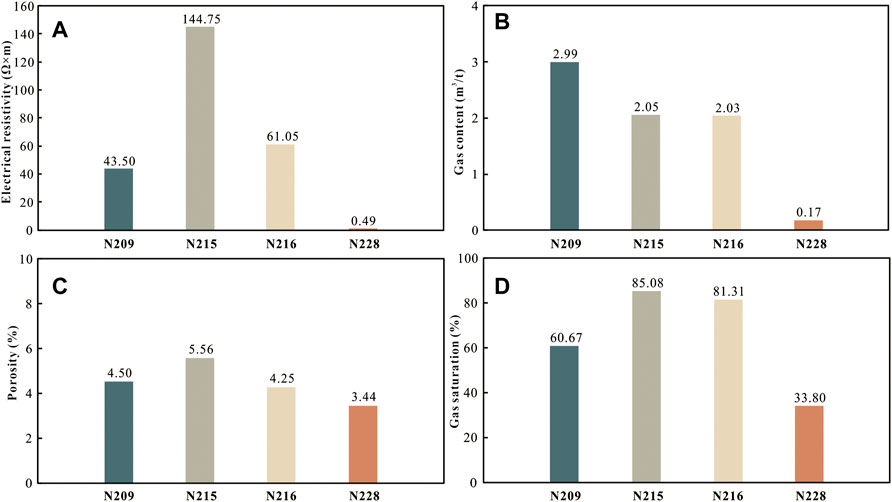
FIGURE 13. (A) Resistivity, (B) gas content, (C) porosity, and (D) gas saturation of wells N228, N216, N209, and N215.
It is evident from this investigation that there is an abnormal phenomenon of Dh > Gh with RmcRo > 4% in some bituminous inclusions, based on the variation of Dh/Gh in the thermal evolution of bitumen and the equivalent vitrinite reflectance calculated by the thermal maturity formula, which confirms the existence of high thermal evolution, i.e., “graphitization” of organic matter in the Luochang syncline of the Changning area, southern Sichuan Basin. Meanwhile, bituminous inclusions were also found in the Jianwu syncline of the Changning area, but these kinds of inclusions did not develop organic matter “graphitization.” In addition, as discussed previously, it is considered that well N228 located in Luochang syncline existed more phases of fluid activities in the late uplift period than wells N209, N215, and N216 located in Jianwu syncline. Moreover, the fluid activity in this period corresponds to lower salinity, indicating that the late uplift and denudation have a greater impact on the region. The mixing of external fluids may destroy the preservation of shale gas, and the migration and escape of natural gas, water, and other fluids in the shale reservoir to varying degrees. The pore pressure decreases owing to gas dissipation, and the pressure of the overlying formation compacts the shale skeleton and reduces the pores and microfractures of the shale, resulting in a significant decrease in gas saturation and an increase in water saturation. The porosity of wells N209, N215, N216, and N228 is 4.50%, 4.56%, 4.25%, and 3.44%, respectively, and the gas saturation of wells N209, N215, N216, and N228 is 60.67%, 85.08%, 81.31%, and 33.80%, respectively (Figure 13). The frequent fluid activity in the late uplift stage, the increase of water saturation in the formation, and the local area experiencing strong water washing (Liang et al., 2021), all led to the failure of the fluid self-closure system and the destruction of preservation conditions; thus, eventually leading to enhanced electrical conductivity and low resistance characteristics. This indicates that the emergence of low resistance in localized deep depressional areas, such as the Luochang syncline of the Changning area, is not only related to the high evolution degree of organic matter, but is also affected by the later multi-phases fluid modification.
The early subsidence rate of the Changning area was stable, with two oil generation peaks of 200–250 Ma and 290 Ma and a gas generation peak of 160–185 Ma (Figure 11). It reached the maximum burial depth in the Late Cretaceous, when the pressure coefficient could reach two, with superior preservation conditions, good fluid storage and high enrichment of shale gas. In contrast, the multi-phase uplift and denudation experienced after the Late Cretaceous resulted in the reduction of the temperature and pressure of the Longmaxi shales. Meanwhile, the degrees of pore-fracture formation in the early stage and the stress differences of rocks affected by uplift in different tectonic sites led to differences in the degree of pore and fracture formation in the late stage. Compared with other wells in the shallow depressional area, well N228 in the deep depressional area was affected by tectonic uplift to a greater extent, with low porosity and strong fluid activity, resulting in strong adjustment and modification of shale gas, low gas saturation, and no effective shale gas production.
The FIAs trapped in the calcite veins in the Longmaxi shales of the Changning area were observed and measured to provide compelling evidence of the influence of multi-phase fluid activities on resistivity. The conclusions are summarized as follows:
(1) The calcite vein orientation of the Longmaxi shales in the Changning area is considered mainly in a highly angular and horizontal fashion, with a huge quantity of bituminous inclusions and methane inclusions captured. The thermal evolution degree of bituminous inclusions reached the stage of carbon bitumen to metamorphic bitumen, the organic matter was fully cracked and gas was generated, and some of them exhibited the “graphitization” phenomenon.
(2) Five phases of fluid activities were existed in well N228 in the Changning area. The first phase existed in the shallow burial and middle-low maturity stage for about 280–292 Ma, and the Th was between 95 and 115°C. The second and third phases were existed in the high-over mature stage of deep burial and the initial uplift stage after deep burial, for about 103 Ma and 28–32 Ma, and the Th ranges from 185 to 195°C and 165–180°C, with the pressure being 103.41–129.53 MPa (pressure coefficient was 1.67–2.09) and 88.6–109.22 MPa (pressure coefficient was 1.56–1.92). The fourth and fifth phases were existed in the late uplift stage, for about 14–19 Ma and 6–10 Ma, and the Th ranges from 140 to 155 and 120–135°C, respectively, corresponding pressures of 57.47–74.50 MPa and 51.44–59.41 MPa, and pressure coefficients of 1.09–1.41 and 1.18–1.37, respectively. The fluids had the characteristics of low salinity and were in the state of atmospheric-weak overpressure.
(3) The low resistance is not only caused by the “graphitization” of organic matter, but also related to the water washing of shale strata. The early burial situations in the Changning area were similar. The preservation conditions were superior, with better fluid storage and high shale gas enrichment. The Luochang syncline, i.e., the deep depressional area is more affected by tectonic uplift, with low porosity, strong fluid activities caused by fracture opening, and strong adjustment and transformation of shale gas, which makes it difficult to form an effective shale gas enrichment area compared with the Jianwu syncline, i.e., shallow depressional area.
The original contributions presented in the study are included in the article/supplementary material, further inquiries can be directed to the corresponding authors.
YC was the primary finisher of this study, XL and WG provided the source of the samples and funding, YF and WL provided the experimental apparatus of this study, LH, CQ, and TF completed part of data processing work for this study.
This research was supported by the Science and Technology Project of PetroChina Exploration and Production Company (Project No. kt 2021-11-01) and the Hubei Provincial Natural Science Foundation of China (Grant No. 2021CFB182). The experimental support was provided by the Experimental Research Center, School of Geosciences, Yangtze University, Wuhan, China.
The authors declare that the research was conducted in the absence of any commercial or financial relationships that could be construed as a potential conflict of interest.
All claims expressed in this article are solely those of the authors and do not necessarily represent those of their affiliated organizations, or those of the publisher, the editors and the reviewers. Any product that may be evaluated in this article, or claim that may be made by its manufacturer, is not guaranteed or endorsed by the publisher.
The author sincerely thanks the Reasearch Center of Sichuan Basin of PetroChina Research Institute of Petroleum Exploration & Development and PetroChina Southwest Oil & Gasfield Company, Chengdu, China, for providing core samples and basic geological data.
Andersen, T., and Burke, E. A. J. (1996). Methane Inclusions in Shocked Quartz from the Gardnos Impact Breccia, South Norway. Eur. J. Mineralogy 8 (5), 927–936. doi:10.1127/ejm/8/5/0927
Bachrach, R. (2011). Elastic and Resistivity Anisotropy of Shale during Compaction and Diagenesis: Joint Effective Medium Modeling and Field Observations. Geophysics 76 (6), E175–E186. doi:10.1190/geo2010-0381.1
Barres, O., Burneau, A., Dubessy, J., and Pagel, M. (1987). Application of Micro-FT-IR Spectroscopy to Individual Hydrocarbon Fluid Inclusion Analysis. Appl. Spectrosc. 41 (6), 1000–1008. doi:10.1366/0003702874447743
Bodnar, R. J. (1993). Revised Equation and Table for Determining the Freezing Point Depression of H2O-NaCl Solutions. Geochim. Cosmochim. Acta 57 (3), 683–684. doi:10.1016/0016-7037(93)90378-A
Chen, H. H., Dong, W. L., Zhang, S. L., and Yang, J. H. (2002). Application of Fluid Inclusions in Palaeopressure Modelling Research. Oil Gas. Geol. 23 (3), 207–211. (in Chinese with English abstract). doi:10.3321/j.issn:0253-9985.2002.03.002
Duan, Z., Møller, N., and Weare, J. H. (1992). An Equation of State for the CH4-CO2-H2O System: I. Pure Systems from 0 to 1000°C and 0 to 8000 Bar. Geochim. Cosmochim. Acta 56, 2605–2617. doi:10.1016/0016-7037(92)90347-l
Feng, Q., Qiu, N., Borjigin, T., Wu, H., Zhang, J., Shen, B., et al. (2022). Tectonic Evolution Revealed by Thermo-Kinematic and its Effect on Shale Gas Preservation. Energy 240, 122781. doi:10.1016/j.energy.2021.122781
Gao, H. Q., Ding, A. X., Cai, X., and He, G. S. (2016). Genetic Analysis of Abnormal Resistivity of Middle-Upper Yangtze Marine Shales. Fault-Block Oil Gas Field 23 (5), 578–582. (in Chinese with English abstract). doi:10.6056/dkyqt201605007
Gao, J., He, S., Zhao, J.-x., and Yi, J. (2017). Geothermometry and Geobarometry of Overpressured Lower Paleozoic Gas Shales in the Jiaoshiba Field, Central China: Insight from Fluid Inclusions in Fracture Cements. Mar. Pet. Geol. 83, 124–139. doi:10.1016/j.marpetgeo.2017.02.018
Gong, W. L. (2019). Evolution and Mechanism of Reservoir Fluid Pressure during Shale Uplifting of Wufeng-Longmaxi Formation in the Changning Area. Beijing: China University of Petroleum. (in Chinese with English abstract). doi:10.27643/d.cnki.gsybu.2019.001448
Gou, Q., Xu, S., Hao, F., Lu, Y., Shu, Z., Lu, Y., et al. (2021). Evaluation of the Exploration Prospect and Risk of Marine Gas Shale, Southern China: A Case Study of Wufeng-Longmaxi Shales in the Jiaoshiba Area and Niutitang Shales in the Cen'gong Area. GSA Bull. 134 (5-6), 1585–1602. doi:10.1130/B36063.1
Han, L. L., Li, X. Z., Guo, W., Ju, W., Cui, Y., Liu, Z. Y., et al. (2022). Characteristics and Dominant Factors for Natural Fractures in Deep Shale Gas Reservoirs: A Case Study of the Wufeng-Longmaxi Formations in Luzhou Block, Southern China. Lithosphere, 9662175. doi:10.2113/2022/9662175
Hansen, S. B., and Berg, R. W. (2009). Raman Spectroscopic Studies of Methane Gas Hydrates. Appl. Spectrosc. Rev. 44 (2), 168–179. doi:10.1080/05704920802352614
He, D., Lu, R., Huang, H., Wang, X., Jiang, H., and Zhang, W. (2019). Tectonic and Geological Setting of the Earthquake Hazards in the Changning Shale Gas Development Zone, Sichuan Basin, SW China. Pet. Explor. Dev. 46 (5), 1051–1064. doi:10.1016/S1876-3804(19)60262-4
Hou, Y. G., Zhang, K. P., He, S., Qin, W. F., Xiao, Y., Wang, C., et al. (2021). Origin and Geological Significance of Ultra-low Resistivity in Lower Paleozoic Marine Shale, South China. Bull. Geol. Sci. Technol. 40 (1), 80–89. (in Chinese with English abstract). doi:10.19509/j.cnki.dzkq.2021.0104
Huang, S. J., Qing, H. R., Hu, Z. W., Pei, C. R., Wang, Q. D., Wang, C. M., et al. (2008). Cathodoluminescence and Diagenesis of the Carbonate Rocks in Feixianguan Formation of Triassic, Eastern Sichuan Basin of China. Earth Sci.-J. China Univ. Geosci. 33 (1), 26–34. (in Chinese with English abstract). doi:10.3321/j.issn:1000-2383.2008.01.004
Huang, H., He, D., Li, Y., Li, J., and Zhang, L. (2018). Silurian Tectonic-Sedimentary Setting and Basin Evolution in the Sichuan Area, Southwest China: Implications for Palaeogeographic Reconstructions. Mar. Pet. Geol. 92, 403–423. doi:10.1016/j.marpetgeo.2017.11.006
Huang, H. Y., He, D. F., Li, Y. Q., and Fan, H. D. (2019). Determination and Formation Mechanism of the Luzhou Paleo-Uplift in the Southeastern Sichuan Basin. Earth Sci. Front. 26 (1), 102–120. (in Chinese with English abstract). doi:10.13745/j.esf.sf.2019.1.9
Huang, S. J. (1992). Relationship between Cathodoluminescence and Concentration of Iron and Manganese in Carbonate Minerals. Mineral. Petrol. 12 (4), 74–79. (in Chinese with English abstract).
Jia, J., Zhou, R., Liu, Z., Han, X., and Gao, Y. (2021). Organic Matter-Driven Electrical Resistivity of Immature Lacustrine Oil-Prone Shales. Geophysics 86 (4), MR165–MR178. doi:10.1190/geo2020-0238.1
Kelemen, S. R., and Fang, H. L. (2001). Maturity Trends in Raman Spectra from Kerogen and Coal. Energy Fuels 15 (3), 653–658. doi:10.1021/ef0002039
Kerkhof, A., and Thiéry, R. (2001). Carbonic Inclusions. Lithos 55 (1), 49–68. doi:10.1016/s0024-4937(00)00038-4
Kerkhof, A. M. V. D. (1990). Isochoric Phase Diagrams in the Systems CO2-CH4 and CO2-N2: Application to Fluid Inclusions. Geochim. Cosmochim. Acta 54 (3), 621–629. doi:10.1016/0016-7037(90)90358-r
Li, J., Fuller, S., Cattle, J., Pang Way, C., and Brynn Hibbert, D. (2004). Matching Fluorescence Spectra of Oil Spills with Spectra from Suspect Sources. Anal. Chim. Acta 514 (1), 51–56. doi:10.1016/j.aca.2004.03.053
Liang, X., Xu, J. L., Wang, Y., Fang, X. Y., Zhao, L., Wu, Y. J., et al. (2021). The Shale Gas Enrichment Factors of Longmaxi Formation under Gradient Basin-Mountain Boundary in South Sichuan Basin: Tectono-Depositional Differentiation and Discrepant Evolution. Chin. J. Geol. 56 (1), 60–81. (in Chinese with English abstract). doi:10.12017/dzkx.2021.005
Lin, F., Bodnar, R. J., and Becker, S. P. (2007). Experimental Determination of the Raman CH4 Symmetric Stretching (ν1) Band Position from 1-650 Bar and 0.3-22°C: Application to Fluid Inclusion Studies. Geochim. Cosmochim. Acta 71 (15), 3746–3756. doi:10.1016/j.gca.2007.05.016
Liu, B., and Shen, K. (1999). The Thermodynamic Simulation of Fluid Inclusions. Beijing, China: Science Press, 27–83. (in Chinese).
Liu, D., Dai, J., Xiao, X., Tian, H., Yang, C., Hu, A., et al. (2010). High Density Methane Inclusions in Puguang Gasfield: Discovery and a T-P Genetic Study. Sci. Bull. 54, 4714–4723. (in Chinese). doi:10.1360/csb2010-55-4-5-359
Liu, D. H., Xiao, X. M., Tian, H., Yang, C., Hu, A. P., and Song, Z. G. (2009). Identification of Natural Gas Origin Using the Characteristics of Bitumen and Fluid Inclusions. Pet. Explor. Dev. 36 (3), 375–382. (in Chinese with English abstract). doi:10.3321/j.issn:1000-0747.2009.03.013
Liu, D., Xiao, X., Tian, H., Min, Y., Zhou, Q., Cheng, P., et al. (2013). Sample Maturation Calculated Using Raman Spectroscopic Parameters for Solid Organics: Methodology and Geological Applications. Chin. Sci. Bull. 58 (13), 1285–1298. doi:10.1007/s11434-012-5535-y
Liu, W. P., Zhou, Z., Luo, J., Wu, C., Wu, W., Jiang, L., et al. (2020). Hydrocarbon Generation and Shale Gas Accumulation in the Wufeng-Longmaxi Formations, Changning Shale-Gas Field, Southern Sichuan Basin. J. Nanjing Univ. Nat. Sci. 56 (3), 393–404. (in Chinese with English abstract). doi:10.13232/j.cnki.jnju.2020.03.008
Liu, S., Yang, Y., Deng, B., Zhong, Y., Wen, L., Sun, W., et al. (2021). Tectonic Evolution of the Sichuan Basin, Southwest China. Earth-Sci. Rev. 213, 103470. doi:10.1016/j.earscirev.2020.103470
Liu, B. (2005). The Thermodynamic Simulation of Hydrocarbon Inclusions. Beijing, China: Science Press. (in Chinese).
Lu, W., Chou, I.-M., Burruss, R. C., and Song, Y. (2007). A Unified Equation for Calculating Methane Vapor Pressures in the CH4-H2O System with Measured Raman Shifts. Geochim. Cosmochim. Acta 71 (16), 3969–3978. doi:10.1016/j.gca.2007.06.004
Ma, X. H., and Xie, J. (2018). The Progress and Prospects of Shale Gas Exploration and Exploitation in Southern Sichuan Basin, NW China. Pet. Explor. Dev. 45 (1), 161–169. (in Chinese with English abstract). doi:10.11698/PED.2018.01.18
Nie, H., He, Z., Wang, R., Zhang, G., Chen, Q., Li, D., et al. (2020). Temperature and Origin of Fluid Inclusions in Shale Veins of Wufeng-Longmaxi Formations, Sichuan Basin, South China: Implications for Shale Gas Preservation and Enrichment. J. Pet. Sci. Eng. 193, 107329. doi:10.1016/j.petrol.2020.107329
Permanyer, A., Douifi, L., Lahcini, A., Lamontagne, J., and Kister, J. (2002). FTIR and SUVF Spectroscopy Applied to Reservoir Compartmentalization: A Comparative Study with Gas Chromatography Fingerprints Results. Fuel 81 (7), 861–866. doi:10.1016/s0016-2361(01)00211-3
Pierson, B. J. (1981). The Control of Cathodoluminescence in Dolomite by Iron and Manganese. Sedimentology 28 (5), 601–610. doi:10.1111/j.1365-3091.1981.tb01924.x
Pradier, B., Largeau, C., Derenne, S., Martinez, L., Bertrand, P., and Pouet, Y. (1990). Chemical Basis of Fluorescence Alteration of Crude Oils and Kerogens-I. Microfluorimetry of an Oil and its Isolated Fractions; Relationships with Chemical Structure. Org. Geochem. 16 (1-3), 451–460. doi:10.1016/0146-6380(90)90061-4
Qiu, N. S., Feng, Q. Q., TengerShen, B. B. J., Ma, Z. L., Yu, L. J., and Cao, A. Q. (2020). Yanshanian-Himalayan Differential Tectono-Thermal Evolution and Shale Gas Preservation in Dingshan Area, Southeastern Sichuan Basin. Acta Pet. Sin. 41 (12), 1610–1622. (in Chinese with English abstract). doi:10.7623/syxb202012013
Seitz, J. C., Pasteris, J. D., and Chou, I.-M. (1996). Raman Spectroscopic Characterization of Gas Mixtures; II, Quantitative Composition and Pressure Determination of the CO2-CH4 System. Am. J. Sci. 296 (6), 577–600. doi:10.2475/ajs.296.6.577
Sun, J. M., Xiong, Z., Luo, H., Zhang, H. P., and Zhu, J. J. (2018). Mechanism Analysis and Logging Evaluation of Low Resistivity in Lower Paleozoic Shale Gas Reservoirs of Yangtze Region. J. China Univ. Pet. Ed. Nat. Sci. 42 (5), 47–56. (in Chinese with English abstract). doi:10.3969/j.issn.1673-5005.2018.05.005
Ten-Have, A. H. M., and Heijnen, W. (1985). Cathodoluminescence Activation and Zonation in Carbonate Rocks: An Experimental Approach. Geol. Mijnbouw 64 (3), 297–310. doi:10.1130/0016-7606(1985)96<1599:GAPOII>2.0.CO;2
Wang, Y. M., Dong, D. Z., Cheng, X. Z., Huang, J. L., Wang, S. F., and Wang, S. Q. (2014). Electric Property Evidences of the Carbonification of Organic Matters in Marine Shales and its Geologic Significance: A Case of the Lower Cambrian Qiongzhusi Shale in Southern Sichuan Basin. Nat. Gas. Ind. 34 (8), 1–7. (in Chinese with English abstract). doi:10.3787/j.issn.1000-0976.2014.08.001
Wang, Y. M., Li, X. J., Chen, B., Wu, W., Dong, D. Z., Zhang, J., et al. (2018). Lower Limit of Thermal Maturity for the Carbonization of Organic Matter in Marine Shale and its Exploration Risk. Pet. Explor. Dev. 45 (3), 385–395. (in Chinese with English abstract). doi:10.1016/s1876-3804(18)30045-4
Wang, M., Chen, Y., Bain, W. M., Song, G., Liu, K., Zhou, Z., et al. (2020). Direct Evidence for Fluid Overpressure during Hydrocarbon Generation and Expulsion from Organic-Rich Shales. Geology 48 (4), 374–378. doi:10.1130/g46650.1
Xu, S., Gou, Q., Hao, F., Zhang, B., Shu, Z., Lu, Y., et al. (2020a). Shale Pore Structure Characteristics of the High and Low Productivity Wells, Jiaoshiba Shale Gas Field, Sichuan Basin, China: Dominated by Lithofacies or Preservation Condition? Mar. Pet. Geol. 114, 104211. doi:10.1016/j.marpetgeo.2019.104211
Xu, S., Gou, Q. Y., Hao, F., Zhang, B. Q., Shu, Z. G., and Zhang, Y. Y. (2020b). Multiscale Faults and Fractures Characterization and Their Effects on Shale Gas Accumulation in the Jiaoshiba Area, Sichuan Basin, China. J. Pet. Sci. Eng. 189, 107026. doi:10.1016/j.petrol.2020.107026
Xu, S., Hao, F., Zhang, Y., and Gou, Q. (2020c). High-Quality Marine Shale Reservoir Prediction in the Lower Silurian Longmaxi Formation, Sichuan Basin, China. Interpretation 8 (2), T453–T463. doi:10.1190/int-2019-0149.1
Yang, X. B., Zhang, S. D., Zhang, Z. G., Liu, J., and Deng, X. (2015). Logging Interpretation and Evaluation of Low Resistivity Shale Gas Reservoirs. J. Chengdu Univ. Technol. Sci. Technol. Ed. 42 (6), 692–699. (in Chinese with English abstract). doi:10.3969/j.issn.1671-9727.2015.06.07
Yang, H. Z., Zhao, S. X., Liu, Y., Wu, W., Xia, Z. Q., Wu, T. P., et al. (2019). Main Controlling Factors of Enrichment and High-Yield of Deep Shale Gas in the Luzhou Block, Southern Sichuan Basin. Nat. Gas. Ind. 39 (11), 55–63. (in Chinese with English abstract). doi:10.3787/j.issn.1000-0976.2019.11.007
Yuan, Y. S., Sun, D. S., Li, S. J., and Lin, J. H. (2013). Caledonian Erosion Thickness Reconstruction in the Sichuan Basin. Chin. J. Geol. 48 (3), 581–591. (in Chinese with English abstract). doi:10.3969/j.issn.0563-5020.2013.03.001
Zhang, J. K., He, S., Yi, J. Z., Zhang, B. Q., Zhang, S. W., Zheng, L. J., et al. (2014). Rock Thermo-Acoustic Emission and Basin Modeling Technologies Applied to the Study of Maximum Paleotemperatures and Thermal Maturity Histories of Lower Paleozoic Marine Shales in the Western Middle Yangtze Area. Acta Pet. Sin. 35 (1), 58–67. (in Chinese with English abstract). doi:10.7623/syxb201401006
Zhao, W. T., Jing, T. Y., Xiong, X., Wu, B., and Zhou, Y. (2018). Graphitization Characteristics of Organic Matters in Marine-Facies Shales. Geol. Sci. Technol. Inf. 37 (2), 183–191. (in Chinese with English abstract). doi:10.19509/j.cnki.dzkq.2018.0225
Zhou, Q., Xiao, X., Pan, L., and Tian, H. (2014). The Relationship between Micro-Raman Spectral Parameters and Reflectance of Solid Bitumen. Int. J. Coal Geol. 121 (1), 19–25. doi:10.1016/j.coal.2013.10.013
Zhu, C. Q., Xu, M., Shan, J. N., Yuan, Y. S., Zhao, Y. S., and Hu, S. B. (2009). Quantifying the Denudations of Major Tectonic Events in Sichuan Basin: Constrained by the Paleothermal Records. Geol. China 36 (6), 1268–1277. (in Chinese with English abstract). doi:10.3969/j.issn.1000-3657.2009.06.008
Zhu, C., Xu, M., Yuan, Y., Zhao, Y., Shan, J., He, Z., et al. (2010). Palaeogeothermal Response and Record of the Effusing of Emeishan Basalts in the Sichuan Basin. Chin. Sci. Bull. 55 (10), 949–956. (in Chinese with English abstract). doi:10.1007/s11434-009-0490-y
Keywords: southern Sichuan Basin, Longmaxi formation, calcite vein, fluid inclusions, fluid activities, low resistivity
Citation: Cui Y, Li X, Han L, Feng Y, Guo W, Lin W, Qian C and Feng T (2022) Multi-Phases Fluid Activity Characteristics of Longmaxi Formation and Its Impact on Resistivity in the Changning Area, Southern Sichuan Basin, Southwest China. Front. Earth Sci. 10:931012. doi: 10.3389/feart.2022.931012
Received: 28 April 2022; Accepted: 20 May 2022;
Published: 27 June 2022.
Edited by:
Shang Xu, China University of Petroleum (East China), ChinaReviewed by:
Haikuan Nie, SINOPEC Petroleum Exploration and Production Research Institute, ChinaCopyright © 2022 Cui, Li, Han, Feng, Guo, Lin, Qian and Feng. This is an open-access article distributed under the terms of the Creative Commons Attribution License (CC BY). The use, distribution or reproduction in other forums is permitted, provided the original author(s) and the copyright owner(s) are credited and that the original publication in this journal is cited, in accordance with accepted academic practice. No use, distribution or reproduction is permitted which does not comply with these terms.
*Correspondence: Xizhe Li, bHh6NjlAcGV0cm9jaGluYS5jb20uY24=; Lingling Han, aGFubGxfMTlAMTYzLmNvbQ==
Disclaimer: All claims expressed in this article are solely those of the authors and do not necessarily represent those of their affiliated organizations, or those of the publisher, the editors and the reviewers. Any product that may be evaluated in this article or claim that may be made by its manufacturer is not guaranteed or endorsed by the publisher.
Research integrity at Frontiers
Learn more about the work of our research integrity team to safeguard the quality of each article we publish.