
95% of researchers rate our articles as excellent or good
Learn more about the work of our research integrity team to safeguard the quality of each article we publish.
Find out more
ORIGINAL RESEARCH article
Front. Earth Sci. , 23 May 2022
Sec. Structural Geology and Tectonics
Volume 10 - 2022 | https://doi.org/10.3389/feart.2022.929467
This article is part of the Research Topic Advances in the Study of Natural Fractures in Deep and Unconventional Reservoirs View all 29 articles
 Xiaojun Wang1Zhijun Jin2,3Gang Chen1Miao Peng1Liliang Huang1Zhenlin Wang1Lianbo Zeng4Guoqing Lu4Xiaoyu Du2Guoping Liu2*
Natural fractures in continental shale oil reservoirs of the Fengcheng Formation in the Mahu Sag show multi-scale characteristics, which leads to complex seismic responses and difficult identification. In order to establish fracture prediction models with good performance in these reservoirs, this study uses seismic attributes such as post-stack coherence, curvature, likelihood, and pre-stack AVAz to predict the multi-scale fractures, including main-secondary faults, large-scale fractures, and medium-small scale fractures in continental shale oil reservoirs. The final prediction results are superimposed on the plane to clarify the multi-scale fracture distribution law of the Fengcheng Formation in the Mahu Sag. Seismic prediction results show that natural fractures in the upper sweet spot of the Fengcheng Formation are more developed, especially in the northern and central platform areas, and they are mainly near E-W strikes. With the increase of the primary-secondary fault distance, the fracture density gradually decreases. Natural fractures obtained by seismic prediction are consistent with the fractures interpreted by image logs, which can be used to effectively predict fractures for continental shale oil reservoirs in the Mahu Sag of the Junggar Basin and other areas with a similar geological background.
Shale oil reservoirs refer to the oil resources in the organic-rich shale series, including shale and the interlayer of tight carbonate rocks or clastic rocks in the shale series, generally with ultra-low porosity and permeability. The development of shale oil reservoirs requires horizontal wells and fracturing technologies to achieve (Zhao et al., 2020; Jin et al., 2021). Currently, the shale oil reservoir exploration around the world is mainly concentrated in the marine strata. In contrast, some shale reservoirs have recently been discovered in continental basins in China, which have strong heterogeneity (Zhao et al., 2018; Jin et al., 2019; Hu et al., 2020). A series of drilling and pilot tests have been carried out to evaluate sweet spots of shale oil reservoirs. It has been found that the vast majority of shale oil reservoirs with industrial production are formed in shale where natural fractures are commonly developed (Jiang et al., 2014). Therefore, the study of natural fractures is essential necessary for the effective exploration and development of shale oil reservoirs (Gong et al., 2021a, b).
In recent years, the method of fracture prediction using seismic data has achieved good application results in both physical model data and actual field seismic data. A variety of methods and techniques have been developed for fracture prediction, including edge detection, intrinsic coherence, curvature, ant-tracking volume, and other post-stack attributes, and azimuthal anisotropy inversion (Liang, 2019). However, the genetic types of fractures are complex, and the fractures in the actual underground media usually show multi-scale characteristics with different sizes. Therefore, the seismic anisotropic response characteristics are the comprehensive reflection of fractures with varying scales in the media. According to the different fracture scales, fractures are divided into large-scale, medium-scale, small-scale, and micro-scale fractures (Gong et al., 2019; Zeng et al., 2021; Zeng et al., 2022). According to the characteristics of fractures of different scales, clarifying the characterization methods of fractures of different scales is the premise of profoundly understanding the distribution law of fractures of different scales (Jiu and Sun, 2016; Ju et al., 2018; Liu J. et al., 2021; Lyu et al., 2021), which has important application value for effectively guiding the exploration and development of shale oil. At present, the commonly used seismic fracture prediction methods are using the azimuthal anisotropy characteristics of seismic waves propagating in fractured media, including attributes such as amplitude, velocity, travel time, and attenuation, and analyzing their various characteristics with azimuth to predict the fracture orientation and strength (Rüger and Tsvankin, 1997).
The Permian Fengcheng Formation in the Mahu Sag on the northwestern margin of the Junggar Basin developed a medium-high maturity alkaline lake with high-quality source rocks (Cao et al., 2015; Zhi et al., 2021b). It is a new type of sedimentary shale oil system in the alkaline lake basin, and the hydrocarbon generation process is multi-stage, long-lasting, and mainly oil generation, which is different from other lacustrine source rocks (Cao et al., 2015; Xia et al., 2020). Xinjiang Oilfield Company identified a favorable zone for shale oil exploration with an area of 2300 km2 in the central part of the Mahu Sag through the geological survey of the Fengcheng Formation in the Mahu Sag. Because the porosity and permeability of the Fengcheng Formation shale oil reservoirs are low to ultra-low, the fracture system developed in the reservoir is the main influencing factor for high-quality reservoirs, and the research on fracture prediction based on seismic data is the focus of research in this field.
Multi-scale fractures are developed in continental shale oil reservoirs of the Fengcheng Formation in the Mahu Sag. Conventional fracture prediction technology mainly uses azimuthal anisotropy to perform comprehensive fracture prediction. The predicted fracture development intensity results cannot distinguish large-scale fractures well. It is an integrated reaction of large-scale fractures small-scale fractures. Therefore, this paper proposes to use different post-stack and pre-stack properties to predict multi-scale fractures in continental shale oil reservoirs and finally superimpose the plane of the multi-scale fracture prediction results to clarify the multi-scale fracture distribution law of the Fengcheng Formation in the Mahu Sag, guide the exploration practice of continental shale oil reservoirs in the Fengcheng Formation, and provide a theoretical basis for subsequent exploration and development.
Mahu Sag is a secondary tectonic unit located on the northwestern margin of the Junggar Basin (Figure 1). The western side of the Sag is the Wuxia fault zone, the Kebai fault zone, and the Zhongguai Uplift from north to south, and the eastern side of the Sag is the Quartztan Uplift, the Yingxi Sag, the Sanquan Uplift, the Xiayan Uplift and the Dabasong Uplift from north to south (Zhi et al., 2021b; Wang et al., 2021) (Figure 1). Affected by the strong collision and extrusion movement of the West Junggar Ocean to the Kazakhstan plate, especially the collision between the Junggar block and the Kazakhstan plate in the Middle-Late Carboniferous to the Early Permian intensified, a large-scale nappe structure was formed on the northwestern margin of the basin. The foreland depression was formed in the Mahu Sag (Lei et al., 2017), which is the most important formation period of the Mahu Sag. The depositional period of the Lower Permian Fengcheng Formation was a period of intense development of the western foreland basin system, forming the most important set of source rocks in the basin (Tang et al., 2019; Zhang Y. Y. et al., 2018; Zhi et al., 2021b). The two Baili oil areas of Ke-Wu and the west slope of Mahu have accumulated proven reserves of 17.9×10⁸ t, which are well-known large oil areas in the world (Zhi et al., 2018; Tang et al., 2021). In order to promote the exploration of shale oil in the Mahu Sag, Well B2 was drilled in a relatively shallow position in the slope area of the Mahu Sag in 2008 (Tang et al., 2021). The peak daily oil production of Well B2 in 2020 was 50.6 m3, showing a good prospect for exploration and development.
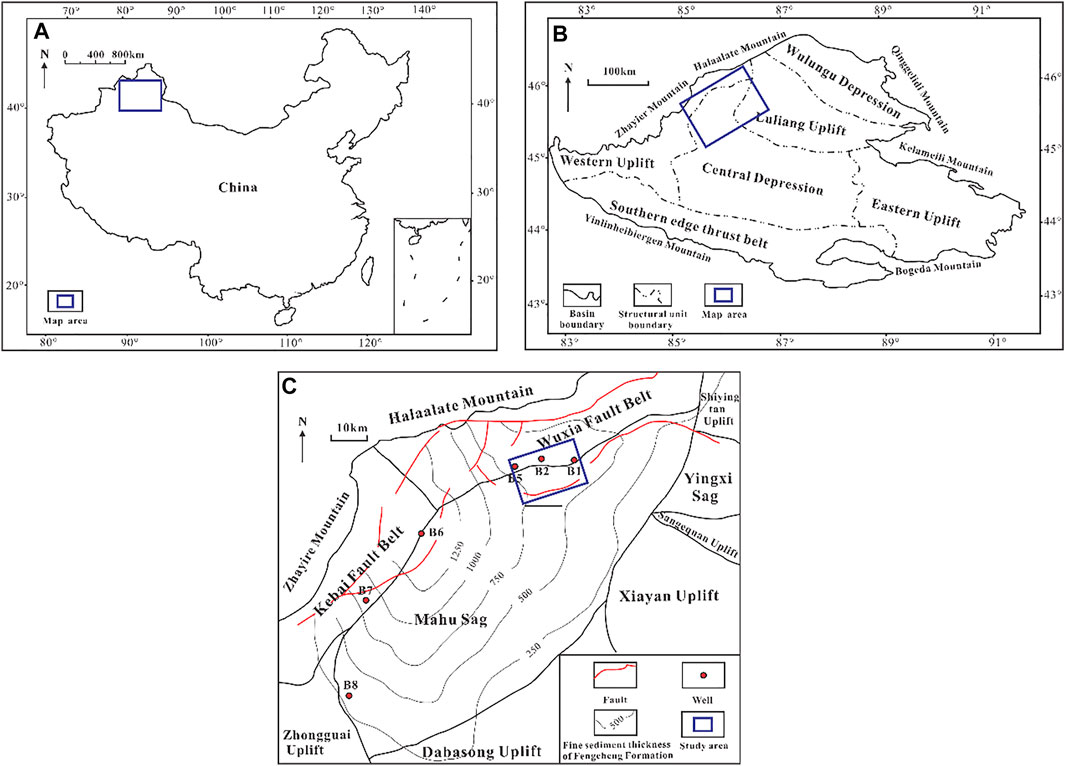
FIGURE 1. Tectonic division of the Mahu Sag of the Junggar Basin (Zhi et al., 2021b; Wang et al., 2021). (A) Location of Junggar Basin. (B) Location of the Mahu Sag and Structural Unit of Junggar Basin. (C) Location of the study area and the structural unit of the Mahu Sag.
The main body of the Fengcheng Formation in the Mahu Sag is a multi-source mixed fine-grained sedimentary formation under the background of a deep to semi-deep alkaline lake (Zhi et al., 2019). Endogenous chemical deposition, volcanic material deposition, and terrigenous clastic deposition (Zhi et al., 2021b). Various rock types and transition lithologies such as sandstone, dolomite, mudstone, and tuff are developed, forming frequent interbedded structures vertically (Zhang Z. J. et al., 2018). From bottom to top, it is divided into Feng 1 Member (Pf1), Feng 2 Member (Pf2), and Feng 3 Member (Pf3), and the sediments of different layers are different (Zhu et al., 2017). Fengcheng Formation is oil-bearing as a whole and locally enriched. The fine dolomitic sandstone with high sand content and strong dolomitization have good oil content. Due to the high range of brittle minerals, natural fractures are generally developed under the action of multi-stage structural deformation. Fengcheng Formation is the main dessert development section, and the upper dessert has better oil content and higher oil production (Figure 2). This study mainly focuses on predicting seismic fracture distribution law in the upper sweet spot of Fengcheng Formation in Well Ma 131 area of Mahu Sag.
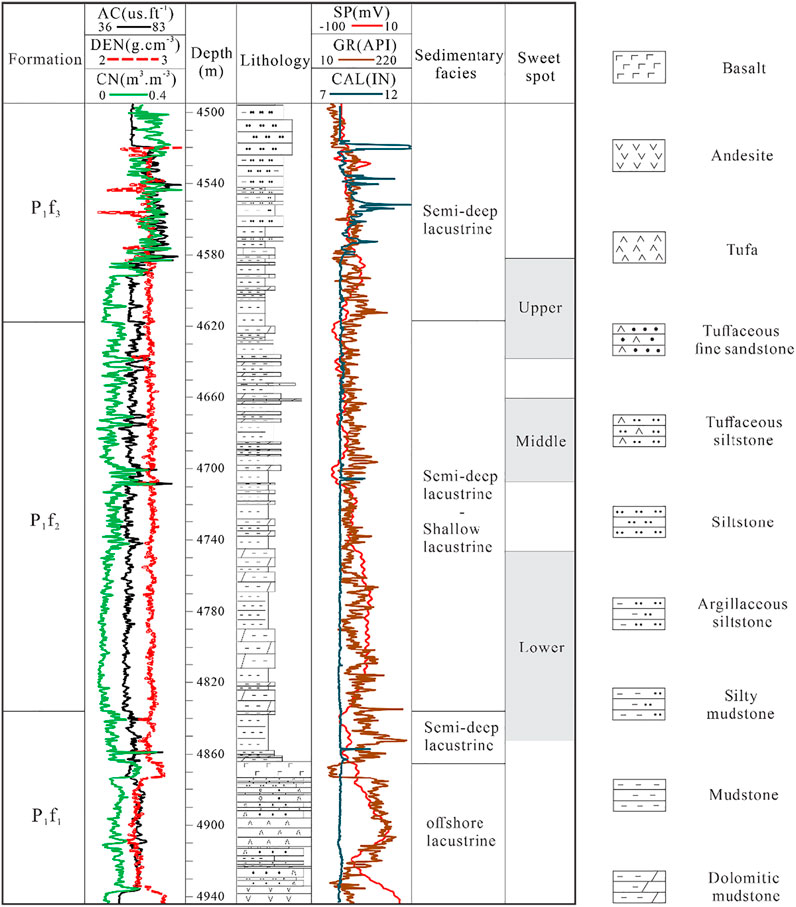
FIGURE 2. Generalized stratigraphic column of Fengcheng Formation in the Mahu Sag (Tang et al., 2021).
In a broad sense, rock failure generated under tectonic and non-tectonic processes in geological history can be called natural fractures (Zeng L. B. et al., 2010; Liu G. et al., 2021), including primary and secondary faults. Natural fractures in the continental shale oil reservoir of the Fengcheng Formation are multi-scale, and the rock stratum controls their distribution. The extension length varies from centimeter level to kilometer level, and its height varies from centimeter level to tens of meters level (Zhi et al., 2021b). Production practice shows that natural fractures of different scales have significantly different effects on shale oil reservoirs and oil and gas. Large-scale fractures usually affect the preservation of oil and gas, medium-small scale fractures control the seepage system of tight reservoirs, and micro-scale fractures mainly play the role of reservoirs (Zeng L. et al., 2010; Zeng et al., 2013; Liu et al., 2020a; Lyu et al., 2021; Liu et al., 2022). Due to the different roles of fractures at different scales, studying the development law of natural fractures at varying scales is necessary to guide the exploration and development of shale oil in the Mahu Sag more scientifically and effectively.
Some scholars have proposed different division schemes, and there are mainly three types. First, according to the fracture length and seismic wavelength, the fracture lengths greater than 1/4 of the seismic wavelength are called large-scale fractures, which can be distinguished in the post-stack section. The range of medium-scale fracture length is less than 1/4 seismic wavelength and larger than 1% seismic wavelength, which cannot be identified in the actual seismic profile. It is usually identified by seismic azimuth anisotropy technology and pre-stack attenuation attribute. Small-scale fractures are much smaller than 1% seismic wavelength, and their seismic reflection characteristics are weak, making it difficult to identify using seismic data (Chen et al., 2016; Dai et al., 2017; Wang et al., 2018). Second, according to the identifying data, fractures are divided into seismic scale, production dynamic data scale, logging scale, core scale, and BHI scale fractures (Strijker et al., 2012; Xue et al., 2014; Sun et al., 2019). Third, according to the contribution of fractures to reservoir physical properties or the performance characteristics of fractures in reservoir numerical simulation, fractures are divided into macroscopic, mesoscopic, and microscopic fractures (Liu et al., 2017; Su et al., 2019).
The fracture mentioned above scale classification is mainly based on the type of fracture identification data and the seepage effect of the fracture without considering its geological mechanism, which cannot reasonably reflect the development law of fractures of different scales. In order to better reflect the distribution law of fractures at different scales and their main controlling factors, this paper proposes to divide natural fractures into four scales, namely primary-secondary faults, large-scale fractures, medium-small scale fractures, and micro-scale fractures, according to the development scale and genesis of natural fractures.
The geological origin of the primary-secondary fault is usually closely related to the regional tectonic movement, and its strike extension generally exceeds thousands of kilometers. The strata do not control the longitudinal and lateral stretching. Such fractures are generally rare in core and well logs and usually require detection using post-stack seismic attributes. The large-scale fractures are jointly controlled by regional tectonic activities and the activities of the upper and lower walls of the main-secondary faults. The plane extension lengths range from 100 to 1000 m, and the fault distance is generally less than 20 m (Figure 3A). Medium-scale fractures are usually derived from primary and secondary fractures and large-scale fractures. The extension length is tens of meters to hundreds of meters on the plane, meters to ten m in the longitudinal direction, and the underground aperture is hundreds of microns (Figure 3B). The extension length of small-scale fractures is from meters to ten m on the plane, from decimeters to meters in the longitudinal direction, and the underground aperture is generally 50–100 μm (Figure 3C). Small-scale fractures are small in scale and high in density to be identified on the core and logging. Micro-scale fractures refer to small-scale fractures with a length of available centimeters or less, which need to be identified and observed with a microscope. The underground aperture is mainly less than 30 μm (Figure 3D). The scales of natural fractures predicted in this paper are primary-secondary faults, large-scale, medium-scale, and small-scale fractures. Due to the limited resolution of seismic data, micro-scale fractures are not predicted in this paper, and the relationship between the development strength of other levels of fractures is discussed.
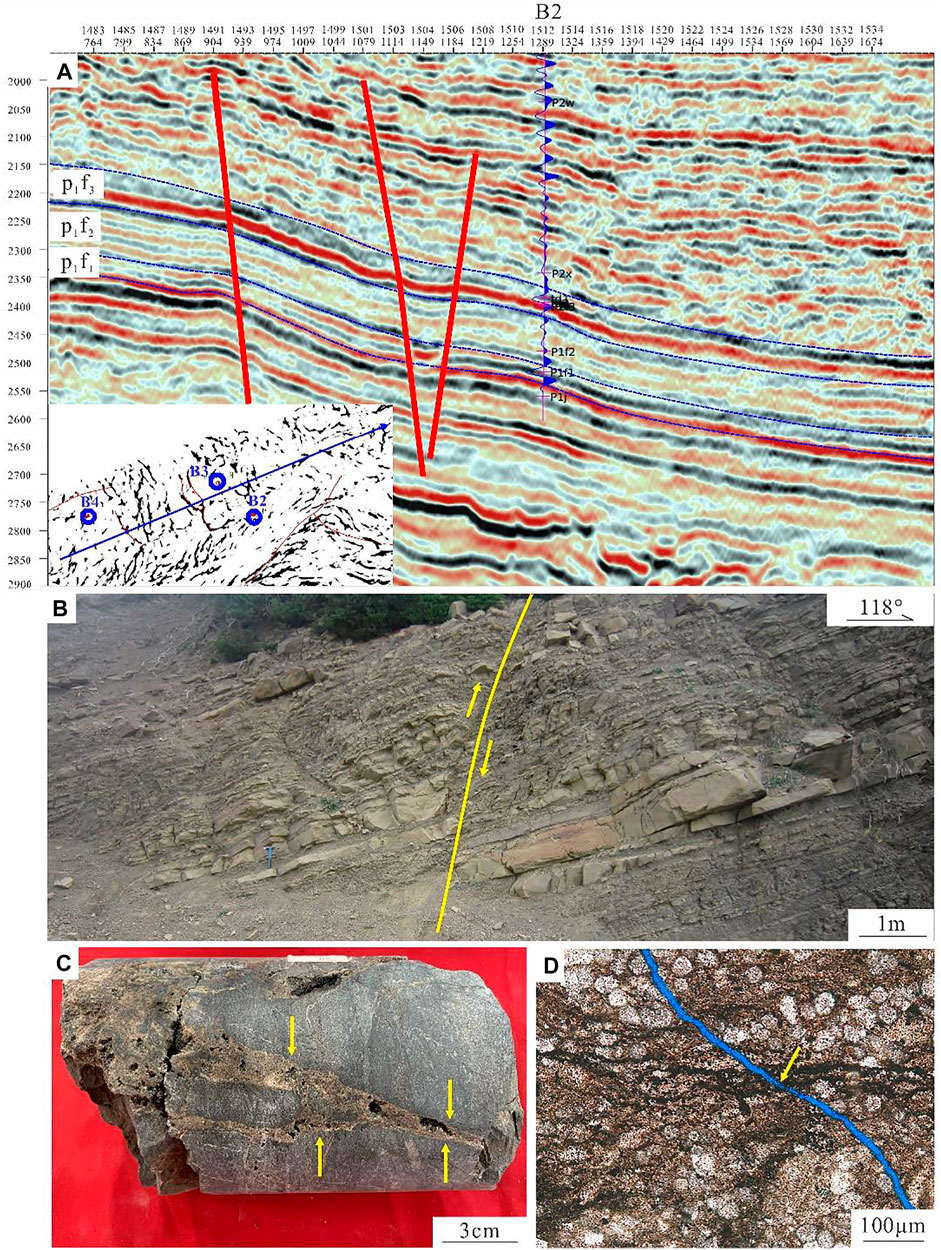
FIGURE 3. Schematic diagram of multi-scale fracture division. (A) Large-scale fractures, near NE-SW trending seismic profile in the study area. (B) Medium-scale fractures, Modified from Figure 15a in (Liu et al., 2020b). (C) Small-scale fractures, Well B3. (D) Micro-scale fractures, Well B2, buried depth 4598.61 m.
The main frequency and bandwidth of 3 days seismic data of Fengcheng Formation in the study area are 25HZ and 50HZ. The curvature, coherent, likelihood, and AVAz are selected to predict multi-scale fractures based on the multi-scale fracture classification scheme in the upper sweet spot segment. The curvature attribute and coherence attribute belong to the post-stack attribute. Due to the limited resolution, they only have great detection ability for primary and secondary faults. The likelihood attribute significantly improves the accuracy of fracture prediction compared with the traditional post-stack seismic attribute, and contains dip Angle and azimuth information, which can be used to detect large-scale fracture development zones. The prestack AVAz retains the offset and azimuth information, which further improves the prediction accuracy compared with the post-stack seismic attribute, and can be used for the detection of fracture zones with medium and small scales (Table 1). Finally, the comprehensive prediction results of the fracture system in the upper sweet spot of Fengcheng Formation in Mahu sag are obtained by the superimposition of prediction results of primary and secondary fractures, large-scale fractures, and small-scale fractures.
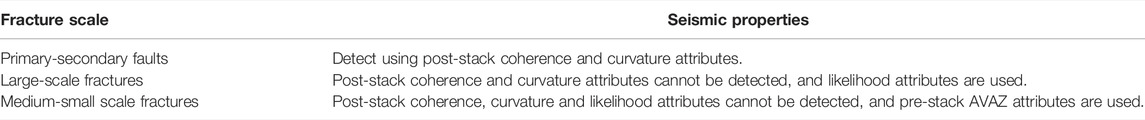
TABLE 1. Multi-scale natural fractures and their prediction methods.
The primary-secondary faults are large in scale, generally extend over thousands of kilometers in the strike, and rock formations do not control their longitudinal and lateral extension. The post-stack seismic attribute can have a good detection effect on the primary-secondary faults. This study uses the coherence attribute and curvature attribute to characterize the plane distribution law of the primary fault and secondary fault respectively.
The three-dimensional coherent data volume obtains the estimated value of three-dimensional seismic coherence by judging the longitudinal and lateral similarity of seismic waveforms within a certain time window, and mainly detecting the distribution characteristics of main faults through the coherent data volume (Randen et al., 2000; Zheng et al., 2009; Li et al., 2018).
The development of three-dimensional coherence technology has gone through three generations. The first generation of the correlation algorithm is based on the classical normalized cross-correlation algorithm (Bahorich and Farmer, 1995). For the data with a high signal-to-noise ratio, the apparent time dip of each channel in the X direction and Y direction can be approximately determined. For the seismic data with intense coherent noise, only two channels are used to estimate the apparent dip, which is greatly affected by coherent noise due to the influence of the cross-correlation algorithm. The second-generation similarity coefficient method is developed based on the first-generation correlation algorithm (Marfurt et al., 1998). By calculating the correlation of the analysis traces, a robust correlation estimate of the seismic reflection event can be obtained. In the third-generation eigenvalue method, the number and size of eigenvalues of covariance matrix C represent the number of degrees of freedom in the data daughter. The share of the maximum eigenvalue in the whole eigenvalue is the similarity of the sub-body (Gersztenkorn and Marfurt, 1999). This method has good anti-noise ability and higher resolution. This paper adopts the third-generation eigenvalue coherence algorithm, which can effectively reflect the distribution law of main faults.
For curvature calculation, the least square method is generally used to fit the quadric surface z (x, y) to obtain the surface coefficient, and then the curvature attribute can be calculated:
Curvature attributes mainly include minimum curvature, maximum curvature, principal curvature, most-positive curvature, most-negative curvature, dip curvature, strike curvature, curvedness and shape index (Chopra and Marfut, 2007).
The curvature attribute is the second-order derivative of the picked layer. In curvature analysis, the convex surface obtains the maximum curvature, while the concave surface obtains the minimum curvature. The Gaussian curvature is obtained by multiplying the two, and the high curvature value reflects a large number of structural fractures. During the process, the change of dip angle can be calculated, which has a good indication of fractures, and fractures develop in places where the dip angle changes significantly (Yin et al., 2014; Yang et al., 2015; Zheng et al., 2019). This technology integrates the calculation of seismic layer attributes and the degree of geological folds and realizes the calculation of reservoir curvature and dip angle attributes, which mainly belong to the prediction method of secondary faults.
Attributes such as coherence and curvature have sound prediction effects on primary-secondary fractures, but it is difficult to describe the specific information of large-scale fractures. As the fourth-generation attribute analysis method, the likelihood attribute method is a fracture imaging algorithm based on sample point processing (Hale, 2012). It is a statistical method based on the principle of maximum likelihood, and it is also the application of probability theory in seismic statistics. Its principle is based on the discontinuity of the seismic event axis, calculating the lowest similarity and event axis continuity of each point along with each group of strike and dip angles of the original seismic data. Compared with the traditional post-stack seismic attribute fracture prediction based on waveform similarity calculation, the prediction accuracy is significantly improved (Li et al., 2020). Therefore, large-scale fractures are predicted by the likelihood property.
The likelihood property expresses the possibility of the existence of a fracture, and the calculation principle is based on the similarity property (Li et al., 2020). The calculation of the likelihood attribute is divided into two steps. First, the similarity attribute semblance oriented to the identification of prominent fractures is calculated, namely:
where g is the 3D seismic data volume; (·)s represents the structural steering smoothing of the seismic data volume in brackets; [·]s represents the filtering along the fracture strike and dip to enhance the stability of the semblance attribute calculation. The high continuity of the stratum laterally causes the semblance property value to be close to 1 at most spatial locations, making it difficult to distinguish the possibility of fractures at different scales. In order to improve the contrast between different points, the likelihood attribute value is defined as:
It can be seen from the above formula that when the fractures are relatively developed, the continuity and similarity of seismic reflection decrease, and the likelihood increases. Otherwise, the likelihood property decreases. The original seismic data of the likelihood attribute contains information such as dip, azimuth, etc. The similarity value is calculated for each sampling point containing the dip and azimuth information, and only the minimum similarity value and the corresponding dip and azimuth values are retained for each point. At the same time, the likelihood attribute values in the line and track directions can be calculated according to the needs so that it can reflect the linear relationship of the fractures, which is beneficial in describing the fractures in different directions.
Compared with the post-stack method, the seismic data selected by the pre-stack technique retains the offset and azimuth information, and the prediction accuracy is further improved (Yu et al., 2019). In conventional seismic observations, directionally arranged fractures often exhibit macroscopic anisotropy characteristics. Therefore, the seismic detection of such fractures is based on the theory of seismic anisotropy. The anisotropic media currently studied are mainly transversely isotropic media, which can be divided into three categories according to the characteristics of the symmetry axis. The first category is transversely isotropic (VTI) with a vertical symmetry axis (Figure 4A). The second category is transverse isotropy (HTI) with a horizontal axis of symmetry (Figure 4B), and vertical fractures belong to this category. The third category is transverse isotropy (TTI) with an inclined axis of symmetry (Figure 4C) (Hudson, 1986; Thomsen, 1986, 1995; Hudson et al., 2001).
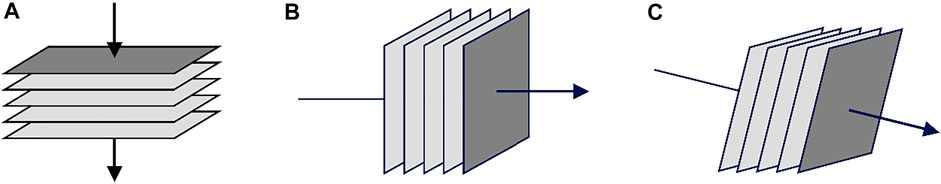
FIGURE 4. Anisotropic theoretical medium model. (A) VTI medium model. (B) HTI medium model. (C) TTI medium model.
Due to the compaction of the overlying strata in the Fengcheng Formation of the Mahu Sag, the horizontal or low-angle fractures almost disappeared. The high-angle and near-vertical fractures that are easy to preserve are the major contributors to fractured oil and gas reservoirs. Therefore, the isotropic media (HTI) with a horizontal symmetry axis is adopted. When seismic waves propagate in HTI media, their reflection amplitude, velocity, frequency, and attenuation are related to the azimuth of propagation (AVAz), that is, related to the direction and density of fractures. Applying this principle, the azimuthal seismic attributes such as amplitude, velocity, frequency, attenuation, etc. can be extracted from pre-stack seismic data to detect HTI or near-HTI fractures (Hudson, 1986; Thomsen, 1986, 1995; Hudson et al., 2001; Zhao et al., 2018). By optimizing the wide azimuth gathers in the study area, seismic calibration of the OVT gathers and analysis of the anisotropy characteristics are carried out, and the AVAz attributes are calculated to predict the distribution law of medium-small scale fractures. The AVAz pre-stack fracture prediction method has a strong ability to identify medium-small scale fractures, and the prediction results are more intuitive (Sun et al., 2014).
For the upper sweet spot of the Fengcheng Formation in the study area, the fracture distribution law represented by a single attribute is shown in Figure 5. Figure 5A shows the prediction results of coherence attributes of the upper sweet spot, in which the low-value area of coherence attributes. The pink area in the figure represents the primary fault development zone, which is distributed in the southern and central-eastern parts of the study area and is a nearly East-West trending reverse fault. Well B1-B5 are all located in the upper wall of the fault. The curvature attribute can better identify secondary faults. The red area in Figure 5B represents the curvature attribute’s high-value area, representing the secondary fault, and the blue area with a relatively low value represents the fault-related fracture development zone. The secondary faults are mainly in the near east-west trend and are distributed around the primary faults located in the southern and central parts of the study area. Well B1 and B2 are also in areas with high values of curvature attributes, reflecting that Well B1 and B2 are relatively close to secondary faults and have developed fault-related fractures.
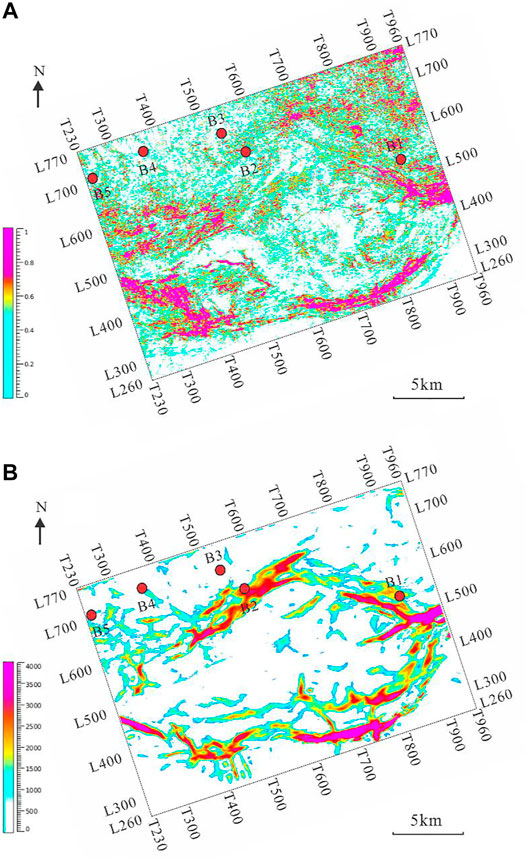
FIGURE 5. Prediction plane of primary and secondary faults with post-stack coherence properties and curvature properties of the upper sweet spot. (A) Coherence property plane of the upper sweet spot. (B) Curvature property plane of the upper sweet spot.
The original seismic data of the likelihood attribute contains information such as dip, azimuth, etc. The similarity value is calculated for each sampling point containing the dip and azimuth information, and only the minimum similarity value and the corresponding dip and azimuth values are retained for each point. The sub-azimuth likelihood attribute body can clearly describe the development of large-scale fractures in this area and accurately detect the boundary of the fracture zone. Figure 6 shows the prediction results of large-scale fractures with the likelihood attribute in different directions. The shade of the prediction result indicates the probability of large-scale fractures developing at the location. The darker the color (blue), the higher the probability of the existence of faults, and the lighter the color (green and yellow), the smaller the probability of the existence of fractures. The Likelihood property can predict the abnormal information that has not been detected in the coherent eigenvalue volume and the curvature volume and has a stronger ability to identify fractures.
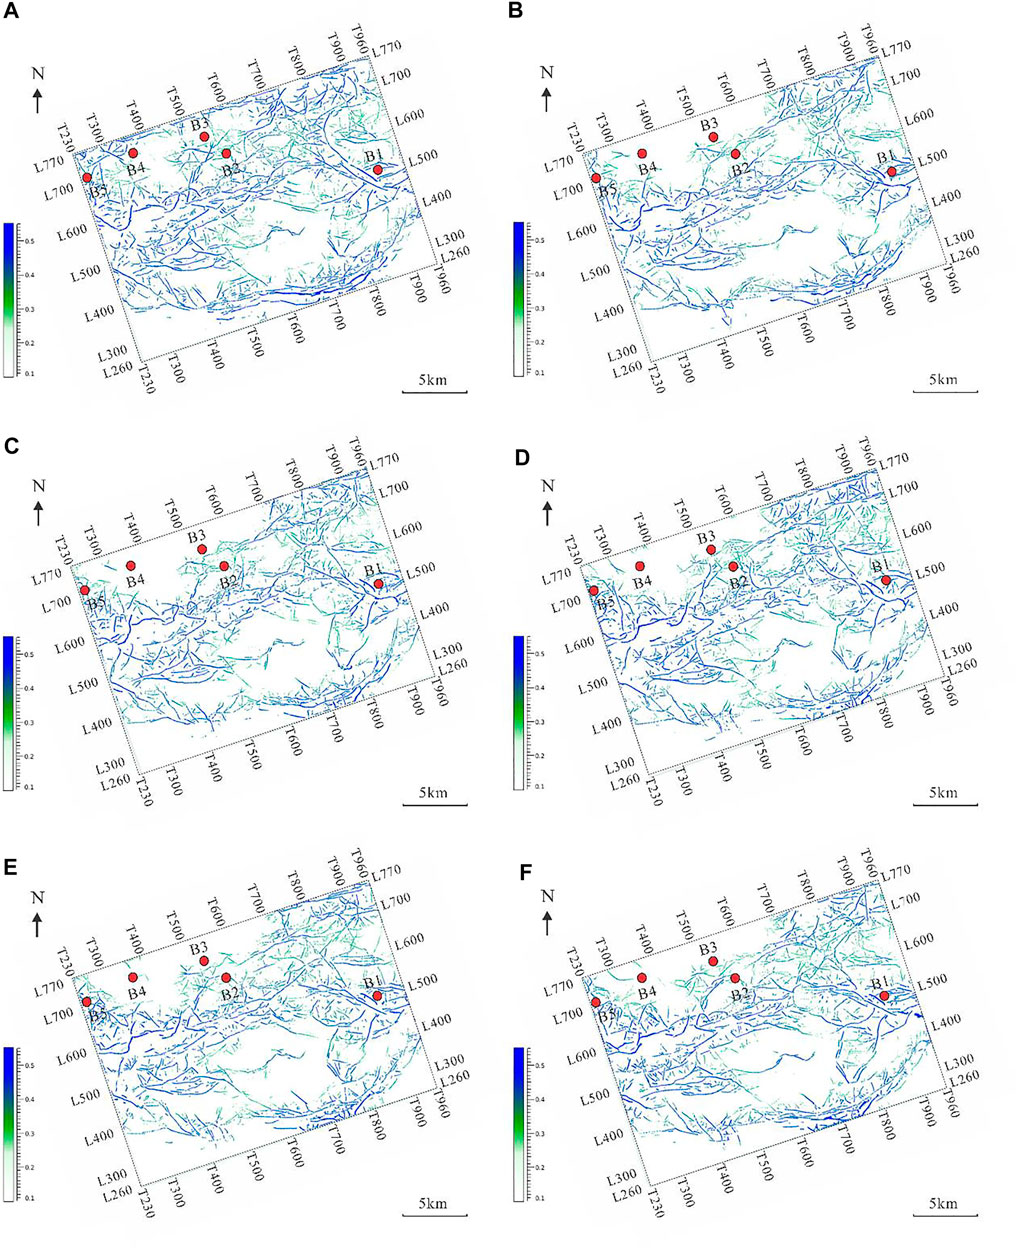
FIGURE 6. Plane view of fracture prediction of Likelihood attribute by azimuth in the upper sweet spot. (A) Azimuth 0°–30°. (B) Azimuth 31°–60°. (C) Azimuth 61°–90°. (D) Azimuth 91°–120°. (E) Azimuth 121°–150°. (F) Azimuth 150 °–180°.
According to the prediction results of the likelihood attribute of different azimuths, the large-scale fractures are most developed in the azimuth angle range of 0°–30°, mainly distributed in the central, northern, and southernmost parts of the study area, and more developed near Well B1 and B2 (Figure 6A). However, in the azimuth range of 31°–60° and 61°–90°, the number of large-scale fractures in the central and southernmost parts of the study area decreased compared with that in the 0°–30° range, while the number of large-scale fractures in the north is greatly reduced (Figures 6B,C). In the range of 91°–120°, the large-scale fractures in the central and southernmost parts of the study area increased compared with those in the range of 31°–90° but were still less than those in the range of 0°–30° (Figure 6D). In the range of 121°–150° and 151°–180°, the number of large-scale fractures is slightly reduced compared with 90°–120° (Figures 6E,F). According to the above analysis, large-scale fractures in the upper sweet spot of the Fengcheng Formation in the study area are mainly distributed in the central, northern, and southernmost parts of the study area. And they have the most developed near East-West trend, followed by near north-south trend, and the least in Northeast southwest trend. Well B1 and B2 are large-scale fracture development areas, and the large-scale fracture development near Well B4 is relatively low.
Due to the relatively large scale and a small number of primary-secondary faults and large-scale fractures, the probability of encountering such fractures in vertical wells is small. It is generally difficult to identify them on a single well using core and logging data, which can be detected and characterized by three-dimensional post-stack seismic attributes (Lyu et al., 2021). The scale of medium-small scale fractures is relatively small, and the number is large, which can be identified on a single well through core and logging data. Therefore, in this paper, the pre-stack AVAz fracture prediction results are compared with the fracture interpretation results of typical well imaging logging to verify the accuracy of the identification results of medium-small scale fractures.
According to the fracture interpretation results of imaging logging in Well B2 in the study area, the medium-small scale fractures in the upper sweet spot of the Fengcheng Formation in Well B2 are mainly in the near-EW trend, followed by the near-N-S trend. The fracture density is significantly higher than that in other layers of the Fengcheng Formation (Figure 7). In the Well B2-B3 fracture strength profile obtained by the pre-stack AVAz method, the red area represents the area with the largest fracture strength, and the yellow and blue areas represent the area with small fracture strength (Figure 8). By comparing the fracture strength profile with the imaging logging interpretation results of Well B2, the fracture strength in the upper sweet spot of the Well B2-B3 profile in the study area is relatively strong, consistent with the imaging logging interpretation results of Well B2.
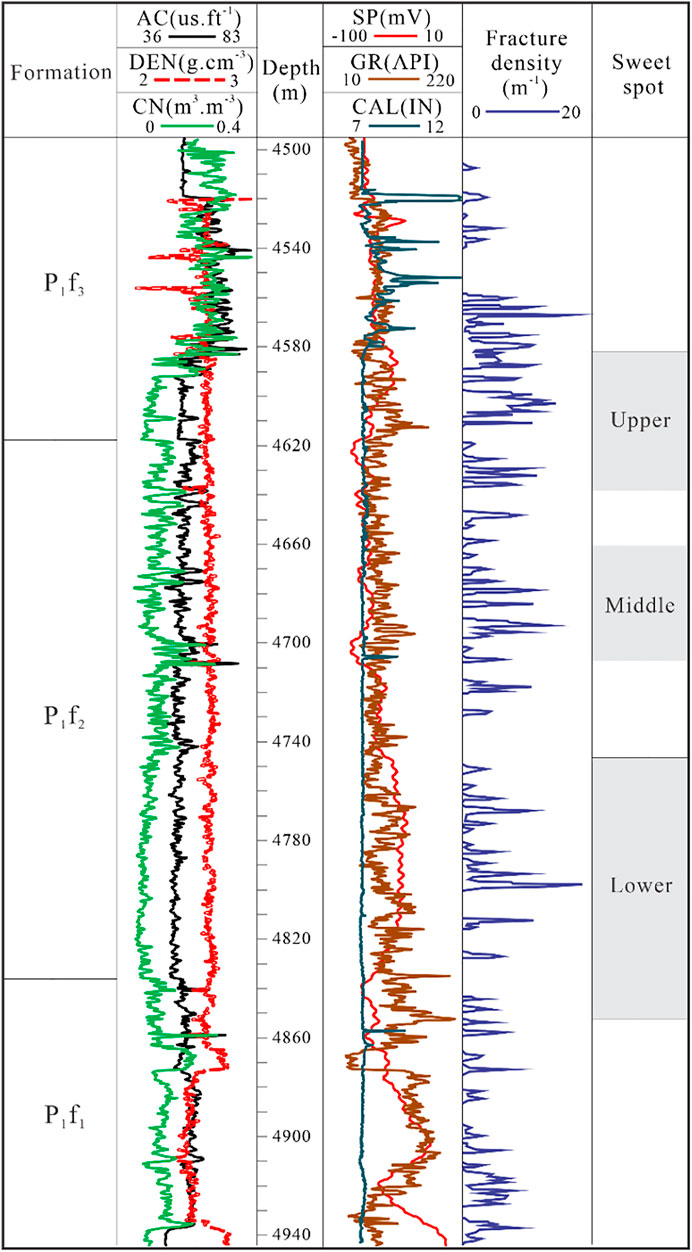
FIGURE 7. Histogram of fracture identification in the upper sweet spot of well B2.
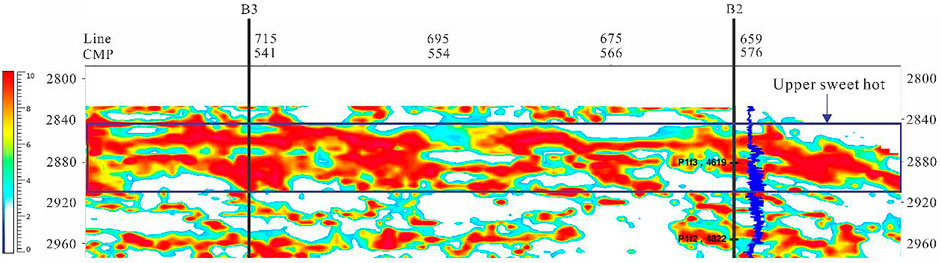
FIGURE 8. Well B3-B2 fracture strength profile.
The strength and orientation of medium-small scale fractures in the upper sweet spot of the Fengcheng Formation in the study area are superimposed to obtain a superimposed plane of fracture intensity and orientation. Red represents the area with high fracture strength. It can be seen from Figure 9 that the overall fracture development strength of the upper sweet spot in the Fengcheng Formation is large, especially in the local areas of the northern and central platform area and the local areas close to the primary fault in the south. The fractures are mainly in the near east-west trend, approximately parallel to the main fault trend. Among them, the northwest direction of Well B2 is the fracture development area, the area between B2 and B3 is the relatively developed fracture area, and the area near B4 is the weakly developed fracture area.
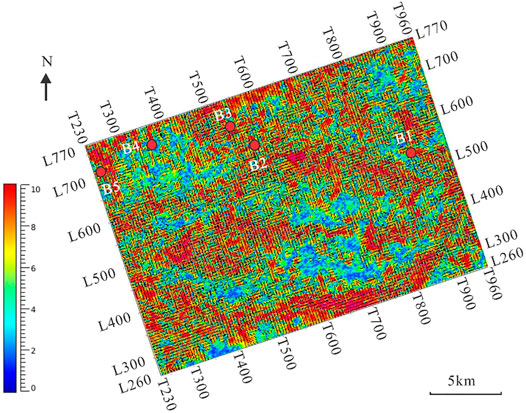
FIGURE 9. Superposition plane of pre-stack AVAZ fracture strength and orientation in the upper sweet spot.
According to the prediction results of the primary-secondary faults in the upper sweet spot of the Fengcheng Formation in the study area and the interpretation results of medium-small scale fractures in typical well imaging logging, the development intensity of medium-small scale fractures is closely related to the primary-secondary faults. As the distance from the primary-secondary fracture increases, the strength of medium-small scale fractures decreases gradually (Figure 10). There is a fracture development zone near the primary-secondary fault, that is, the fault damage zone (Torabi and Berg, 2011). The width of the fault damage zone is related to the size of the primary-secondary fault. With the increase of the primary-secondary fault scale, the width of the fault failure zone gradually increases. Secondly, due to faults’ control of fracture development, the degree of fracture development in different fault locations is also different. Usually, the fractures in the upper plate are more developed than those in the lower plate. The fractures at the end of the fault are more developed than in the middle, and the fractures at the intersection of the faults and the overlapping of the en-echelon fault are more developed.
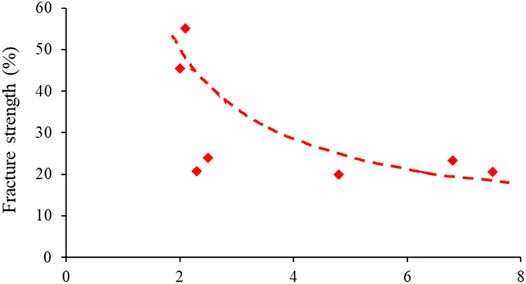
FIGURE 10. Intersection diagram of distance from well to fault and fracture strength.
The post-stack attributes can reflect primary-secondary faults and large-scale fracture development zones, and the pre-stack AVAZ algorithm prediction results reflect small-scale fracture development zones. By superimposing the primary-secondary fault prediction plane of curvature attribute and the large-scale fracture prediction plane of likelihood attribute, the primary-secondary fault strikes in the upper sweet spot of the Fengcheng Formation in the Mahu Sag are nearly E-W and distributed in the central and southernmost parts of the study area. Among them, Well B1 and B2 are close to the faults in the central part of the study area. The strike of large-scale fractures is mainly near E-W, which is roughly parallel to the main-secondary fault, followed by near north-south. The fractures are mainly developed near the primary-secondary faults, which are fault-related fractures caused by the activities of the upper and lower plates of the primary-secondary faults and the action of the regional stress field. Large-scale fractures are developed in the study area. The large-scale fracture development zones in the middle and southernmost of the study area are wider and more developed locally, especially near Well B1 and B2 (Figure 11A).
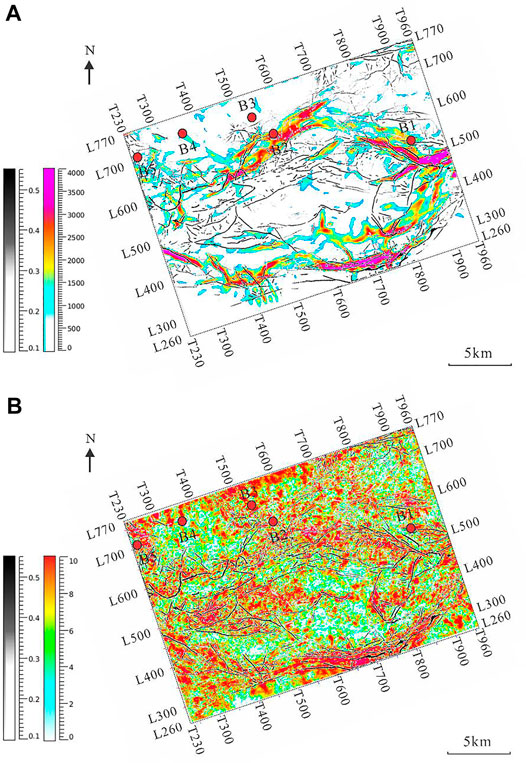
FIGURE 11. The superposition plane of the upper sweet spot segment before and after stacking. (A) The superimposed plane of the likelihood attribute and curvature attribute. (B) The superimposed plane of pre-stack fracture strength and Likelihood attribute.
The superposition of the large-scale fracture prediction plane of the likelihood attribute and the small-scale fracture prediction plane of the pre-stack AVAZ method shows that the medium-small scale fractures are relatively developed in the study area. The fracture strength is the largest, especially in the large-scale fracture development zone and nearby. The strike is mainly in the near east-west and northwest directions, approximately parallel and oblique to the large-scale fracture and the primary-secondary fault. Among them, large-scale and medium-small scale fractures are weakly developed near B4 in the northern part of the study area, and the area between Well B3 and B1 is the fracture development area. The platform area in the middle of the study area and the southernmost area near the primary-secondary faults are large-scale and medium-small scale fracture development areas. Most of the fractures are in the direction of the maximum horizontal principal stress (Figure 11B).
The faults and fractures in continental shale oil reservoirs of the Permian Fengcheng Formation in the Mahu Sag of the Junggar Basin can be divided into four grades, including primary-secondary faults, large-scale fractures, medium-small scale fractures, and micro-scale fractures. Based on pre-stack and post-stack seismic attributes, primary-secondary faults, large-scale fractures, and medium-small scale fractures can be predicted. Post-stack coherence and curvature attributes are used to predict primary-secondary faults, post-stack likelihood attributes are used to predict large-scale fractures, and pre-stack AVAZ is used to predict medium-small scale fractures. A comprehensive prediction method of fracture development system based on pre-stack and post-stack seismic attributes has been formed. Four conclusions are listed below:
(1) the primary-secondary faults in the upper sweet spot of the Fengcheng Formation are distributed in the southern and central-eastern parts of the study area, which are near E-W trending reverse faults.
(2) The large-scale fractures are mainly distributed in the central, northern, and southernmost parts of the study area, and their strikes are mainly near E-W, followed by near N-S.
(3) Medium-small scale fractures are developed in the whole study area, especially near Well B3 to Well B1 in the north, the central platform area, and the primary-secondary fault area in the south.
(4) Large scale fractures and medium-small scale fractures are fault-related fractures, which are developed around primary-secondary faults. Their strikes are mainly near E-W, parallel or oblique to the strikes of main secondary faults. With the increase in distance from the primary-secondary fractures, the fracture strength of medium-small scale fractures decreases gradually.
The raw data supporting the conclusions of this article will be made available by the authors, without undue reservation.
Conceptualization: XW, ZJ, LZ, and GPL; methodology: GC, MP, and GQL; formal analysis: LH, and ZW; writing-original draft preparation: XW, GPL, and XD; and writing-review and editing: ZJ, GPL, and XD.
This paper is supported by the National Natural Science Foundation of China (No.42090025).
Authors XW, GC, MP, LH, and ZW were employed by the company PetroChina Xinjiang Oilfield Company.
The remaining authors declare that the research was conducted in the absence of any commercial or financial relationships that could be construed as a potential conflict of interest.
All claims expressed in this article are solely those of the authors and do not necessarily represent those of their affiliated organizations, or those of the publisher, the editors and the reviewers. Any product that may be evaluated in this article, or claim that may be made by its manufacturer, is not guaranteed or endorsed by the publisher.
We are particularly grateful to the Editor and reviewers for their constructive comments, which contributed significantly to the improvement of this manuscript.
Bahorich, M., and Farmer, S. (1995). 3-D Seismic Discontinuity for Faults and Stratigraphic Features: The Coherence Cube. Lead. Edge. 14 (10), 1053–1058. doi:10.1190/1.188752310.1190/1.1437077
Cao, J., Lei, D. W., Li, Y. W., Tang, Y., AbulimitChang, Q. S., and Wang, T. T. (2015). Ancient High-Quality Alkaline Lacustrine Source Rocks Discovered in the Lower Permian Fengcheng Formation, Junggar Basin. Acta Pet. Sin. 36 (7), 781–790. doi:10.7623/syxb201507002
Chen, S.-Q., Zeng, L.-B., Huang, P., Sun, S.-H., Zhang, W.-L., and Li, X.-Y. (2016). The Application Study on the Multi-Scales Integrated Prediction Method to Fractured Reservoir Description. Appl. Geophys. 13 (1), 80–92. doi:10.1007/s11770-016-0531-7
Chopra, S., and Marfurt, K. (2007). Curvature Attribute Applications to 3D Surface Seismic Data. Lead. Edge. 26 (4), 404–414. doi:10.1190/1.2723201
Dai, R. X., Ran, Q., Guan, X., Liang, H., Yu, Y., and Wu, Y. Y. (2017). A Comprehensive Seismic Method for Multi-Scale Fracture Prediction: A Case Study on Lower Cambrian Longwangmiao Formation Gas Reservoir, Central Sichuan Basin. Nat. Gas Explor. Dev. 40 (2), 38–44. doi:10.12055/gaskk.issn.1673-3177.2017.02.007
Gersztenkorn, A., and Marfurt, K. J. (1999). Eigenstructure‐based Coherence Computations as an Aid to 3-D Structural and Stratigraphic Mapping. Geophysics 64 (5), 1468–1479. doi:10.1190/1.1444651
Gong, L., Fu, X., Wang, Z., Gao, S., Jabbari, H., Yue, W., et al. (2019). A New Approach for Characterization and Prediction of Natural Fracture Occurrence in Tight Oil Sandstones with Intense Anisotropy. Bulletin 103 (6), 1383–1400. doi:10.1306/12131818054
Gong, L., Gao, S., Liu, B., Yang, J., Fu, X., Xiao, F., et al. (2021a2021). Quantitative Prediction of Natural Fractures in Shale Oil Reservoirs. Geofluids 2021, 1–15. doi:10.1155/2021/5571855
Gong, L., Wang, J., Gao, S., Fu, X., Liu, B., Miao, F., et al. (2021b). Characterization, Controlling Factors and Evolution of Fracture Effectiveness in Shale Oil Reservoirs. J. Petroleum Sci. Eng. 203, 108655. doi:10.1016/j.petrol.2021.108655
Hale, D. (2012). Fault Surfaces and Fault Throws from 3D Seismic Images. Seg. Tech. program Expand. Abstr. 2012, 1–6. Soc. Explor. Geophysicists. doi:10.1190/segam2012-0734.1
Hu, S. Y., Zhao, W. Z., Hou, L. H., Yang, Z., Zhu, R. K., Wu, S. T., et al. (2020). Development Potential and Technical Strategy of Continental Shale Oil in China. Pet. Explor. Dev. 47 (4), 819–828. doi:10.1016/S1876-3804(20)60103-3
Hudson, J. A. (1986). A Higher Order Approximation to the Wave Propagation Constants for a Cracked Solid. Geophys. J. Int. 87 (1), 265–274. doi:10.1111/j.1365-246X.1986.tb04556.x
Hudson, J. A., Pointer, T., and Liu, E. (2001). Effective-medium Theories for Fluid-Saturated Materials with Aligned Cracks. Geophys. Prospect. 49 (5), 509–522. doi:10.1046/j.1365-2478.2001.00272.x
Jiang, Z. X., Zhang, W. Z., Liang, C., W, Y. S., Liu, H. M., and Chen, X. (2014). Characteristics and Evaluation Elements of Shale Oil Reservoir. Acta Geol. Sin. 35 (1), 184–196. doi:10.7623/syxb201401024
Jin, Z. J., Bai, Z. R., Gao, B., and Li, M. W. (2019). Has China Ushered in the Shale Oil and Gas Revolution? Oil Gas. Geol. 40 (3), 451–458. doi:10.11743/ogg20190301
Jin, Z. J., Zhu, R. K., Liang, X. P., and Shen, Y. Q. (2021). Several Issues Worthy of Attention in Current Lacustrine Shale Oil Exploration and Development. Pet. explor. Dev. 48 (6), 1276–1287. doi:10.1016/S1876-3804(21)60303-8
Ju, W., Li, Z., Sun, W., and Xu, H. (2018). In-situ Stress Orientations in the Xiagou Tight Oil Reservoir of Qingxi Oilfield, Jiuxi Basin, Northwestern China. Mar. Petroleum Geol. 98, 258–269. doi:10.1016/j.marpetgeo.2018.08.020
Ju, W., and Sun, W. (2016). Tectonic Fractures in the Lower Cretaceous Xiagou Formation of Qingxi Oilfield, Jiuxi Basin, NW China. Part Two: Numerical Simulation of Tectonic Stress Field and Prediction of Tectonic Fractures. J. Petroleum Sci. Eng. 146, 626–636. doi:10.1016/j.petrol.2016.05.002
Lei, D. W., Chen, G. Q., Liu, H. L., Li, X., Abulimit, , Tao, K. Y., et al. (2017). Forming Conditions and Explo Ration Fields of the Mahu Giant Oil (Gas) Province, Junggar Basin. Acta Geol. Sin. 91 (7), 1604–1619. cnki:sun:dzxe.0.2017-07-013.
Li, M., Shang, X. F., Zhao, H. W., Wu, S., and Duan, T. Z. (2020). Prediction of Fractures in Tight Gas Reservoirs Based on Likelihood Attribute A Case Study of the 2d Member of Xujiahe Formation in Xinchang Area, Western Sichuan Depression, Sichuan Basin. Oil Gas. Geol. 41 (6), 1299–1309. doi:10.11743/ogg20200618
Li, T. T., Hou, S. Y., Ma, S. Z., and Li, D. L. (2018). Overview and Research Progress of Fault Identification Method. Prog. Geophys. 33 (4), 1507–1514. doi:10.6038/pg2018BB0311
Liang, Z. Q. (2019). Poststack Seismic Prediction Techniques for Fractures of Different Scales. Geophys. Prospect. Petroleum. 58 (5), 766–772. doi:10.3969/j.issn.1000-1441.2019.05.016
Liu, G., Zeng, L., Sun, G., Zu, K., Qin, L., Mao, Z., et al. (2020a). Natural Fractures in Tight Gas Volcanic Reservoirs and Their Influences on Production in the Xujiaweizi Depression, Songliao Basin, China. Bulletin 104 (10), 2099–2123. doi:10.1306/05122017169
Liu, G., Zeng, L., Wang, X., Ostadhassan, M., Wang, Z., Mao, Z., et al. (2020b). Natural Fractures in Deep Tight Gas Sandstone Reservoirs in the Thrust Belt of the Southern Junggar Basin, Northwestern China. Interpretation 8 (4), SP81–SP93. doi:10.1190/int-2020-0051.1
Liu, G., Zeng, L., Zhu, R., Gong, L., Ostadhassan, M., and Mao, Z. (2021a). Effective Fractures and Their Contribution to the Reservoirs in Deep Tight Sandstones in the Kuqa Depression, Tarim Basin, China. Mar. Petroleum Geol. 124, 104824. doi:10.1016/j.marpetgeo.2020.104824
Liu, J., Ding, W., Yang, H., and Liu, Y. (2021b). Quantitative Multiparameter Prediction of Fractured Tight Sandstone Reservoirs: A Case Study of the Yanchang Formation of the Ordos Basin, Central China. SPE J. 26 (05), 3342–3373. doi:10.2118/205495-PA
Liu, J., Ding, W., Yang, H., Wang, R., Yin, S., Li, A., et al. (2017). 3D Geomechanical Modeling and Numerical Simulation of In-Situ Stress Fields in Shale Reservoirs: A Case Study of the Lower Cambrian Niutitang Formation in the Cen'gong Block, South China. Tectonophysics 712-713, 663–683. doi:10.1016/j.tecto.2017.06.030
Liu, J., Yang, H., Xu, K., Wang, Z., Liu, X., Cui, L., et al. (2022). Genetic Mechanism of Transfer Zones in Rift Basins: Insights from Geomechanical Models. GSA Bull. doi:10.1130/B36151.1
Lyu, W. Y., Zeng, L. B., Chen, S. Q., Lyu, P., Dong, S. Q., Hui, C., et al. (2021). Characterization Methods of Multi-Scale Natural Fractures in Tight and Low-Permeability Sandstone Reservoirs. Geol. Rev. 67 (2), 543–556. doi:10.16509/j.georeview.2021.02.020
Marfurt, K. J., Kirlin, R. L., Farmer, S. L., and Bahorich, M. S. (1998). 3-D Seismic Attributes Using a Semblance‐based Coherency Algorithm. Geophysics 63 (4), 1150–1165. doi:10.1190/1.1444415
Randen, T., Monsen, E., Signer, C., Abrahamsen, A., Hansen, J. O., Sæter, T., et al. (2000). Three-dimensional Texture Attributes for Seismic Data Analysis. Seg. Tech. Program Expand. Abstr., 668–671. doi:10.1190/1.1816155
Rüger, A., and Tsvankin, I. (1997). Using AVO for Fracture Detection: Analytic Basis and Practical Solutions. Lead. edge. 16 (10), 1429–1434. doi:10.1190/1.1437466
Strijker, G., Bertotti, G., and Luthi, S. M. (2012). Multi-scale Fracture Network Analysis from an Outcrop Analogue: A Case Study from the Cambro-Ordovician Clastic Succession in Petra, Jordan. Mar. Petroleum Geol. 38 (1), 104–116. doi:10.1016/j.marpetgeo.2012.07.003
Su, H., Lei, Z. D., Li, J. C., Gong, B., Zhao, W. Q., Ju, B. S., et al. (2019). An Effective Numerical Simulation Model of Multi-Scale Fractures in Reservoir. Acta Geol. Sin. 40 (5), 587–593+634. doi:10.7623/syxb201905008
Sun, S., Zhao, S. X., Hou, J. G., Zhou, Y. B., Song, S. H., and He, Y. F. (2019). Hierarchical Modeling of Multi-Scale Fractures in Tight Sandstones: A Case Study of the Eighth Member of the Yanchang Formation in Wellblock 92 of the Honghe Oilfield. Pet. Sci. Bull. 4 (1), 11–26. doi:10.3969/j.issn.2096-1693.2019.01.002
Sun, W., Li, Y. F., Fu, J. W., and Li, T. Y. (2014). Review of Fracture Identification with Well Logs and Seismic Data. Prog Geophys. 29 (3), 1231–1242. doi:10.6038/pg20140332
Tang, Y., Cao, J., He, W.-J., Guo, X.-G., Zhao, K.-B., and Li, W.-W. (2021). Discovery of Shale Oil in Alkaline Lacustrine Basins: The Late Paleozoic Fengcheng Formation, Mahu Sag, Junggar Basin, China. Petroleum Sci. 18 (5), 1281–1293. doi:10.1016/j.petsci.2021.04.001
Tang, Y., Guo, W. J., Wang, X. T., Bao, H. J., and Wu, H. S. (2019). A New Breakthrough in Exploration of Large Conglomerate Oil Province in Mahu Sag and its Implications Xinjiang Petrol. Geol 40 (2), 127–137. doi:10.1016/j.petsci.2021.04.001
Thomsen, L. (1995). Elastic Anisotropy Due to Aligned Cracks in Porous Rock1. Geophys. Prospect. 43 (6), 805–829. doi:10.1111/j.1365-2478.1995.tb00282.x
Torabi, A., and Berg, S. S. (2011). Scaling of Fault Attributes: A Review. Mar. Petroleum Geol. 28 (8), 1444–1460. doi:10.1016/j.marpetgeo.2011.04.003
Wang, L.-L., Wei, J.-X., Huang, P., Di, B.-R., and Zhang, F.-H. (2018). Seismic Prediction Method of Multiscale Fractured Reservoir. Appl. Geophys. 15 (2), 240–252. doi:10.1007/s11770-018-0667-8
Wang, S., Wang, G., Huang, L., Song, L., Zhang, Y., Li, D., et al. (2021). Logging Evaluation of Lamina Structure and Reservoir Quality in Shale Oil Reservoir of Fengcheng Formation in Mahu Sag, China. Mar. Petroleum Geol. 133 (1), 105299–99. doi:10.1016/j.marpetgeo.2021.105299
Xue, Y. M., Xia, D. L., Su, Z. F., Wu, X. W., and Ji, S. Z. (2014). Fracture Modeling at Different Scales Based on Convergent Multi-Source Information. J. Southwest Pet. Univ. 36 (2), 57–63. doi:10.11885/j.issn.1674-5086.2012.08.30.11
Yang, G. Q., Liu, Y. L., and Zhang, H. W. (2015). The Calculation Method of Curvature Attributes and its Effect Analysis. Prog. Geophys. 30 (5), 2282–2286. doi:10.6038/pg20150540
Yin, X. Y., Gao, J. H., and Zong, Z. Y. (2014). Curvature Attribute Based on Dip Scan with Eccentric Window. Chin. J. Geopyhsics. 57 (10), 3411–3421. doi:10.6038/cjg20141027
Yu, X. D., Gui, Z. X., Wang, Y., and Wang, J. L. (2019). Prestack AVAZ Fracture Prediction Applied in Chepaizi Uplif. Oil Geophys. Prospect. 54 (3), 624–633. doi:10.13810/j.cnki.issn.1000-7210.2019.03.016
Zeng, L. B., Gong, L., Guan, C., Zhang, B. J., Wang, Q., Zeng, Q. Q., et al. (2022). Natural Fractures and Their Contribution to Tight Gas Conglomerate Reservoirs: A Case Study in the Northwestern Sichuan Basin, China. J. Pet. Sci. Eng. 210, 110028. doi:10.1155/2021/557185510.1016/j.petrol.2021.110028
Zeng, L. B., Ke, S. Z., and Liu, Y. (2010a). Low Permeability Reservoir Fracture Research Method. Bei Jing: Petrol. Beijing: Ind. Press.
Zeng, L., Lyu, W., Zhang, Y., Liu, G., and Dong, S. (2021). The Effect of Multi-Scale Faults and Fractures on Oil Enrichment and Production in Tight Sandstone Reservoirs: A Case Study in the Southwestern Ordos Basin, China. Front. Earth Sci. 9 (2), 94. doi:10.3389/feart.2021.664629
Zeng, L., Su, H., Tang, X., Peng, Y., and Gong, L. (2013). Fractured Tight Sandstone Oil and Gas Reservoirs: A New Play Type in the Dongpu Depression, Bohai Bay Basin, China. Bulletin 97 (3), 363–377. doi:10.1306/09121212057
Zeng, L., Wang, H., Gong, L., and Liu, B. (2010b). Impacts of the Tectonic Stress Field on Natural Gas Migration and Accumulation: A Case Study of the Kuqa Depression in the Tarim Basin, China. Mar. Petroleum Geol. 27 (7), 1616–1627. doi:10.1016/j.marpetgeo.2010.04.010
Zhang, Y. Y., Li, W., and Tang, W. B. (2018). Tectonic Setting and Environment of Alkaline Lacustrine Source Rocks in the Lower Permian Fengcheng Formation of Mahu Sag Xinjiang Petrol. Geol 39 (1), 48–54. doi:10.7657/XJPG20180106
Zhang, Z. J., Yuan, X. J., Wang, M. S., Zhou, C. M., Tang, Y., Chen, X. Y., et al. (2018). Alkaline-lacustrine Deposition and Paleoenvironmental Evolution in Permian Fengcheng Formation at the Mahu Sag, Junggar Basin, NW China. Pet. explor. Dev. 45 (6), 972–984. doi:10.11698/ped.2018.06.0510.1016/s1876-3804(18)30107-1
Zhao, W., Hu, S., Hou, L., Yang, T., Li, X., Guo, B., et al. (2020). Types and Resource Potential of Continental Shale Oil in China and its Boundary with Tight Oil. Petroleum Explor. Dev. 47 (1), 1–11. doi:10.1016/S1876-3804(20)60001-5
Zhao, W. T., Jing, T. Y., Bai, J. Y., Sun, Y., and Zhao, M. (2018). AVAZ Inversion Methord Based on Full Azimuth Seismic Data. Prog. Geophys. 33 (3). doi:10.6038/pg2018BB0180
Zheng, J. J., Yin, X. Y., and Zhang, G. Z. (2019). Multi-scale Analysis Technique Based on Curvelet Transform. Oil Geophys. Prospect. 44 (5), 543–547. doi:10.3321/j.issn:1000-7210.2009.05.004
Zhi, D. M., Song, Y., He, W. J., Jia, X. Y., Zou, Y., and Huang, L. L. (2019). Geological Characteristics, Resource Potential and Exploration Direction of Shale Oil in Middle-Lower Permian, Junggar Basin. Xinjiang Pet. Geol. 40 (4), 389–401. doi:10.7657/xjpg20190402
Zhi, D. M., Tang, Y., He, W. J., Guo, X. G., Zheng, M. L., and Huang, L. L. (2021b). Orderly Coexistence and Accumulation Models of Conventional and Unconventional Hydrocarbons in Lower Permian Fengcheng Formation, Mahu Sag, Junggar Basin Petrol. Explor. Dev. 48 (1), 38–51. doi:10.1016/S1876-3804(21)60004-6
Zhi, D. M., Tang, Y., Zheng, M. L., Guo, W. J., Wu, T., and Zou, Z. W. (2018). Discovery, Distribution and Exploration Practice of Large Oil Provinces of Above-Source Conglomerate in Mahu Sag. Xinjiang Pet. Geol. 39 (1), 1–8+22. doi:10.7657/xjpg20180101
Keywords: multi-scale natural fractures, prediction methods, distribution law, continental shale, Mahu Sag
Citation: Wang X, Jin Z, Chen G, Peng M, Huang L, Wang Z, Zeng L, Lu G, Du X and Liu G (2022) Multi-Scale Natural Fracture Prediction in Continental Shale Oil Reservoirs: A Case Study of the Fengcheng Formation in the Mahu Sag, Junggar Basin, China. Front. Earth Sci. 10:929467. doi: 10.3389/feart.2022.929467
Received: 26 April 2022; Accepted: 09 May 2022;
Published: 23 May 2022.
Edited by:
Wei Ju, China University of Mining and Technology, ChinaReviewed by:
Jingshou Liu, China University of Geosciences Wuhan, ChinaCopyright © 2022 Wang, Jin, Chen, Peng, Huang, Wang, Zeng, Lu, Du and Liu. This is an open-access article distributed under the terms of the Creative Commons Attribution License (CC BY). The use, distribution or reproduction in other forums is permitted, provided the original author(s) and the copyright owner(s) are credited and that the original publication in this journal is cited, in accordance with accepted academic practice. No use, distribution or reproduction is permitted which does not comply with these terms.
*Correspondence: Guoping Liu, liugp0621@pku.edu.cn
Disclaimer: All claims expressed in this article are solely those of the authors and do not necessarily represent those of their affiliated organizations, or those of the publisher, the editors and the reviewers. Any product that may be evaluated in this article or claim that may be made by its manufacturer is not guaranteed or endorsed by the publisher.
Research integrity at Frontiers
Learn more about the work of our research integrity team to safeguard the quality of each article we publish.