
94% of researchers rate our articles as excellent or good
Learn more about the work of our research integrity team to safeguard the quality of each article we publish.
Find out more
ORIGINAL RESEARCH article
Front. Earth Sci. , 06 January 2023
Sec. Biogeoscience
Volume 10 - 2022 | https://doi.org/10.3389/feart.2022.929271
 Lucas De La Maza1,2
 Laura Farías1,2,3,4*
Hypoxia is a phenomenon where dissolved oxygen (DO) is reduced to levels that are low enough to strongly affect ecological and biogeochemical processes. This occurs within the continental shelf off central Chile (36°S), influenced by seasonal coastal upwelling (Spring-Summer). Monthly measurements of DO and other oceanographic variables in the water column (1997−2021) over the 92 m isobath along with high-resolution and near-surface observations (POSAR buoy), are analyzed to examine incidences of hypoxia and understand the physical and biogeochemical processes modulating DO vertical distribution and its temporal variability. On average, the percentage of the water column with DO levels below 89 (hypoxia) and 22 (severe hypoxia) μmol L−1 reaches 68% (i.e., hypoxic waters are found below 30 m) and 44% (below 50 m depth), respectively, but during the upwelling season, as much as 87% (below 12 m depth) and 81% (below 17 m depth) of the water column exhibits these levels. On the sub-seasonal scale during upwelling season six hypoxic events lasting at least 2 days occur at 10 m depth. There is a strong seasonal correlation between the volume of the seawater presenting hypoxia and upwelling favorable winds. Furthermore, there is a high DO interannual variability partially related to the El Niño Southern Oscillation (ENSO). Over 2 decades, it is estimated that DO concentration in surface and subsurface layers decreases (up to 21 μmol L−1 decade−1) as waters get colder (up to 0.29°C decade−1). Remarkably, the volume of hypoxic and severe hypoxic waters over the shelf has increased more than 2 times since 1997 and shows a significant positive correlation with the upwelling index. These preliminary findings indicate that the increase in local DO consumption is partially associated with upwelling intensification. Given the clear evidence of wind intensification in coastal upwelling ecosystems and thus the increase in hypoxic events, the coastal zone may be highly vulnerable to hypoxia, impacting biological resources and biogeochemical cycles.
DO plays a key role within the ocean, being one of the most important variables influencing the distributions and abundances of pelagic and benthic organisms (Díaz and Rosenberg, 2011; Pitcher et al., 2014). Hypoxia is becoming more prevalent in the oceans, due to a process known as deoxygenation, which is altering the marine life equilibrium (Breitburg et al., 2018), leading to mass strandings of organisms that are sensitive to low DO levels and in turn favoring low DO tolerant species. Changes in DO levels lead to shifts in organism distribution, community structure and therefore biodiversity (Diaz and Rosenberg, 2008; Vaquer-Sunyer and Duarte, 2008; Steckbauer et al., 2011).
In this research, the term “hypoxia” is used to describe DO concentrations of less than 89 μmol L−1 (∼ 33% saturation for S and T around 34°C and 11°C, respectively), whereas “severe hypoxia” is considered to describe DO concentrations of less than 22 μmol L−1 (∼ 8% saturation). At hypoxic levels, there is evidence of acute effects on metazoan organisms, such as mass mortality events in fish (Hernández-Miranda et al., 2010, 2012); and of chronic effects, including changes in life cycles and population dynamics (Hernández-Miranda et al., 2012). These changes produce shifts in community structure and ecosystem function (Diaz and Rosenberg, 2008; Chu and Tunnicliffe, 2015).
Eastern Boundary Upwelling Systems (EBUS) represent large regions of the coastal ocean that are naturally affected by hypoxia (Diaz and Rosenberg, 2008; Monteiro et al., 2011; Pitcher et al., 2014, 2021; García-Reyes et al., 2015). Strong winds along the western continental coastlines combined with the Earth’s rotation, transport surface waters offshore, leading to the shoaling of cold subsurface waters, with low DO near the coast; a process known as wind-driven upwelling. These waters are nutrient rich and sustain high primary production and biological diversity that are essential for fisheries and other economic activities (Pauly and Christensen 1995). Extensive areas of hypoxia and anoxia exist due to the transport of preexisting oxygen-deficient waters, local remineralization of OM associated with high primary production, and reduced ventilation in sub thermocline waters (Helly and Levin, 2004; Paulmier and Ruiz-Pino, 2009). Hypoxia dynamics on continental shelves, such as its intensity and extent, are due to changes in remotely forced source water and local upwelling wind forcing (Walsh, 1991; Monteiro et al., 2008; Chan et al., 2019), which in turn affect primary productivity and respiration. Observed and projected changes in these forcing mechanisms require further research into the dominance of physical or biogeochemical dynamics in long term variability (Fennel and Testa, 2019). Physical factors include the along-shelf transport of different source waters, with varying proportions and characteristics (Mohrholz et al. 2008; Bograd et al., 2019). Furthermore, there is the intensity and frequency of upwelling favorable wind events which interact with the geomorphologic features and size of continental shelves that lead to the resulting water circulation. Biogeochemical factors include DO consumption through aerobic respiration of OM and other chemolithotrophic processes and if eutrophication is significant (Diaz and Rosenberg, 2008).
Long-term records indicate that ocean warming reduces gas solubility (Keeling et al., 2010; Stramma et al., 2012). Projections in deoxygenation reflect the combined effects of reduced DO solubility and reducedventilation from increased stratification due to radiative heating of the surface layer and circulation changes (Schmittner et al., 2008; Frölicher et al., 2009; Oschlies et al., 2018). In addition, deoxygenation is dependent on trends in phytoplankton abundance, as may be the case in coastal systems or gyres subjected to eutrophication or desertification, respectively. There, several biological mechanisms are linked to changes in turbulent mixing/stratification, the size of phytoplankton (its export towards sediments) and zooplankton grazing rate (Edwards and Richardson, 2004). In addition, a reduction in DO due to the effect of ocean acidification on biological processes may occur (Oschlies et al., 2008; Hofmann and Schellnehuber, 2009).
The Humboldt current system (HCS) is an important region with pre-existing and relatively shallow oxygen minimum zone (OMZ) associated with equatorial subsurface waters (ESSW) (Thiel et al., 2007; Chavez and Messié, 2009; Fuenzalida et al., 2009) combined with wind driven upwelling promotes high primary production leading to an increase in local DO consumption (Paulmier and Ruiz-Pino 2009). At mid latitudes in the HCS, a pronounced seasonal cycle modulates coastal upwelling, with the upwelling season lasting from spring into early autumn (April), whereas much weaker upwelling or downwelling dominates in late autumn and winter. This pronounced seasonality is caused by the latitudinal migration of the Southeast Pacific Anticyclone (SPA) off the coast of central Chile. Specifically, the EBUS off central Chile is expected to exhibit changes in its timing, intensity and the spatial distribution of alongshore winds (Wang et al., 2015; Aguirre et al., 2018). This intensification has been associated with two mechanisms: the strengthening and southwards migration of the SPA (Ancapichún and Garcés-Vargas, 2015; Schneider et al., 2017; Aguirre et al., 2018), as well as the intensification of the gradients in atmospheric pressure, between continental lows and oceanic highs, known as the Bakun effect (Bakun, 1990; Bakun et al., 2015).
Under different climate change scenarios, the strengthening and expansion of the SPA is expected to continue, along with its poleward migration (e.g., Belmadani et al., 2014) due to the poleward expansion of the Hadley cell (Hu and Fu, 2007) and climate models indicate that global warming will continue to cause changes to the SPA and upwelling-favorable winds in the upcoming decades, as indicated by the IPCC (2019). Similar result are found by Bakun et al. (2010) whom predicted that changes in wind patterns would influence the intensity of upwelling and therefore DO distribution. Only two long-term records of DO exist in the HCS, which allow for the investigation and reporting of variability in local or remote mechanisms able to intensify hypoxia. One of these records identifies a deoxygenation trend in the upper part of the nearshore OMZ off Peru between 1970–2008 (Espinoza-Morriberón et al., 2021) that trend is attributed primarily to the deceleration of the oxygen-rich equatorial eastward currents, rather than to local forcing from upwelling-favorable winds.
The overall impacts of hypoxia and severe hypoxia in areas of coastal upwelling are unclear, and the severity and potential threats of these events depend on the projected regional and global climatic scenarios (Deutsch et al., 2011; Oschlies, 2021). This study aims to contribute knowledge to the regional climatic scenario using one of the two long term observational time series that exist within this region along with high frequency surface observations, by analyzing DO variability from days/weeks to decadal scales, along with other oceanographic variables in the continental shelf off central Chile, and to infer what are the possible physical mechanisms driving these changes.
The HCS is characterized by its large extension along the Peruvian and Chilean coast (5–45°S), with several coastal upwelling centers driven by along shore winds, and seasonality that's partially associated with the oscillation of the SPA (Strub et al., 1998). Equatorial Subsurface Water (ESSW), transported by the poleward subsurface Peru-Chile Undercurrent (PCUC), is characterized by a pronounced DO deficit and high nutrient levels, being the main source of water for the wind-driven coastal upwelling (Wooster and Gilmartin, 1961; Fuenzalida et al., 2009). South of 28°S, the surface of the equatorward Humboldt Current is fed mainly by Subantarctic waters (SAAW), which, by contrast, has relatively low salinity and nutrients and high oxygenation (Silva et al., 2009; Llanillo et al., 2012). In addition, the HCS is among the most productive marine ecosystems worldwide, with annual mean net primary production rates of 1.1 kg C m−2 yr−1 (Daneri et al., 2000; Testa et al., 2018) which sustains the productive pelagic fisheries in Chile (Cubillos et al., 1998). Furthermore, high availability of OM stimulates its mineralization in bottom waters and sediment leading to DO consumption (Farías et al., 2015).
A time, series station at a fixed location (36°308′ S, 73°07.75′ W) off central Chile with 92 m depth (Figure 1), discrete samples at different depths (2, 5, 10, 15, 20, 30, 50, 65, 80 m) were taken and continuous profiles were recorded from 1997 to present. This time series station is called station 18 (hereafter TST18) due to its distance from the coast being 18 nautical miles. The TST18 has been visited monthly since 2002 and quarterly from 1997 to 2002. A CTD device was used (conductivity, temperature and depth), model SBE-25 and SBE 19plus with various sensors to measure DO, photosynthetically active radiation (PAR) and fluorescence. Calibrations for CTD sensors were annually performed by the manufacturer (Sea-Bird) and CTD data were processed using SeaBird data processing software. In addition, post-processing conductivity and DO validation was done using in-situ salinity (salinometer AUTOSAL model 8400B) and DO measurements. Discrete seawater sampling was conducted using a rosette sampler, mounted with 10-L Niskin bottles. Samples of DO (in 125 ml iodimetric bottles, immediately fixed with Winkler reagents) were analyzed by the Winkler method using an automatic AULOX measurement system.
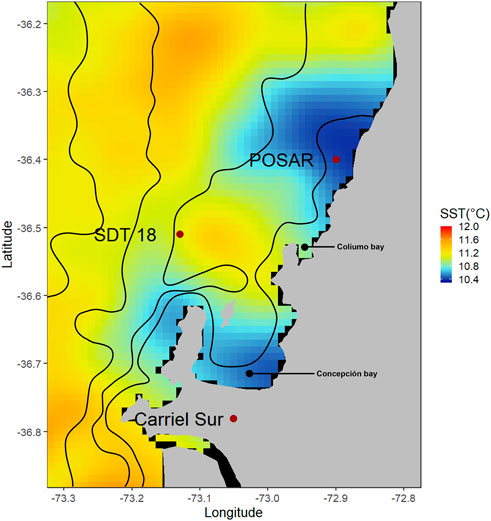
FIGURE 1. Map of the study area with the three sampling stations, Station 18 used for monthly CTD, oxygen and nutrients profiles. POSAR is a fixed buoy carrying out high frequency surface and 10 m sampling of oceanographic and atmospheric variables. Carriel Sur is a meteorological station capturing hourly wind data. Contours represent isobaths and color data is 1 × 1 km Sea Surface Temperature (SST) data from the Multi-scale Ultra-high Resolution (MUR) SST Analyses from 1 January 2021 (Dataset accessed [2021–12-01] at https://doi.org/10.5067/GHGMR-4FJ04).
The continuous high-frequency oceanographic and meteorological data used in this research was recorded by a POSAR buoy, an automated monitoring meteo-oceanographic buoy located close to Coliumo Bay (Chile) about 10 km from the mouth of the Itata River 144 (36.4°S–72.9°W), at a depth of about 50 m (Figure 1) and close to the TSS18. This POSAR buoy was operative during two consecutive upwelling seasons (austral spring-summer). POSAR data is freely available in real-time at the CR2 (www.cr2.cl/posar) and CDOM web portals (www.cdom.cl). High frequency DO, temperature and salinity measurements came from a Microcat CTD-DO (SBE 37-SMP-ODO) sensor located at 10 m depth, transmitting high frequency and real time oceanographic data. While wind measurements came from an ultrasonic anemometer (MM86106). Data analysis and interpretation for the DO sensor and others at 1 m depth and technical details of the sensors/instruments forming the POSAR buoy are available in Aguirre et al. (2021a) and in www.cr2.cl/posar.
In this study, the analysis of DO variability is based on profiles obtained by the CTDO; discrete Winckler DO measurements were used to validate CTDO, and there was a significant positive correlation between both types of measurements. Wind speed and direction based on an hourly register were obtained from a permanent meteorological station located at Carriel Sur (http://www.meteochile.gob.cl/) close to the continental shelf off central Chile (Figure 1). This station meets international standards and it is established as a coastal station. Meteorological data (daily average) were compared with daily satellite wind fields, averaged every 6 h and interpolated linearly from 0.25° to 0.05°. Two products related to satellite observations were sourced from Copernicus marine service (https://resources.marine.copernicus.eu/). The wind speeds taken from satellite data significantly correlated with those from the weather station, however the wind speed records from satellite data were 30% higher than those from the weather station (Faundez, unpublished data); thus, for conservative criteria, the data from Carrier sur weather station was used.
Alongshore or equatorward wind component (v = m s−1) was calculated from the wind magnitude (|V| = m s−1) and direction (dd) converted to radians, as follows;
The upwelling index (UI; m−3 s−1) from 2002 to 2021 was obtained through Ekman zonal transport per 1,000 m of coastline (Bakun, 1973), as:
where τy (Pa; kg m−1 s−2) is the mean wind stress meridional component within box 73–74ºW, 36–39ºS, ρ represents the mean density of the water column at TST18 (1,026.2 kg m−3), and f indicates the Coriolis parameter corresponding to the latitude at ST18 (8.67 *10–5 s−1). Daily stress (
where
In this study a hypoxia event is defined as DO levels reaching below 89 μmol L−1 for two or more days of duration. It is based on an analysis of a hypoxic event at the Gulf of Trieste (Stachowitsch, 1991, 1984), where 2 days of hypoxic conditions could cause a reduction in metazoan biomass to less than 25% of the initial conditions; other physiological effects are pointed out by Diaz and Rosenberg (1995) at those DO concentrations; this value serves as a rough reference as to how different taxa respond and adapt to hypoxic conditions.
Mean annual cycles (referred to as climatology) of the variables at TST18 were calculated using monthly averages across the time series. To quantify the deviation from the mean annual cycle, the former was subtracted from the observed data for each corresponding month of the cycle, thus obtaining the anomaly, defined as the difference in measuring units from the long-term average annual cycle.
Regarding interannual variability, ENSO and oceanic episodes of El Niño (EN) and La Niña (LN) were detected using two indexes, the Oceanic Niño Index (ONI) which is based on the temperature anomaly along the Central Equatorial Pacific Ocean (3.4 region 5°N–5°S, 120°–170°W) and the coastal El Niño index (ICEN) which is based on the temperature anomaly off the coast of Ecuador and Perú (1 + 2 region 90°−80°W, 10°S–0°). In both cases, low negative and positive values indicate an LN and EN episodes, respectively, (Takahashi et al., 2014). The data was obtained from https://origin.cpc.ncep.noaa.gov/products/analysis_monitoring/ensostuff/ONI_v5.php for ONI and from http://met.igp.gob.pe/datos/icen.txt. For ICEN.
Monthly time series for anomalies of temperature, salinity and DO were used to determine the decadal trends using a least squares linear model fit over 6 month averages of the original time series. Trends were grouped by pre-defined averages over depth layers including surface-layer (0–10 m), lower-surface (15–20 m), mid-layer (30–50 m), and deep-layer (65–80 m). Correlations between DO and wind stress anomalies were performed at different phase lags (0–4 days) to determine the best correlation between wind and the oceanographic variables.
High-frequency measurements of temperature, salinity and DO from the POSAR buoy were analyzed to quantify the variability occurring at the daily to weekly time scales (from now on referred to as high-frequency) and to quantify error and lost data in observed patterns when compared to a monthly sampling frequency at TST18. Pearson correlations between DO and wind stress were performed at different phase lags to estimate the optimum high frequency correlation of these two variables and to assess the effects of upwelling on surface DO levels.
This study describes and analyzes observed temporal variability in oceanographic variables, focused on monthly DO measurements from over 23 years. This time frame is sufficient to detect some inter-annual variability and decadal trends. Additionally, high frequency DO observations are obtained from the POSAR buoy.
Throughout the study period, the weather station recorded daily wind speeds of between 0.6 ± 0.7 m s−1 (means±SD) and 13.3 ± 1.6 m s−1 (means±SD), while the alongshore (northward or equatorward) component of wind speed fluctuated from −12.8 to 10.7 m s−1. Figure 2A shows the meridional component of daily wind stress from 2001 to 2021, which ranges between −0.30 and 0.19 N m−2. These winds are stronger and more frequent during austral spring-summer peaking around December-January, whereas a weakening or even inversion of the predominant winds occurs during late autumn-winter. In the latter period, wind stress is more variable than in the upwelling seasons (Figures 2A, B).
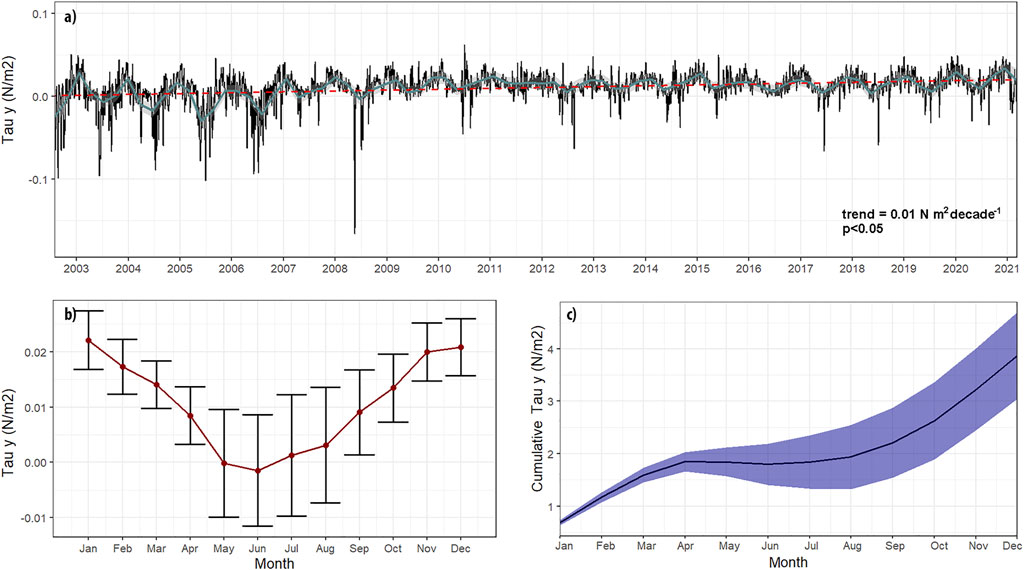
FIGURE 2. (A) Equatorwards Wind Stress with 5 days smoothing (black line) and 90 days smoothing (cyan line), the red segmented line represents the trend (B) Equatorwards wind stress mean seasonal cycle (climatology) and (C) Cumulative Wind stress along the mean seasonal cycle.
The annual cycle of wind reveals the predominance of upwelling favorable winds from August to April (70% of the year) with a maximum monthly mean of 0.022 N m−2 in January; (Figure 2B). By contrast, between May and July, negative or close to zero stress values (−0.0014 N m−2 July) are dominant. Cumulative upwelling-favorable wind stress shown in Figure 2C Indicates a rapid accumulation from spring to summer, which varies between different years, mainly in winter and springtime (Figure 2C). The climatology of the UI ranges from 25.15 m2 s−1 in April to 249.66 m2 s−1 in January.
On the continental shelf off central Chile, coastal upwelling events influence the vertical distribution of the physical and chemical properties in seawater, as shown in the vertical sections of temperature, salinity, DO (Figure 3), Upwelling of subsurface waters is demonstrated by the shoaling of 12°C isotherm in spring (Figure 3A), reaching its shallowest depth during mid-summer (<10 m depth in January). Salinity also shows seasonal patterns that correlate with the advective shoaling of isotherms. Low salinity is observed in a narrow surface layer (0–15 m) during winter and spring, which is associated with the Itata River discharge (plume) that reaches TST18, creating a notable haline stratification.
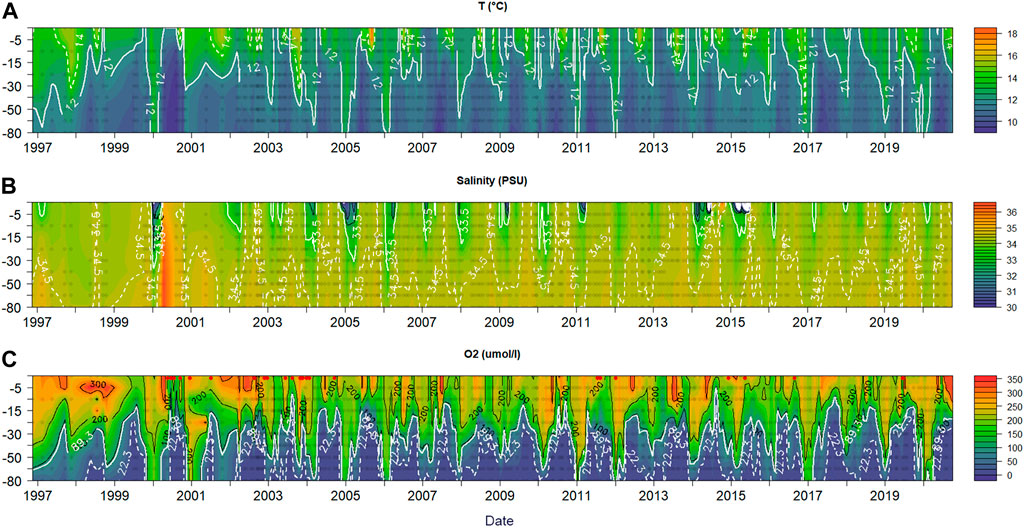
FIGURE 3. TST 18 Temperature (A), salinity (B) and oxygen (C) hovmöller plots. For temperature, the 12°C (continuous line) and 14°C (dashed line) isotherms are highlighted. For salinity, the 35.5 psu (continuous line) and 34.5 psu (dashed line) isohalines are highlighted. For oxygen, the 2 ml/L (continuous line) and 0.5 ml/L (dashed line) isolines are highlighted, also a dashed red line marks 10 m depth. Red dots correspond to dates at which profiles were interpolated from Winkler O2 measurements.
DO distribution in the water column (Figure 3C) presents higher concentrations (> 260 μmol L−1) in the upper (0–15/20 m depth) layer, however, subsurface and bottom layers exhibit strong seasonal variation due to the influence of the poorly oxygenated ESSW from coastal upwelling. During the upwelling season, as much as 87% and 81% of the water column exhibits DO concentrations under 89 and 22 μmol L−1, respectively. The average seasonal shoaling of hypoxic waters is strongly correlated with the UI (r = 0.81, p<0.05, n = 12).
DO levels rapidly decline with the spring onset (around September) when upwelling-favorable winds increase (Figure 2B) and poor oxygen (< 44 μmol L−1) and nutrient rich ESSW is transported onto the continental shelf (Figures 3A, 4). During November-March, cumulative upwelling favourable wind stress has reached over half of its annual maximum (Figures 2A–C), the average DO in the water column reaches 63%–72% or 41%–48% volume, with hypoxia and severe hypoxia, respectively. On the contrary, DO levels increase in April/May as upwelling-favorable wind weakens prior to the autumn transition. During winter, the persistence of poleward winds lead to downwelling of oxygenated SAAW (Silva et al., 2009; Llanillo et al., 2012) and storms (Strub et al., 1998) provoke an oxygenation of the water column on the continental shelf (Figure 2A) through advective flushing and vertical mixing (Sobarzo et al., 2007). Maximum oxygenation is reached in July, where an average of 26% (2%) of the water column has DO concentrations under 89 (22) μmol L−1 (Figures 3C, 4K).
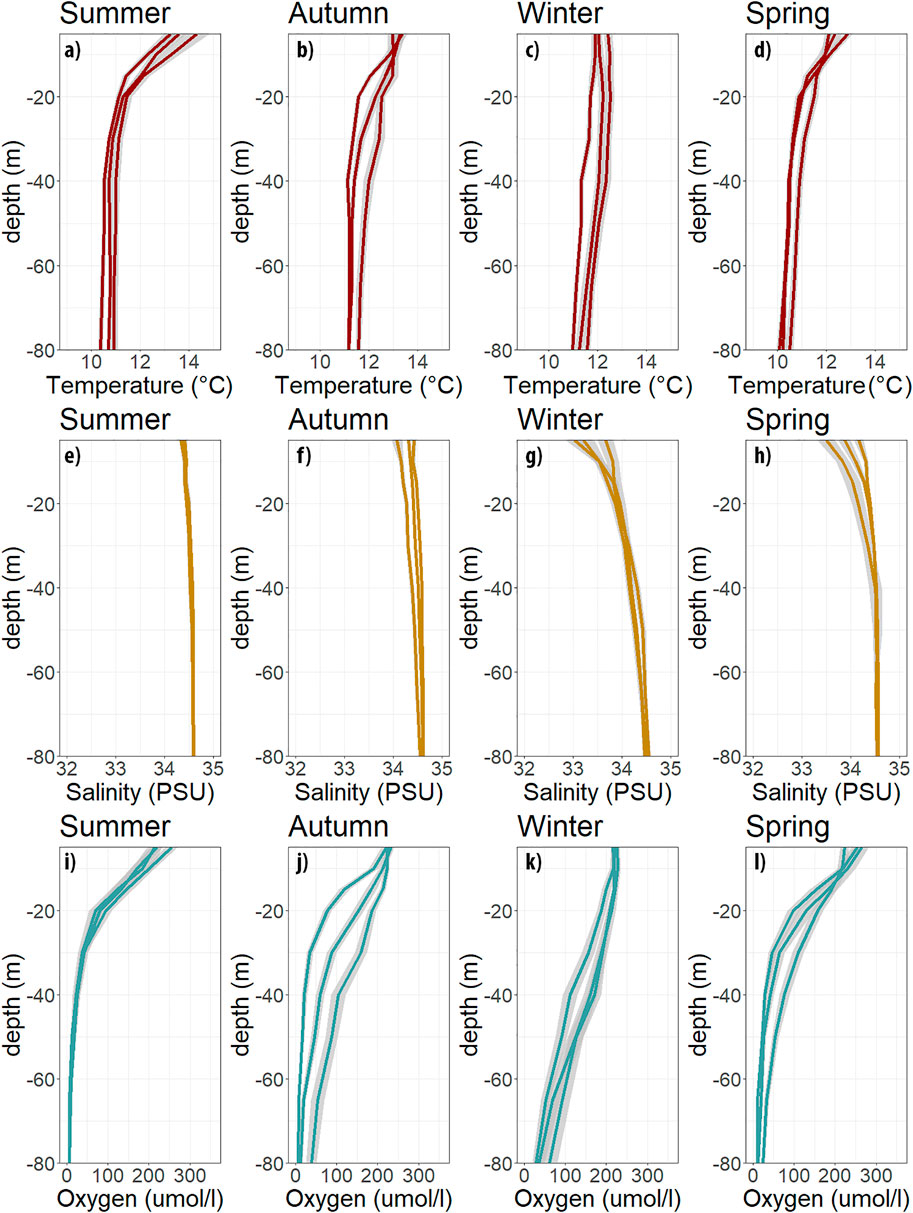
FIGURE 4. Monthly climatology TST 18, monthly profiles for temperature (red, a–d), salinity (yellow, e–h) and oxygen (blue, i–j), separated by seasons. Summer (DJF), autumn (MAM), winter (JJA), spring (SON).
Density, expressed as sigma-t, describes water mass structure and dynamics (Supplementary Figure S2). Density is negatively correlated with DO (r = −0.59; p<0.05, n = 2,209), which means that denser waters contain less DO. The water column at the sampling location consists of nutrient poor and oxygenated SAAW with a density (sigma-t) of approximately 25.6. The SAAW moves northwards through the HCS, whereas the ESSW, which forms at the equator is nutrient rich and DO poor, having a density (sigma-t) of approximately 26.2 and moves poleward by the PCUC (Silva and Neshyba, 1979; Silva et al., 2009). The DO content of the ESSW can be identified by projecting the 26.2 isopycnal over the DO time series (Supplementary Figure S1), showing a clear association of this water mass with hypoxic waters.
Figure 4 shows the climatological monthly hydrographic profiles from TST18. Temperature transitioned from almost an entirely mixed water column in late fall/winter to a strong thermocline between 10 and 20 m depth in spring/summer (Figure 4A). Salinity presents negligible depth differences in summer, except for a noticeable shallow (0–15 m depth) gradient during winter and spring (Figure 4C). DO climatological profiles capture the seasonal development of the vertical distribution of hypoxia and severe hypoxia, along with temperature and salinity (Figure 4C). The thermocline and oxycline shoal simultaneously in spring-summer. Vertical temperature gradients intensify between December to March, when a thin surface layer becomes warmer (with values up to 15°C), caused by increased radiative heating during this season. This is contrasted with the upwelling of cool subsurface water from the ESSW, creating a marked thermal stratification. By contrast, low salinity waters are detected in a thin surface layer between June to October, which coincides with high precipitation and river runoff (Figures 4G, H). Moreover, a low salinity area is associated with the Itata River plume which creates notable haline stratification in the winter (Saldía et al., 2012; Masotti et al., 2018) but does not affect surface DO concentration in wintertime nor the decadal trends presented below.
DO concentration consistently decreases with depth; with maximum values in the mixed layer (> 220 μmol L−1), reaching values below hypoxia and severe hypoxia at the subsurface and bottom layers throughout the year. However, vertical gradients and differences between the surface and the bottom layers vary between unfavorable and favorable upwelling periods. High DO values throughout the entire water column (Figures 4I–L) correspond to periods of strong vertical mixing associated with winter storms, and dominance of the SAAW. On the contrary, during the spring and summer, the oxycline intensifies and becomes shallower as coastal upwelling progresses (September to March). This seasonal variability in DO levels agrees in part with Pizarro-Koch et al. (2019), describing model derived estimates with a minimum (maximum) hypoxic volume in winter (Summer), attributed to the advection of offshore waters depleted in DO associated with the ESSW and transported by the PCUC. This is supported by observations from TST18, as shown in Supplementary Figure S2, where the boundary of hypoxic waters is associated with the isopycnal (sigma-t = 26.2) in the ESSW. Also, low DO may be caused by DO consumption through the oxidation of OM, which is exported from the surface and accumulated close to and in the sediment throughout the upwelling period (Farías et al., 2004).
The development of hypoxia and severe hypoxia displays high-frequency, intra-seasonal and interannual variability (Figure 3C). High-frequency variability is superimposed on the seasonally varying winds, caused by the eastward passage of cyclonic storms (Rahn and Garreaud, 2013) and poleward propagating coastal lows (Garreaud et al., 2002; Garreaud and Rutllant, 2003; Aguirre et al., 2021b). Variability with 3–12 days fluctuations lead to active and less-active upwelling events (Aguirre et al., 2014; 2021a). Other intraseasonal processes affecting the water column include coastally trapped waves and other phenomena, such as eddies (Hormazabal et al., 2002; Pizarro et al., 2002). Annual variability of most oceanographic and biogeochemical variables is attributed to the ENSO cycle, which is the primary process that induces interannual variability in the HCS (Hormazabal et al., 2002, 2006).
Previous long-term studies on the PCUC along the continental slope (30°S) state that coastal trapped waves control intraseasonal variability in the OMZ, whereas Rossby waves provide a physical mechanism that lead to significant fraction of seasonal (annual cycle) DO variability off central Chile. Both physical mechanisms originate from equatorial wind forcing (Hormazabal et al., 2002; Pizarro et al., 2002). However, this study doesn't consider how different types of wave interactions are affected by local forcing, such as local winds, river discharges, topographic and geomorphological features and pelagic benthic coupling mechanisms, among others.
The seasonal reduction in DO may slow or reverse due to intra-seasonal along-shore wind reversal events (Figure 5). The average seasonal shoaling cycle of hypoxic waters is strongly correlated with the annual UI cycle (r=0.81; p<0.05, n= 12) as it is with equatorward wind stress. However, seasonal anomalies in hypoxic volume are not significantly correlated with UI and thus weaken the relationship between UI and DO < 89 μmol L−1 isoline depth for the time-series over seasonal scales (3 months smoothing) (r = 0.37; p<0.05, n = 219) (Figure 6). These intra-seasonal anomalies that do not appear to be correlated with UI might be caused by strong high-frequency scale variability that's undetected due to the sampling frequency at TST18 (discussed below in the POSAR section).
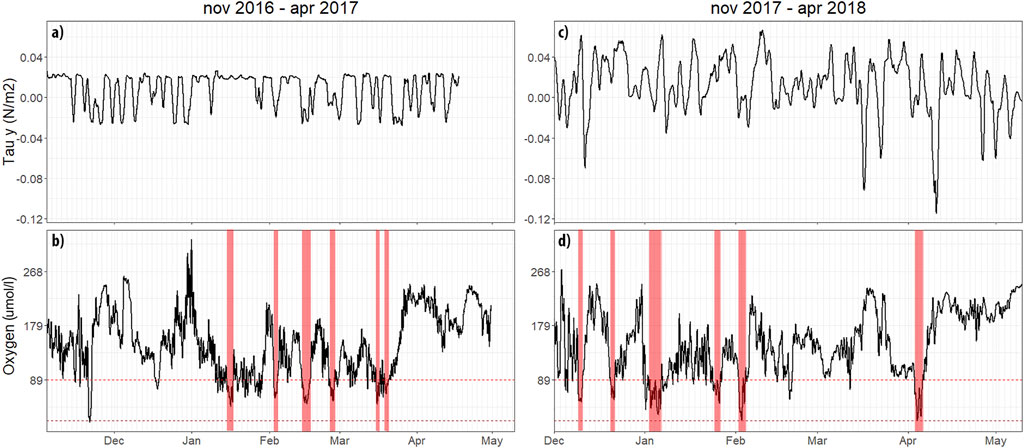
FIGURE 5. Smoothed (24 h window) high frequency oxygen and equatorwards wind stress variability from POSAR from November 2016 to April 2017 (a,b), and November 2017 to May 2018 (c,d) sampling periods, a moving average of 2 days is applied. Secondary x axis lines represent 2 day steps. Red bars represent hypoxic (under 2 ml/l) events that last for 2 or more days.
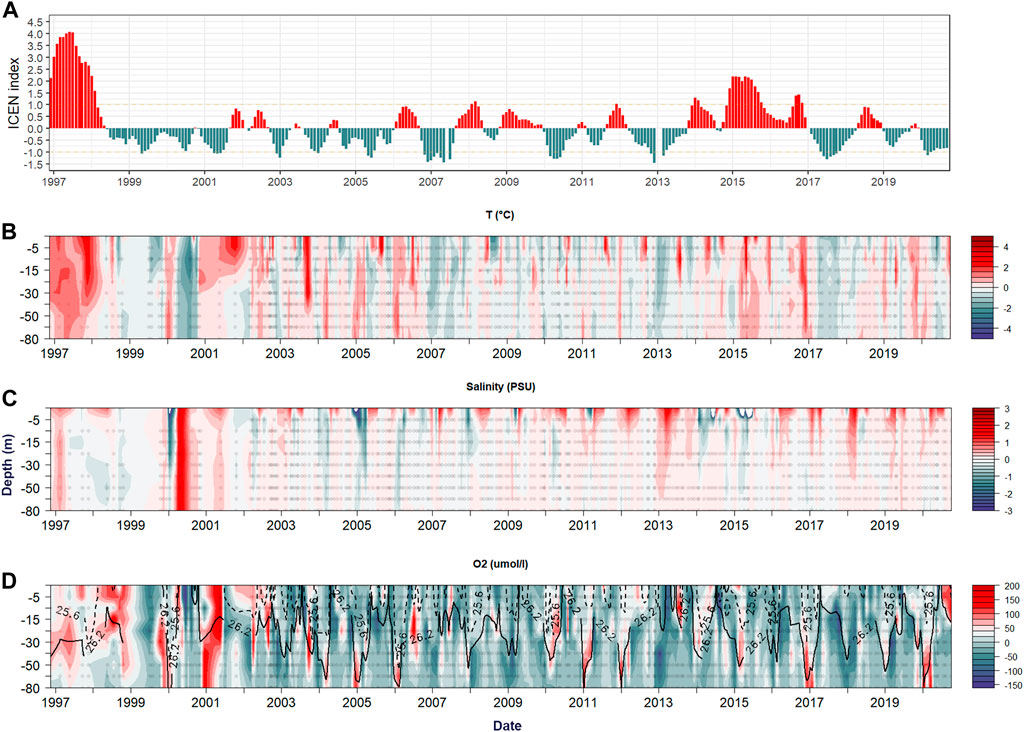
FIGURE 6. (A) ICEN El niño index with yellow and blue boxes highlighting El Niño and La Niña events of interest. (B–D) are temperature, salinity and dissolved oxygen anomalies respectively.
For TST18, daily averages of equatorward wind stress are weakly correlated with DO, temperature, and salinity anomalies at 10 m depth. The optimum correlation occurred with a 2-day lag, which indicates the time that's needed for the upwelling signal peak, shown by the maximum shoaling of DO isolines, to reach the location of the TST18 at 18 nm from the coast. For DO, correlation values range from r = −0.09 to −0.17 when it is statistically significant. On average, the correlations with salinity and temperature are higher, being r = 0.12 to 22 and from 0.15 to to 24, respectively (Supplementary Table S2).
Sub-seasonal variability is difficult to understand due to relatively low frequency monthly sampling. Furthermore, depending on its amplitude, it may add a significant amount of error on a similar scale to seasonal variability. Considering this, an analysis of data from the POSAR buoy during two upwelling favorable periods (2016–2017 and 2017–2018) is used to understand if a monthly sampling frequency is appropriate to capture a detailed account of DO variability. A total of 12 surface events of shallow hypoxia (i.e., >2 days below 89 μmol L−1 at 10 m) are identified during the sampling period, with six events taking place during 2016–2017 and another six events in 2017–2018, with varying levels of intensity. These results agree with those reported by Aguirre et al. (2021a), where surface variability at 1 m depth is analyzed. On average, they found that DO shows the best correlation with UI 24–36 h after the onset of an upwelling favorable event. At 10 m depth (often coincident with the base of the mixed layer in summer), alongshore wind stress and DO are most correlated with a lag of ∼30 h (r = −0.28; p<.05; n = 7779). There is an increased range in the sub-seasonal variability, with a standard deviation of ±60 μmol L−1. These high amplitude fluctuations are related to a strong equatorward wind, suggesting that upwelling is the main forcing mechanism. At this scale of variability, other mechanisms may also alter DO vertical distribution, such as turbulent mixing and coastally trapped waves (Morales et al., 1999; Ulloa et al., 2001; Frieder et al., 2012). This could be the case for the inner shelf or even the waters associated with the coastline (e.g., Hernández and Tapia, 2021).
These results highlight that high frequency processes lead to greater variability within the monthly data, as it is possible to capture extreme events that may not be a true representation of the mean monthly conditions, potentially leading to high anomalies. Thus, it is considered that monthly DO anomalies should be interpreted as being subject to an error superimposed by high-frequency and intra-seasonal variability, the higher the variability at this scale, the more likely it is to overestimate anomalies in the monthly time-series.
Significant variability between annual cycles for different years are shown in Figures 7A, B. For example, during winter season high ventilation occurs, leading to DO concentrations reaching above the hypoxic threshold throughout most of the water column. This, however, shows high interannual variability with years with less ventilation, when near bottom waters do not get oxygenated and are exposed to hypoxic conditions throughout the year, in some cases having up to 50% (18%) of the column at levels below 89 (22) μmol L−1, and as a result the these waters remain under this limit for extended periods of time, as is the case for the 1997–99; 2002–04; 2008–09; 2013–15, and 2018–19 periods. The same is true for summer, where typically the deeper 40% and 65% of the water column is subject to severe hypoxia and hypoxia respectively. During especially strong upwelling periods, however, hypoxia and severe hypoxia can occupy almost the whole water column (> 80%) reaching up to 10 m depth as is the case for 2001, 2011, 2015–2018. In contrast, there are the Summers of 1998, 1999, 2003, 2009, 2014, and 2016 where hypoxic waters remained below 20 m depth (Figure 3C).
Most anomalies are related to advective processes, as salinity and temperature are inversely correlated (Figures 6B, C). DO is less responsive than other variables as it also has a significant biological component as well as being regulated by physical processes, especially above the thermocline (Figure 6D). However, under 10 m depth, density and DO are strongly correlated (r = −0.8; p<.05; n = 1,551), suggesting that changes in DO at any given depth are probably associated with shifts in the depths of isotherms/isohalines, this association is stronger at mid-depths where the pycnocline is typically located (Supplementary Figure S2D). Salinity also shows high interannual variation at the surface due to annual fluctuations in freshwater input from precipitation and/or river discharge (Saldías et al., 2016). Moreover, there is a marked reduction in the discharge of fresh water from the rivers of the central region of Chile, due to a decade-long (2010–2018) drought with a reduction of 20%–45% in rainfall in central and southern Chile (Garreaud et al., 2020).
Three notably strong EN events have occurred during our study period; an extreme event in 1997–98, the “Godzilla” in 2015–2016, and the 2017 coastal EN, all of which are registered among the 10 strongest events within the last century (Cai et al., 2015). Positive temperature anomalies correspond to these EN events, and neutral or positive DO anomalies at mid to bottom depths. This is evident during the 1997–98 and 2015–16 events that respond during the peak of ICEN index, whereas for the last event the strongest response for all three variables occurs during the autumn of 2017. During the first two events, a deeper 12°C isotherm and 26.2 isopycnal during spring-summer, similar to that of the average winter depth are observed (Figure 6A). However, the 2017 event does not show this pattern, possibly due to the lack of the downwelling Kelvin wave that usually arrives during EN events and propagates through the thermocline, thus acting at much shallower depths (Takahashi and Martínez, 2019).
In contrast, there are two negative phases or LN in 2007–08 and 2013, which show an inverse pattern as expected; with negative DO anomalies throughout all depths (see Figure 6). Despite ENSO being one of the most important remote forcing in the HCS, a correlation analysis of both EN indexes with DO at three selected depths (15, 50, 80 m) shows only a weak correlation (r = 0.17, n = 219) with the ICEN index is observed at 50 m (Supplementary Table S1). For example, the long-lasting event in the summer of 2015–2016, known as the “Godzilla EN”, lacks oxygenation in the summer. This is unlike the extreme event in 1997–98 and the coastal EN in 2017. It should be noted that weak to moderate correlations in temperature (ICEN r =0.39–0.5; ONI r = 0.32–0.51) exist, which increases over depth, and there is no statistically significant correlation with salinity (Supplementary Table S1). The observed oxygenation in the mid-layers is as expected, as the deepening of the thermocline during EN would have a stronger effect at depths where the ESSW is more prevalent throughout the year. Over this timescale of variability, the strongest signals in this time-series include non-seasonal high DO concentrations observed in fall-winter of 1997, 2005, 2006, 2011, 2012, 2017, and 2020, where the 89 μmol L−1 isoline deepened below the maximum sampling depth and correlates with the deepening of the 12°C isotherm and the 34.5 isohaline.
In the Peruvian OMZ, there are variations in the zonal current intensity in the Equatorial Undercurrent (mainly EUC), and changes in vertical water mass distributions during ENSO phases. This explains temporal and latitudinal changes of DO (Llanillo et al., 2013; Montes et al., 2014; Espinoza-Morriberón et al., 2019). However, physical and biogeochemical coupling differs between different EN regimes, and mechanisms are not yet clear. During the decade following the year 2,000, DO and nutrients in the water column respond variably and not linearly in relation to the ENSO oceanic teleconnection (Graco et al., 2017; Espinoza-Morriberón et al., 2019; Pitcher et al., 2021). With data from 1996–2012, Graco et al. (2017) detected an efficient oceanic mechanism observed through the distribution of DO and nutrients in the water column in central Peru. During this time the OMZ adjusted to conditions of Kelvin-wave-induced downwelling that stopped upwelling and led to an increased oxygenation and reducing nutrient availability; meanwhile after the year 2,000, mean upwelling conditions are maintained during a weak regime, associated with a moderate central Pacific EN event and enhanced equatorial Kelvin wave activity. That study does not capture the effect of the ENSO cycle in the last decade (after 2012), as these observations are taken from in central Chile, at 3,300 km from equatorial zonal currents so it is assumed that different mechanisms of interaction are occurring, mainly linked to the Southern Ocean.
There is even less understanding about the transformation of DO and nutrients as the ESSW is transported southwards and the reduction in water mass renewal rates on a regional scale due to increased stratification caused by warmer or fresh surface waters. The intermediate depths of the Southeastern Pacific are occupied by two water masses that move in opposite directions and mix as they converge (i.e., the mentioned ESSW and Antarctic Intermediate Water “AAIW”). The AAIW is formed along the front of the Antarctic Circumpolar Current and spreads equatorward along the 27.0–27.1 isopycnal (Talley, 1999), it is rich in DO; thus capable to ventilate the lower limit of the OMZ (26.6 isopycnal) as the ESSW moves southward (Carrasco et al., 2017). However, changes in mechanisms and ventilation rates in the ESSW at mid latitudes are not known. Regarding the ventilation of the upper limit of OMZ, waters off northern and central Chile are characterized by the presence of a permanent minimum saline layer associated with Eastern South Pacific Intermediate Water (ESPIW; 40–60 m depth) that leads to a strong surface stratification (Schneider et al., 2003). This layer, together with the surface thermocline, produces a marked pycnocline, isolating the thin surface or mixing layer from the ESSW where a strong oxycline and the OMZ´s core are located. Changes in the minimum saline layer that could affect oxygenation levels require further study, in addition to ventilation produced by the ENSO cycle or mesoscale phenomena (Espinoza-Morriberón et al., 2019; Trucco-Pignata et al., 2019).
Understanding the DO regime and its long term response in different systems, helps to identify the key processes that it is controlled by, providing the knowledge base to predict potential changes under future climate change scenarios. Table 1 presents the DO decadal trends in different ocean depth layers. Significant negative DO trends are observed in the lower surface and mid layers, of −18.1 and −21.97 μmol L−1 decade−1 respectively, with a maximum rate of change in the lower surface layer at the location of the oxycline (just below the pycnocline). Also, the surface and bottom layers showed trends towards oxygen depletion, however not significant. The global average decrease in DO for the upper ocean (100–1,000 m depth) is estimated at −0.93 ± 0.23 μmol L−1 y−1 and DO depletion is higher in the mid-latitudes of both hemispheres (Helm et al., 2011). Approximately 15% of the global DO decrease is due to the reduced capacity for DO storage in a warmer mixed layer (Helm et al., 2011). However, this is not the case in central Chile where negative decadal trends in temperature (cooling) ranging from −0.09 to −.29°C decade−1 are estimated and these rates of change increase towards the surface (Figure 8A). Also, the strongest reduction in DO is registered below the surface layer, and only the lower-surface and mid layer trends are statistically significant (Figure 8C). In addition, non-significant positive trends in salinity, between 0.01 and 0.04 psu decade−1 occur throughout the water column (Figure 8B). These trends indicate that the over-accentuated decadal variation in the surface to mid layers with respect to the bottom layer (almost completely occupied by the ESSW) are probably not dominated by a change in the ESSW properties, but due to the shoaling of isotherms/isopycnals (i.e., increased vertical advection towards the (sub)surface layer) as equatorward winds strengthen and become more frequent shifting average conditions towards a more shallow ESSW. It is important to note that the decadal decrease in DO over several depths is not related to reduced DO solubility, but it is likely to be associated with changes in local wind forcing (see review Pitcher et al., 2021). This is further supported by the long term data of DO levels. Below 89 and 22 μmol L−1, indicating a close relationship with UI, as shown in Figure 7.
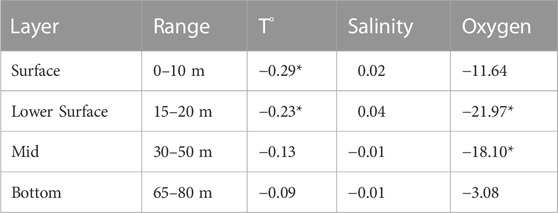
TABLE 1. Temperature (°C decade−1), Oxygen (umol L−1 decade−1), Salinity (PSU decade−1) linear trends over the sampling period 1997–2021. All significant trends marked.
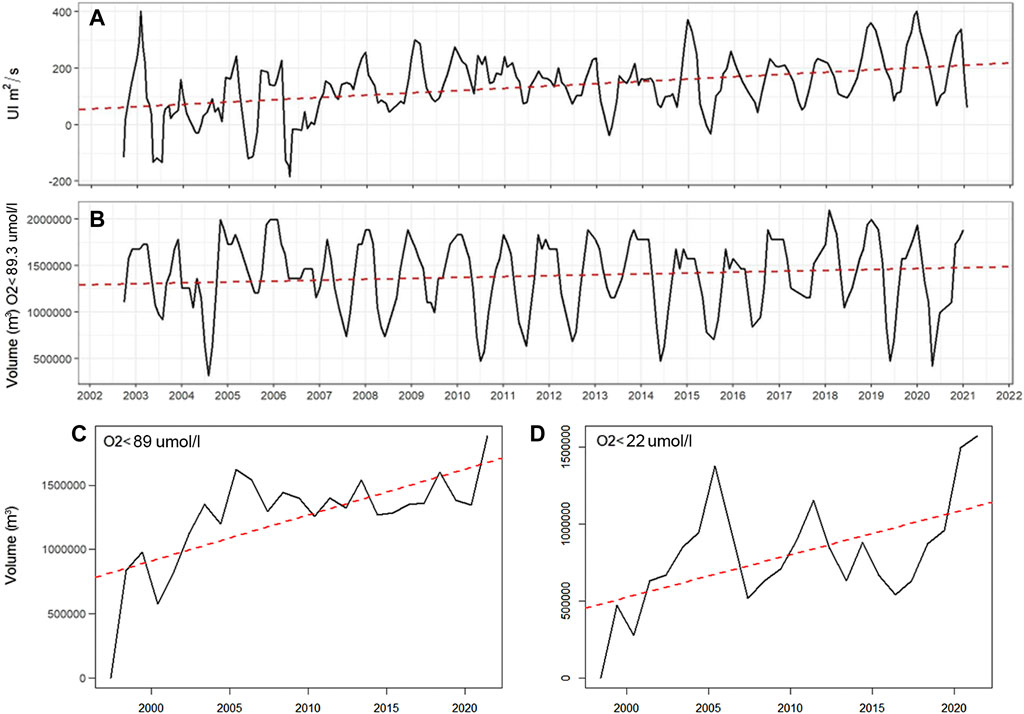
FIGURE 7. (A) Upwelling index and (B) volume of hypoxic waters in cubic meters (m3). Red dashed lines indicate the trend.
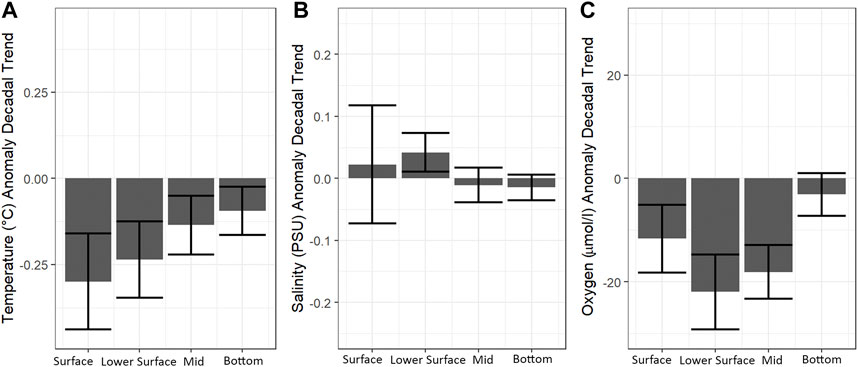
FIGURE 8. Decadal trends of (A) temperature, (B) salinity, (C) Oxygen, at the bottom (65–80 m), intermediate (30–50 m), lower surface (15–20 m) and surface (0–10 m) layers. Units indicate change for every 10 years.
Pitcher et al. (2021) provides a synthesis of drivers for DO reduction trends in coastal systems. In most cases, a decadal negative trend (deoxygenation) occurs in systems such as the California current system from Canada (Vancouver) to southern California (ranging from 8.3 to 21 μmol L−1 decade −1) and coastal systems off Peru (ranging from 1.62 to 10 μmol L−1 decade −1), whereas no trends are observed in the Canary upwelling system. In the last 60 years, shelf deoxygenation trends are significantly higher than the global ocean deoxygenation trend (i.e., 0.075 μmol kg–1 yr−1 or ∼4.5 μmol kg−1) (Grégoire et al., 2021).
Climate model projections estimate that there will be considerable reductions in the open ocean DO inventory in response to anthropogenic climate forcing (Schmidtko et al., 2017; Oschlies, 2021), these projections also coincide with observed DO (Helm et al., 2011). However, the drivers of shelf hypoxia remain unresolved. The main driver of DO variability is wind driven upwelling, which is predicted to increase under climate change scenarios (e.g., Echevin et al., 2012; Sydeman et al., 2014; Bakun et al., 2015; Oyarzún and Brierley, 2019; Winckler-Grez et al., 2020). Observational evidence from this study supports these predictions, as significant negative trends in DO and temperature, and positive trends in salinity see (Table 1), indicates changes in the depth of waters depleted in DO. On average, the annual UI is four times higher, from 55.9 to 214.1 m3 s−1 (Figure 7A) while the hypoxic volume became 1.2 times higher (Figure 7B) in the same period. Yearly averages since 1997 show a clearer trend of the hypoxic volume, changing by a factor of 2.3 from 1997. A similar trend is also estimated for the volume of severe hypoxia (Supplementary Figure S1) supporting the hypothesis that climate-dependent strengthening of upwelling wind forcing increases the intensity and spatial extent of hypoxia in coastal upwelling systems. The simultaneous increase in hypoxic volume and UI is probably due to the increase in upwelling intensity and/or duration of the upwelling favorable season, as described by Abrahams et al. (2021). Additionally, north of 30°S there is an intensification of winds due to increased land-sea temperature gradients, known as the “Bakun effect” (Bakun, 1990), reported by Weidberg et al. (2020).
In large EBUS, a general increase in upwelling favorable winds has led to a reported decline in SST (Gutiérrez et al., 2011; Sydeman et al., 2014; Abrahams et al., 2021), which is the case of the HCS (Aravena et al., 2014; Schneider et al., 2017; Aguirre et al., 2018). This is related to the well documented southward expansion of the SPA (Sydeman et al., 2014; Schneider et al., 2017; Aguirre et al., 2018; Winckler-Grez et al., 2020) and the more frequent occurrence of migratory anticyclones passing through the coast of central-southern Chile (Aguirre et al., 2021b). These trends agree with previous studies reporting positive trends in chlorophyll along upwelling regions (Gregg et al., 2005; Gutiérrez et al., 2011; Marrari et al., 2017), including in coastal upwelling off central Chile, as shown by Aguirre et al. (2018) and Winckler-Grez et al. (2020). Such trends may be explained by increased upwelling-favorable winds that pump nutrients toward the surface to promote the growth of phytoplankton and increase biomass, as reported in Aguirre et al. (2018) and Weidberg et al. (2020) but only north of 30°S. An increase in the phytoplankton biomass or OM could have an implication in the local consumption of DO, which requires further investigation.
DO dynamics, including hypoxic volume and intensity are highly responsive to a variety if parameters, including changes in source water (Emerson et al., 2004; Whitney et al., 2007, Espinoza-Morriberon et al., 2021), eutrophication (Howarth et al., 2011) and upwelling wind forcing (see previous references). Also, variability in ENSO, with increased frequency and intensity of extreme ENSO events during the last century (Gergis and Fowler, 2009; Cai et al., 2015; Wang et al., 2019), may interact with the regional changes in wind patterns and water mass distributions. It is unlikely that a change in DO consumption off central Chile is due to eutrophication in the coastal system as rivers have a moderate or low N and P load (Masotti et al., 2018). This contrasts to the Gulf of Mexico or the continental shelf off India (Breitburg, et al., 2018; Naqvi, 2021), but it remains unclear if changes in water masses at mid latitudes, mainly the ESSW, are responsible for the observed deoxygenation.
Finally, decadal variability associated with the Pacific Decadal Oscillation (PDO) is also a potential driver in the observed DO variability, which also impacts the seasonal migrations and intensification of the offshore SPA and its frictional interactions with the continent. A reconstruction of DO concentrations over the previous century (Srain et al., 2015) shows an interdecadal variability of >30 years periods associated with a negative (positive) phase of PDO, that favors (hinders) the development of wind driven upwelling, which in turn enhances (reduces) primary productivity and export.
Currently, climate change risk assessments are carried out for social, ecological and productive sectors (IPCC, 2022). Off central Chile, the observed reduction in DO over time could be considered as a climate-related hazard having an impact and risk on biological resources, ecosystems and coastal communities. In addition, wind-forced upwelling can propel hypoxic water onto the littoral zone (less than 20 m depth) and even into shallow water bays (e.g., Concepción Bay, Coliumo Bay, Arauco Gulf). This is due to the shoaling of oxygen isolines, including the 89 and 22 µmol L−1, frequently observed in coastal upwelling zones (see Supplementary Figure S3) Thus, hypoxia events on the inner-shelf may become more frequent and severe, increasing exposure and sensitivity, therefore the risk of benthic organisms (that live on the littoral area less than 20 m depth) or even pelagic organisms to be more exposed, leading to more vulnerable coastal communities that depend on these resources.
Hernández and Tapia (2021) indicate that upwelling induced hypoxic events on nearshore subtidal systems are commonplace, but also significantly variable between locations; with half of the sites in their study showing mean DO values at the hypoxic threshold. In fact, several historical massive fish and crustacea mortality events were recorded in the study area (Hernandez-Miranda et al., 2010; Hernandez-Miranda et al., 2012). Recently, an analysis from reports and monitoring by the National Fisheries and Aquaculture Service (SERNAPESCA) over the last 15 years (2006–2021) has suggested that most massive fish mortally events occur during events of dominant south or southwest winds (i.e. with a significant equatorward component), These mass mortality events have intensified on the central Chilean coast, especially in small pelagic fish (anchoveta and sardine) and crustaceans (Sepúlveda, 2022).
The climatic risk is a probability indicator of the magnitude of damage that may occur due to changes in the environment. In this case, DO reduction is a phenomenon that has a climate forcing. Estimating risk requires knowledge of hazard, exposure and sensitivity of the system (Pörtner et al., 2022), and the spatial extension of a climatic hazard for the recent past (1980–2010) and the medium-term future (2035–2065) under different scenarios of greenhouse gas emissions (such as RCP8.5). Human coastal communities and ecosystems have an increasing risk of exposure to natural hazards (in this case hypoxia) over the EBUS due to the spatial expansion of this phenomena, and negative DO trends in upwelling systems (review in IPCC, 2019).
Equatorward wind stress is predicted to increase in the northern and southern HCS during the next decades. The Coupled Model Intercomparison Project (CMIP5) uses thirteen different models with both historical simulations and an extreme climate change scenario (RCP8.5) (Oyarzún and Brierley, 2019), indicates that the exposure of coastal marine ecosystems to hypoxia may increase direct mortality or severely affect different biological processes. For example, impact on feeding behavior, movement, growth, reproductive process, and reductions in habitat quality for plankton and benthic species is observed. In turn, these impacts scale up to population level, species composition, biodiversity, and commercial fisheries (e.g., Grantham et al., 2004; Vaquer-Sunyer and Duarte, 2008; Ekau et al., 2010; Low and Micheli, 2018; Thomas and Rahman, 2012). Moreover, severe impacts on marine organisms or even mas mortality events of fish and invertebrates are commonly associated with EBUS, where hypoxia frequently occurs (Grantham et al., 2004; Low et al., 2021). Thus, alterations in upwelling regimes as a consequence of climate change are likely to further increase the frequency and magnitude of upwelling-driven hypoxia and, in consequence, mass mortality events (Stauffer et al., 2012).
Vulnerability to hypoxia is variable across temporal and spatial scales (Low et al., 2021) and this is the case in central Chile. Since vulnerability is dependent on economic, sociocultural, geographic, demographic, and governance factors (Kelman, et al., 2016; Low et al., 2021), the Chilean coast could be considered as highly vulnerable to hypoxia. In Chile there are 100 coastal municipalities with around 4.5 million inhabitants. Fisheries and aquaculture are amongst the most important economic and socially productive activities. Climate change is expected to increase the intensity and frequency of deoxygenation over time; thus, hypoxia will increase the vulnerability of coastal communities and the fishing industry. This may lead to socioeconomic impacts such as reduced economic income for fishers and compromise food security. Furthermore, it is considered that there is a highly dependent socioeconomic relationship between artisanal fisheries and small-scale aquaculture, with the environmental services being used. This means they are more vulnerable and less resilient and require support to adapt to climate change. To mitigate this vulnerability requires, in part, continuous, high-resolution and real time DO observations in coastal upwelling ecosystems to inform decision makers and resource users in coastal zones. Unfortunately, insight into high frequency variability in the southern HCS system has been limited by the lack of in-situ and real time data of physical and biogeochemical properties in the coastal zone (Farías et al., 2019; Ramajo et al., 2020).
Thus, a monitoring network of academic, government, fishing cooperatives and social stakeholders could provide a valuable opportunity for local adaptation in the face of escalating exposure to environmental stressors (Low et al., 2021). Capacity building, community participation and adequate governance in coastal communities regions will help to reduce socio-economic impacts associated with these events.
This analysis identifies different levels of DO variability, dominated by wind driven upwelling associated with variability in high frequency intra-seasonal equatorward winds, and its interaction with low frequency seasonal cumulative wind stress. Both play an important role in controlling shelf DO variability, at high-frequency and intra annual (seasonal) scales.
The average DO in the water column (measured down to 90 m) reaches 63%–72% and 41%–48% of its volume with concentrations of less than 89.3 and 22.3 µmol L−1, respectively. During the upwelling season, as much as 87% and 81% of the water column are below these thresholds respectively. In the austral winter (during July), the water column reaches maximum oxygenation, with an average of 26% and 2% of the water column below the hypoxic and severely hypoxic thresholds respectively. Over seasonal scales, wind forcing physically controls the occurrence of hypoxia, as cumulative wind stress is well correlated with hypoxic volume, the percentage of hypoxic waters, and occurrence of severe hypoxia events in the water column.
In two consecutive upwelling seasons, between 4–6 surface hypoxia events per year are registered at 10 m depth, lasting up to 5 days. These events are not captured by a monthly sampling frequency at TST18, thus continuous monitoring is required to understand weekly and intra-seasonal variability. Most of the variability is associated with active and relaxed equatorward winds.
On interannual scales, variability is poorly understood and is weakly associated with ENSO cycles. This is likely to be due to a greater distance from the equatorial system. At mid latitudes ENSO appears to dominate local variability caused by the anticyclone and atmospheric teleconnection mechanisms.
Negative decadal trends in DO (deoxygenation) and temperature (cooling) indicate that DO loss is not associated with changes in gas solubility. Changes may occur through the influx of oxygen-poor waters that in turn increase the production of organic matter and the subsequent DO consumption. Decadal changes in the composition of source water have not been fully investigated and DO variability may be due to shifts in the vertical distribution of water-masses.
Given the clear evidence that strong upwelling-favorable wind influences the likelihood and severity of hypoxia events, due to the projected intensification of upwelling in the future (i.e., more intense and/or more frequent upwelling events) the coastal zone could become highly vulnerable, resulting in impacts on biological resources and biogeochemical cycles.
The datasets presented in this study can be found in online repositories. The names of the repository/repositories and accession number(s) can be found below: 10.48665/udec/CMHMEQ https://www.pangaea.de/.
LDM and LF contributed equally to this manuscript. LF conceived the idea to analyze different scales of oxygen variability from a DO time series that she has maintained in recent years and also an interpretation of the vulnerability analysis, LDM analyzed the data with different statistical approaches and has also made graphs and other analyzes to rule out hypotheses LDM and LF wrote and they approved the submitted version.
LF acknowledges support of the Agencia Nacional de Investigación y Desarrollo (ANID). This research was funded by FONDECYT 1200861, FONDAP-CONICYT 15110009 (CR2), Millennium Science Initiative Program ICM 2019–015 (SECOS) and Millennium Science Initiative Program NCN19_153 (Upwell).
The authors thank the biogeochemistry group of the Universidad de Concepción for their help and support, in particular Gerardo Garcias and Karen Sanzana who dedicated themselves completely in recent years. We also thank Laura Ramajo, Crsitian Vargas and reviewers for their valuable comments and suggestions. We appreciate the work of Juan Faundez and Dixon Villena on the metadata and validation of the time series data. Both the crew of R/V Kay (II) and staff of the Dichato Marine Station of the University of Concepción provided valuable help during fieldwork; as well as all participating colleagues in the COPAS time series (COPAS program started in 2002–2012 at Concepcion University, Department of Oceanography), who provided the core measurements. Particularly Renato Quiñones´s lab who provides Chl-a and oxygen (Winkler Method) data from 2012 to date and Fabian Tapia CTDO data (2016–2018). We also appreciate the work done since the beginning of COPAS Time series by many technical assistants such as Juan Faundez, Mauricio Gallegos, Luis Montecinos, Oliver Alarcon, among others.
The authors declare that the research was conducted in the absence of any commercial or financial relationships that could be construed as a potential conflict of interest.
All claims expressed in this article are solely those of the authors and do not necessarily represent those of their affiliated organizations, or those of the publisher, the editors and the reviewers. Any product that may be evaluated in this article, or claim that may be made by its manufacturer, is not guaranteed or endorsed by the publisher.
The Supplementary Material for this article can be found online at: https://www.frontiersin.org/articles/10.3389/feart.2022.929271/full#supplementary-material
Supplementary Figure S1 | (A) Ekman transport and (B) velocity smoothed over 3 months. The respective trends are represented by red dashed lines.
Supplementary Figure S2 | (A) Sigma-t and (B) dissolved oxygen hovmöller diagrams, white contours represent isopycnals, in (B) the 25.6 and 26.2 isopycnals are shown as indicators of SAAW and ESSW water masses, respectively. (C) Scatterplot showing the relation between sigma-t and DO. (D) Sigma-t and DO correlations along the water column, all significant.
Supplementary Figure S3 | Zonal cross section of oceanographic data obtained from Corredor-Acosta et al. (2020) cruises (https://doi.org/10.1594/PANGAEA.913715).
Supplementary Table S1 | Correlation coefficients among DO and different ENSO indexes (ICEN, ONI and Coastal index) at several depth layers. All significant correlations marked.
Supplementary Table S2 | Temperature (°C), Salinity (PSU) and Oxygen (umol L-1) anomalies correlation with equatorwards wind stress. All significant correlations marked.
Abrahams, A., Schlegel, R., and Smit, A. (2021). Variation and change of upwelling dynamics detected in the world's eastern boundary upwelling systems. Front. Mar. Sci. 8, 626411. doi:10.3389/fmars.2021.626411
Aguirre, C., Flores-Aqueveque, V., Vilches, P., Vásquez, A., Rutllant, J. A., and Garreaud, R. (2021b). Recent changes in the low-level jet along the subtropical west coast of south America. Atmosphere 12, 465. doi:10.3390/atmos12040465
Aguirre, C., García-Loyola, S., Testa, G., Silva, D., and Farias, L. (2018). Insight into anthropogenic forcing on coastal upwelling off south-central Chile. Elem. Sci. Anth. 6, 59. doi:10.1525/elementa.314
Aguirre, C., Garreaud, R., Belmar, L., Farías, L., Ramajo, L., and Barrera, F. (2021a). High-frequency variability of the surface ocean properties off Central Chile during the upwelling season. Front. Mar. Sci. 8, 702051. doi:10.3389/fmars.2021.702051
Aguirre, C., Garreaud, R. D., and Rutllant, J. A. (2014). Surface ocean response to synoptic-scale variability in wind stress and heat fluxes off south-central Chile. Dyn. Atmos. Oceans 65, 64–85. doi:10.1016/j.dynatmoce.2013.11.001
Ancapichún, S., and Garcés-Vargas, J. (2015). Variability of the Southeast Pacific Subtropical Anticyclone and its impact on sea surface temperature off north-central Chile. Cienc. Mar. 41, 1–20. doi:10.7773/cm.v41i1.2338
Aravena, G., Broitman, B., and Stenseth, N. C. (2014). Twelve years of change in coastal upwelling along the central-northern coast of Chile: Spatially heterogeneous responses to climatic variability. PLoS ONE 9, e90276. doi:10.1371/journal.pone.0090276
Bakun, A. (1990). Global climate change and intensification of coastal ocean upwelling. Science 247 (4939), 198–201.
Bakun, A. (1973). Coastal upwelling indices, west coast of North America, 1946-71. NOAA Technical Report NMFS SSRF-671
Bakun, A., Field, D., Redondo-Rodriguez, A., and Weeks, S. J. (2010). Greenhouse gas, upwelling-favorable winds, and the future of coastal ocean upwelling ecosystems. Glob. Change Biol. 16, 1213–1228. doi:10.1111/j.1365-2486.2009.02094.x
Bakun, A., Black, B. A., Bograd, S. J., García-Reyes, M., Miller, J., Rykaczewski, R. R., et al. (2015). Anticipated effects of climate change on coastal upwelling ecosystems. Curr. Clim. Change Rep. 1, 85–93. doi:10.1007/s40641-015-0008-4
Barth, J., Menge, B., Lubchenco, J., Chan, F., Bane, J. M., Kirincich, A. R., et al. (2007). Delayed upwelling alters nearshore coastal ocean ecosystems in the northern California current. Proc. Natl. Acad. Sci. U. S. A. 104, 3719–3724. doi:10.1073/pnas.0700462104
Belmadani, A., Echevin, V., Codron, F., Takahashi, K., and Junquas, C. (2014). What dynamics drive future wind scenarios for coastal upwelling off Peru and Chile? Clim. Dyn. 43, 1893–1914. doi:10.1007/s00382-013-2015-2
Breitburg, D., Levin, L. A., Oschlies, A., Grégoire, M., Chavez, F. P., Conley, D. J., et al. (2018). Declining oxygen in the global ocean and coastal waters. Science 359, eaam7240. doi:10.1126/science.aam7240
Bograd, S. J., Schroeder, I. D., and Jacox, M. G. (2019). A water mass history of the Southern California current system. Geophys. Res. Lett. 46, 6690–6698. doi:10.1029/2019GL082685
Cai, W., Santoso, A., Wang, G., Yeh, S-W., An, S-I., Cobb, K. M., et al. (2015). ENSO and greenhouse warming. Nat. Clim. Change 5, 849–859. doi:10.1038/nclimate2743
Carrasco, C., Karstensen, J., and Farias, L. (2017). On the nitrous oxide accumulation in intermediate waters of the Eastern South Pacific ocean. Front. Mar. Sci. 4, 24. doi:10.3389/fmars.2017.00024
Chan, F., Barth, J. A., Kroeker, K. J., Lubchenco, J., and Menge, B. A.(2019). The dynamics and impact of ocean acidification and hypoxia: Insights from sustained investigations in the northern California current large marine ecosystem. Oceanography 32, 62–71. doi:10.5670/oceanog.2019.312
Chavez, F. P., and Messié, M. (2009). A comparison of eastern boundary upwelling ecosystems. Progr. Ocean. 83, 80–96. doi:10.1016/j.pocean.2009.07.032
Chu, J. W., and Tunnicliffe, V. (2015). Oxygen limitations on marine animal distributions and the collapse of epibenthic community structure during shoaling hypoxia. Glob. Chang. Biol. 21, 2989–3004. doi:10.1111/gcb.12898
Cubillos, L., Canales, M., Hernández, A., Bucarey, D., Vilugrón, L., and Miranda, L. (1998). Poder de pesca, esfuerzo de pesca y cambios estacionales e interanuales en la abundancia relativa de Strangomera bentincki y Engraulis ringens en el área frente a Talcahuano, Chile (1990-97). Investig. Mar. 26, 3–14. doi:10.4067/S0717-71781998002600001
Daneri, G., Dellarossa, V., Quiñones, R., Jacob, B., Montero, P., and Ulloa, O. (2000). Primary production and community respiration in the Humboldt Current System off Chile and associated oceanic areas. Mar. Ecol. Prog. Ser. 197, 41–49. doi:10.3354/meps197041
Deutsch, C., Brix, H., Ito, T., Frenzel, H., and Thompson, L. (2011). Climate-forced variability of ocean hypoxia. Science 333, 336–339. doi:10.1126/science.1202422
Díaz, R. J., and Rosenberg, R. (2011). Introduction to environmental and economic consequences of hypoxia. Int. J. Water Resour. Dev. 27, 71–82. doi:10.1080/07900627.2010.531379
Diaz, R. J., and Rosenberg, R. (1995). Marine benthic hypoxia: A review of its ecological effects and the behavioural responses of benthic macrofauna. Oceanogr. Mar. Biol. An annual review, 33, 245–203.
Diaz, R. J., and Rosenberg, R. (2008). Spreading dead zones and consequences for marine ecosystems. Science 321, 926–929. doi:10.1126/science.1156401
Echevin, V., Goubanova, K., Belmadani, A., and Dewitte, B. (2012). Sensitivity of the Humboldt current system to global warming: A downscaling experiment of the IPSL-CM4 model. Clim. Dyn. 38, 761–774. doi:10.1007/s00382-011-1085-2
Edwards, M., and Richardson, A. (2004). Impact of climate change on marine pelagic phenology and trophic mismatch. Nature 430, 881–884. doi:10.1038/nature02808
Ekau, W., Auel, H., Portner, H. O., and Gilbert, D. (2010). Impacts of hypoxia on the structure and processes in pelagic communities (zooplankton, macro-invertebrates and fish). Biogeosciences 7, 1669–1699. doi:10.5194/bg-7-1669-2010
Emerson, S., Watanabe, Y. W., Ono, T., and Mecking, S. (2004). Temporal trends in apparent oxygen utilization in the upper pycnocline of the north pacific: 1980–2000. J. Oceanogr. 60, 139–147. doi:10.1023/B:JOCE.0000038323.62130.a0
Espinoza-Morriberón, D., Echevin, V., Colas, F., Tam, J., Gutierrez, D., Graco, M., et al. (2019). Oxygen variability during ENSO in the tropical south eastern pacific. Front. Mar. Sci. 5, 526. doi:10.3389/fmars.2018.00526
Espinoza-Morriberón, D., Echevin, V., Gutiérrez, D., Tam, J., Graco, M., Ledesma, J., et al. (2021). Evidences and drivers of ocean deoxygenation off Peru over recent past decades. Sci. Rep. 11, 20292. doi:10.1038/s41598-021-99876-8
Farías, L., Besoain, V., and García-Loyola, S. (2015). Presence of nitrous oxide hotspots in the coastal upwelling area off central Chile: An analysis of temporal variability based on ten years of a biogeochemical time series. Environm. Res. Lett. 10, 044017. doi:10.1088/1748-9326/10/4/044017
Farías, L., Fernández, C., Garreaud, R., Guzmán, L., Hormazábal, S., Morales, C., et al. (2019). Propuesta de un Sistema Integrado de Observación del Océano Chileno (SIOOC). Santiago: Comité Científico COP25; Ministerio de Ciencia. Tecnología, Conocimiento e Innovación.
Farías, L., Graco, M., and Ulloa, O. (2004). Temporal variability of nitrogen cycling in continental-shelf sediments of the upwelling ecosystem off central Chile. Deep-Sea Res.II 51, 2491–2505. doi:10.1016/j.dsr2.2004.07.029
Fennel, K., and Testa, J. M. (2019). Biogeochemical controls on coastal hypoxia. Ann. Rev. Mar. Sci. 11, 05–130. doi:10.1146/annurev-marine-010318-095138
Frieder, C. A., Nam, S. H., Martz, T. R., and Levin, L. A. (2012). High temporal and spatial variability of dissolved oxygen and pH in a nearshore California kelp forest. Biogeosciences 9, 3917–3930. doi:10.5194/bg-9-3917-2012
Frolicher, T., Joos, F., Plattner, G.-K., Steinacher, M., and Doney, S. C. (2009). Natural variability and anthropogenic trends in oceanic oxygen in a coupled carbon cycle-climate model ensemble. Glob. Biogeochem. Cycles 23, GB1003. doi:10.1029/2008GB003316
Fuenzalida, R., SchneiderGarces-VargasLange, W. J. C., and Bravo, L. (2009). Vertical and horizontal extension of the oxygen minimum zone in the eastern South PacificOcean. Deep-Sea Res. II 56, 992–1003. doi:10.1016/j.dsr2.2008.11.001
García-Reyes, M., Sydeman, W. J., Schoeman, D. S., Rykaczewski, R. R., Black, B. A., Smit, A. J., et al. (2015). Under pressure: Climate change, upwelling, and eastern boundary upwelling ecosystems. Front. Mar. Sci. 2, 109. doi:10.3389/fmars.2015.00109
Garreaud, R. D., Boisier, J. P., Rondanelli, R., Montecinos, A., Sepúlveda, H. H., and Veloso-Aguila, D. (2020). The central Chile mega drought (2010–2018): A climate dynamics perspective. Int. J. Climatol. 40 (1), 421–439. doi:10.1002/joc.6219
Garreaud, R., and Rutllant, J. (2003). Coastal lows along the subtropical west coast of south America: Numerical simulation of a typical case. Mon. Weather Rev. 131, 891–908. doi:10.1175/1520-0493(2003)131<0891:clatsw>2.0.co;2
Garreaud, R., Rutllant, J., and Fuenzalida, H. (2002). Coastal lows along the subtropical west coast of south America: Mean structure and evolution. Mon. Weather Rev. 130, 75–88. doi:10.1175/1520-0493(2002)130<0075:clatsw>2.0.co;2075:CLATSW>2.0.CO;2
Gergis, J. L., and Fowler, A. M. (2009). A history of ENSO events since AD 1525. doi:10.1007/s10584-008-9476-z
Graco, M. I., Purca, S., Dewitte, B., Castro, C. G., Morón, O., Ledesma, J., et al. (2017). The OMZ and nutrient features as a signature of interannual and low-frequency variability in the Peruvian upwelling system. Biogeosciences 14, 4601–4617. doi:10.5194/bg-14-4601-2017
Grantham, B. A., Chan, F., Nielsen, K. J., Fox, D. S., Barth, J. A., Huyer, A., et al. (2004). Upwelling-driven nearshore hypoxia signals ecosystem and oceanographic changes in the northeast Pacific. Nature 429, 749–754. doi:10.1038/nature02605
Gregg, W. W., Casey, N. W., and McClain, C. R. (2005). Recent trends in global ocean chlorophyll. Geophys. Res. Lett. 32, L03606. doi:10.1029/2004GL021808
Grégoire, M., Garçon, V., Garcia, H., Breitburg, D., Isensee, K., Oschlies, A., et al. (2021). A global ocean oxygen database and atl as for assessing and predicting deoxygenation and ocean health in the open and coastal ocean. Front. Mar. Sci. 8, 724913. doi:10.3389/fmars.2021.724913
Gutiérrez, D., Bouloubassi, I., Sifeddine, A., Purca, S., Goubanova, K., Graco, M., et al. (2011). Coastal cooling and increased productivity in the main upwelling zone off Peru since the mid-twentieth century. Geophys. Res. Lett. 38, l046324. doi:10.1029/2010gl046324
Helly, J. J., and Levin, L. A. (2004). Global distribution of naturally occurring marine hypoxia on continental margins. Deep Sea Res. I 51, 1159–1168. doi:10.1016/j.dsr.2004.03.009
Helm, K. P., Bindoff, N. L., and Church, J. A. (2011). Observed decreases in oxygen content of the global ocean. Geoph. Res. Lett. 38, L23602. doi:10.1029/2011GL049513
Hernández, A., and Tapia, F. J. (2021). Connecting spatial structure in subtidal benthic communities with temporal variability in bottom temperature and dissolved oxygen along an upwelling coast. Est. Coast. Shelf Sci. 250, 107166. doi:10.1016/j.ecss.2021.107166
Hernandez-Miranda, E., Quiñones, R., Aedo, G., Valenzuela, A., Mermoud, N., Román, C., et al. (2010). A major fish stranding caused by a natural hypoxic event in a shallow bay of the eastern South Pacific Ocean. J.Fish Biol. 76, 1543–1564. doi:10.1111/j.1095-8649.2010.02580.x
Hernandez-Miranda, E., Veas, R., Labra, F. A., Salamanca, M., and Quiñones, R. A. (2012). Response of the epibenthic macrofaunal community to a strong upwelling-driven hypoxic event in a shallow bay of the southern Humboldt Current System. Mar. Environm. Res. 79, 16–28. doi:10.1016/j.marenvres.2012.04.004
Hofmann, M., and Schellnhuber, H. J. (2009). Oceanic acidification affects marine carbon pump and triggers extended marine oxygen holes. Proc.Nat. Acad. Sci. 106, 3017–3022. doi:10.1073/pnas.0813384106
Hormazabal, S., Shaffer, G., and Pizarro, O. (2002). Tropical Pacific control of intraseasonal oscillations off Chile by way of oceanic and atmospheric pathways. Geophys. Res.Lett. 29, 1–4. doi:10.1029/2001GL013481
Howarth, R., Chan, F., Conley, D. J., Garnier, J., Doney, S. C., Marino, R., et al. (2011). Coupled biogeochemical cycles: Eutrophication and hypoxia in temperate estuaries and coastal marine ecosystems. Front. Ecol. Environm. 9, 18–26. doi:10.1890/100008
Hu, Y., and Fu, Q. (2007). Observed poleward expansion of the Hadley circulation since 1979. Atmos. Chem. Phys. 7, 5229–5236. doi:10.5194/acp-7-5229-2007
Keeling, R. F., Körtzinger, A., and Gruber, N. (2010). Ocean deoxygenation in a warming world. Annu. Rev. Mar. Sci. 2, 199–229. doi:10.1146/annurev.marine.010908.163855
Kelman, I., Gaillard, J. C., Lewis, J., and Mercer, J. (2016). Learning from the history of disaster vulnerability and resilience research and practice for climate change. Nat. Hazards 82, 129–143. doi:10.1007/s11069-016-2294-0
Kraus, E. B., Businger, J. A., Lam, P., and Kuypers, M. M. M. (1994). Microbial nitrogen cycling processes in oxygen minimum zones. Atmosphere-ocean Interactionann. Rev. Mar. Sci. 273, 317–345. doi:10.1093/oso/9780195066180.001.000110.1146/annurev-marine-120709-142814
Llanillo, P. J., Karstensen, J., Pelegrí, J. L., and Stramma, L. (2013). Physical and biogeochemical forcing of oxygen and nitrate changes during El Niño/El Viejo and La Niña/La Vieja upper-ocean phases in the tropical eastern South Pacific along 86° W. Biogeosciences 10, 6339–6355. doi:10.5194/bg-10-6339-2013
Llanillo, P. J., Pelegrí, J. L., Duarte, C. M., Emelianov, M., Gasser, M., Gourrion, J., et al. (2012). Meridional and zonal changes in water properties along the continental slope off central and northern Chile. Cienc. Mar. 38 (1B), 307–332. doi:10.7773/cm.v38i1b.1814
Low, N. H., and Micheli, F. (2018). Lethal and functional thresholds of hypoxia in two key benthic grazers. Mar. Ecol. Prog. Ser. 594, 165–173. doi:10.3354/meps12558
Low, N. H. N., Micheli, F., Aguilar, J. D., Romero Arce, D., Boch, C. A., Bonilla, J. C., et al. (2021). Variable coastal hypoxia exposure and drivers across the southern California Current. Curr. Sci. Rep. 11, 10929. doi:10.1038/s41598-021-89928-4
Marrari, M., Piola, A. R., and Valla, D. (2017). Variability and 20-year trends in satellite-derived surface chlorophyll concentrations in large marine ecosystems around South and Western Central America. Front. Mar. Sci. 4, 372. doi:10.3389/fmars.2017.00372
Masotti, I., Aparicio, P., Yevenes, M., Garreaud, R., Belmar, L., and Farías, L. (2018). The influence of river discharge on nutrient export and phytoplankton biomass off the Central Chile Coast (33°–37°S): Seasonal Cycle and Interannual Variability. Front. Mar. Sci. 5. doi:10.3389/fmars.2018.00423
Mohrholz, V., Bartholomae, C. H., Van der Plas, A. K., and Lass, H. U. (2008). The seasonal variability of the northern Benguela undercurrent and its relation to the oxygen budget on the shelf. Cont. Shelf Res. 28 (3), 424–441. doi:10.1016/j.csr.2007.10.001
Monteiro, P. M., Dewitte, B., Scranton, M. I., Paulmier, A., and van der Plas, A. K. (2011). The role of open ocean boundary forcing on seasonal to decadal-scale variability and long-term change of natural shelf hypoxia. Environ. Res. Lett. 6 (2), 025002. doi:10.1088/1748-9326/6/2/025002
Monteiro, P. M. S., Van Der Plas, A. K., Melice, J. L., and Florenchie, P. (2008). Interannual hypoxia variability in a coastal upwelling system: Ocean–shelf exchange, climate and ecosystem-state implications. Deep Sea Res. Part I 55 (4), 435–450. doi:10.1016/j.dsr.2007.12.010
Montes, I., Dewitte, B., Gutknecht, E., Paulmier, A., Dadou, I., Oschlies, A., et al. (2014). High-resolution modeling of the Eastern Tropical Pacific oxygen minimum zone: Sensitivity to the tropical oceanic circulation. J. Geophys. Res. Oceans 119, 5515–5532. doi:10.1002/2014JC009858
Morales, C. E., Hormazábal, S. E., and Blanco, J. (1999). Interannual variability in the mesoscale distribution of the depth of the upper boundary of the oxygen minimum layer off northern Chile (18–24S): Implications for the pelagic system and biogeochemical cycling. J. Mar. Res. 57 (6), 909–932. doi:10.1357/002224099321514097
Naqvi, S. W. A. (2021). Deoxygenation in marginal seas of the Indian ocean. Front. Mar. Sci. 8, 624322. doi:10.3389/fmars.2021.624322
Nelson, C. S. (1977). Wind stress and wind stress curl over the California Current (Vol. 714). Department of Commerce, National Oceanic and Atmospheric Administration, National Marine Fisheries Service. doi:10.5962/bhl.title.60783
Oschlies, A., Brandt, P., Stramma, L., and Schmidtko, S. (2018). Drivers and mechanisms of ocean deoxygenation. Nat. Geosci. 11 (7), 467–473. doi:10.1038/s41561-018-0152-2
Oschlies, A., Schulz, K. G., Riebesell, U., and Schmittner, A. (2008). Simulated 21st century's increase in oceanic suboxia by CO2-enhanced biotic carbon export. Glob. Biogeochem. Cycles 22 (4). doi:10.1029/2007GB003147
Oschlies, A. A. (2021). Committed fourfold increase in ocean oxygen loss. Nat. Commun. 12, 2307. doi:10.1038/s41467-021-22584-4
Oyarzún, D., and Brierley, C. M. (2019). The future of coastal upwelling in the Humboldt current from model projections. Clim. Dyn. 52 (1), 599–615. doi:10.1007/s00382-018-4158-7
Paulmier, A., and Ruiz-Pino, D. (2009). Oxygen minimum zones (OMZs) in the modern ocean. Prog. Oceanogr. 80 (3–4), 113–128. doi:10.1016/j.pocean.2008.08.001
Pauly, D., and Christensen, V. (1995). Primary production required to sustain global fisheries. Nature 374 (6519), 255–257. doi:10.1038/374255a0
Pitcher, G. C., Aguirre-Velarde, A., Breitburg, D., Cardich, J., Carstensen, J., Conley, D. J., et al. (2021). System controls of coastal and open ocean oxygen depletion. Progr. Oceanogr. 197, 102613. doi:10.1016/j.pocean.2021.102613
Pitcher, G. C., Probyn, T. A., Randt, A. D., Lucas, A. J., Bernard, S., Evers-King, H., et al. (2014). Dynamics of oxygen depletion in the nearshore of a coastal embayment of the southern Benguela upwelling system. J. Geophys. Res. C 119, 2183–2200. doi:10.1002/2013jc009443
Pizarro, O., Shaffer, G., Dewitte, B., and Ramos, M. (2002). Dynamics of seasonal and interannual variability of the Peru-Chile Undercurrent. Geophys. Res. Lett. 29 (12), 1581–1584. doi:10.1029/2002GL014790
Pizarro-Koch, M., Pizarro, O., Dewitte, B., Montes, I., Ramos, M., Paulmier, A., et al. (2019). Seasonal variability of the southern tip of the oxygen minimum zone in the Eastern South Pacific (30-38 S): A modeling study. J. Geophys. Res. C 124 (12), 8574–8604. doi:10.1029/2019JC015201
Pörtner, H.-O., Roberts, D. C., AdamsAdelekanAdlerAdrian, H. I. C., et al. (2022). “Technical summary,” in Climate change 2022: Impacts, adaptation, and vulnerability. Contribution of working group II to the sixth assessment report of the intergovernmental panel on climate change. Editors H.-O. Pörtner, D. C. Roberts, M. Tignor, E. S. Poloczanska, K. Mintenbeck, A. Alegríaet al. (Cambridge University Press).
IPCC (2022). in Climate change 2022: Impacts, adaptation, and vulnerability. Contribution of working group II to the sixth assessment report of the intergovernmental panel on climate change. Editors H.-O. Pörtner, D. C. Roberts, M. Tignor, E. S. Poloczanska, K. Mintenbeck, A. Alegríaet al. (Cambridge University PressPress).
IPCC (2019). in IPCC special report on the ocean and cryosphere in a changing climate. Editors H-O. Pörtner, D. C. Roberts, V. Masson-Delmotte, P. Zhai, M. Tignor, E. Poloczanskaet al. (Cambridge University Press).
Rahn, D. A., and Garreaud, R. D. (2013). A synoptic climatology of the near-surface wind along the west coast of South America. Int. J. Climatol. 34 (3), 780–792. doi:10.1002/joc.3724
Ramajo, L., Valladares, M., Astudillo, O., Fernández, C., Rodríguez-Navarro, A. B., Watt-Arévalo, P., et al. (2020). Upwelling intensity modulates the fitness and physiological performance of coastal species: Implications for the aquaculture of the scallop Argopecten purpuratus in the Humboldt Current System. Sci. Total Environ. 745, 140949. doi:10.1016/j.scitotenv.2020.140949
Saldías, G. S., Largier, J. L., Mendes, R., Pérez-Santos, I., Vargas, C. A., and Sobarzo, M. (2016). Satellite-measured interannual variability of turbid river plumes off central-southern Chile: Spatial patterns and the influence of climate variability. Prog. Oceanogr. 146, 212–222. doi:10.1016/j.pocean.2016.07.007
Saldías, G. S., SobarzoLargierMoffat, M. J. C., Letelier, R., and Letelier, R. (2012).Seasonal variability of turbid river plumes off central Chile based on high-resolution MODIS imagery. Remote Sens. Environ., 123, 220–233. doi:10.1016/j.rse.2012.03.010
Schmidtko, S., Stramma, L., and Visbeck, M. (2017). Decline in global oceanic oxygen content during the past five decades. Nature 542 (7641), 335–339. doi:10.1038/nature21399
Schmittner, A., Oschlies, A., Matthews, H. D., and Galbraith, E. D. (2008). Future changes in climate, ocean circulation, ecosystems, and biogeochemical cycling simulated for a business-as-usual CO2 emission scenario until year 4000 AD. Glob. Biogeochem. Cycles 22 (1), 22. doi:10.1029/2007GB002953
Schneider, W., Donoso, D., Garcés-Vargas, J., and Escribano, R. (2017). Water-column cooling and sea surface salinity increase in the upwelling region off central-south Chile driven by a poleward displacement of the South Pacific High. Prog. Oceanogr. 151, 38–48. doi:10.1016/j.pocean.2016.11.004
Schneider, W., Fuenzalida, R., Rodriguez-Rubio, E., Garcés-Vargas, J., and Bravo, L. (2003). Characteristics and formation of Eastern South Pacific intermediate water. Geophys. Res. Lett. 30, 1581. doi:10.1029/2003gl017086
Sepúlveda, S. (2022). Análisis histórico de varazones de organismos marinos asociada a eventos de surgencia costera y sus implicancias socio-ambientales en la zona costera de la región del Biobío. Tesis para la obtención del grado de Ingeniero Ambiental. Concepción, Chile: Universidad de Concepción, 91.
Silva, N., Rojas, N., and Fedele, A. (2009). Water masses in the Humboldt Current System: Properties, distribution, and the nitrate deficit as a chemical water mass tracer for Equatorial Subsurface Water off Chile. Deep Sea Res. Part II 56, 1004–1020. doi:10.1016/j.dsr2.2008.12.013
Silva, N. S., and Neshyba, S. (1979). On the southernmost extension of the Peru-Chile undercurrent. Deep Sea Res. 26, 1387–1393. doi:10.1016/0198-0149(79)90006-2
Sobarzo, M., Bravo, L., Donoso, D., Garcés-Vargas, J., and Schneider, W. (2007). Coastal upwelling and seasonal cycles that influence the water column over the continental shelf off central Chile. Prog. Oceanogr. 75, 363–382. doi:10.1016/j.pocean.2007.08.022
Srain, B., Pantoja, S., Sepúlveda, J., Lange, C. B., Muñoz, P., Summons, R. E., et al. (2015). Interdecadal changes in intensity of the oxygen minimum zone off Concepción, Chile (∼ 36° S), over the last century. Biogeosciences 12, 6045–6058. doi:10.5194/bg-12-6045-2015
Stachowitsch, M. (1991). Anoxia in the northern adriatic sea: Rapid death, slow recovery, 58. London, United Kingdom: Geological Society, London, Special Publications, 119–129. doi:10.1144/gsl.sp.1991.058.01.09
Stachowitsch, M. (1984). Mass mortality in the Gulf of Trieste: The course of community destruction. Mar. Ecol. 5 (3), 243–264. doi:10.1111/j.1439-0485.1984.tb00124.x
Stauffer, B. A., Gellene, A. G., Schnetzer, A., Seubert, E. L., Oberg, C., Sukhatme, G. S., et al. (2012). An oceanographic, meteorological, and biological ‘perfect storm’ yields a massive fish kill. Mar. Ecol. Prog. Ser. 468, 231–243. doi:10.3354/meps09927
Steckbauer, A., Duarte, C. M., Carstensen, J., Vaquer-Sunyer, R., and Conley, D. J. (2011). Ecosystem impacts of hypoxia: Thresholds of hypoxia and pathways to recovery. Environ. Res. Lett. 6 (2), 025003. doi:10.1088/1748-9326/6/2/025003
Stramma, L., Prince, E. D., Schmidtko, S., Luo, J., Hoolihan, J. P., Visbeck, M., et al. (2012). Expansion of oxygen minimum zones may reduce available habitat for tropical pelagic fishes. Nat. Clim. Change 2 (1), 33–37. doi:10.1038/nclimate1304
Strub, P. T., Mesias, J. M., Montecino, -B. V., Rutllant, -C. J., and Salinas-M, S. (1998), The Sea. “Coastal ocean circulation off western South America,”. Editors A. R. Robinson, and K. H. Brink (New York, NY: John Wiley & Sons), 11, 273–313.
Sydeman, W. J., García-Reyes, M., Schoeman, D. S., Rykaczewski, R. R., Thompson, S. A., Black, B. A., et al. (2014). Climate change. Climate change and wind intensification in coastal upwelling ecosystems. Science 345 (6192), 77–80. doi:10.1126/science.1251635
Takahashi, K., and Martínez, A. G. (2019). The very strong coastal El Niño in 1925 in the far-eastern Pacific. Clim. Dyn. 52, 7389–7415. doi:10.1007/s00382-017-3702-1
Takahashi, K., Mosquera, K., and Reupo, J. (2014). in El índice costero El niño (ICEN): Historia y actualización. Boletín técnico generación de modelos climáticos para el pronóstico de la ocurrencia del fenómeno El niño. Editor K. Takahashi (Lima: Instituto Geofísico del Perú), 8–9. http://hdl.handle.net/20.500.12816/4639.
Talley, L. D. (1999). Some aspects of ocean heat transport by the shallow, intermediate and deep overturning circulations. Geophys. Monograph-American Geophys. Union 112, 1–22. doi:10.1029/gm112p0001
Testa, G., Masotti, I., and Farias, L. (2018). Temporal variability in net primary production in an upwelling area off Central Chile (36ºS). Front. Mar. Sci. 5. doi:10.3389/fmars.2018.00179
Thiel, M., Castilla, J. C., Fernández, M., and Navarrete, S. (2007). The Humboldt current system of northern and central Chile. Oceanogr. Mar. Biol. Annu. Rev. 45, 195–344. doi:10.1201/9781420050943
Thomas, P., and Rahman, M. S. (2012). Extensive reproductive disruption, ovarian masculinization and aromatase suppression in Atlantic croaker in the northern Gulf of Mexico hypoxic zone. Proc. Royal Soc. B. 279 (1726), 28–38. doi:10.1098/rspb.2011.0529
Trucco-Pignata, P. N., Hernández-Ayón, J. M., Santamaria-del-Angel, E., Beier, E., Sánchez-Velasco, L., Godínez, V. M., et al. (2019). Ventilation of the upper oxygen minimum zone in the coastal region off Mexico: Implications of el niño 2015–2016. Front. Mar. Sci. 459. doi:10.3389/fmars.2019.00459
Ulloa, O., Escribano, R., Hormazabal, S., Quiñones, R. A., Gonzalez, R. R., and Ramos, M. (2001). Evolution and biological effects of the 1997-98 El Niño in the upwelling ecosystem off northern Chile. Geophys. Res. Lett. 28, 1591–1594. doi:10.1029/2000GL011548
Vaquer-Sunyer, R., and Duarte, C. M. (2008). Thresholds of hypoxia for marine biodiversity. PNAS 105 (40), 15452–15457. doi:10.1073/pnas.0803833105
Walsh, J. J. (1991). Importance of continental margins in the marine biogeochemical cycling of carbon and nitrogen. Nature 350, 53–55. doi:10.1038/350053a0
Wang, B., Luo, X., Yang, Y. M., Sun, W., Cane, M. A., Cai, W., et al. (2019). Historical change of El Niño properties sheds light on future changes of extreme El Niño. PNAS 116 (45), 22512–22517. doi:10.1073/pnas.1911130116
Wang, D., Gouhier, T. C., Menge, B. A., and Ganguly, A. R. (2015). Intensification and spatial homogenization of coastal upwelling under climate change. Nature 518 (7539), 390–394. doi:10.1038/nature14235
Weidberg, N., Ospina-Alvarez, A., Bonicelli, J., Barahona, M., Aiken, C. M., Broitman, B. R., et al. (2020). Spatial shifts in productivity of the coastal ocean over the past two decades induced by migration of the Pacific Anticyclone and Bakun's effect in the Humboldt Upwelling Ecosystem. Glob. Planet Change 193, 103259. doi:10.1016/j.gloplacha.2020.103259
Whitney, F. A., Freeland, H. J., and Robert, M. (2007). Persistently declining oxygen levels in the interior waters of the eastern subarctic Pacific. Prog. Oceanogr. 75 (2), 179–199. doi:10.1016/j.pocean.2007.08.007
Winckler Grez, P., Aguirre, C., Farías, L., Contreras-López, M., and Masotti, Í. (2020). Evidence of climate-driven changes on atmospheric, hydrological, and oceanographic variables along the Chilean coastal zone. Clim. Change 163 (2), 633–652. doi:10.1007/s10584-020-02805-3
Keywords: central Chile, marine hypoxia, time series, coastal upwelling, intra-seasonal, seasonal and inter-annual variability, decadal trend
Citation: De La Maza L and Farías L (2023) The intensification of coastal hypoxia off central Chile: Long term and high frequency variability. Front. Earth Sci. 10:929271. doi: 10.3389/feart.2022.929271
Received: 26 April 2022; Accepted: 15 December 2022;
Published: 06 January 2023.
Edited by:
Claudio Latorre, Pontificia Universidad Católica de Chile, ChileReviewed by:
Cristina Schultz, Princeton University, United StatesCopyright © 2023 De La Maza and Farías. This is an open-access article distributed under the terms of the Creative Commons Attribution License (CC BY). The use, distribution or reproduction in other forums is permitted, provided the original author(s) and the copyright owner(s) are credited and that the original publication in this journal is cited, in accordance with accepted academic practice. No use, distribution or reproduction is permitted which does not comply with these terms.
*Correspondence: Laura Farías, bGF1cmEuZmFyaWFzQHVkZWMuY2w=
Disclaimer: All claims expressed in this article are solely those of the authors and do not necessarily represent those of their affiliated organizations, or those of the publisher, the editors and the reviewers. Any product that may be evaluated in this article or claim that may be made by its manufacturer is not guaranteed or endorsed by the publisher.
Research integrity at Frontiers
Learn more about the work of our research integrity team to safeguard the quality of each article we publish.