 Bin Deng1,2
 Pan Liu1
 Ren Jie Chin3*
 Pavitra Kumar4
 Changbo Jiang1,2
 Yifei Xiang5Yizhuang Liu1,2Sai Hin Lai6Hongmei Luo7*
- 1School of Hydraulic Engineering, Changsha University of Science and Technology, Changsha, China
- 2Key Laboratory of Dongting Lake Aquatic Eco-Environmental Control and Restoration of Hunan Province, Changsha, China
- 3Department of Civil Engineering, Lee Kong Chian Faculty of Engineering and Science, Universiti Tunku Abdul Rahman, Kajang, Selangor, Malaysia
- 4Department of Geography and Planning, University of Liverpool, Liverpool, United Kingdom
- 5College of Artificial Intelligence, Guangxi Minzu University, Nanning, China
- 6Department of Civil Engineering, Faculty of Engineering, Universiti Malaya, Kuala Lumpur, Malaysia
- 7Hunan Provincial Meteorological Service Center, Changsha, Hunan Province, China
A reliable water level prediction in a lake system is crucial for water resources management, flood control, etc. The objective of this study is to propose a machine learning model which is able to achieve a considerably high level of accuracy in terms of water level prediction. Dongting Lake, which is the second-largest freshwater lake system in China, was selected as the study area. The hourly water level, flow rate, rainfall and temperature of the upstream water stations and rainfall of the downstream water stations were used as the input features, to predict the water level at the downstream stations. Multilayer perceptron neural network (MLP-NN), Elman neural network (ENN), and integration of particle swarm optimisation algorithm to Elman neural network (PSO-ENN) were selected as the model development techniques. The PSO-ENN model appears as the best performed model, as it records NSE of 0.929–0.988, RMSE of 0.129–0.322 and MAE of 0.151–0.359 at the downstream stations in Dongting Lake. The PSO-ENN model also shows its ability to provide better performance for the water level prediction of 36 h in advance. In terms of input variables sensitivity, the developed model is most sensitive to flow rate, followed by rainfall.
Introduction
Large freshwater lakes are extremely important natural resources. The studies that focus on such system have been carried out throughout the years (Liu et al., 2015; Tularam et al., 2017). Dongting Lake is the second-largest freshwater lake in China. Hence, it is essential to have a better understanding of Dongting Lake from different aspects as it may bring significant impacts in terms of lake natural resources management and protection, as well as biodiversity conservation (Hayashi and Kamp, 2021). The First Law of Geography (TFL) states that all things are connected, yet things that are close to each other are more connected than things that are far away from each other (Reid and Beeton, 1992). In reality, the water level is not only affected by the river basins, but also related to other factors such as flow rate, rainfall, and temperature (Hoque and Adhikary, 2020). Therefore, understanding the interaction between rivers and lakes is important to study water level fluctuation in lake areas, and hence predict the occurrence of floods (Hu et al., 2007; Palmer et al., 2011). Floods happening around Dongting Lake areas have become one of the most frequent disasters in Yangtze River basin in recent decades (Lai and Wang, 2017). In particular, the catastrophic flood in 1998 has caused a loss of 223 million people and 30 billion RMB (Chen, 2000). Therefore, an accurate water level in the lake areas is crucial for flood control and improvement of flood control effectiveness.
Water level prediction has been a popular topic in hydrological research for quite a long time. Global studies on water level prediction in Dongting Lake can be divided into two main categories, which are physical process-based and data feature-based (Peprah and Larbi, 2021; Win et al., 2021). The former is the study of physical processes to build predictive models, containing equations and parameters involving several physical properties. Song et al. (2011) used Moderate Resolution Imaging Spectroradiometer (MODIS) data to calculate the water surface area of Dongting Lake, and then combined it with water level data from hydrological stations (ranging between 2003 and 2006) to derive the area-water level relationship of Dongting Lake. Dai et al. (2020) used Mann-Kendall method to determine and simulate the water level of Dongting Lake and its driving force, and analyse the trend and abrupt change of its driving force. However, these methods require a large number of physical parameters for modelling purposes. Their applications are often limited by the realistic unavailability of the data, high threshold of the model application, and the overlying complex processing procedures (Gayathri et al., 2015).
With the development of modern computer technology, the application of mathematical models or machine learning theory for water level prediction has developed rapidly (Li, 2017; Zhang et al., 2020; Gan et al., 2021). Chen et al. (2018) studied the water level variation of Dongting Lake and its relationship with the upstream Three Gorges Dam, thereby establishing a long short-term memory (LSTM) network model to predict the daily water level of Dongting Lake. Pan et al. (2020) developed a combination of convolutional neural network and gated recurrent unit (CNN-GRU) model for water level prediction by using a large amount of water level data from Yangtze River and other rivers. Li et al. (2019) combined three different optimisation algorithms, namely particle swarm optimisation (PSO), genetic algorithm (GA) and artificial bee colony (ABC), with multilayer perceptron neural network (MLP-NN) to develop PSO-MLP-NN, GA-MLP-NN and ABC-MLP-NN models for effective prediction of groundwater level. In general, the LSTM and other deep learning models exhibit a considerably well performance for water level prediction in Dongting Lake. However, the aforementioned models are modelled based on the daily step size, so they are limited in terms of applicability, especially for predicting the peak water level with hourly step size during severe floods.
MLP-NN is commonly applied in studies related to forecasting as it has a good non-linear fitting ability, however, it may face defects such as minimum value limitation and long training time when the database is large (Informatik et al., 2003). In contrast, Elman neural network (ENN) has less potential to face a similar issue, as its weights tend to fall into local minima in the process of training with stochastic gradient descent algorithm (Covachev and Covacheva, 2021). On the other hand, the PSO algorithm has the ability to perform a global search and quickly find the optimal value. Therefore, integrating the PSO algorithm with the ENN has great potential further improve the overall model performance (Aziz et al., 2021).
Based on the past literatures, a research gap was found, where the water level prediction model in previous studies were mainly developed using the daily step size. This study is innovative in terms of proposing the development of hybrid metaheuristic machine learning model using the hourly step size to provide a more promising result. The main objective of this study is to propose multilayer perceptron neural network (MLPNN), Elman neural network (ENN) and integration of particle swarm optimisation and Elman neural network (PSO-ENN) models for the water level prediction in Dongting Lake areas by incorporating the hourly data. In addition, this study also aims to test the sensitivity of the input variables through the sensitivity analysis.
Materials and methods
Study area
The study area of this research is Dongting Lake, the second-largest freshwater lake in China. The lake system received water from various sources. At the northern part, water from Yangtze River flows into it through the “three mouths”, whereas at the western and southern parts, Dongting Lake received water from the “four waters”, called Lishui, Yuanjiang, Zishui and Xiangjiang. Dongting Lake is considered one of the lakes that provides regulation and storage to the Yangtze River Basin (Li et al., 2013). Figure 1 shows the topography of Dongting Lake, where it is roughly in a “U” shape. The northwest of the lake has a higher elevation, and it is usually divided into three main regions, with the name of East Dongting Lake, West Dongting Lake and South Dongting Lake (Guangwei et al., 2014).
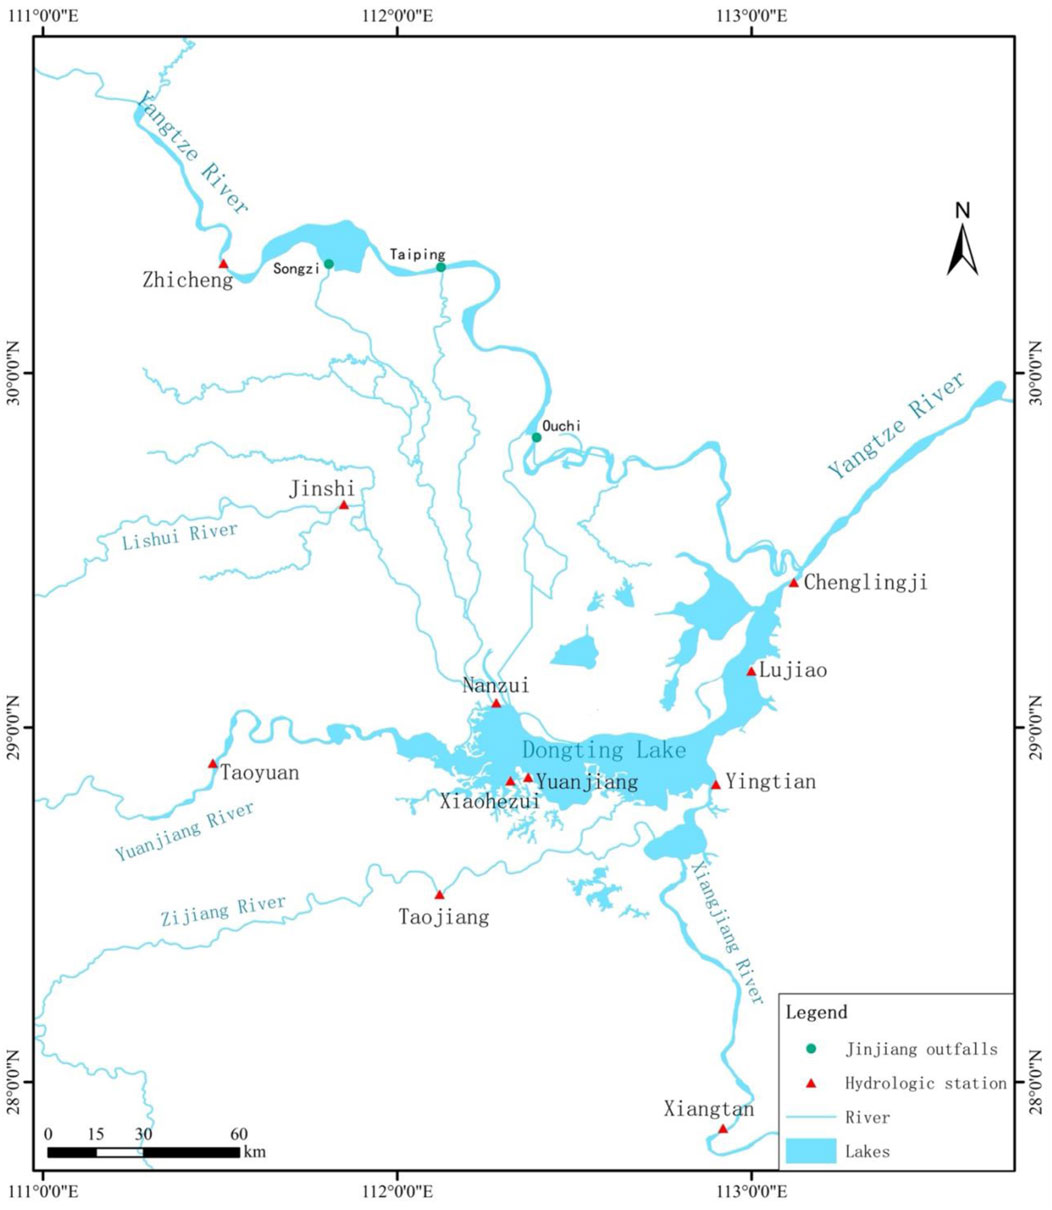
FIGURE 1. Spatial distribution of monitoring stations around Dongting Lake used in this study.
The annual average temperature in the lake area range from 16 to 17°C. The total annual rainfall is recorded at a range of 1,200–1,400 mm, where most of the rainfall events are concentrated during the summer period, around July and August. Affected by the flood season of the “four waters” flood season, it is a norm for the water level in Dongting Lake to rise in April. Similarly, during the flood season of Yangtze River which normally falls from June to September, the water level in the lake areas increases as the consequence of the rapid increase of flow from the “three mouths”, where the water reaches its peak from July to August. During September, the water level tends to gradually decrease because the outflow exceeds the inflow. Meanwhile, from November to March of the second year, since such a duration is the dry season, the water level reaches its lowest peak (Zhang et al., 2018).
Data collection
Figure 1 shows the monitoring stations around Dongting Lake, which are Zhicheng station (located at the mainstream of Yangtze River), Xiangtan station (located at Xiangjiang), Taojiang station (located at Zishui), Taoyuan station (located at Yuanjiang) and Jinshi Station (located at Lishui), Nanzui and Xiaohezui stations (located at West Dongting Lake), Yuanjiang and Yingtian stations (located at South Dongting Lake), as well as Lujiao and Chenglingji stations (located at East Dongting Lake). The hourly water level and rainfall data of all the stations were collected. At the same time, flow rate and temperature data of the upstream stations (Zhicheng, Xiangtan, Taojiang, Taoyuan and Jinshi stations) were obtained from the relevant authorities. The duration of the collected time series data ranged from year 2004–2021.
Since the collected data is wide in terms of its value ranges, z-score method was applied to standardise the data before performing model training (Turyn, 2013). The calculation method is as follows:
where
Multilayer perceptron and Elman neural networks
Multilayer perceptron neural network (MLP-NN) is a network, which is developed based on the feedforward neural network (FFNN), and proposed by McCulloch and Pitts (Taheri et al., 2016; Deng et al., 2019). Figure 2 exhibits the architecture of a MLP-NN model, containing three layers which are input, hidden and output layers, having a specific number of neurons in each layer. The basic process is as follows:

FIGURE 2. Network architecture of Multilayer Perceptron Neural Network (MLP-NN) for this study.
The input vector is fed from the input layer, and all neurons in the hidden layer as well as the output layer are connected to all neurons in the adjacent layers, and neurons between the same layers are not connected. The forward signal propagation process of MLP is computed sequentially from the input layer to the output layer. For an MLP with input and output vectors of n1 and nm, respectively, and containing m hidden layers, the number of nodes in each hidden layer is (n2, n3, ..., nm-1), the computation of each node in the forward signal propagation process is as follows:
where
MLP is a typical supervised learning algorithm, and its loss function is defined as is defined as:
where: h is the output value of MLP; y is the actual value; ‖-‖ is any of the distance parametrization, which is usually taken as 2 parametrizations.
The parameters (including weights and biases) are generally adjusted by the gradient descent method to minimize the loss function. In this paper, the parameter adjustment algorithm of MLP adopts the momentum BP algorithm. The gradient calculation and the calculation method of the momentum BP algorithm are as follows:
Eq. 5 is the calculation of the gradient; α and β in Eq. 6 are in the range of 0–1, which are both taken as 0.5 in this paper.
Elman proposed the Elman neural network (ENN) for speech processing problems in 1990, which is a typical local regression network (Kxa et al., 2019). Figure 3 shows the architecture of the ENN, which is mainly composed of input, hidden, output and successor layers. The Elman neural network is based on a BP neural network with the addition of the carryover layer as a delay operator compared to the MLP, which gives the network a dynamic memory function. The signals are transmitted from the input layer into the network. The transfer function of the implicit layer can be linear or nonlinear. This internal feedback mechanism makes the model sensitive to historical state data and improves the model’s ability to model and process information dynamically. The output layer acts as a linear weighting for the cells and the transfer function is linear.
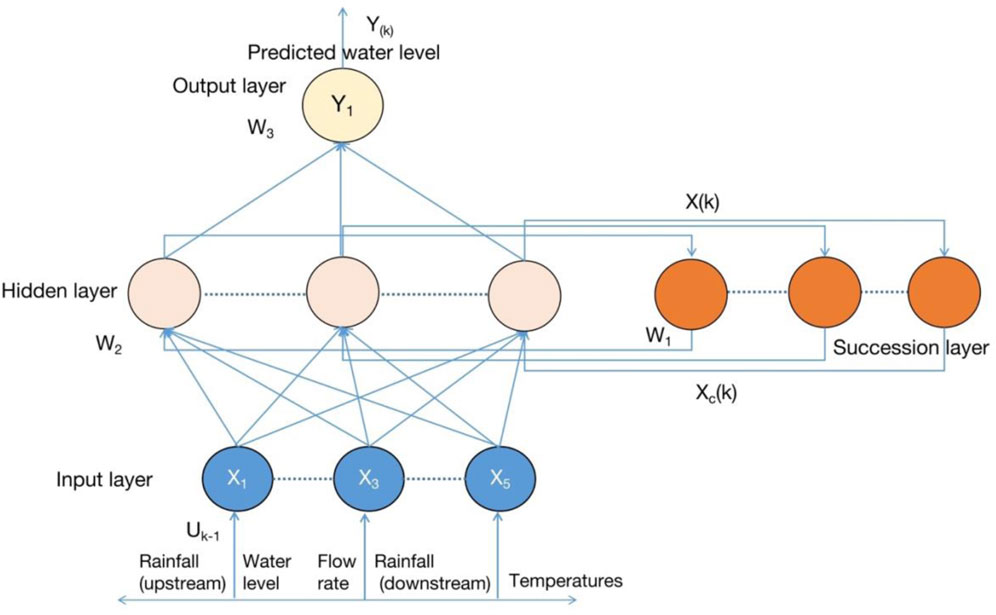
FIGURE 3. Network architecture of Elman Neural Network (ENN) for this study.
Taking Figure 3 as an example, the expression in the ENN are:
where
where
Integration of Elman neural network with particle swarm optimisation
In general, an ENN, which is trained by the backpropagation algorithm, is prone to fall into local minima, etc. Meanwhile, a particle swarm optimisation (PSO) algorithm can search globally and achieve fast convergence (Buyukyildiz and Tezel, 2015). Therefore, PSO was selected to optimise the ENN as a solution of its defect.
Assuming that there are K particles in the M-dimensional space, the PSO will randomly initialise the position and velocity of each particle in the space. The current velocity vector of the i-th particle is recorded as
where i = 1, 2, …, k, l = 1, 2, …, M, ω is the inertia factor, c1 and c2 are the learning factors, and r1 and r2 are uniform random numbers in [0,1]. The flow of ENN optimisation using PSO is shown in Figure 4.
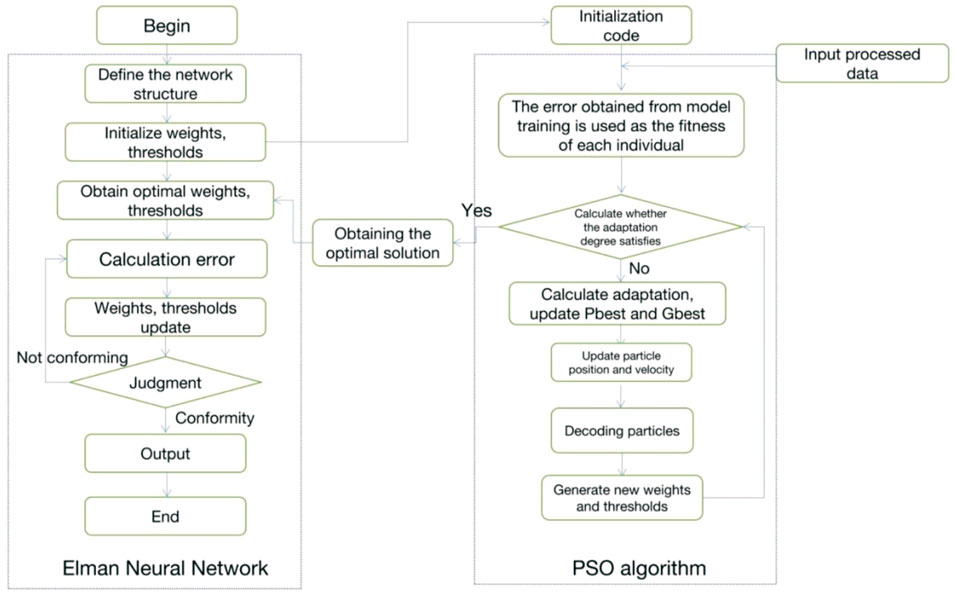
FIGURE 4. Optimisation of Elman Neural Network (ENN) using Particle Swarm Optimisation (PSO).
Model evaluation
Various indicators were used to evaluate the model performance, which are root mean square error (RMSE), Nash efficiency coefficient (NSE), mean absolute error (MAE) and coefficient of determination (R2).
MSE is the standard deviation of the residuals (prediction errors). In other words, it represents how concentrated the data is around the line of best fit. RMSE can be expressed as:
where n is the number of data pairs, x is the observed variable and y is the predicted variable.
NSE is calculated as one minus the ratio of the error variance of the modeled time-series divided by the variance of the observed time-series. NSE can be written as:
where n is the number of data pairs, x is the observed variable, y is the predicted variable,
MAE measures the residuals or differences between the observed and predicted data. The formula of MAE is shown as below:
where n is the number of data pairs, x is the observed variable and y is the predicted variable.
The coefficient of determination (R2) shows the variance between two groups of data or observed and predicted variables. The formula of R2 is
where n is the number of data pairs, x is the observed variable and y is the predicted variable.
Model development
The model development was conducted by using the processed data, where the water level, flow rate, rainfall and temperature from the upstream stations (Zhicheng, Xiangtan, Taojiang, Taoyuan and Jinshi stations), as well as the rainfall from Nanzui, Xiaohezui, Yuanjiang, Yingtian, Lujiao, and Chenglingji stations in Dongting Lake were applied as the input variables, while the water level of Nanzui and Xiaohezui stations (at West Dongting Lake), Yuanjiang and Yingtian stations (at South Dongting Lake), as well as Lujiao and Chenglingji stations (at East Dongting Lake) was set as the output variable.
According to the convention of deep learning, the obtained data needs to be divided into appropriate training and testing sets between the import of dataset samples to the model training. In fact, there is no clear method available so far for the division between datasets. Based on the experience of related studies (Akter and Desai, 2018; Ren et al., 2020), most authors suggest that 60%–80% of the data as the training set is used as the training set and the remaining 20%–40% as the test set, and that selecting the largest proportion of the data set for model training provides the maximum input and output training for the model, thus allowing the model to achieve the best prediction accuracy. Therefore, in this study, 80% of the dataset is divided into the training set and the remaining 20% is used as the test set before model training is performed. The dataset was divided in such a way that the training and testing datasets were statistically similar i.e., both the dataset had approximately same mean value. The division process also ensured that the maximum and minimum pattern phase of the target dataset was included in the training dataset, thus exposing the model to the extreme phases of the dataset while training.
The MLP-NN model was constructed using two layers of hidden layers. A similar number of hidden layers was applied to the ENN model. The optimal number of hidden neurons in the hidden layers was determined using trial and error method. In this case, the best combination of hidden neurons in MLP-NN is 25 and 35 in the first and second hidden layers respectively, while for ENN, it reached the best combination when the number of hidden neurons was recorded at 40 for both the first and second hidden layers. The tansig activation function was selected as the transfer function for both MLP-NN and ENN models. Based on the developed ENN model, PSO is used applied for optimisation purpose. In terms of the parameters setting, the maximum number of iterations is set to 50, the number of individuals in the population is fixed at 100, the inertia weight ω is selected as 0.729, while c1 and c2 have a similar value, which is 1.49445.
In studies about water level prediction, it is always inevitable to consider the lag time between water level, rainfall and flow at each station. The concept of “time lag” can be understood as the response time of water level changes. In these studies, it is pointed out that due to the geographical distance between the upstream stations and Dongting Lake, the Three Gorges Reservoir has a long time lag. It is noted in these studies that due to the difference in distance between the upstream site and Dongting Lake, it takes some time for the water flow from the upstream site to reach Dongting Lake. In addition, the upstream site is in the upper reaches of the Yangtze River, while Dongting Lake is located in the middle reaches of the Yangtze River. The difference in river conditions between the upper and middle reaches of the Yangtze River is large, and the slowing down of water flow in the middle reaches, together with the storage effect of the lake, makes the process of water level change in Dongting Lake slower, thus creating a time lag. However, due to the complexity of the water flow process, it is difficult to determine the exact timing of this time lag. Therefore, seven different combinations of water level and flow lag methods were used for model training, and its results were used to determine the best combination of lag times.
According to the study on water level prediction in Dongting Lake by Lai et al. (2020), it is known that the lag is about 3 days for the Zhicheng station, 2 days for the Jinshi station, and about 1 day for the Sanshui station (Xiangtan, Taoyuan and Taoyuan stations). However, this is the data based on the daily average hourly study, which is not applicable to this study for hourly prediction. Therefore, on the basis of the standardized data set, the input under 7 programs of delay schemes were tested: 1) 72 h before Zhicheng Station, 48 h before Jinshi Station, Xiangtan, Taojiang, and Taoyuan (here in after referred to as “the other three”) 2) 72 h before Zhicheng Station, 36 h before Jinshi Station, and 24 h before the other three stations; 3) 72 h before Zhicheng Station, before Jinshi Station 36 and 12 h before the other three stations; 4) 60 h before Zhicheng Station, 36 h before Jinshi Station, and 24 h before the other three stations; 5) 60 h before Zhicheng Station, Jinshi The flow and rainfall of 24 h before the station and 12 h before the other three stations; 6) The flow and rainfall of 48 h before Zhicheng Station, 24 h before Jinshi Station, and 12 h before the other three stations; respectively, to predict the representative stations in different lake areas of Dongting Lake (Nanzui, Xiaohezui, Yuanjiang, Yingtian, Lujiao and Chenglingji Stations).
By comparing the simulation results under seven-time delay schemes with the ENN model, the influence of the incoming water transmission distance and rate is considered. The model training evaluation indicators are shown in Figure 5. In general, under program 5, the flow and rainfall of 60 h before Zhicheng Station, 24 h before Jinshi Station, and 12 h before the other three stations can be used as inputs to better predict the future water level changes of representative stations in different lake areas of Dongting Lake. Among them, the RMSE value of the water level prediction of each station in the training phase is 0.311–0.545 m, the NSE value is 0.871–0.934, and the R2 value is 0.871–0.922; the RMSE value of the water-level prediction of each station in the verification phase is 0.301–0.502 m, and the NSE value is 0.873–0.945, R2 values ranged from 0.841 to 0.924, reaching the optimal value in the seven schemes.
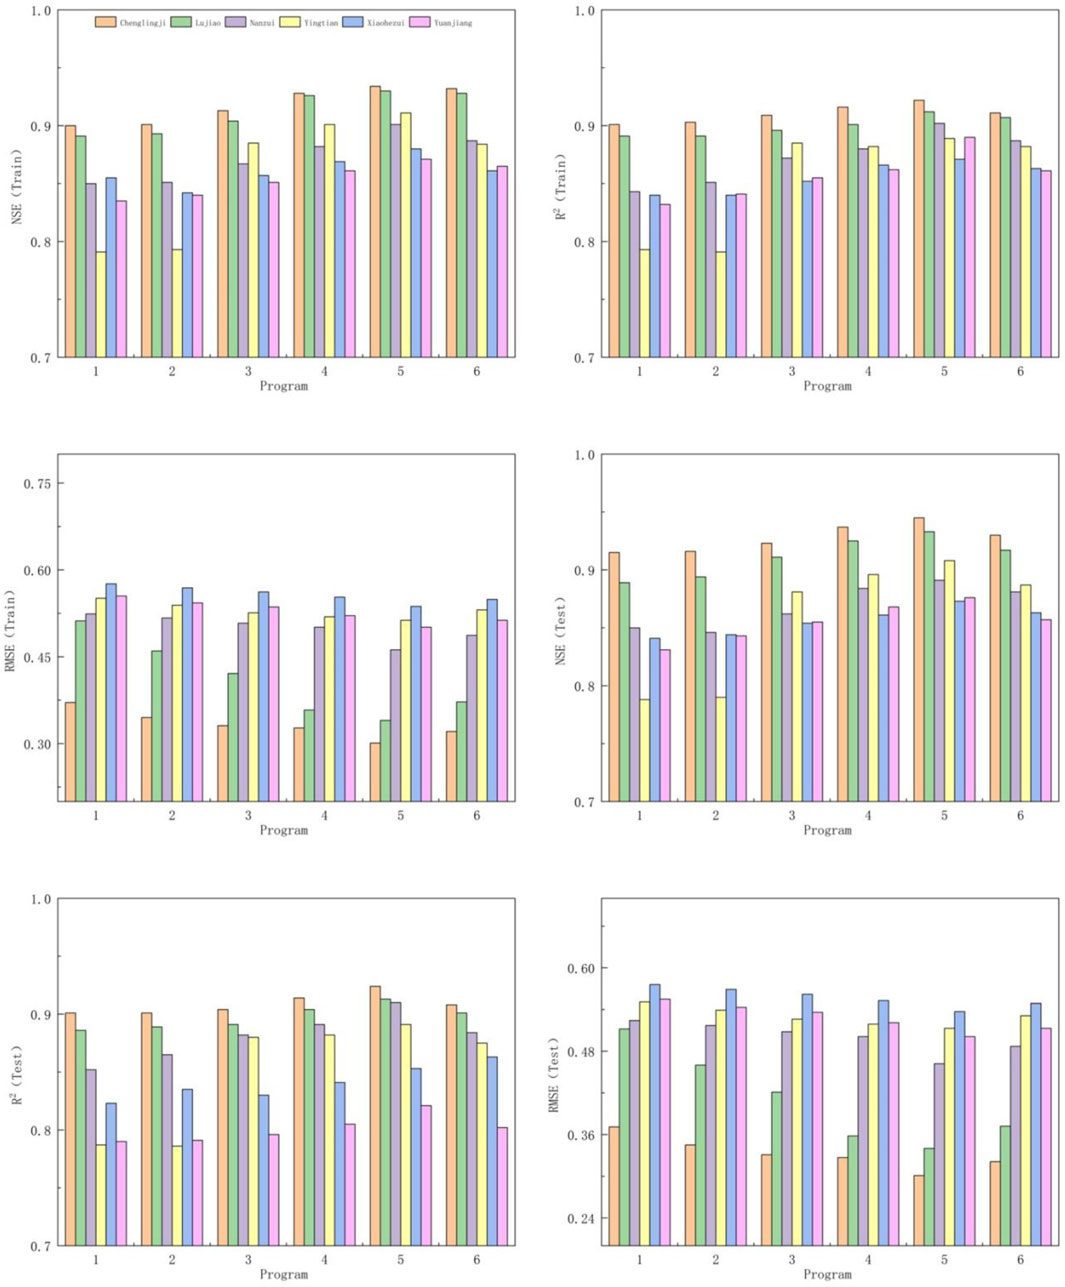
FIGURE 5. Simulation results of different input data processing schemes under the test set.
In this study, advanced water level prediction was also performed on the developed models. Advanced water level prediction models are usually required for flood warnings. Time series data were re-arranged to make output data 6, 12, 18, 24, 30, 36, 42 and 48 h ahead of input data. This leads the model to predict the output several hours ahead (in future) of the input. Thus, assisting us to predict the upcoming flood and generate the flood warning. The results of the advanced water level prediction are presented in the discussion section of this manuscript.
Results
Combined with the actual lag time of the flow and rainfall process in the middle and upper reaches of the previous section, as well as the response of the Dongting Lake water level change, as well as multiple simulation calculations, we believe that the use of the flow of 60 h before Zhicheng Station, 24 h before Jinshi Station, and 12 h before the other three stations, Rainfall is the most reasonable simulation of water levels in different lake areas of Dongting Lake.The aforementioned data were arranged accordingly and used together with the rainfall data of Nanzui, Xiaohezui, Yuanjiang, Yingtian, Lujiao and Chenglingji stations to train the MLP-NN, ENN and PSO-ENN models for the water level prediction at Nanzui and Xiaohezui stations (at West Dongting Lake), Yuanjiang and Yingtian stations (at South Dongting Lake), as well as Lujiao and Chenglingji stations (at East Dongting Lake). The NSE, R2 and RMSE were used as the statistical indicators to evaluate model performance as shown in Table 1. For the MLP-NN, in terms of training performance, the NSE ranges from 0.774 to 0.858, the R2 shows the value from 0.782 to 0.850, while the RMSE has a range from 0.777 to 0.995. For ENN, from the perspective of training performance, the NSE exhibits a value from 0.871 to 0.934, the R2 displays the values from 0.871 to 0.934, while the RMSE ranges from 0.322 to 0.545. The training performance of PSO-ENN has shown NSE of 0.920–0.981, R2 of 0.927–0.979 and RMSE of 0.134–0.369.
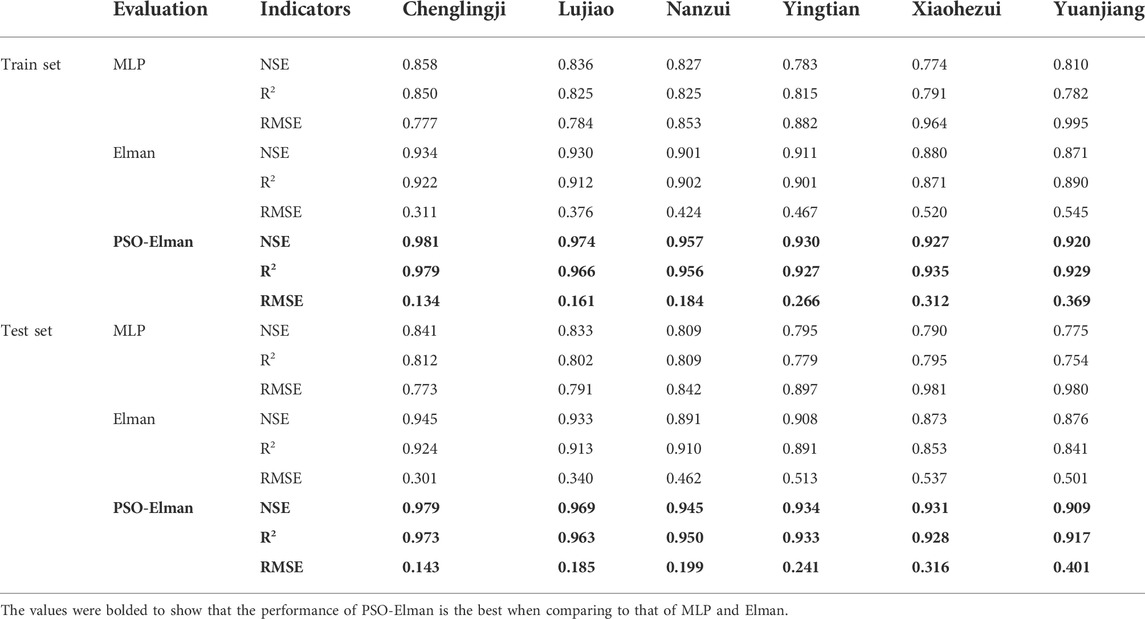
TABLE 1. Model performance evaluation using NSE, R2 and RMSE.
In summary, the PSO-ENN exhibits a better training performance in terms of NSE, R2 and RMSE if compared to MLP-NN and ENN. A similar trend can be observed in testing performance, where PSO-ENN is the best-performed model, followed by ENN and MLP-NN. Although the PSO-ENN model was developed and trained using hourly data from the upstream water stations and stations within the Dongting Lake, the model performance does not show a significant difference from the models developed using daily data, by Deng et al. (2021), Adnan et al. (2021), and Liang et al. (2018)
In order to compare the performance of PSO-ENN more visually, the predicted water level and the measured water level at the representative stations of the three major lakes of West, South and East Dongting Lake were plotted and fitted, as shown in Figure 6. The figure shows the fit between the predicted and measured values at each station. In general, the average absolute errors of PSO-ENN at each station are in the range of 1.356%–1.993%, and PSO-ENN can generally fit the sudden changes of water level well. The curves of water level changes are well fitted.
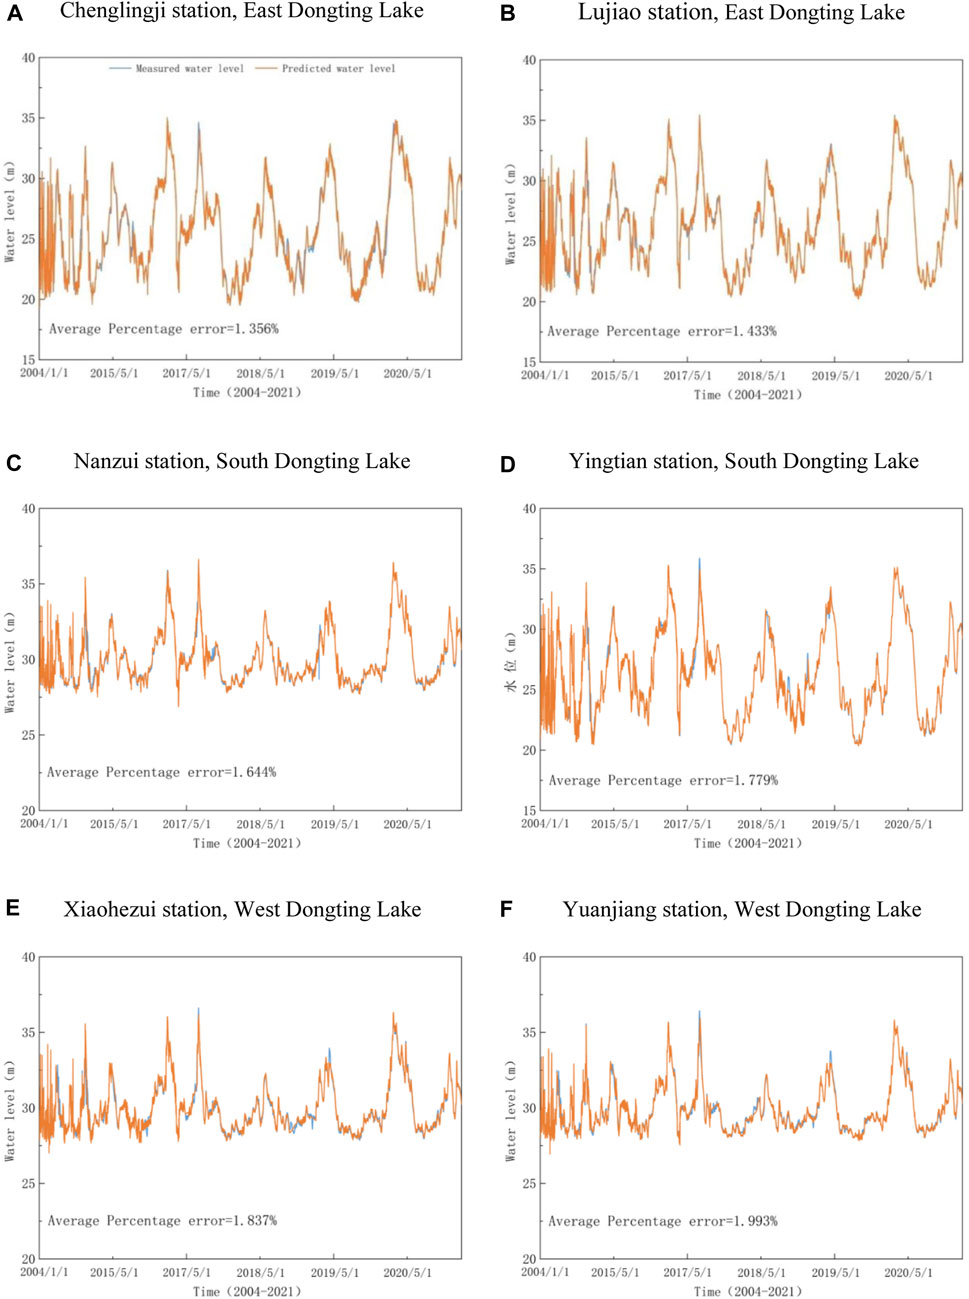
FIGURE 6. Plot for observed water level and predicted water level using PSO-ENN model. (A) Chenglingji station, East Dongting Lake. (B) Lujiao station, East Dongting Lake. (C) Nanzui station, South Dongting Lake. (D) Yingtian station, South Dongting Lake. (E) Xiaohezui station, West Dongting Lake. (F) Yuanjiang station, West Dongting Lake.
Discussion
Models developed for this study were tested for different input scenarios, such as real-time forecasting and advanced water level forecasting. Also, the sensitivity analysis was performed to determine the weight of each input in predicting water level. These analyses describe the strength of the model and also the inputs in accurately predicting water level.
Real-time water level forecast in Dongting Lake
To further investigate the real-time water level prediction performance of the developed PSO-ENN model, the latest datasets of all representative stations located in West, South and East Dongting Lake, ranging from 1st November 2021 to 9th January 2022, were applied to the model.
Table 2 shows that the RMSE is in the range of 0.152–0.360, the MAE shows a value between 0.157 and 0.372, while the average absolute error ranges from 0.644% to 0.899%. Overall, the presented errors while applying the PSO-ENN model for water level forecast purpose is relatively small. In the other words, the model is able to achieve a considerably high level of accuracy.
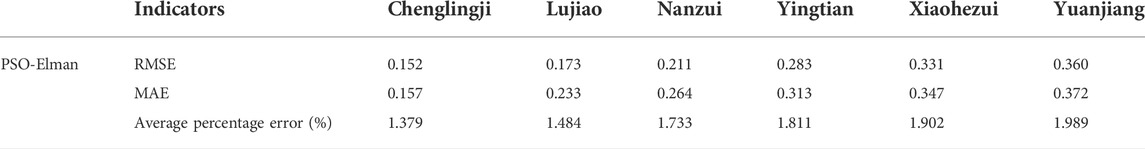
TABLE 2. Performance analyses of PSO-ENN on real-time water level forecast.
On the other hand, the comparison between the measured/observed and predicted water levels of each representative station is shown in Figure 7. It can be seen that the line representing the measured water level fits well with the line representing the predicted water level. The lines basically coincide with each other and the error fluctuation trend is small.
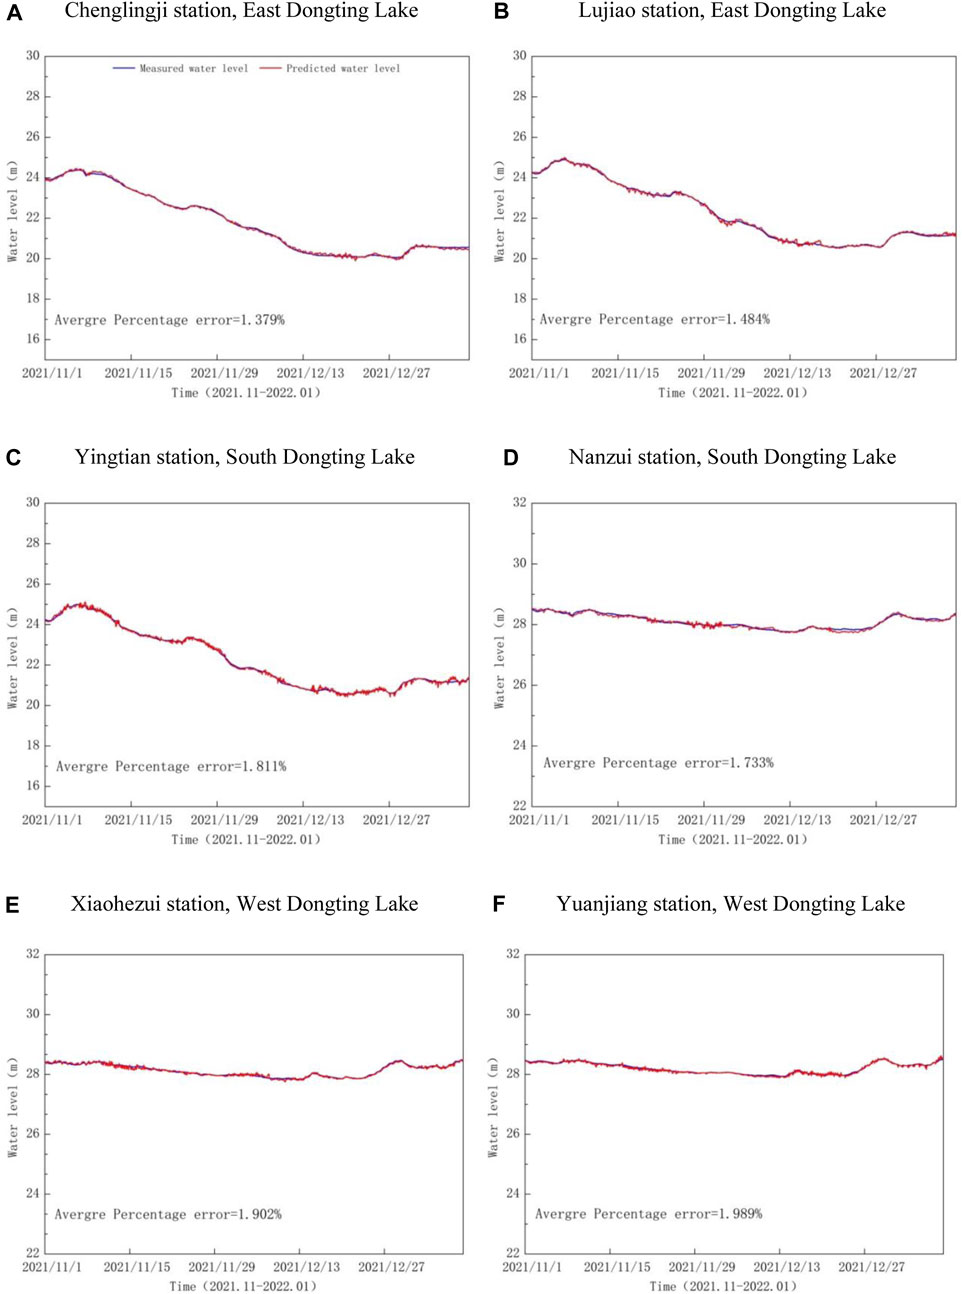
FIGURE 7. Real-time water level forecast in each representative stations in West, South and East Dongting Lake. (A) Chenglingji station, East Dongting Lake. (B) Lujiao station, East Dongting Lake. (C) Yingtian station, South Dongting Lake. (D) Nanzui station, South Dongting Lake. (E) Xiaohezui station, West Dongting Lake. (F) Yuanjiang station, West Dongting Lake.
Advanced water level forecast in Dongting Lake
To further ensure the applicability of the developed model in a real Dongting Lake environment, its forecasting performance under different time series was tested. Time series data of 6, 12, 18, 24, 30, 36, 42 and 48 h ahead were implemented into the PSO-ENN model and the water level prediction was performed. The data is rearranged (shifted the output n hours backward) so that the upstream flow (input) is paired with the n hours in advance downstream flow (output). In another words, the data is arranged in the way that the model will use the upstream data to predict the n hours advance flow at downstream. The results of statistical analyses in terms of NSE, RMSE and MAE are shown in Figure 8. The NSE of the representative stations in West, South and East Dongting Lake shows a value larger than 0.896 with a peak value of 0.988, RMSE ranges from 0.129 to 0.376, and MAE displays the minimum and maximum values of 0.151 and 0.385 respectively. The analyses indicate that the PSO-ENN has achieved a considerably good performance as it has a range of high NSE, low RMSE and small MAE.
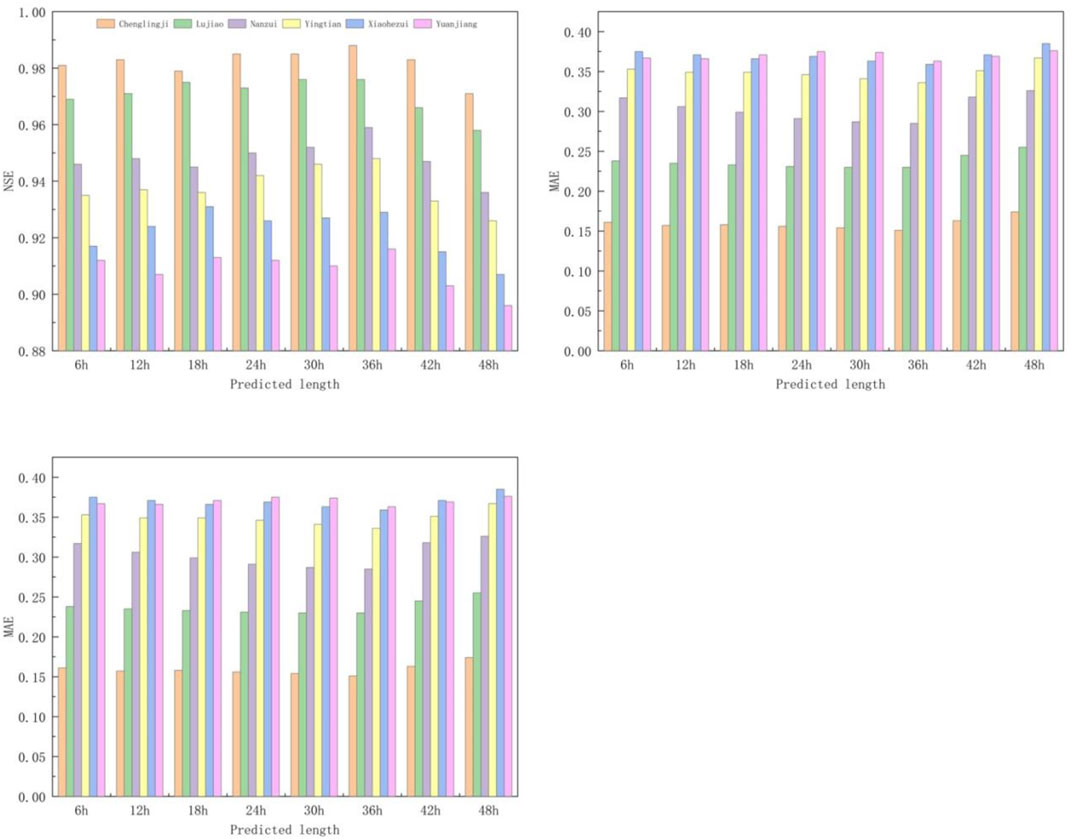
FIGURE 8. Performance of the selected PSO-ENN model under different time advances conditions (lag time).
In terms of the prediction length of the same station, when it increases from 6 to 36 h, the NSE increases gradually, while the RMSE and MAE show a different trend. However, as the prediction length is increased from 36 to 48 h, NSE starts to decrease, while RMSE and MAE show an increasing trend. Taking Chenglingji station as an example, the NSE is increased by 0.007, and the RMSE and MAE are decreased by 0.007 and 0.01 respectively when the predicted length increases from 6 to 36 h. On the other hand, the NSE is decreased by 0.017, while RMSE and MAE are increased by 0.015 and 0.023 respectively when the prediction length is increased from 36 to 48 h. In summary, the PSO-ENN provides the best accuracy when the prediction length is 36 h. Under such a condition, the NSE is ranged from 0.916 to 0.988 while the RMSE and MAE fall in between 0.129 and 0.361 as well as 0.151 and 0.363, respectively. Therefore, it can be concluded that the PSO-Elman model can provide a better water level prediction at all the representative stations in Dongting Lake for a duration up to 36 h in advance.
Analysis of Sensitivity
In this case, while developing the water level prediction models, flow rate, rainfall and temperature are the important influencing parameters. In order to measure the impact of each variable, a sensitivity analysis was performed. For this purpose, the PSO-ENN model was retrained by removing one of the variables each time. Taking NSE and RMSE as the main statistical indicators, after subtracting the newly obtained results from the original PSO-ENN model, the corresponding deviation values of each of the cases were obtained. If the newly obtained value differs significantly from the original value, it means that the model is more sensitive to that particular variable. The result for the sensitivity analysis is shown in Table 3. It can be seen that the PSO-ENN prediction model is more sensitive to flow rate, followed by rainfall, and less sensitive to temperature.
TABLE 3. Sensitivity analysis on the PSO-ENN model.
Conclusion and prospect
Dongting Lake is chosen as the study area of this study as it is the second-largest freshwater lake in China. Several techniques, namely multilayer perceptron neural network (MLP-NN), Elman neural network (ENN) and integration of particle swarm optimisation with ENN (PSO-ENN) were applied to develop the water level prediction models. The models were developed using the water level, flow rate, rainfall and temperature at the upstream stations, as well as the rainfall at the representative stations in Dongting Lake. The performance of the developed models was evaluated. It was found that the arrangement of data in terms of flowrate and rainfall with a lag duration of 60 h for Zhicheng station, a lag duration of 24 h for Jin City station, and a lag duration of 12 h for Xiangtan, Taojiang and Taoyuan stations, with the original time step arrangement of temperature, upstream water level, and downstream rainfall is the best data arrangement for the model development.
PSO-ENN model appears as the best-performed model as it has the highest NSE, lowest RMSE and smallest MAE ranges if compared to the MLP-NN and ENN models. Also, the PSO-ENN model has shown its ability to provide better accuracy for a duration of 36 h in advance, which in turn may provide reasonable guidance for flood control and drought resistance in the areas around Dongting Lake. Meanwhile, the sensitivity analysis shows that the PSO-ENN model is more sensitive to flow rate, followed by rainfall, while the temperature is the least responsive variable.
Combined with the vision of this study for future research, the following outlook is made for future research: 1. More refined research can be done on the water level of Dongting Lake according to the geographical location. In the future, more locations of hydrological stations can be considered for Dongting Lake to represent water level changes in the lake area. In addition, the GIS method can be used for the study of water level changes in the Dongting Lake area; 2. Further study the generalizability and portability of the methods and models proposed in this paper. The hybrid metaheuristic (PSO-ENN) model for water level prediction in this paper has good prediction performance, so it can be extended to other river waters for water level prediction.
Data availability statement
The original contributions presented in the study are included in the article/Supplementary Material, further inquiries can be directed to the corresponding authors.
Author contributions
BD, PL, and YX contributed to writing and paper preparation, CJ, SHL, and BD contributed to the conception of the study and supported the experiments of the study; BD, PL, and YL contributed to data collection, data analysis and processing Contributed; PK and RJC helped with analysis and had constructive discussions.
Funding
This work was supported by the National Natural Science Foundation of China (#51979015, #51839002), Partial support comes from the National Science Foundation of Hunan Province, China (#2018JJ3535), Key Laboratory of Dongting Lake Aquatic Eco-Environmental Control and Restoration of Hunan Province (#2020DT002), Science and Technology Innovation Program of Hunan Province, China (#2020RC3037, #20hnkj019), Changsha Municipal Natural Science Foundation (# kq2014103).
Acknowledgments
For this study, special thanks to the Department of Water Resources of Hunan Province and Yueyang Hydrology Bureau for providing the data, the Dongting Lake Key Laboratory of Hunan Province for providing the data collection channel.
Conflict of interest
The authors declare that the research was conducted in the absence of any commercial or financial relationships that could be construed as a potential conflict of interest.
Publisher’s note
All claims expressed in this article are solely those of the authors and do not necessarily represent those of their affiliated organizations, or those of the publisher, the editors and the reviewers. Any product that may be evaluated in this article, or claim that may be made by its manufacturer, is not guaranteed or endorsed by the publisher.
References
Adnan, R., Zounemat-Kermani, M., Kuriqi, A., and Kisi, O. (2021). Machine learning method in prediction streamflow considering periodicity component. Intelligent Data Analytics for Decision-Support Systems in Hazard Mitigation, Singapore: Springer.
Akter, T., and Desai, S. (2018). Developing a predictive model for nanoimprint lithography using artificial neural networks. Mater. Des. 160, 836–848. doi:10.1016/j.matdes.2018.10.005
Aziz, M., Mostafa, S. A., Foozy, C., Mohammed, M. A., and Abualkishik, A. Z. (2021). Integrating elman recurrent neural network with particle swarm optimization algorithms for an improved hybrid training of multidisciplinary datasets. Expert Syst. Appl. 183, 115441. doi:10.1016/j.eswa.2021.115441
Buyukyildiz, M., and Tezel, G. (2015). Utilization of PSO algorithm in estimation of water level change of Lake Beysehir. Theor. Appl. Climatol. 128, 181–191. doi:10.1007/s00704-015-1660-2
Chen, L., Li, H., Lei, M., and Du, Q. (2018). Dongting Lake water level forecast and its relationship with the three Gorges Dam based on a long short-term memory network. Water 10, 1389. doi:10.3390/w10101389
Chen, Z. X. (2000). The 1998 flood on the Yangtze, China. Nat. Hazards 22 (2), 165–184. doi:10.1023/A:1008119805106
Covachev, V., and Covacheva, Z. (2021). “Existence of periodic solutions for a modified Elman neural network1-4 September 2020, Sts. Constantine and Helena, Bulgaria,” in Seventh international conference on new trends in the applications of differential equations in sciences (NTADES 2020), Sts. Constantine and Helena, Bulgaria, September 1–4, 2020 .
Dai, L., Liu, H., Li, W., and Tang, Z. (2020). Trend and abrupt analysis of Dongting Lake water level and its driving forces using Mann-Kendall approach. IOP Conf. Ser. Earth Environ. Sci. 467, 012140. doi:10.1088/1755-1315/467/1/012140
Deng, B., Ren, J. C., Tang, Y., Jiang, C., and Lai, S. H. (2019). NewApproach to predict the motion characteristics of single bubbles in still water. Appl. Sci. 9, 3981. doi:10.3390/app9193981
Deng, B., Lai, S. H., Jiang, C., Kumar, P., El-Shafie, A., and Chin, R. J. (2021). Advanced water level prediction for a large-scale river-lake system using hybrid soft computing approach: A case study in Dongting Lake, China. Earth Sci. Inform. 14, 1987–2001. doi:10.1007/s12145-021-00665-8
Gan, M., Pan, S., Chen, Y., Cheng, C., and Zhu, X. (2021). Application of the machine learning LightGBM model to the prediction of the water levels of the lower columbia river. J. Mar. Sci. Eng. 9, 496. doi:10.3390/jmse9050496
Gayathri, K. D., Ganasri, B. P., and Dwarakish, G. S. (2015). A review on hydrological models. Aquat. Procedia 4, 1001–1007. doi:10.1016/j.aqpro.2015.02.126
Guangwei, H., Mao, E., Zhengmai, L., Zhaohui, T., and Chang, F. (2014). Analysis on the runoff characteristics in and out Dongting Lake in recent 60 years. Sci. Geogr. Sin. 34, 89–96. doi:10.11821/yj2013050006
Hayashi, M., and Kamp, G. (2021). “Water level changes in ponds and lakes: the hydrological processes,” in Plant disturbance ecology. Second Edition, Cambridge, Massachusetts: Academic Press, 321–351. doi:10.1016/B978-012088778-1/50012-1
Hoque, M. A., and Adhikary, S. K. (2020). “Prediction of groundwater level using artificial neural network and multivariate time series models,” in 5th international conference on civil engineering for sustainable development (ICCESD 2020), Khulna, Bangladesh, February 7–9, 2020.
Hu, Q., Feng, S., Guo, H., Chen, G., and Jiang, T. (2007). Interactions of the Yangtze river flow and hydrologic processes of the Poyang Lake, China. J. Hydrol. 347, 90–100. doi:10.1016/j.jhydrol.2007.09.005
Informatik, F. F., Bengio, Y., Frasconi, P., and Schmidhuber, J. (2003). Gradient flow in recurrent nets: the difficulty of learning long-term dependencies. Piscataway, New Jersey: Wiley-IEEE Press. doi:10.1109/9780470544037.ch14
Kxa, B., Hong, Y. A., Gh, B., Lla, B., and Zfa, B. (2019). Short-term power load forecasting based on Elman neural network with particle swarm optimization. Neurocomputing 416, 136–142. ScienceDirect. doi:10.1016/j.neucom.2019.02.063
Lai, X. J., and Wang, Z. M. (2017). Flood management of Dongting Lake after operation of three Gorges Dam. Water Sci. Eng. 10, 303–310. doi:10.1016/j.wse.2017.12.005
Li, F., Huang, J., Zeng, G., Yuan, X., Li, X., Liang, J., et al. (2013). Spatial risk assessment and sources identification of heavy metals in surface sediments from the Dongting Lake, Middle China. J. Geochem. Explor. 132, 75–83. doi:10.1016/j.gexplo.2013.05.007
Li, L., Zheng, Y., Yang, M., and Li, S. (2019). Groundwater level prediction for the arid oasis of northwest China based on the artificial bee colony algorithm and a back-propagation neural network with double hidden layers. Water 11, 860. doi:10.3390/w11040860
Liang, C., Li, H., Lei, M., and Du, Q. (2018). “Dongting Lake water level forecast and its relationship with the Three Gorges Dam based on a long short-term memory network, Water 10, 1389.
Liu, G., Zhang, D., and Zhang, T. (2015). Software reliability forecasting: singularspectrum analysis and ARIMA hybrid model in International symposium on theoretical aspects of software engineering.
Palmer, T. A., Montagna, P. A., Pollack, J. B., Kalke, R. D., and Deyoe, H. R. (2011). The role of freshwater inflow in lagoons, rivers, and bays. Hydrobiologia 667, 49–67. doi:10.1007/s10750-011-0637-0
Pan, M., Zhou, H., Cao, J., Liu, Y., and Chen, C. H. (2020). Water level prediction model based on GRU and CNN. IEEE Access 8, 60090–60100. doi:10.1109/ACCESS.2020.2982433
Peprah, M. S., and Larbi, E. K. (2021). Lake water level prediction model based on autocorrelation regressive integrated moving average and kalman filtering techniques – an empirical study on lake volta basin, Ghana. Int. J. Earth Sci. 3, 1–11.
Reid, D. F., and Beeton, A. M. (1992). Large lakes of the world: a global science opportunity. Geojournal 28, 67–72. doi:10.1007/BF00216408
Ren, J. C., Lai, S. H., Ibrahim, S., Wan, Z., and Elshafie, A. (2020). ANFIS-based model for predicting actual shear rate associated with wall slip phenomenon. Soft Comput. 24, 9639–9649. doi:10.1007/s00500-019-04475-5
Song, Q. M., Xiong, L. H., Xiao, Y., Chen, X., and Liu, L. M. (2011). Study on relationship between lake area and water level of Dongting Lake based on MODIS images. Water Sav. Irrig. 2011. 20–23.
Taheri, K., Hasanipanah, M., Golzar, S. B., and Majid, M. Z. A. (2016). A hybrid artificial bee colony algorithm-artificial neural network for forecasting the blast-produced ground vibration. Eng. Comput. 33, 689–700. doi:10.1007/s00366-016-0497-3
Tularam, A., Anand, G., and Reza, R. (2017). The critical importance of groundwater in coastal areas: impact of climate change on Bangladesh freshwater resources. J. Clim. Change 3, 59–70. doi:10.3233/JCC-170006
Win, W., Fan, Z., Tangdamrongsub, N., Hu, L., and Zhang, M. (2021). Comparison of physical and data-driven models to forecast groundwater level changes with the inclusion of GRACE – A case study over the state of victoria, Australia. J. Hydrology 602, 126735. doi:10.1016/j.jhydrol.2021.126735
Lai, X. J., and Yan, G. (2020). Research on water level prediction of Dongting Lake based on recurrent neural network. Resour. Environ. Yangtze Basin 13 (03), 689–698. doi:10.11870/cjlyzyyhj202103016
Zhang, J., Feng, L., Chen, L., Wang, D., Dai, M., Xu, W., et al. (2018). Water compensation and its implication of the three Gorges Reservoir for the river-lake system in the middle Yangtze River, China. Water 10, 1011. doi:10.3390/w10081011
Keywords: Dongting Lake, Elman neural network, metaheuristic model, particle swarm optim isation, water level prediction
Citation: Deng B, Liu P, Chin RJ, Kumar P, Jiang C, Xiang Y, Liu Y, Lai SH and Luo H (2022) Hybrid metaheuristic machine learning approach for water level prediction: A case study in Dongting Lake. Front. Earth Sci. 10:928052. doi: 10.3389/feart.2022.928052
Received: 25 April 2022; Accepted: 04 August 2022;
Published: 31 August 2022.
Edited by:
Shridhar Jawak, Svalbard Integrated Arctic Earth Observing System (SIOS), NorwayCopyright © 2022 Deng, Liu, Chin, Kumar, Jiang, Xiang, Liu, Lai and Luo. This is an open-access article distributed under the terms of the Creative Commons Attribution License (CC BY). The use, distribution or reproduction in other forums is permitted, provided the original author(s) and the copyright owner(s) are credited and that the original publication in this journal is cited, in accordance with accepted academic practice. No use, distribution or reproduction is permitted which does not comply with these terms.
*Correspondence: Hongmei Luo, eHh6eF9saG1AMTYzLmNvbQ==; Ren Jie Chin, Y2hpbnJqQHV0YXIuZWR1Lm15