 Felix Olabamiji Ajibola
 Botao Zhou
 Shamsuddin Shahid
 Md. Arfan Ali
- 1Collaborative Innovation Center on Forecast and Evaluation of Meteorological Disasters/Key Laboratory of Meteorological Disaster, Ministry of Education/Joint International Research Laboratory of Climate and Environment Change, Nanjing University of Information Science and Technology, Nanjing, China
- 2School of Atmospheric Sciences, Nanjing University of Information Science and Technology, Nanjing, China
- 3National Weather Forecasting Research and Climate Research Centre, Nigerian Meteorological Agency, Abuja, Nigeria
- 4Department of Water & Environmental Engineering, School of Civil Engineering, Faculty of Engineering, Universiti Teknologi Malaysia (UTM), Johor Bahru, Malaysia
- 5School of Marine Science, Nanjing University of Information Science and Technology, Nanjing, China
This study evaluated the performance of seven CMIP6 HighResMIP models in the simulations of drought over two sub-regions of West Africa: the Guinea coast and the Sahel during the historical period of 1985–2014, in terms of the potential evapotranspiration index (PET), climatic water availability (CWA), and standardized precipitation evapotranspiration index (SPEI) at three time scales (i.e., 1, 3, and 12 months). The Climate Research Unit (CRU) TS v4.03 datasets were used as the observation reference. The observation shows that the PET and CWA during August (i.e., the rainfall annual peak) were less than 30 and 200 mm/month over the Guinea coast, respectively. The corresponding values over the Sahel were 100 and -50 mm/month, respectively. A significant decreasing trend was observed in drought over the Guinea coast (except Nigeria) and the Sahel. The frequencies of extreme and severe droughts were observed over Nigeria, Liberia, and Sierra Leone during the historical period. The seven HighResMIP models show different behaviors in simulating all of the abovementioned observation features. Among all the simulations, the ENSEMBLE, ECMWF, and IPSL generally perform better in almost all the statistical indices used, although there are still biases that need to be resolved in the models.
1 Introduction
Drought, one of the devastating precipitation extremes, has attracted the attention of meteorologists, geologists, ecologists, and environmentalists. Droughts affect any zone, and the largest aspect that is mostly affected is agriculture. It is responsible for agriculture losses globally four times that of floods, and when it is compared to hydrological disasters, the consequences are higher (Dai et al., 2011; Ahmed et al., 2016; Ebi and Bowen 2016; Damania et al., 2017; Mohsenipour et al., 2018; Qutbudin et al., 2019).
Drought has affected a lot of regions in West Africa, starting from the 1970s onward. Kasei et al. (2010) assessed drought intensity, areal extent, and recurrence frequency, using the standardized precipitation index (SPI) over 52 meteorological stations in West Africa within 1961, 1970, 1983, 1992, and 2001. The assessment indicated that nearly 75% of West Africa was under extreme drought during the period. Sante et al. (2019) examined the characteristics of drought over Cote d’Ivoire using the Markov chains 1 and 2. They discovered that most of the remarkable droughts in terms of intensity and duration transpired during the 1970s. Hassanein et al. (2013) investigated the change of drought during 1961–2008 using the standardized precipitation evapotranspiration index (SPEI) at time scale 12, and a gradual increase in drought during the decades was concluded.
Due to sparse gauge data sets, several studies involving drought are limited to a small area in West Africa. To improve the understanding and knowledge of past and future changes in drought, global climate models (GCMs) under the supervision of the Couple Model Intercomparison Project (CMIP) have been widely used. For example, based on the CMIP5 simulations, Rodríguez-Fonseca et al. (2015) concluded that the Sahel experienced the most dramatic drought starting from 1970; Shiru et al. (2020) projected that increases in temperature will result in a decrease in SPEI, which indicates an increase in drought frequency over Nigeria. At present, the CMIP has evolved to the sixth phase (CMIP6), in which some improvements have been made in physics processes and model resolutions (Eyring et al., 2016). Some recent studies have started to use the CMIP6 simulations for the evaluation and projection of drought (e.g., Cook et al., 2020; Papalexiou et al., 2021; Wang et al., 2021; Yang et al., 2021). Wang et al. (2021) revealed that the CMIP6 has high simulation accuracy at mid-latitudes for drought analysis. However, Papalexiou et al. (2021) showed that no single model can perform better over a large region. Therefore, the challenge of coarse resolutions has discouraged some researchers from using GCMs. The establishment of the High-Resolution Model Intercomparison Project (HighResMIP) at 25–50 km is timely as the main aim is to increase the horizontal resolution of models (Haarsma et al., 2016). A question arises as to whether the HighResMIP models show a better performance in the simulation of drought over West Africa. Thus, this study is motivated to assess the performance of seven CMIP6 HighResMIP models in simulating drought over West Africa.
2 Material and Methods
2.1 Observation and CMIP6 Datasets
The study used monthly precipitation and maximum and minimum temperatures from the Climate Research Unit (CRU TS v4.03), which was produced at 0.5 km resolution (https://crudata.uea.ac.uk/cru/data/hrg/). For the model dataset, the monthly precipitation, maximum and minimum temperatures of the historical simulations for the period 1985–2014 from seven HighResMIP models (see Table 1) were used. These data were archived by the Earth System Grid Federation (ESGF) under the CMIP6 (https://esgf-node.ipsl.upmc.fr/search/cmip6). West Africa is located in the domain of latitude 0º-30ºN and longitude 20ºW-20ºE (see Figure 1). For the purpose of this study, we refer to it as two climatic zones: Guinea coast (south of 15ºN) and the Sahel (north of 15ºN).
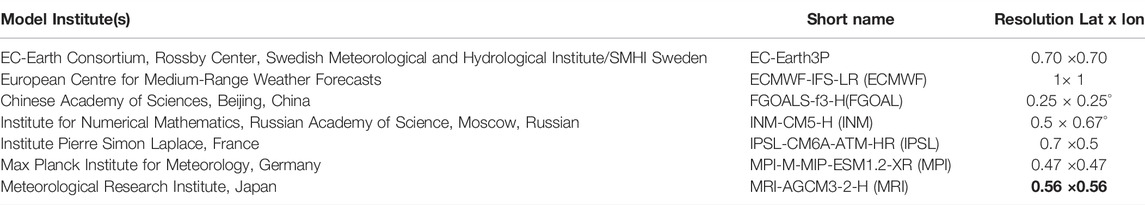
TABLE 1. Description of the CMIP6 HighResMIP models used.
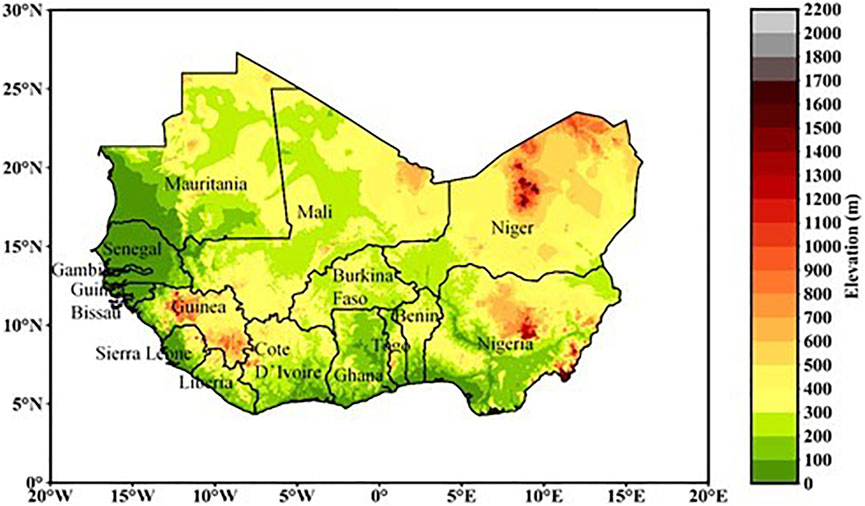
FIGURE 1. Map of the study area showing the elevation of the study domain. The division is between the Guinea Coast and Sahel. Gnitou et al., 2019.
2.2 Methods
2.2.1 Standardized Precipitation Evapotranspiration Index
The difference between precipitation (PRE) and potential evapotranspiration (PET) index, called climatic water availability (CWA), was used to calculate the SPEI (Vicente-Serrano et al., 2012). The SPEI is different from SPI because maximum and minimum temperatures are usually used to calculate PET, which is crucial in deriving the SPEI. There are several methods used in the calculation of PET, such as those by Hargreaves, Thornthwaite, and Penman-Monteith (Thornthwaite, 1948; Monteith, 1965; Hargreaves and Samani, 1985). Donohue et al. (2010) proposed that the Hargreaves method is better because it does not overestimate PET. In this study, the Hargreaves method was used to estimate PET.
The probability density function of a log-logistic distribution is given as
where
The SPEI is retrieved as the standardized values of
For
If
2.3.3 Trend Analysis
The Z statistics (Morid et al., 2006; Patel et al., 2007; Akhtari et al., 2009; Dogan et al., 2012) is usually used to detect trends in climate data. This was used for trend analysis in this study. The positive (negative) value of Z statistics indicates an increasing (decreasing) trend. The significance of trends in data series was determined by the Mann–Kendall test (Mann 1945; Kendall 1975; Wang et al., 2005). The Mann–Kendall test is a nonparametric test with non-homogenous time series, which makes it have low sensitivity to short break (Tabari et al., 2011). The data required need not be normally distributed before the test is carried out.
3 Results
3.1 Annual Cycle of PET and CWA
Figure 2 presents the annual cycle of PET and CWA over West Africa and the two sub-regions: Guinea Coast and Sahel. In general, the observed annual cycle of PET and CWA are reproduced by the HighResMIP individual models and the ENSEMBLE. Over the Guinea Coast (Figure 2B), the observed PET reached its highest value (greater than 50 mm/month) during the driest period (from November to March) and dropped to its lowest value (less than 40 mm/month) during the rainy period (from April to October). This pattern is adequately captured by the HighResMIP models, but with variations in the magnitude of the simulated amount. Most of the simulations underestimate the PET magnitude, except the FGOAL model, which exhibits slight overestimation. Over the Sahel (Figure 2C), the FGOAL and MPI models consistently overestimate the PET magnitude, while the MRI, ECMWF, and IPSL models show an underestimation. In comparison, the INM and ENSEMBLE perform better in reproducing the PET pattern. Due to low PET and high PRE during the rainy period over the Guinea coast, the CWA is high as the annual peak during August (200 mm/month) in the observation (Figure 2E). The CWA pattern is adequately reproduced by the HighResMIP simulations, although there are variations in the simulated values. Over the Sahel sub-region (Figure 2F), the observed CWA was negative throughout the year. The negative pattern of CWA is well-captured but with overestimation or underestimation by the HighResMIP models.
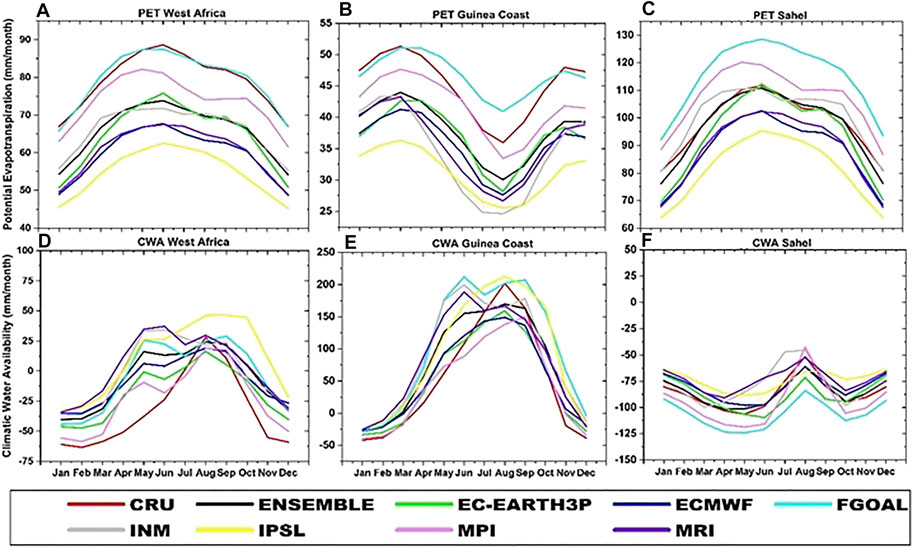
FIGURE 2. Annual cycle of potential evapotranspiration (PET) and climatic water availability (CWA) over West Africa, Guinea Coast, and the Sahel during the historical period 1985–2014 with respect to CRU. A–C and C–F represents PET and CWA respectively, over West Africa, Guinea Coast and Sahel.
3.2 Spatial Distribution of PET and CWA
Figure 3 shows the climatological distribution of PET over West Africa. The observation displayed a low PET over the coastal areas, which increased from the south to the north. Over the coastal areas and the Sahel, the PET was observed in the range of 0–100 mm/month and 100–150 mm/month, respectively. Such a PET pattern is adequately simulated by the HighResMIP models and the ENSEMBLE with a strong positive pattern correlation (r>0.75). However, the FGOAL model overestimates the magnitude over the northern region.
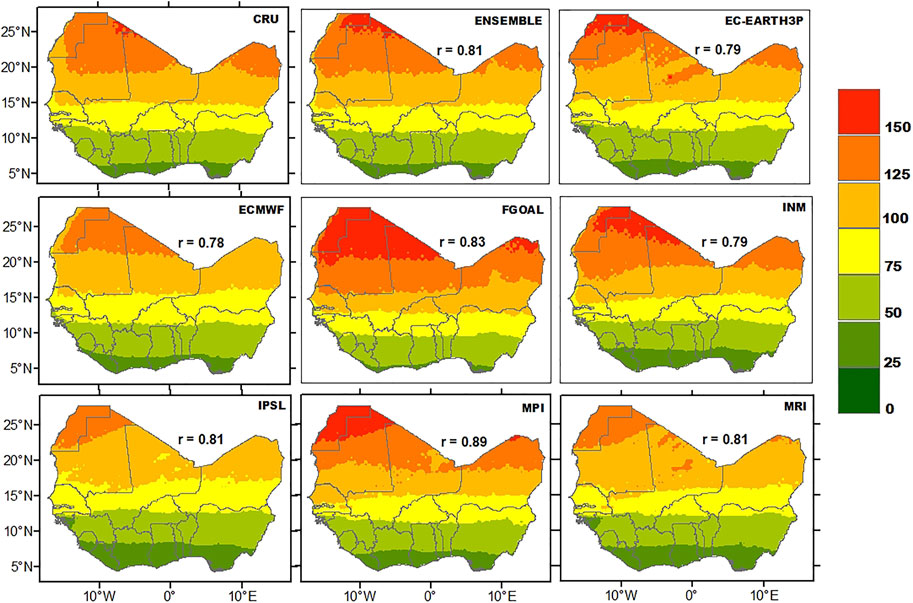
FIGURE 3. Observed and simulated climatological distribution of potential evapotranspiration (PET) over West Africa during 1985–2014. r is the Pearson pattern correlation between CRU and each HighResMIP simulation.
The observed CWA showed low climatic water over the Sahel, which ranges from 0 to -100 mm/month and the high value ranging from 50 to 250 mm/month over the coastal area of West Africa (Figure 4). This result agrees with the findings of previous studies (Nicholson et al., 2003; Afiesimama et al., 2006; Gbobaniyi et al., 2014; Akinsanola et al., 2017, 2018; Ajibola et al., 2020). The HighResMIP simulations perform well in reproducing the spatial pattern of CWA (r>0.80). However, the FGOAL and INM models overestimate the CWA magnitude over southern Nigeria, Liberia, and Sierra Leone, while the EC-EARTH3P and MPI models consistently underestimate the CWA over the high rainy region of the study area. In comparison, the ECMWF model and the ENSEMBLE perform adequately in reproducing the two climatic variables spatially.
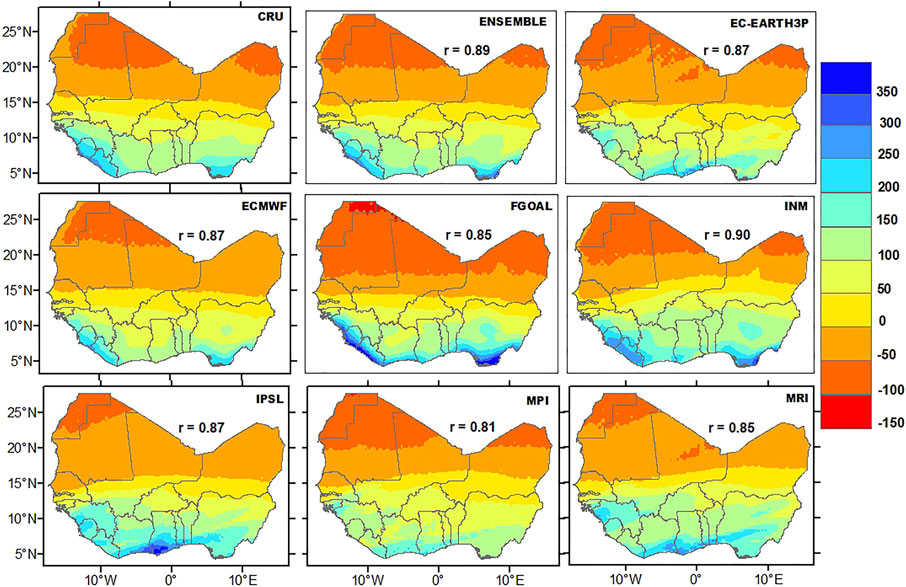
FIGURE 4. Observed and simulated climatological distribution of climatic water availability (CWA) over West Africa during 1985–2014. r indicates the Pearson pattern correlation between CRU and each HighResMIP simulation.
3.3 Spatial Distribution of the SPEI
Figures 5–7 present the climatological distribution of the SPEI during the historical period considered. The SPEI-1 represents the meteorological drought, the SPEI-3 depicts the agricultural drought, and the SPEI-12 shows a glimpse of hydrological drought. In the observation, positive SPEI-1 (Figure 5) and SPEI-3 (Figure 6) indicate wet conditions appearing over West Africa, except Nigeria, Sierra Leone, and Mali, where the SPEI-1 and SPEI-3 is around 0. This pattern is not well-reproduced by the HighResMIP models except the FGOAL, which reproduces the SPEI-1 pattern over Nigeria. As the SPEI timescale increased to 12 (Figure 7), negative SPEI-12 was observed over coastal cities in the southwest and Nigeria in the southeast, which signifies dry hydrological condition. The negative SPEI-12 over Nigeria can be reproduced by the ENSEMBLE, ECMWF, and MPI simulations. Overall, the Pearson pattern correlation between the observation and simulations is positive but low. It has to be noted that the SPEI in each grid could either be positive or negative, and its temporal average could result in low pattern correlation between the observation and simulations, as also suggested by Quenum et al. (2019).
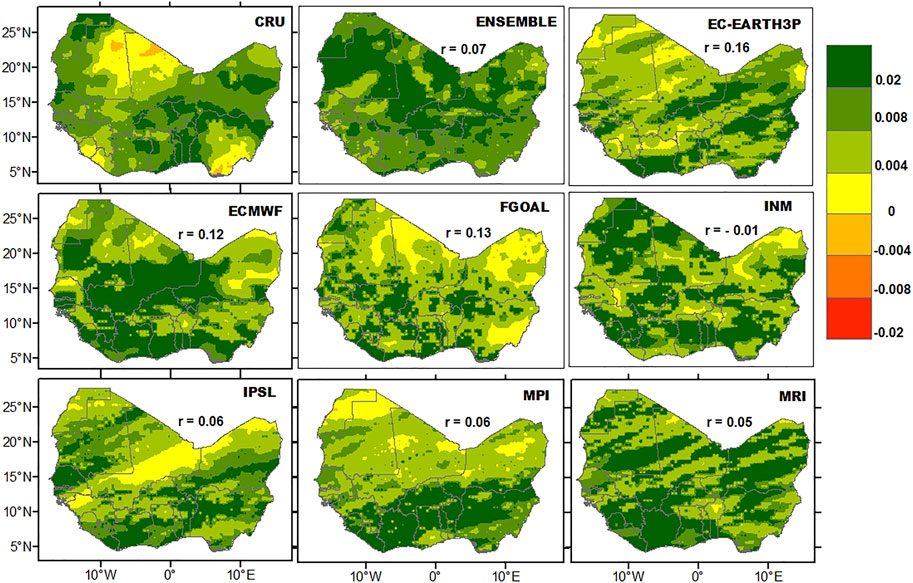
FIGURE 5. Observed and simulated climatological distribution of standardized evapotranspiration index 1 (SPEI-1) over West Africa during 1985–2014. r indicates the Pearson pattern correlation between the observation and each HighResMIP simulation.
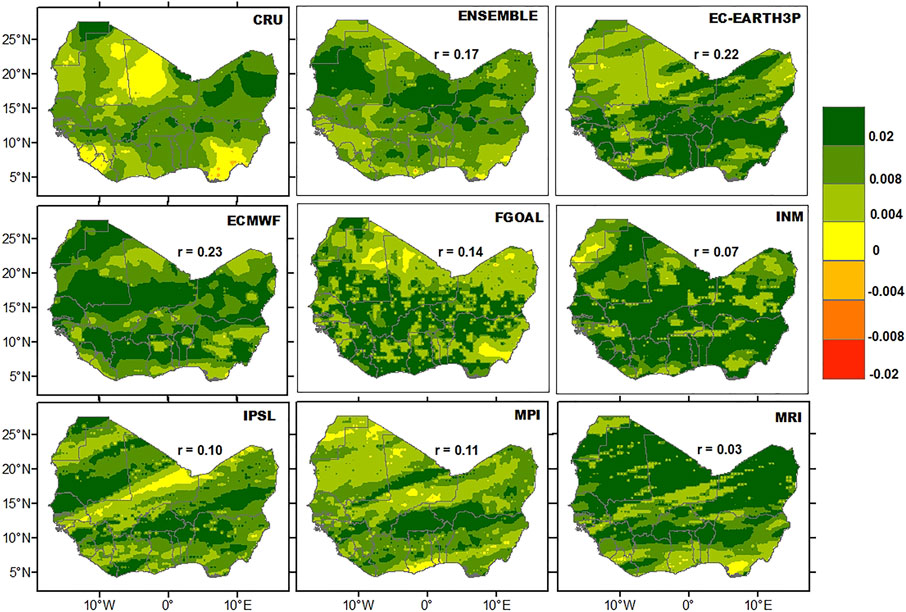
FIGURE 6. Same as Figure 5 but for SPEI-3.
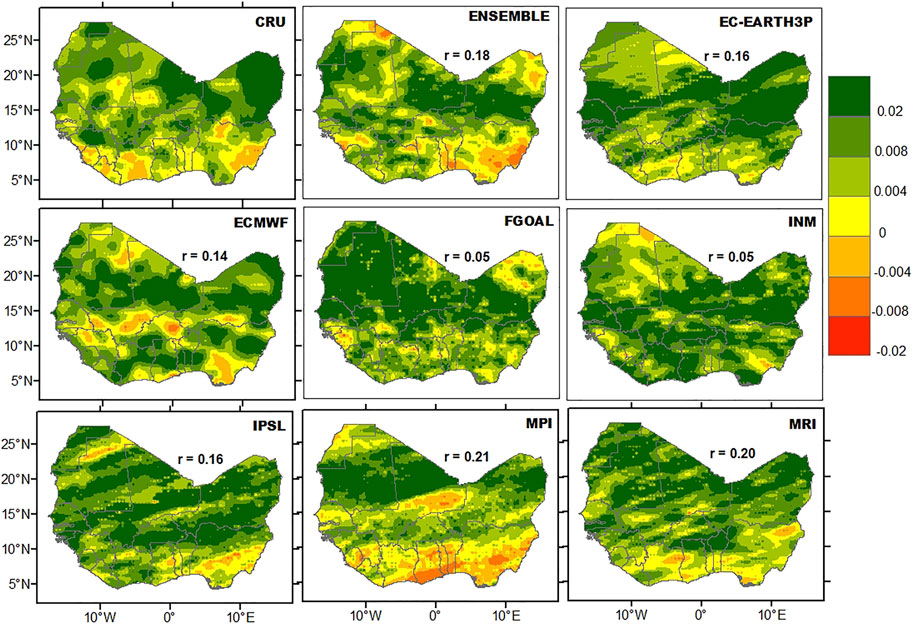
FIGURE 7. Same as Figure 5 but for SPEI-12.
3.4 Drought Trends
The spatial distribution of Z-statistics for the SPEI-1 is shown in Figure 8. The positive (negative) value represents a trend toward wetter (drier) condition. The observation indicated significant positive (increasing) trends over Mali, Guinea Bissau, Senegal, Ghana, Togo, and Benin. Insignificant negative (decreasing) trends were observed over few regions in the coastal area (Nigeria and Ghana). The ENSEMBLE, EC-EARTH3P, ECMWF, and FGOAL can reproduce the significant increasing trends of SPEI-1 over Ghana. The ECMWF model performs better than other simulations over the areas with significant positive changes observed and produces a strong pattern correlation (r = 0.41) with the observation.
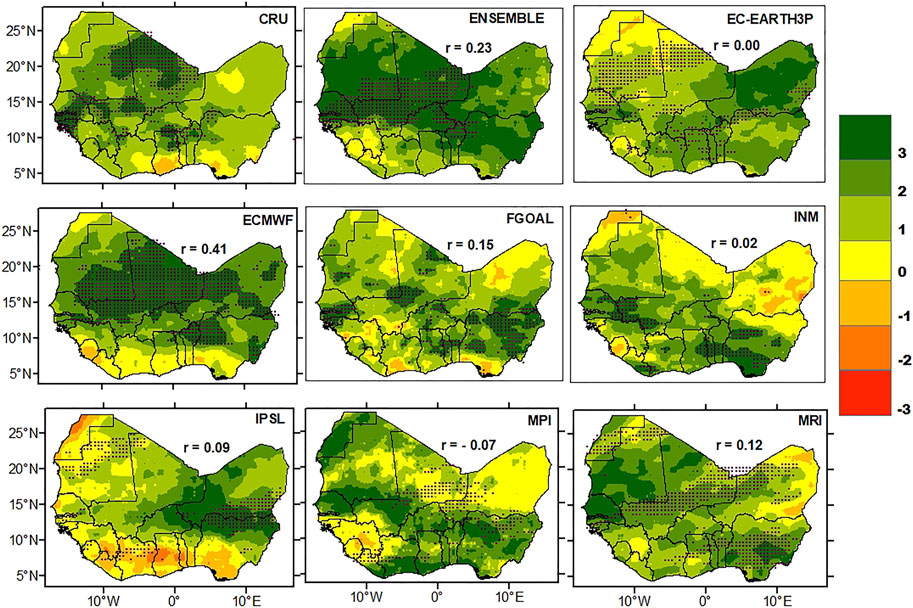
FIGURE 8. Observed and simulated distribution of Z-statistics for SPEI-1 over West Africa during 1985–2014. The positive and negative values indicate the grid with increasing and decreasing trends, respectively. The grids with significant trends at the 0.05 confidence level are hatched. r indicates the Pearson pattern correlation between CRU and each HighResMIP simulation.
The Z-statistics for the observed SPEI-3 showed that most of the region had negative (decreasing) trends, with 3.4% of the grids significant at the 0.05 level (Figure 9). Most of the simulations can reproduce the insignificant negative trends over most cities in West Africa, except the IPSL and MPI models, which simulated positive (increasing) trends. Most of the models reproduce a negative correlation with the observation except IPSL. This seemingly indicates the inability of HighResMIP models to reproduce agricultural drought trend pattern.
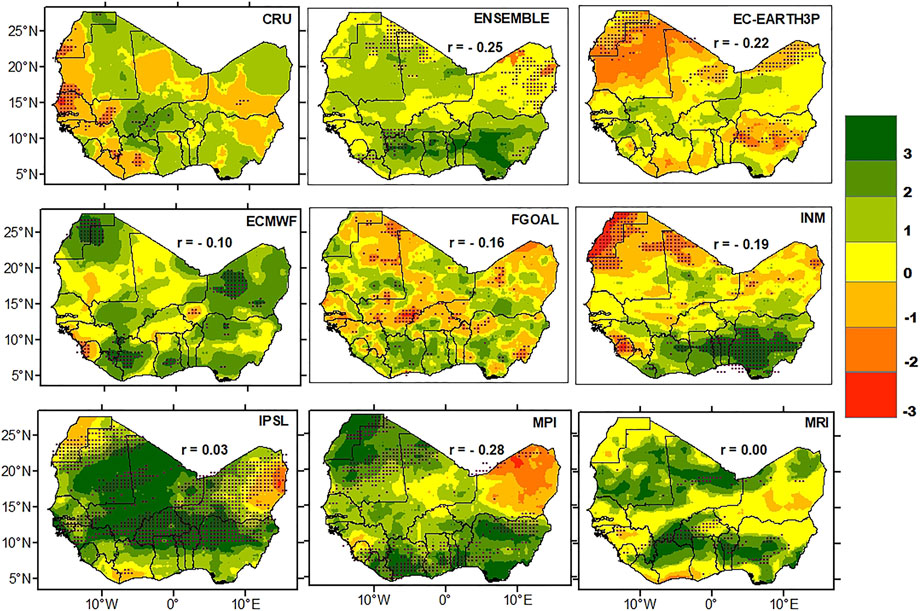
FIGURE 9. Same as Figure 8 but for SPEI-3.
The trends of SPEI-12 were observed to be more significant than the aforementioned SPEIs. Except Nigeria, Benin, Togo, southeast Ghana, and south Cote D’Ivoire, where significant negative (decreasing) trends were observed, most of the study region had positive (increasing) trends, with significant increasing trends over north Ghana, Burkina Faso, Cote D’Ivoire, Liberia, Sierra Leone, Guinea, Mali, and Nigeria (Figure 10). Most of the simulations have a role in simulating the widespread increasing trends. The EC-EARTH3P and ECMWF can also reproduce the decreasing trend over Nigeria. Most of the simulations show a phase opposition in simulating hydrological drought patterns, except EC-EARTH3P and ECMWF, which show a positive correlation with the observation.
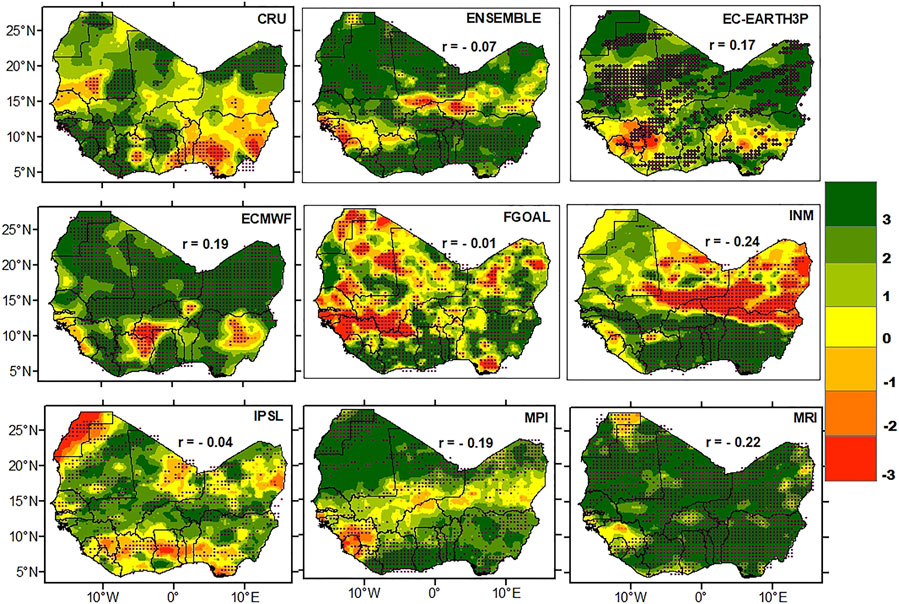
FIGURE 10. Same as Figure 8 but for SPEI-12.
3.5 Frequency of Drought Events
The HighResMIP performances to reproduce the frequency of severe meteorological, agricultural, and hydrological droughts (-1.99≤SPEI≤-1.5) are evaluated in Figures 11–13, respectively. The observation showed that as the scale of the SPEI increases, the spread of high frequency of severe drought events also increases. For the severe meteorological drought event (SPEI-1), the high frequency, varying from 8 to 12, is located over southern Nigeria, Cote D’Ivoire, Sierra Leone, Guinea, Liberia, Burkina Faso, and Mali. In the remaining regions, the frequencies mostly varied from 5 to 8 (Figure 11). Compared to the meteorological drought, there is a more widespread frequency of severe agricultural drought events (SPEI-3), with the highest frequency occurring over Nigeria, Sierra Leone, and Liberia (Figure 12). High frequencies of severe hydrological droughts (SPEI-12) are shown over Nigeria, Cote D’Ivoire, Sierra Leone, Liberia, Burkina Faso, and Mali (Figure 13).
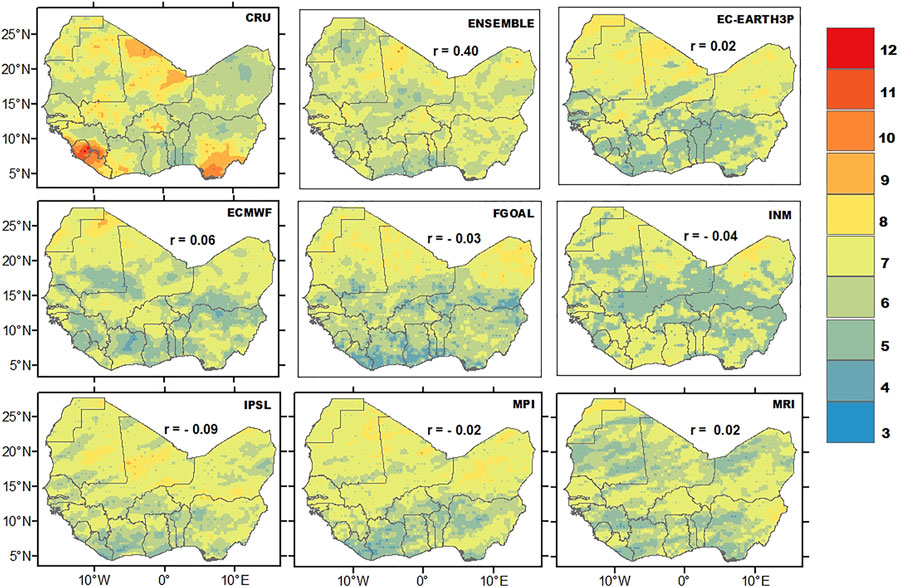
FIGURE 11. Observed and simulated distribution of frequencies of severe meteorological drought (SPEI-1) over West Africa during1985–2014. r indicates the Pearson pattern correlation between the CRU and each HighResMIP simulation.
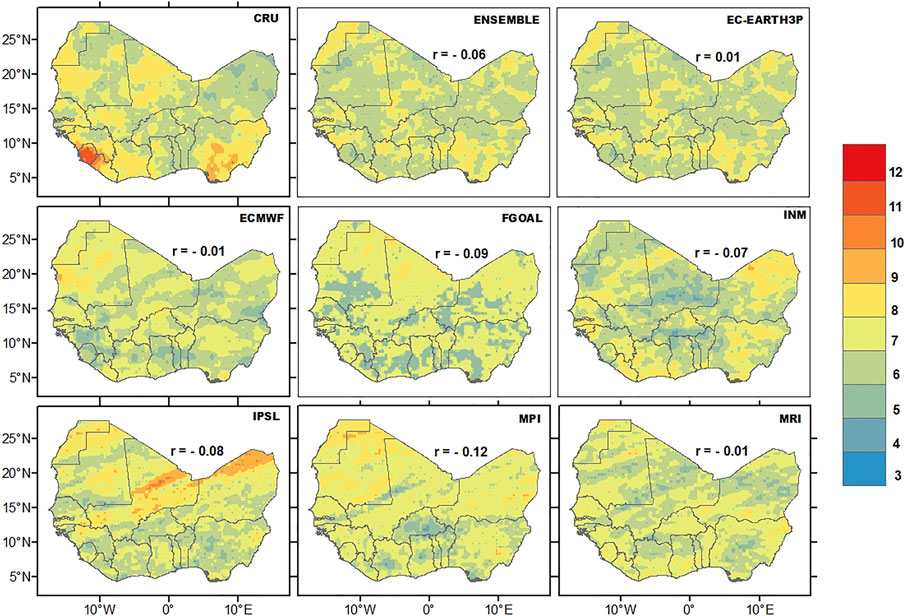
FIGURE 12. Same as Figure 11 but for the frequency of agricultural drought (SPEI-3).
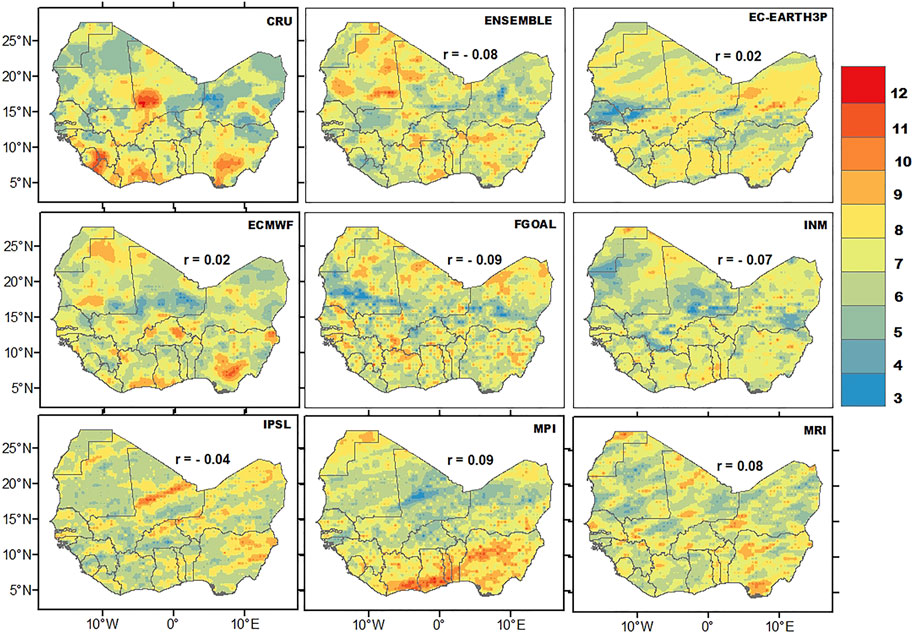
FIGURE 13. Same as Figure 11 but for the frequency of hydrological drought (SPEI-12).
All the simulations consistently underestimate the high frequency of severe meteorological drought. The ENSEMBLE captures the high frequency of severe agricultural drought over Nigeria, while the MRI model reproduces the high frequency over Liberia, Sierra Leone, Guinea, and Cote D’Ivoire, although underestimated. Most of the models can reproduce the high frequency of severe hydrological drought over Nigeria, with overestimation by the MPI, while the ECMWF performs slightly better with positive pattern correlation with observation. The high frequency over Cote D’Ivoire, Sierra Leone, Liberia, Burkina Faso, and Mali is underestimated by most of the models.
High frequencies of extreme dry events (SPEI≤-2.0) were observed over Nigeria, Sierra Leone, Liberia, and Mali for meteorological and agricultural droughts and over Nigeria, Mauritania, Senegal, and Mali for hydrological droughts. These were not adequately represented in the HighResMIP simulations and ENSEMBLE.
4 Summary and Conclusion
West Africa has limited capacity to respond to climate change, causing havoc to the economy of the region. Since climate change such as drought has great impacts on the livelihood in this region, the information of future climate change over the region is very important for adaptation and mitigation actions. The CMIP models are essential tools to project future climate change. Before the projection, the performance of the models needs to be assessed. In this study, we evaluated the performance of seven HighResMIP models in the simulation of drought over West Africa, using the metrics of PET, CWA, and SPEI. The results are summarized below:
1) The HighResMIP individual models and the ENSEMBLE can adequately reproduce the observed annual cycle of PET and CWA over the Guinea coast and Sahel. The spatial distribution of observed PET (CWA) which increased (decreased) from the south to the north can also be captured by the models. The observed PET (CWA) pattern is adequately reproduced by each model with a spatial pattern correlation of r>0.75 (r>0.8). The ENSEMBLE performs better, and the ECMWF model outperforms among the models considered.
2) The spatial distribution of the SPEI showed a slightly negative SPEI-1 and SPEI-3 over Nigeria, Sierra Leone, and Liberia. The negative SPEI, though not pronounced in SPEI-1 and SPEI-3 until in SPEI-12 over the southern cities, indicates increasing dry condition during the study period. GCMs and ENSEMBLE could not consistently reproduce the negative SPEI-1 and SPEI-3 over the region. However, EC-EARTH3P, ECMWF, and IPSL performed better in reproducing the negative SPEI-12 over Nigeria.
3) The trends in SPEI-1, SPEI-3, and SPEI-12 based on Z-statistics and MK p-value were used to determine the region with significant drought changes. The results showed a significant positive (increase) trend in SPEI-1 over Mali, Guinea-Bissau, Senegal, and Ghana; a negative (decreasing) insignificant trend in SPEI-3 in most cities over the study region; and a significant positive (increasing) trend in SPEI-12 over Sierra Leone, Liberia, north Ghana, Cote D’Ivoire, Guinea, Mali, and Nigeria with a consistent significant negative (decreasing) trend over Nigeria, Benin, Togo, southeast Ghana, and south Cote D’Ivoire. Most of the GCMs have a role in simulating the widespread increasing (decreasing) trends. ECMWF, IPSL, EC-EARTH3P, and ENSEMBLE performed better than the remaining simulations.
4) In cases of high frequency of extreme and severe droughts, most GCMs showed a moderate performance in simulating severe droughts over Nigeria, Liberia, and Sierra Leone. The extreme frequency of drought is not adequately represented in HighResMIP simulations. The inability of most GCMs to reproduce the frequency of drought appears to be the present scenario of systematic bias in the GCM (Abiodun et al., 2019).
It is worth noting that the Pearson correlation between the simulations and observation for climatological SPEI distribution, trends, and drought frequency over West Africa is low. This is possibly due to the temporal averaging of negative and positive values of the SPEI in each grid, which might allow misrepresentation of the observed pattern in the models. In general, this study showed that the improvement of model resolution is a crucial exercise. However, the performance of a model does not stop on improving the resolution alone. Individual simulations show a high capacity in reproducing West African drought features. Simulations from ECMWF and IPSL seem to outperform other models, with the ensemble mean showing a high skill than all other models. This study serves as motivation for further studies on drought using CMIP6 HighResMIP simulations, and it can be improved by analyzing the projection of drought over West Africa.
Data Availability Statement
The original contributions presented in the study are included in the article/Supplementary Material; further inquiries can be directed to the corresponding author.
Author Contributions
Conceptualization, FA and BZ; methodology, FA; software, SS and AA; validation, BZ and AA; formal analysis, FA; investigation, BZ and FA; resources, BZ; data curation, FA; writing—original draft preparation, FA; writing—review and editing, BZ and FA; visualization, AA and SS; supervision, BZ; funding acquisition, BZ.
Funding
This research was jointly supported by the National Key Research and Development Program of China (2017YFA0605004) and the Program for Distinguished Professor of Jiangsu.
Conflict of Interest
The authors declare that the research was conducted in the absence of any commercial or financial relationships that could be construed as a potential conflict of interest.
Publisher’s Note
All claims expressed in this article are solely those of the authors and do not necessarily represent those of their affiliated organizations, or those of the publisher, the editors, and the reviewers. Any product that may be evaluated in this article, or claim that may be made by its manufacturer, is not guaranteed or endorsed by the publisher.
Acknowledgments
We are grateful to the World Climate Research Program (WRCP) and the HighResMIP participating institution that make their simulation results accessible to the public. We are also grateful to the Climate Research Unit (CRU) for granting access to the reference dataset in accordance with their specific data use and the policy evolving citation. The first author acknowledges the Nanjing University of Information Science and Technology, China, World Meteorological Organization (WMO) and Nigerian Meteorological Agency for granting him the scholarship through which the completion of the present study is possible.
References
Abiodun, B. J., Makhanya, N., Petja, B., Abatan, A. A., and Oguntunde, P. G. (2019). Future Projection of Droughts over Major River Basins in Southern Africa at Specific Global Warming Levels. Theor. Appl. Climatol. 137, 1785–1799. doi:10.1007/s00704-018-2693-0
Abramowitz, M., and Stegun, I. A. (1964). Handbook Of Mathematical Functions: With Formulas, Graphs, and Mathematical Tables, 55. New York: Dover. ninth Dove.
Afiesimama, E. A., Pal, J. S., Abiodun, B. J., Gutowski, W. J., and Adedoyin, A. (2006). Simulation of West African Monsoon Using the RegCM3. Part I: Model Validation and Interannual Variability. Theor. Appl. Climatol. 86, 23–37. doi:10.1007/s00704-005-0202-8
Ahmed, K., Shahid, S., Harun, S. b., and Wang, X.-j. (2016). Characterization of Seasonal Droughts in Balochistan Province, Pakistan. Stoch. Environ. Res. Risk Assess. 30, 747–762. doi:10.1007/s00477-015-1117-2
Ajibola, F. O., Zhou, B., Tchalim Gnitou, G., and Onyejuruwa, A. (2020). Evaluation of the Performance of CMIP6 HighResMIP on West African Precipitation. Atmosphere 11, 1053. doi:10.3390/atmos11101053
Akhtari, R., Morid, S., Mahdian, M. H., and Smakhtin, V. (2009). Assessment of Areal Interpolation Methods for Spatial Analysis of SPI and EDI Drought Indices. Int. J. Climatol. 29, 135–145. doi:10.1002/joc.1691
Akinsanola, A. A., Ajayi, V. O., Adejare, A. T., Adeyeri, O. E., Gbode, I. E., Ogunjobi, K. O., et al. (2018). Evaluation of Rainfall Simulations over West Africa in Dynamically Downscaled CMIP5 Global Circulation Models. Theor. Appl. Climatol. 132, 437–450. doi:10.1007/s00704-017-2087-8
Akinsanola, A. A., Ogunjobi, K. O., Ajayi, V. O., Adefisan, E. A., Omotosho, J. A., and Sanogo, S. (2017). Comparison of Five Gridded Precipitation Products at Climatological Scales over West Africa. Meteorol. Atmos. Phys. 129, 669–689. doi:10.1007/s00703-016-0493-6
Cook, B., Mankin, J., Marvel, K., Williams, A., Smerdon, J., and Anchukaitis, K. (2020). Twenty-First Century Drought Projections in the CMIP6 Forcing Scenarios. Earth's Future 8, 6. doi:10.1029/2019EF001461
Dai, A. (2011). Drought under Global Warming: A Review. Wiley Interdiscip. Rev.Clim. Chang. 2, 45–65. doi:10.1002/wcc.81
Damania, R., Desbureaux, S., Hyland, M., Islam, A., Moore, S., Rodella, A. S., et al. (2017). Uncharted Waters: The New Economics of Water Scarcity and Variability. 1st ed. Washington, DC, USA: World Bank. doi:10.1596/978-1-4648-1179-1
Dogan, S., Berktay, A., and Singh, V. P. (2012). Comparison of Multi-Monthly Rainfall-Based Drought Severity Indices, with Application to Semi-arid Konya Closed Basin, Turkey. J. Hydrology 470-471, 255–268. doi:10.1016/j.jhydrol.2012.09.003
Donohue, R. J., McVicar, T. R., and Roderick, M. L. (2010). Assessing the Ability of Potential Evaporation Formulations to Capture the Dynamics in Evaporative Demand within a Changing Climate. J. Hydrology 386, 186–197. doi:10.1016/j.jhydrol.2010.03.020
Ebi, K. L., and Bowen, K. (2016). Extreme Events as Sources of Health Vulnerability: Drought as an Example. Weather Clim. Extrem. 11, 95–102. doi:10.1016/j.wace.2015.10.001
Eyring, V., Bony, S., Meehl, G. A., Senior, C. A., Stevens, B., Stouffer, R. J., et al. (2016). Overview of the Coupled Model Intercomparison Project Phase 6 (CMIP6) Experimental Design and Organization. Geosci. Model Dev. 9, 1937–1958. doi:10.5194/gmd-9-1937-2016
Gnitou, G. T., Ma, T., Tan, G., Ayugi, B., Nooni, I. K., Alabdulkarim, A., et al. (2019). Evaluation of the Rossby Centre Regional Climate Model Rainfall Simulations over West Africa using Large-Scale Spatial and Temporal Statistical Metrics. Atmosphere 10, 802.
Gbobaniyi, E., Sarr, A., Sylla, M. B., Diallo, I., Lennard, C., Dosio, A., et al. (2014). Climatology, Annual Cycle and Interannual Variability of Precipitation and Temperature in CORDEX Simulations over West Africa. Int. J. Climatol. 34, 2241–2257. doi:10.1002/joc.3834
George H. Hargreaves, G. L., and Zohrab A. Samani, Z. A. (1985). Reference Crop Evapotranspiration from Temperature. Appl. Eng. Agric. 1, 96–99. doi:10.13031/2013.26773
Haarsma, R. J., Roberts, M. J., Vidale, P. L., Senior, C. A., Bellucci, A., Bao, Q., et al. (2016). High Resolution Model Intercomparison Project (HighResMIP v1.0) for CMIP6. Geosci. Model Dev. 9, 4185–4208. doi:10.5194/gmd-9-4185-2016
Hassanein, M. K., Khalil, A. A., and Essa, Y. H. (2013). Assessment of Drought Impact in Africa Using Standard Precipitation Evapotranspiration Index. Nat. Sci. 11, 75–81.
Kasei, R., Diekkrüger, B., and Leemhuis, C. (2010). Drought Frequency in the Volta Basin of West Africa. Sustain Sci. 5, 89–97. doi:10.1007/s11625-009-0101-5
Kendall, M. G. (1975). Rank Correlation Methods. 4th Edn, Charles Griffin, London. doi:10.1007/978-1-4684-6683-6_9
Mann, H. B. (1945). Nonparametric Tests against Trend. Econometrica 13, 245–259. doi:10.2307/1907187
Mohsenipour, M., Shahid, S., Chung, E.-s., and Wang, X.-j. (2018). Changing Pattern of Droughts during Cropping Seasons of Bangladesh. Water Resour. manage. 32, 1555–1568. doi:10.1007/s11269-017-1890-4
Monteith, J. L. (1965).Evaporation and Environment, Symposia Soc. Exp. Biol., 19. Cambridge: Cambridge University Press, 205–234.
Morid, S., Smakhtin, V., and Moghaddasi, M. (2006). Comparison of Seven Meteorological Indices for Drought Monitoring in Iran. Int. J. Climatol. 26, 971–985. doi:10.1002/joc.1264
Nicholson, S. (2003). Comments on "The South Indian Convergence Zone and Interannual Rainfall Variability over Southern Africa" and the Question of ENSO's Influence on Southern Africa. J. Clim. 16, 555–562. doi:10.1175/1520-0442(2003)016<0555:cotsic>2.0.co;2
Papalexiou, S. M., Rajulapati, C., Andreadis, K., Foufoula-Georgiou, E., Clark, M., and Trenberth, K. (2021). Probabilistic Evaluation of Drought in CMIP6 Simulations. Earth's Future 9. e2021EF002150. doi:10.1029/2021EF002150
Patel, N. R., Chopra, P., and Dadhwal, V. K. (2007). Analyzing Spatial Patterns of Meteorological Drought Using Standardized Precipitation Index. Met. Apps 14, 329–336. doi:10.1002/met.33
Quenum, G. M. L. D., Klutse, N. A. B., Dieng, D., Laux, P., Arnault, J., Kodja, J. D., et al. (2019). Identification of Potential Drought Areas in West Africa under Climate Change and Variability. Earth Syst. Environ. 3, 429–444. doi:10.1007/s41748-019-00133-w
Qutbudin, I., Shiru, M. S., Sharafati, A., Ahmed, K., Al-Ansari, N., Yaseen, Z. M., et al. (2019). Seasonal Drought Pattern Changes Due to Climate Variability: Case Study in Afghanistan. Water 11, 1096. doi:10.3390/w11051096
Rodríguez-Fonseca, B., Mohino, E., Mechoso, C. R., Caminade, C., Biasutti, M., Gaetani, M., et al. (2015). Variability and Predictability of West African Droughts: A Review on the Role of Sea Surface Temperature Anomalies. J. Clim. 28, 4034–4060. doi:10.1175/JCLI-D-14-00130.1
Santé, N., N’Go, Y. A., Soro, G. E., Meledje, N. H., and Bi, B. T. A. (2019). Characterization of Meteorological Droughts Occurrences in Côte d'Ivoire: Case of the Sassandra Watershed. Climate 7, 60. doi:10.3390/cli7040060
Shiru, M. S., Shahid, S., Dewan, A., Chung, E.-S., Alias, N., Ahmed, K., et al. (2020). Projection of Meteorological Droughts in Nigeria during Growing Seasons under Climate Change Scenarios. Sci. Rep. 10, 10107. doi:10.1038/s41598-020-67146-8
Tabari, H., Marof, S., Aeini, A., Talaee, P. H., and Mohammadi, K. (2011). Trend Analysis of Reference Evapotranspiration in the Western Half of Iran. Agric. For. Meteorol 151, 128–136. doi:10.1016/j.agrformet.2010.09.009
Thornthwaite, C. W. (1948). An Approach toward a Rational Classification of Climate. Geogr. Rev. 38, 55–94. doi:10.2307/210739
Vicente-Serrano, S. M., Beguería, S., Lorenzo-Lacruz, J., Camarero, J. J., López-Moreno, J. I., Azorin-Molina, C., et al. (2012). Performance of Drought Indices for Ecological, Agricultural, and Hydrological Applications. Earth Interact. 16, 1–27. doi:10.1175/2012EI000434.1
Wang, W., Gelder, V., and Vrijling, J. K. (2005). “Trend and Stationarity Analysis for Streamflow Processes of Rivers in Western Europe in the 20th Century,” in Proceedings of the IWA International Conference on Water Economics, Statistics, and Finance, Rethymno, Greece, October 8–10, 2005.
Wang, T., Tu, X., Singh, V. P., Chen, X., and Lin, K. (2021). Global Data Assessment and Analysis of Drought Characteristics Based on CMIP6. J. Hydrol. 596, 126091. doi:10.1016/j.jhydrol.2021.126091
Keywords: highresmip, model evaluation, drought, West Africa, SPEI
Citation: Ajibola FO, Zhou B, Shahid S and Ali MA (2022) Performance of CMIP6 HighResMIP Simulations on West African Drought. Front. Earth Sci. 10:925358. doi: 10.3389/feart.2022.925358
Received: 21 April 2022; Accepted: 15 June 2022;
Published: 22 July 2022.
Edited by:
Dabang Jiang, Institute of Atmospheric Physics (CAS), ChinaReviewed by:
Cheng Sun, Beijing Normal University, ChinaGuo Donglin, Institute of Atmospheric Physics (CAS), China
Copyright © 2022 Ajibola, Zhou, Shahid and Ali. This is an open-access article distributed under the terms of the Creative Commons Attribution License (CC BY). The use, distribution or reproduction in other forums is permitted, provided the original author(s) and the copyright owner(s) are credited and that the original publication in this journal is cited, in accordance with accepted academic practice. No use, distribution or reproduction is permitted which does not comply with these terms.
*Correspondence: Botao Zhou, emhvdWJ0QG51aXN0LmVkdS5jbg==