 Jianjun Dong
 Ying Zhang1,2
94% of researchers rate our articles as excellent or good
Learn more about the work of our research integrity team to safeguard the quality of each article we publish.
Find out more
ORIGINAL RESEARCH article
Front. Earth Sci., 17 August 2022
Sec. Structural Geology and Tectonics
Volume 10 - 2022 | https://doi.org/10.3389/feart.2022.924124
This article is part of the Research TopicGeomechanics and Induced Seismicity for Underground Energy and Resources ExploitationView all 9 articles
The existence of heterogeneous rock mass in the goaf easily causes surface deformation, subsidence, and even collapse, which restricts the development of urbanization of the buildings above the goaf. Because of the saturation of the city and the shortage of power supply, the idea of building the Yingbin substation was proposed on the old coal mine goaf in Xinhua District, Pingdingshan City, Henan Province, China. To ensure the safety and stability of the foundation of the proposed substation, the comprehensive detection method was proposed, which is mainly based on transient electromagnetic detection and supplemented via drilling detection. It was used to determine the spatial position and location of heterogeneous rock mass in the goaf underlying the proposed substation. The results show that 1) after eliminating the interference to the transient electromagnetic detection, it is found that there are low-resistance anomalies near the depth of −160 m at points 1 to 2 and point 8 of the X2 line and at points 1 to 3 of the Y3 line, which are preliminarily presumed to be the influence of the heterogeneous rock mass. 2) The apparent resistivity anomalous areas of −160 and −200 m depth are highly consistent, and the location and scope of the heterogeneous rock mass were basically determined. 3) The abnormal depth range of core rate obtained by drilling is in good agreement with the abnormal range of apparent resistivity at the same location obtained by transient electromagnetic, which indicates the reliability of the detection results. 4) Combining the detection results of the two methods, the location and scope of the heterogeneous rock mass were basically determined, which is located in the western part of the proposed area. The detection results can provide a basis for the safety and stability of the proposed substation foundation. To ensure the safe and stable operation of the proposed substation foundation, effective governance measures for the heterogeneous rock mass of the goaf should be taken.
The old goaf has been compacted for a long time, there is still heterogeneous rock mass in some areas. Under construction and other external environments, ground subsidence, cracks (Xie et al., 2022), and even collapse (Dong L. J. et al., 2021) can occur, causing severe damage to the buildings above it. The characteristics of the heterogeneous rock mass in the old mine goaf have become a difficult problem restricting the urbanization above it. The extreme saturation of the city and the shortage of power resource supply also make the construction of substations imminent. To solve this problem, it was proposed for the first time to build the Yingbin substation in the old coal mine goaf of Xinhua District, Pingdingshan City, Henan Province, China. However, the detection of anomalous regions with complex structures is very challenging (Dong et al., 2020). Thus, the key is to ensure the safety and stability of the foundation of the proposed substation to clarify the spatial location and distribution range of the heterogeneous rock mass in the goaf underlying the proposed substation.
The drilling method is widely used in geological exploration because of the advantages of intuitive detection results, accurate depth positioning, and small site restrictions (Ji and Ma, 2009). Xiong et al. (2010) comprehensively used drilling and residual settlement to detect the iron tower site in the goaf and analyzed the feasibility of iron tower construction. Hu et al. (2019) conducted drilling detection in the Pingshuo mining area according to the layout principle of “multiple use of one hole, and combination of sparse and dense” and revealed the coal quality in the mining and stripping area, which provided geological data for the mining and stripping planning of the mine. Li and Tian, (2013) used drilling technology and electrical conductivity imaging system to detect and analyze the structure and stability of the goaf and verified the reliability of the drilling method to detect the goaf through actual engineering cases. Ye et al. (2012) used the method of combining drilling and laser detector to obtain fine spatial data of goaf. Although drilling detection is widely used in geological exploration, it has disadvantages such as high cost and low efficiency, and because this technology is to use points to analyze the foundation structure, it cannot form coherent image data (Lin and Qiu, 2021). In addition, extensive drilling will cause damage to the detection object, so it is not suitable for large-scale applications.
During the last 50 years, geological detection has developed rapidly (Dong L. et al., 2021). The transient electromagnetic method plays an important role in geological detection because of its high sensitivity (Cheng et al., 2021), low investment, and accurate exploration. Chen et al. (2019) used the finite element method to simulate the transient electromagnetic response law of surrounding rock mass and abnormal body under different electrical properties and geometric parameters, which improved the interpretation effect of transient electromagnetic method detection. Relying on a goaf in the Ordos mining area, Mou (2018) confirmed that the transient electromagnetic method can effectively detect the shallow buried deep goaf through interference tests, parameter optimization tests, and analysis of typical goaf response characteristics. Xu (2019) combined the known data in the minefield with transient electromagnetic detection to find out the scope of the goaf and the water accumulation area, which proved the feasibility of the method. Si et al. (2020) used the least squares method to constrain the inversion of the transient electromagnetic method, which improved the speed and effectiveness of data interpretation and made the inversion of geological information more accurate. Lu et al. (2021) used the multiground source transient electromagnetic method to detect and analyze a goaf in Gansu Province, China, and the results show that this method can effectively increase the detection depth and improve the ability to distinguish geological anomalies.
The focus of the above-mentioned transient electromagnetic method research is mainly on the accuracy verification and accuracy improvement of the goaf detection, and there are very few foundation investigation studies for buildings on goaf. In view of the respective characteristics of the two detection methods, the goaf underlying the substation was comprehensively detected using the transient electromagnetic method as main and the drilling method as auxiliary based on the principle of complementary advantages, and the spatial location and distribution range of the heterogeneous rock mass in the goaf underlying the proposed substation was finally determined.
The substation is intended to be built on the old coal mine goaf in Xinhua District, Pingdingshan City, Henan Province, China, with poor geological properties and a complex environment. It is located in the Cenozoic overlying area, and the strata in the area are Quaternary, Permian, Carboniferous, and Cambrian from new to old. The lithology and apparent resistivity of each layer are summarized in Table 1.
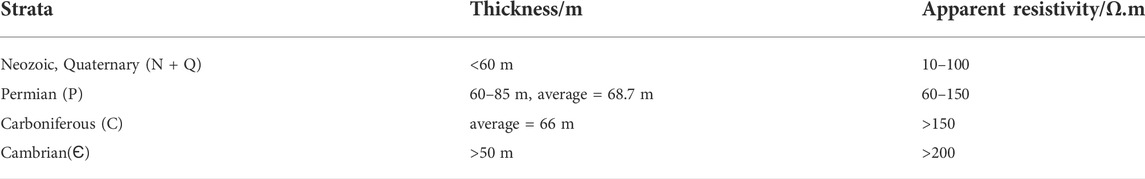
TABLE 1. Stratigraphic electrical properties in the underlying goaf of the substation.
The proposed area is located at the southeastern edge of the mining area of the No. 7 mine of Pingmei Group, which is within the coal mining subsidence area. The surface elevation of this area is approximately +85 m. The mining engineering of the nearby coal seam is shown in Figure 1. The mining depth is 160 m, and the mining time was from 1987 to 1993. The longwall working face is shot mining, general mining, or fully mechanized mining, and the roof is managed using the full subsidence method. Since underground coal mining caused large-scale ground subsidence in the western section of Jianshe Road and Yingcheng Cultural Square from 1992 to 1993, the ground subsidence pits and ground fissures were extremely developed, which had a significant impact on the local surface morphology. At present, the goaf is in the residual state subsidence deformation period. It can be seen from Figure 1 that the lower left part of the proposed area is located in the old coal mine goaf. To clarify the spatial location and distribution range of the heterogeneous rock mass in the goaf underlying the proposed substation, the lower left part of the figure was selected as the detection area.
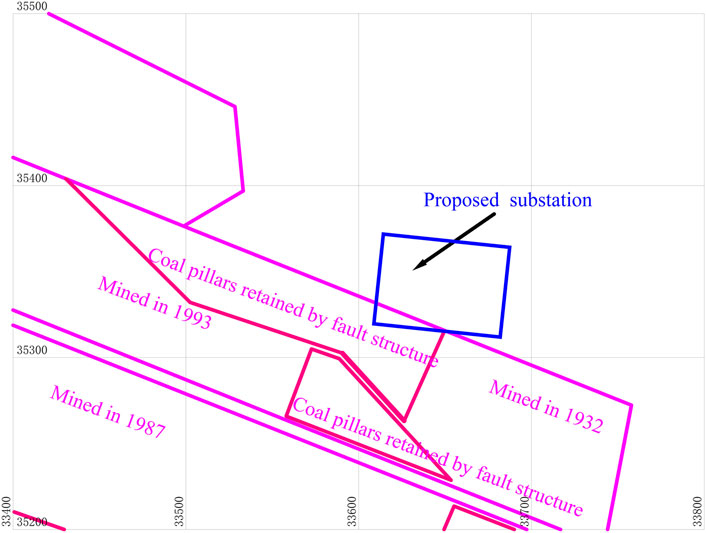
FIGURE 1. The distribution of coal mining projects underlying and near the site.
After clarifying the primary geological conditions and mining conditions of the goaf underlying the proposed substation, the comprehensive detection of goaf with ground transient electromagnetic method as the main detection and drilling as the auxiliary detection was conducted to detect the spatial location and distribution range of the heterogeneous rock mass in the goaf underlying the proposed substation.
The transient electromagnetic method is an artificial source electromagnetic detection method based on the principle of electromagnetic induction (Zhang et al., 2022). The transient electromagnetic method measurement device consists of two parts: the transmitting loop and the receiving loop. The working process of the transient electromagnetic method can be divided into three parts: emission, electromagnetic induction, and reception. When the stable current in the transmitting loop is suddenly cut off, according to the theory of electromagnetic induction, the sudden change of the current in the transmitting loop will inevitably generate a magnetic field around it, which is called the primary magnetic field. During the propagation of the primary magnetic field around, if it encounters a well-conducted underground geological body, induced current, also known as secondary current, will be excited inside the geological body. Since the secondary current changes with time, a new magnetic field is generated around it, which is called the secondary magnetic field. The secondary magnetic field is observed through the receiver coil. Its working principle is shown in Figure 2.
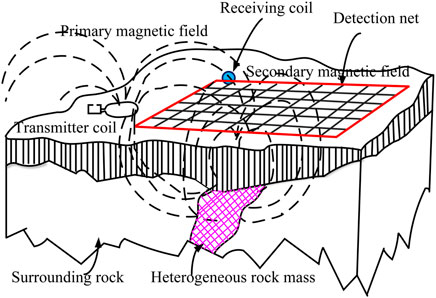
FIGURE 2. The working principle of transient electromagnetic method.
Because the measured value of the transient electromagnetic method in the field is not the true resistivity but the time-varying value of the induced electromotive force (generated by the secondary magnetic field in the receiving coil caused by the eddy current), the change value cannot directly reflect the structure of the geoelectric section. This is not conducive to the inference and interpretation of the underground geological body. Therefore, it is necessary to implement resistivity and time and depth conversion processes and convert the measured induced electromotive force into the apparent resistivity value of the formation that changes with depth before it can be used for geological inference and interpretation.
Under the assumption of a one-dimensional geoelectrical section in a uniform half-space, the calculation formula for the depth and the apparent resistivity can be obtained by theoretical derivation as follows (Hai et al., 2018):
where ρt is the apparent resistivity, Ω; μ0 is the permeability of the formation medium, H/m; t is the recording time, s; St is the area of the transmitting coil, m2; Sr is the area of the receiving coil, m2; V(t) is the induced electromotive force of a window at a specific time, V; I is the power supply current of the transmitting coil, A; ht is the depth, m; σt is the longitudinal conductance, S; and V(t)/I is the normalized induced electromotive force, V.
Although the apparent resistivity is not the actual formation resistivity, its spatial variation characteristics are consistent with the real site cross-sections, which can objectively show the spatial distribution characteristics of underground geological bodies.
The choice of transient electromagnetic working parameters and working devices will directly affect the quality and results of field data collection and affect the processing and interpretation of data. There are various working devices for transient electromagnetic exploration. According to the analysis of the ground features and geological conditions in the detection area, as well as the analysis of the buried data of the target layer, the 1.5 m × 1.5 m small wire frame overlapping loop working device was selected.
To ensure reasonable construction parameters, the tests of the transmission frequency and the number of superimpositions were mainly conducted to meet the required exploration depth and accuracy. Combined with the geological characteristics of the detection area and previous detection experience, the emission frequency is 6.25 Hz, the emission wire frame is 1.5 m × 1.5 m, and the stacking times were selected from 256 to 1,024 times, and a total of two test points have been completed. In addition, the collected data are less affected by interference factors, so it is inferred that this set of parameters is suitable for this detection area. After the test, the number of stacking in this detection area is not less than 512 times to ensure effective suppression of random interference.
After several field tests on the goaf underlying the proposed substation, it was found that the transmission frequency that meets the detection requirements is 6.25 Hz, the transmission wireframe is 1.5 m × 1.5 m, and the superposition is more than 512 times. Seven survey lines were set up according to the above construction parameters. The distance between each line of detection differed according to the ground object conditions. The distance between each point on the detection line was 10 m; There are 60 physical points (including two test points) and three quality check points on the line. A total of 63 transient electromagnetic physical points were obtained. The total length of the section was 620 m, and the specific layout is shown in Figure 3.
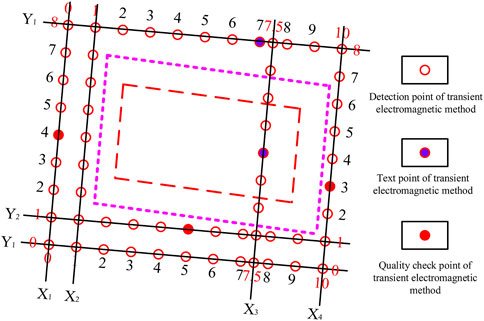
FIGURE 3. Layout of the detection.
A total of 63 production records were obtained in this transient electromagnetic detection. Among them, 52 are grade A records, with a grade A rate of 82.5%; 11 are grade B records, with a grade B rate of 17.5%. There are a total of 63 qualified records, with a pass rate of 100%.
After analyzing the three quality checkpoints in the entire area (5% of the physical points on the line), the maximum relative error was 9.21%, the minimum error was 0.11%, and the total average relative error of the entire detection area was 4.79%. The pass rate of the original data was 100%, which meets the standard of “Coal Electricity Exploration Specification” (MT/T898-2000).
The changes in soil deformation and water content are mutually influential (Bai et al., 2021). The water content (Bai et al., 2022) and temperature of the soil (Bai et al., 2021) have an influence on the conductivity of the soil. Because of the small detection depth range, the formation temperature changes very little, so the effect of temperature on the formation resistivity can be ignored. According to the known data, most of the goaf is filled with water, so the influence of water content on soil conductivity cannot be ignored. Under normal circumstances, the precise resistivity profile contour of the formation is consistent with its trend. When the geological structure is developed, or when there are other low-resistance anomalies, the apparent resistivity contours are distorted, or the gradient changes in the horizontal and vertical directions. When there is no water in the goaf, it exhibits a high resistance relative to the surrounding rock. On the contrary, the goaf offers low resistance relative to the surrounding rock when it contains water (Chang et al., 2020). In this proposed area, the coal seams of Ji16–17 were mainly mined, and the water came from limestone aquifers and Quaternary surface water. After a comprehensive analysis of the known data, it was inferred that most of the goaf was filled with water, resulting in low resistance reflection.
The transient electromagnetic method observation data induced electromotive force of each time window of each measuring point, which needs to be converted into parameters such as apparent resistivity and apparent depth to interpret the data. According to formulas (1)∼(3), the apparent resistivity of each point at each depth can be obtained. By arranging the seven survey lines, the vertical and horizontal apparent resistivity detection of the entire complex goaf can be obtained. The induced electromotive force measured by the device is transmitted to the microcomputer, and the measured data are calculated and checked. Then, a V(t)/I multimeasurement channel cross-section curve was drawn. According to the curve change characteristics, the distortion point data are removed, and the off-time correction is further implemented to eliminate the distortion of the transient electromagnetic response curve caused by the off-effect, so as to achieve the purpose of reflecting the true underground resistivity response. On this basis, the apparent resistivity (
The detection points of the detection line X1 are from 0 to 8. From the longitudinal section of the apparent resistivity (Figure 4), it can be seen that between the lateral distances of 0 and 20 m (points 0–2), when the depth is greater than −160 m, the apparent resistivity contour is bent down, showing a low-resistance anomaly. This anomaly is because of the influence of the iron fence on the side of the Eagle City Square table tennis court between points 0 and 2. There is no obvious low-resistance anomaly near the depth of −160 m in other parts, so there is no abnormal goaf.
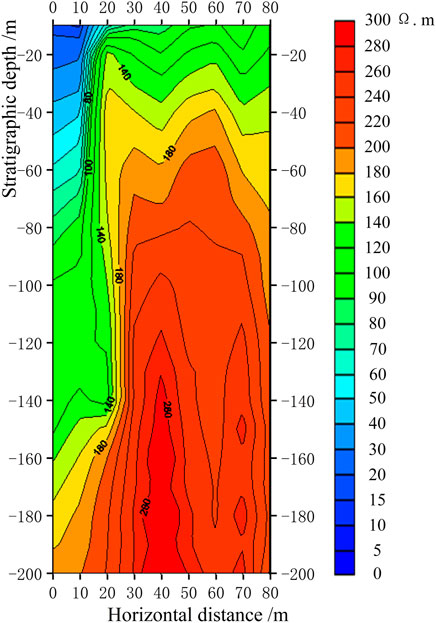
FIGURE 4. Longitudinal section view of resistivity of X1 line.
The detection points of the detection line X2 are from points 0 to 8. From the longitudinal section of the apparent resistivity (Figure 5), it can be found that the contour line at a depth of −160 m is a low-resistance depression at a lateral distance of 30 m (point 3). It is predicted that this abnormality is because of the influence of the coal mine goaf, but it is located in the color board room of the badminton court in Yingcheng Square, so it can be inferred that this abnormality is because of the color board house. At lateral distances of 10, 20, and 80 m (points 1, 2, and 8), the contour line at a depth of −160 m has a low-resistance-closed and semiclosed circle, which is inferred to be an abnormal goaf, as shown by the red dashed line in Figure 5.
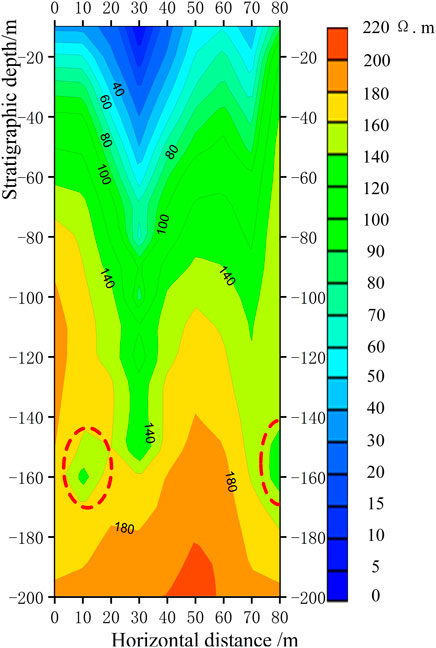
FIGURE 5. Longitudinal section view of resistivity of X2 line.
The detection points of the detection line Y3 are from points 0 to 10. From the longitudinal section of the apparent resistivity (Figure 6), it can be seen that there is a low-resistance depression at a depth of −160 m between the lateral distances of 10 and 30 m (points 1–3), which is inferred to be an abnormal goaf, as shown by the red dashed line in Figure 6.
FIGURE 6. Longitudinal section view of resistivity of Y3 line.
The apparent resistivity sections of the detection line X3, the detection line X4, the detection line Y1, and the detection line Y2 are respectively shown in Figures 7A–D. It can be seen from these four profiles of apparent resistivity that there is no downward distortion of apparent resistivity contours or other obvious low-resistance depressions in the vicinity of the depth of −160 m. Therefore, it is speculated that there is no low-resistance abnormal area in those areas.
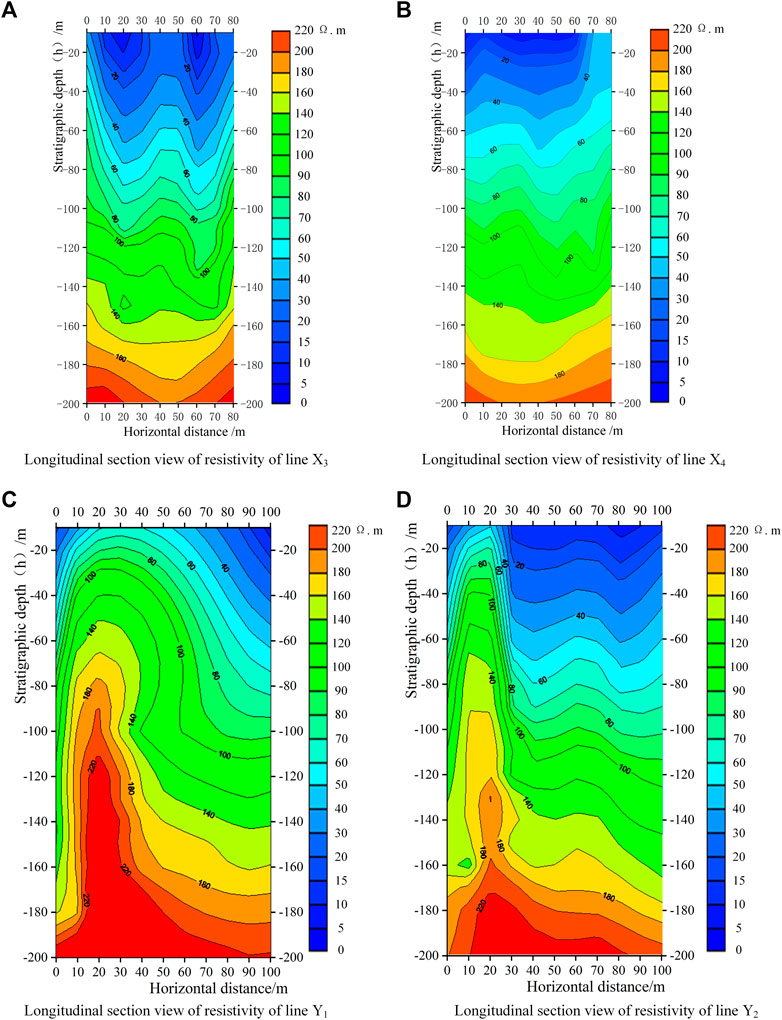
FIGURE 7. Longitudinal section view of resistivity of X3, X4, Y1, and Y2 line.
After completing the data processing and analysis of the seven survey lines, they were combined with the collected geology of the survey area and coal seam mining conditions, and horizontal profiles of the apparent resistivity were obtained at depths of −160 and −200 m in the detection area. The electrical characteristics of the detection area were further studied to analyze the distribution of the abnormal goaf in the detection area.
The horizontal profile of the apparent resistivity at a depth of −160 m is shown in Figure 8. The color in Figure 8 changes from red to green, representing a gradual decrease in the apparent resistivity. Figure 8 shows the electrical distribution at a depth of −160 m in the detection area, which exhibits high left, low right, and high and low electrical characteristics. The low-resistance area is indicated by the red dashed line in Figure 8. The distribution range is relatively uniform. In addition, the scope of the low-resistance area is large, and it is speculated to be an abnormal goaf.

FIGURE 8. Horizontal profile of apparent resistivity at a depth of -160 m.
The horizontal profile of the apparent resistivity at a depth of −200 m is shown in Figure 9. The color in Figure 9 changes from red to blue, representing a gradual decrease in the apparent resistivity. Figure 9 shows the electrical distribution at a depth of −200 m in the detection area, where the electrical characteristics are high on the left, bottom, and right sides and relatively low on the upper side. The low-resistance area is circled by the red dashed line in Figure 9, and it is speculated to be an abnormal goaf. This abnormal area coincides with the abnormal position in the horizontal profile of the apparent resistivity at a depth of −160 m.
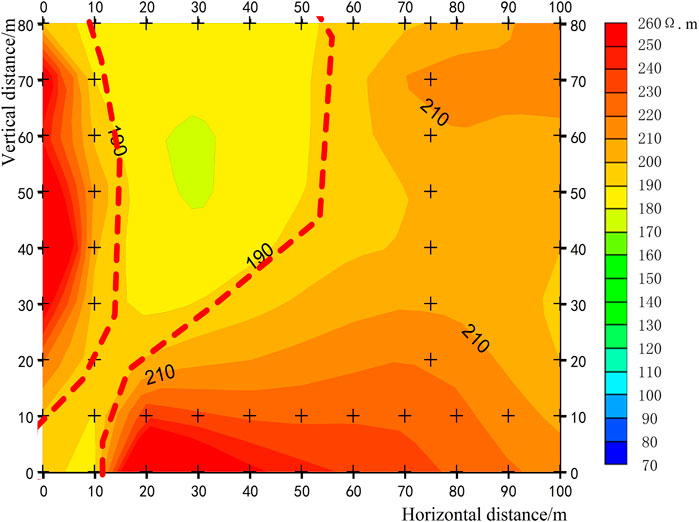
FIGURE 9. Horizontal profile of apparent resistivity at a depth of -200 m.
To further analyze the relationship between the stratigraphic depth and the apparent resistivity, the relationship curve between the stratigraphic depth and the apparent resistivity at point 3 of the Y3 line is drawn, as shown in Figure 10. The apparent resistivity at point 3 of the Y3 line exhibits an increasing trend as the depth of the stratigraphic increases. However, the apparent resistivity decreases at depths of −64 to −78 m, −82 to −92 m, −106 to −116 m, and −140 to −154 m.
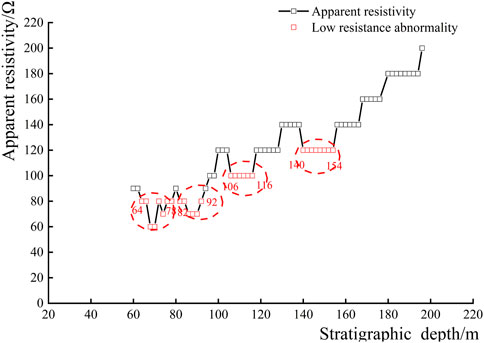
FIGURE 10. Relationship between formation depth and apparent resistivity at point 3 of the Y3 line.
To further provide the stratum data for foundation stability and disaster assessment, drilling detection was used to reveal the primary conditions of the detection area. The drilling is located in the speculated goaf in the northwest corner of the site and is the transient electromagnetic detection point 3 of the Y3 line. The drilling depth is −170 m, and the position is shown in Figure 11.
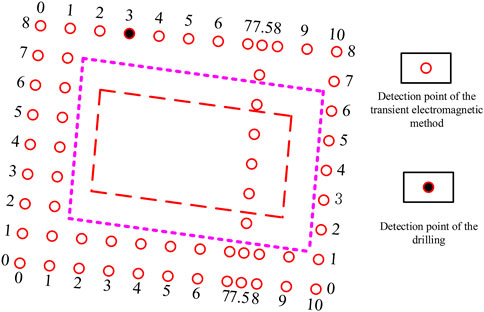
FIGURE 11. Location of the drilling.
The high-speed drilling rig used for drilling detection was an XY-4-type mechanical drive, a hydraulic-feed high-speed drilling rig. A mud-protected wall and a core tube with an outer diameter of 108 mm were used for drilling at a depth of 0 to −60 m. A 60 m casing with mud to protect the wall was used, and a core tube with an outer diameter of 75 mm was drilled at depths of −60 to −150 m. A 150 m casing with mud to protect the wall was also used, and a core tube with an outer diameter of 60 mm was drilled at depths of −150 to −170 m.
During the drilling process, the joints and fissures in the shale rock at the depths of −64 to −76 m, −88 to −94 m, −104 to −116 m, and −140 to −154 m are relatively developed, and there is a small amount of water leakage. The drill is buried at approximately −105 m (determined based on the situation in the core tube of 75 m after the drilling was finished). The results of drilling detection indicate that there is fragmentation in the lower part of the rock mass (shale rock layer), and the cracks are relatively developed. However, the original rock mass structure was retained, and the skeleton particles were in contact with each other. However, at depths of −164 to −170 m, the rock was relatively broken, and the fracture zone was filled with some fluid substances, such as mud and water. It can be seen from the above that although the rock stratum is developed in many depths, the original rock mass structure is still retained. Only at the depths of −164 to −170 m, there is a fault zone in the rock mass, so only the depths of −164 to −170 m are considered to be the heterogeneous rock mass in the goaf.
Figure 12 is the relationship between the drilling depth and the core rate at point 3 of the Y3 line. In general, the core rate is not less than 80% for general rocks and not less than 65% for soft and broken rocks. The rocks in the proposed are of the general type. It can be seen that from Figure 12, the core collection rate is less than 80% when the drilling depths are −64 to −76 m, −88 to −94 m, −104 to −116 m, −140 to −154 m, −158 m, and −168 to −174 m. There is a 1.6 m coal seam around the depth of −158 m.
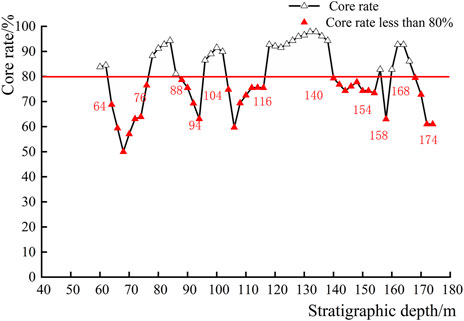
FIGURE 12. Relationship between the drilling depth and the core ratio at point 3 of the Y3 line.
The results of apparent resistivity at point 3 of the Y3 line and the results of drilling detection at this point are shown in Figure 13 at the same time. It can be seen from Figure 13 that the results of transient electromagnetic detection and drilling detection are highly consistent, indicating the reliability of the detection results. In addition, from the results of the drilling detection, it can be known that the abnormal goaf inferred by the transient electromagnetic method is the heterogeneous rock mass in the goaf.
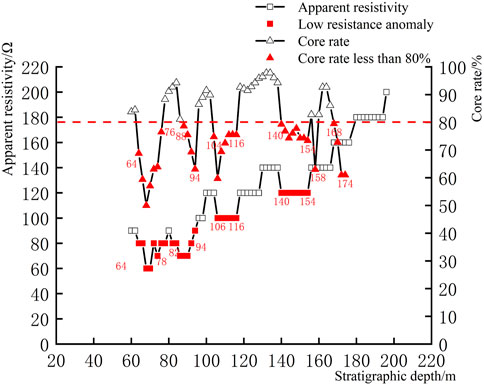
FIGURE 13. Core rate and the apparent resistivity at point 3 of the Y3 line.
The heterogeneous rock mass in the goaf underlying the proposed substation can be determined finally through a comprehensive analysis of the horizontal profile of the apparent resistivity at depths of −160 and −200 m, the relationship curve between the stratum depth and the apparent resistivity, and the relationship curve between the drilling depth and the core rate. The heterogeneous rock mass in the goaf underlying the detection area is the pink-shaded area in Figure 14. This indicates that there are uncertain factors in the safety and stability of the proposed area. Therefore, it is necessary to adopt effective governance measures to ensure the safety and stability of its operations.
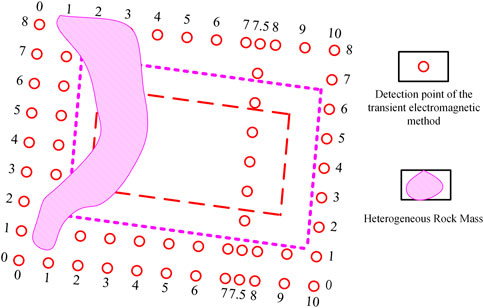
FIGURE 14. Heterogeneous rock mass in the goaf underlying the proposed substation.
According to the geological conditions of the proposed area and the characteristics of transient electromagnetic detection and drilling detection, the transient electromagnetic method was selected as the main detection method, and the most subjective and effective detection method—drilling detection—was used as auxiliary detection. The research results show the following:
1) After eliminating the interference, in the longitudinal section of apparent resistivity of the seven detection lines of the transient electromagnetic method, points 1 to 2 and point 8 of the X2 detection line, and points 1 to 3 of the Y3 detection line, there is a low-resistance anomaly near the depth of -160 m, which is presumed to be an abnormal goaf; the other five detection lines have no obvious low-resistance anomaly, indicating that there is no abnormal goaf at these locations.
2) The apparent resistivity at depths of −160 and −200 m was sliced, and the abnormal regions in the two apparent resistivity slice maps are highly consistent. It is basically determined that the abnormal goaf underlying the proposed substation is located on the west side of the proposed area.
3) Drilling was conducted at point 3 of the Y3 line, and the relationship between the drilling depth and the core rate was drawn. The depth range where the core rate is lower than 80% is in good agreement with the depth range of the low-resistance anomaly of the transient electromagnetic method, indicating the reliability of the detection results. In addition, it can be known that the abnormal goaf inferred by the transient electromagnetic method is the heterogeneous rock mass in the goaf from the results of the drilling detection.
4) The comprehensive analysis of the detection results of the two methods can determine the spatial location and distribution range of the heterogeneous rock mass in the goaf underlying the proposed substation accurately, which is located on the west side of the detection area. There are uncertain factors in the safety and stability of the proposed area, and effective governance measures should be taken for the heterogeneous rock mass of the goaf to ensure the safe and stable operation of the proposed substation.
The original contributions presented in the study are included in the article/supplementary material; further inquiries can be directed to the corresponding author.
Conceptualization, JD, YZ, ZX, and KG; methodology, JD; validation, JD, YZ, and KG; formal analysis, JD; investigation, JD and YZ; resources, JD; writing—original draft preparation, JD; writing—review and editing, JD, YZ, ZX, and KG; visualization, JD, YZ, and KG.
This study was financially supported by the National Natural Science Foundation of China (Grant No. 52074148) and the Educational Department of Liaoning Province (Grant No. LJ2020JCL019).
The authors declare that the research was conducted in the absence of any commercial or financial relationships that could be construed as a potential conflict of interest.
All claims expressed in this article are solely those of the authors and do not necessarily represent those of their affiliated organizations, or those of the publisher, the editors, and the reviewers. Any product that may be evaluated in this article, or claim that may be made by its manufacturer, is not guaranteed or endorsed by the publisher.
Bai, B., Zhou, R., Cai, G. Q., Hu, W., and Yang, G. C. (2021). Coupled thermo-hydro-mechanical mechanism in view of the soil particle rearrangement of granular thermodynamics. Comput. Geotechnics 137 (8), 104272. doi:10.1016/j.compgeo.2021.104272
Bai, B., Wang, Y., Rao, D., and Bai, F. (2022). The effective thermal conductivity of unsaturated porous media deduced by pore-scale SPH simulation. Front. Earth Sci. 10, 943853. doi:10.3389/feart.2022.943853
Chang, J. H., Su, B. Y., Malekian, R., and Xing, X. J. (2020). Detection of water-filled mining goaf using mining transient electromagnetic method. IEEE Trans. Ind. Inf. 16 (05), 2977–2984. doi:10.1109/TII.2019.2901856
Chen, Q. J., Zhang, Y. C., Qiu, H., Lian, W. G., and Fan, L. L. (2019). Transient electromagnetic response characteristics of mine water-rich area. Saf. Coal Mines 50 (10), 185–189. doi:10.13347/j.cnki.mkaq.2019.10.043
Cheng, H., Yu, C. T., Han, Y. L., Wang, H. M., Yang, X. C., and Yang, Y. (2021). Detection accuracy of various goafs by transient electromagnetic method. Sci. Technol. Eng. 21 (6), 2262–2268. doi:10.3969/j.issn.1671-1815.2021.06.019
Dong, L., Chen, Y., Sun, D., and Zhang, Y. (2021a). Implications for rock instability precursors and principal stress direction from rock acoustic experiments. Int. J. Min. Sci. Technol. 31 (5), 789–798. doi:10.1016/j.ijmst.2021.06.006
Dong, L. J., Tong, X. J., Hu, Q. C., and Tao, Q. (2021b). Empty region identification method and experimental verification for the two-dimensional complex structure. Int. J. Rock Mech. Min. Sci. 147, 104885. doi:10.1016/j.ijrmms.2021.104885
Dong, L., Tong, X., and Ma, J. (2020). Quantitative investigation of tomographic effects in abnormal regions of complex structures. Engineering 7 (7), 1011–1022. doi:10.1016/j.eng.2020.06.021
Hai, S. Y., Yun, M. H., and Zhao, Q. F. (2018). Application and interpretation method of TEM data based on drilling constraint. Coal Geol. Explor. 46 (4), 174–180. doi:10.3969/j.issn.1001-1986.2018.04.028
Hu, G. X., Li, W. H., Li, J. T., Li, P. T., and Li, G. (2019). Borehole layout for production geological exploration in Pingshuo open-pit mine. Opencast Min. Technol. 34 (6), 85–87. doi:10.13235/j.cnki.ltcm.2019.06.023
Ji, S. H., and Ma, Z. H. (2009). Analysis of drilling technology in engineering geology prospecting. Coal Technol. 28 (9), 152–153.
Li, X. L., and Tian, Y. B. (2013). Analyses and application of detection technique for old coal mining area. J. Henan Polytech. Univ. Sci. 32 (3), 277–280. doi:10.3969/j.issn.1673-9787.2013.03.006
Lin, X. Y., and Qiu, Z. H. (2021). Application practice of detecting shallow goaf based on down-the-hole drilling. Min. Technol. 21 (1), 101–103. doi:10.13828/j.cnki.ckjs.2021.01.029
Lu, K. L., Li, X., Fan, Y. N., Zhou, J. M., Qi, Z. P., Li, W., et al. (2021). The application of multi-grounded source transient electromagnetic method in the detections of coal seam goafs in Gansu Province, China. J. Geophys. Eng. 18 (04), 515–528. doi:10.1093/jge/gxab031
Mou, Y. (2018). Experimental study on response characteristics of transient electromagnetic method in shallow gob. Coal Sci. Technol. 46 (10), 203–208. doi:10.13199/j.cnki.cst.2018.10.032
Si, Y. L., Li, M. F., Liu, Y. N., and Guo, W. H. (2020). One-dimensional constrained inversion study of TEM and application in coal goafs’ detection,open. Geosciences 12 (01), 1533–1540. doi:10.1515/geo-2020-0148
Xie, X., Hou, E., Long, T., Feng, D., Hou, P., Wei, Q., et al. (2022). Study on evaluation and prediction of the degree of surface damage caused by coal mining. Front. Earth Sci. 9, 805248. doi:10.3389/feart.2021.805248
Xiong, C. X., Liang, H. C., Ma, J. R., and Zhang, E. F. (2010). Stability analysis of the building foundation over goal area. J. Min. Saf. Eng. 27 (1), 100–105. doi:10.3969/j.issn.1673-3363.2010.01.019
Xu, X. P. (2019). Application of the transient electromagnetic method to flooding survey in a coal. Min. Area Shanxi Prov. 55 (2), 579–584. doi:10.12134/j.dzykt.2019.02.012
Ye, T. Q., Chen, J. J., and Wang, T. (2012). Risk detecting and analysis of complex gob in the opencast mining. China Min. Mag. 21 (1), 87–89. doi:10.3969/j.issn.1004-4051.2012.01.022
Keywords: goaf, heterogeneous, rock mass, transient electromagnetic detection, drilling detection
Citation: Dong J, Zhang Y, Xie Z and Gao K (2022) Heterogeneous rock mass detection in the Goaf underlying the Yingbin substation. Front. Earth Sci. 10:924124. doi: 10.3389/feart.2022.924124
Received: 20 April 2022; Accepted: 11 July 2022;
Published: 17 August 2022.
Edited by:
Longjun Dong, Central South University, ChinaReviewed by:
Geng Jiabo, Jiangxi University of Science and Technology, ChinaCopyright © 2022 Dong, Zhang, Xie and Gao. This is an open-access article distributed under the terms of the Creative Commons Attribution License (CC BY). The use, distribution or reproduction in other forums is permitted, provided the original author(s) and the copyright owner(s) are credited and that the original publication in this journal is cited, in accordance with accepted academic practice. No use, distribution or reproduction is permitted which does not comply with these terms.
*Correspondence: Jianjun Dong, ZG9uZ2ppYW5qdW5AbG50dS5lZHUuY24=
Disclaimer: All claims expressed in this article are solely those of the authors and do not necessarily represent those of their affiliated organizations, or those of the publisher, the editors and the reviewers. Any product that may be evaluated in this article or claim that may be made by its manufacturer is not guaranteed or endorsed by the publisher.
Research integrity at Frontiers
Learn more about the work of our research integrity team to safeguard the quality of each article we publish.