 Ivan Lizaga
 Borja Latorre
 Leticia Gaspar2
 Ana Navas
- 1Isotope Bioscience Laboratory—ISOFYS, Department of Green Chemistry and Technology, Ghent University, Ghent, Belgium
- 2Estación Experimental de Aula-Dei (EEAD-CSIC), Spanish National Research Council, Zaragoza, Spain
- 3Department of Environment and Soil Sciences, Agrotecnio CERCA Center, University of Lleida, Lleida, Spain
Recent land use changes, the absence of soil protection between crop periods, and extreme precipitation events have been highlighted as major influential factors in the fluctuations of sediment export in the last decades at the catchment scale worldwide. In this regard, soil erosion and fine-particle export are two of the major concerns of soil nutrient loss and water-quality decrease (e.g., increasing turbidity and vector of chemicals). However, while rainfall effects have been well-monitored, recent land use changes and management need additional approaches to evaluate their effect. In Mediterranean mountainous environments, in addition to forest management, agricultural practices during different cropland stages likely increase sediment and particle-bound chemicals in the drainage system. Moreover, most catchments lack instrumentalization. Thus, there is a gap in the knowledge on the processes influencing the sediment exported in ungauged catchments. To evaluate the processes involved, remote sensing and seasonal sampling of suspended sediments were examined for 5 years in a representative agroforestry system in three sub-catchments (SBCs) with different proportions of land uses. Temporal trends of NDVI, EVI, MSAVI, SAVI, and NDWI indices were analyzed for monitoring the vegetation status. With this information, we attempt to evaluate the soil response in terms of particle size export to land use change, vegetation status, and precipitation distribution in fine-grained sediment-reaching streams. Our findings not only highlight the significant effect of heavy precipitation events and vegetation cover on the grain-size fraction of the exported sediment but also reveal the existence of more complex factors influencing the export dynamics. A silt-increasing trend due to the increase of individual heavy precipitations from 2017 onward despite the total precipitation amount not increasing was detected. It is shown that indices such as NDVI and NDMI help detect small changes in vegetation cover, while EVI, SAVI, and MSAVI are more robust for detecting general patterns in large vegetated areas and preventing the appearance of artefacts in the data. Results from this study suggest that land use changes combined with short-scale changing trends of rainfall likely explain most of the possible effects observed in terms of sediment export changes.
Introduction
Poor land management and subsequent soil erosion have created serious water-quality problems in many parts of the world (Zalidis et al., 2002; Melland et al., 2018). However, global attention has mainly focused on water quantity, water-use efficiency, and allocation issues. Worldwide water scarcity is caused not only by the physical shortage of the resource or the storage capacity due to reservoir siltation but also by the progressive deterioration of water quality (Mateo-Sagasta et al., 2017; Owens, 2020). The recent increase in fine-sediment transport has been demonstrated to be the pathway for widespread contaminants in aquatic ecosystems, compromising water quality, and having deleterious effects on infrastructures (Navas et al., 2004; Liu et al., 2021; Sirisena et al., 2021).
Soil erosion and sediment export processes tend to be selective toward grain size. Thus, particle size is progressively altered toward fine particles through deposition of the coarser fraction that is only mobilized during high floods (Grangeon et al., 2012). The importance of clay-sized sediments is due to their chemically enriched nature due to the large surface area, and the concentration of chemicals associated with fine particles is mainly related to agriculture (Brigatti et al., 2013; Ito and Wagai, 2017). Thus, continuous fine-particle transport, together with the impoverished sand-size fraction lost during runoff and down-field transport, could increase the chemically enriched silt-clay fraction (Ongley, 1996).
Erosion processes are especially severe in semi-arid and dry sub-humid hydroclimatic areas affected by intermittent heavy precipitations after long dry periods, such as Mediterranean mountain agro-ecosystems (Mariani and Parisi, 2014). Most of these areas are characterized by rainfed agriculture lacking adequate vegetative plant cover during part of the year, and recent land use changes can significantly impact the terrestrial component of the water cycle and trigger land degradation. Rainfed annual crops are considered among the agricultural practices that influence soil erosion, particularly during the period when the soil surface of croplands has no plant cover protection (Lizaga et al., 2020). In this climate and land use distribution context, the importance of exceptional rainstorms has been highlighted and they have been found to be responsible for major geomorphological changes and the export of riverbed fine sediment to downstream water bodies (Nadal-Romero et al., 2012; Serrano-Notivoli et al., 2017; Sukumaran et al., 2021; Wu et al., 2021; Ramos et al., 2022). In the last decades, most cultivated fields with a high risk of erosion located at the headwaters in Mediterranean mountains have been abandoned and naturally replaced by vegetation or afforested. However, there is a need for a more comprehensive appraisal of how agriculture and its seasonal management affect the exported sediment. While this information can be obtained through erosion models in gauged hydrological systems (Borrelli et al., 2021), most catchments lack equipment to monitor sediment export, making it difficult to understand the effect of agroforestry practices linked to precipitation events.
In this regard, remote sensing enables monitoring large areas within a short time period, but more importantly, for land management during a time frame. Thus, the land use and cover changes can be analyzed and the temporal trends, examined. Remote sensing images can provide information about soil properties, land management, human activities, vegetation status, and cover modifications that are of high value to relate climate and human influence to sediment export and the possible effects that could trigger (Ge et al., 2011; Wang et al., 2019; Anwar and Diallo, 2021). Sepuru and Dube (2018) highlighted that most remote sensing studies are focused on vegetation land cover and land use changes without going further into the details of environmental problems, such as soil erosion. However, when using satellite imagery, it is only possible to observe surface soil erosion for assessing soil erosion directly when it is not covered by vegetation, which can be challenging in many landscapes (Vrieling, 2006). For example, during the 20th century, in Mediterranean mountain landscapes, different socioeconomic changes caused the abandonment of rural areas and a widespread land abandonment that led to shrub recolonization and reforestation (García-Ruiz et al., 2013). These events, combined with human afforestation at the headwaters of the catchments to prevent the siltation of downstream water bodies, reduced runoff and soil erosion, and thereby, sediment yield (Navas et al., 2017). For these reasons, direct monitoring of soil erosion at the catchment scale from satellite imagery in Mediterranean mountain environments could be challenging, particularly with medium-low resolution images such as Landsat or Sentinel. The greatest landscape variations are produced in terms of vegetation, such as the cycle of rainfed agriculture or the variation of scrub and forest vegetation status due to climatic conditions or human impacts.
Previous studies assessing soil erosion through remote imagery in different landscapes found an overriding influence of climate and vegetation, thus controlling soil erosion in catchments (Sepuru and Dube, 2018). For this reason, a combined application of remote sensing imagery for tracking the vegetation cover, climate variables, and ground truth sediment export data may produce an accurate picture of the most influencing factors affecting soil erosion at the catchment scale.
Nowadays, multiple processed vegetation and water content indices can be directly obtained from platforms such as USGS and Copernicus. For example, the US Geological Survey Earth Resources Observation and Science Center directly supplies eight different surface reflectance-derived spectral indices, of which five are widely used for vegetation status and soil humidity monitoring. However, it is not clear which of these indices could better fit different studies or if only one of them could be the optimum.
With this aim, this study examines the utility of combining seasonal sampling and remote sensing data to detect the main controlling factors, natural or anthropogenic, driving the supply of fine sediments to streams. For this purpose, seasonal suspended sediment samples were collected during five hydrological years (September 2014 to summer 2019) in three different sub-catchments characterized by different land use proportions. Our research represents the first attempt to combine the analysis of the most widespread remote sensing indices for vegetation status and soil humidity monitoring, such as the normalized difference vegetation index (NDVI), normalized difference moisture index (NDMI), enhanced vegetation index (EVI), soil-adjusted vegetation index (SAVI), and modified soil-adjusted vegetation index (MSAVI), together with temporal rainfall variation and seasonal suspended sediment samples, to understand the main human or natural factors by means of differences in grain-size distribution in the fine sediment exported in recent years.
Material and methods
The study area
The Barués catchment (23 km2), drained by an ephemeral stream tributary of the Arba River, is located in the northern-central part of the Ebro basin, Spain (Figure 1). The climate is characterized by cold winters and hot and dry summers. The rainfall periods are concentrated in the spring and autumn seasons, while droughts occur between these two humid periods. The area is subjected to very intense though sometimes localized storms. The mean annual rainfall usually ranges between 550 and 650 mm (recorded since 1929 at the Yesa reservoir; AEMET).
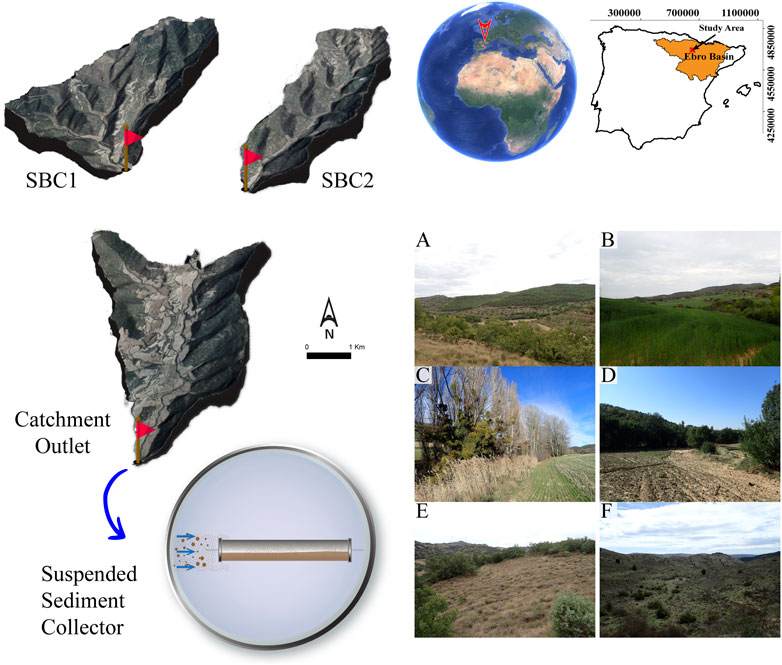
FIGURE 1. Location of the Barués catchment in the central part of the Ebro Basin (NE Spain). A 3D map of the three studied sub-catchments, SBC1, SBC2, and the catchment outlet (CO). (A–F) Images of the main land covers: (A) pine afforestation and Mediterranean open forest (MF); (B) cropland (CF) and riverbank vegetation (RB) in the main stream in the SBC3/catchment outlet; (C) riverbank vegetation and wheat cropland at its first growth stages; (D) eroded cropland exporting sediment to the stream; (E) scrubland in abandoned cropland; and (F) headwaters abandoned croplands.
At the start of the 20th century, most of the catchment was agricultural land. In the 1960s, nearly 60% of the catchment was arable land. However, during the subsequent 10 yr, 75% of the agricultural land was abandoned. Currently, ∼16% of the catchment is still cultivated, while open forest and pine occupy the remaining 83.5% (Lizaga et al., 2018). This abandonment was substantially greater at the headwaters due to the existence of shallow soils and more steep slopes that hinder the use of machinery. The main land use/land covers are agricultural or crop fields (CF), Mediterranean open forest (MF), and pine afforestation (PI), occupying 16, 50, and 19% of the catchment surface, respectively. The most abundant soil types in the catchment are Calcisols and Cambisols (IUSS Working Group WRB, 2015), developed on quaternary deposits mainly formed by colluvial and alluvial deposits; they are alkaline and have low soil organic carbon contents and secondary accumulation of carbonates. The particle size of the catchment is rather homogenous with a predominantly silt texture and similar sand, silt, and clay fractions for different land covers (Lizaga et al., 2018). Overall, at the catchment scale (Figure 1), two main areas can be identified due to the slope contrast: 1) the headwaters characterized by a well-developed and hierarchical stream network, while at the lower part of the catchment, 2) the drainage system which is less hierarchized due to the abundance of agricultural fields that are surrounded by vegetative buffer strips for sediment trapping. The headwaters include two different sub-catchments (SBC1 and SBC2). SBC1 is characterized by a high proportion of afforested areas and an intermediate proportion of cropland, and sub-catchment 2 (SBC2) is characterized by the largest area of abandoned lands with the smallest proportion of croplands not cultivated every year. In the downstream portion, sub-catchment 3 (SBC3) has predominant cropland around the main stream that is cultivated annually. In addition, most of the agricultural land is located on a quaternary glacis located in the lower eastern part and on fluvial terraces with gentle slopes occupying the valley floors (Lizaga et al., 2019a). Rangelands take the highest altitudes, and the revegetated abandoned crops are mainly located at intermediate altitudes where most abandoned crops were in the past.
The main crops are winter cereals (Triticum aestivum L. and Hordeum vulgare L.) with localized crops of rapeseed (Brassica napus L.) Sowing usually occurs between October and November, and the harvest season ranges from mid-May to July. The pine forest is mainly composed of Pinus halepensis Mill. The Mediterranean forest comprises a large variety of trees, shrubs, and herbaceous species mainly represented by trees from the Quercus family dominated by Quercus robur L., with another subgenus such as Quercus coccifera L., and Quercus ilex L., together with small trees such as Juniperus L. shrubs. Among the shrubs and herbaceous species, the dominants are Rosmarinus officinalis L., Thymus vulgaris L., Genista scorpium (L.) DC., Macrochloa tenacissima (L.) Stipa tenacissima (L.) Kunth, and Lygeum spartum (L.) Kunth that are typically Mediterranean and intermixed with the trees in most areas. The higher or lower tree density depends on the time since the land abandonment. Thus, the headwaters and areas with the most challenging access were first abandoned and have a more developed tree cover with bigger trees and shrub specimens. This results in a vertical and horizontal multi-strata canopy structure (Lizaga et al., 2019a).
The main streams’ riverbank vegetation (RB) is characterized by medium to high density that varies according to the channel width. The streams are narrower at the headwaters and wider at the catchment outlet. The RB vegetation is mainly composed of plants of the genus Rubus L. and trees from the genus Populus L. and Ulmus L. In addition to these varieties, the wider downstream channels have a high density of Phragmites australis (Cav.) Trin. ex Steud., which likely acts as an efficient sediment trap.
Sediment sampling and analysis
Suspended sediment (SS) samples were collected following the methodology proposed by Phillips et al. (2000) in the middle part of the streambed along the main streams, from the headwaters to the outlet of the catchment in three sampling stations (ST). The locations were carefully selected to assemble the variability between the three main sub-catchments (Figure 1). SS samples were collected seasonally during five hydrological years, from October 2014 to June 2019. However, it was impossible to retrieve the SS samples corresponding to the 2nd seasonal campaign that had an extended time-lapse due to technical problems. The objective of the sampling schedule was to provide a close replication of sediments transported during each season for evaluating both seasonality and the effect of different crop practices such as sowing or harvesting. To analyze the fine sediment transport, the collected sediments were air-dried, weighted, homogenized, and sieved to ≤63 µm, following the most widespread methodology (Owens et al., 2016).
A Beckman Coulter LS 13320 laser diffraction particle size analyzer was used for grain size analysis. Prior to particle size measurements, the organic fraction was removed by H2O2 (10%) heated to 80°C. The samples were then chemically dispersed with 2 ml of sodium hexametaphosphate (40%), stirred for 2 h, and sonicated for a few minutes to facilitate dispersion (Sheldrick and Wang, 1993). In addition to the particle size analysis, as an approximation and a guide to the possible changes in the transported suspended sediment, the weight of the collected mass inside the ST was also measured.
Remote sensing for land use monitoring
The different multispectral sensors onboard Landsat satellites acquired a series of 19 Landsat 8-OLI images. Image series selected had sensing periods nearest to those of the sample collection campaigns and cloud cover absence. The procedure for pre-processing satellite multispectral images to ensure temporal comparability between scenes was carried out by the Earth Resources Observation and Science Center (EROS) (USGS) (Vermote et al., 2016). This correction was done to ensure data comparability between scenes. Together with this correction, a series of Landsat surface reflectance-derived spectral indices are supplied by the EROS-USGS (Vermote et al., 2016), from which five are specifically for vegetation status and soil humidity monitoring or analysis. The supplied indices were normalized difference vegetation index (NDVI), normalized difference moisture index (NDMI), enhanced vegetation index (EVI), soil-adjusted vegetation index (SAVI), and modified soil-adjusted vegetation index (MSAVI) (Table 1). The NDVI is the most widely used band ratio to quantify vegetation greenness and is useful in understanding vegetation density and assessing changes in plant health. The EVI is similar to the NDVI and can be used to quantify vegetation greenness. However, the EVI corrects for some atmospheric conditions and canopy background noise, and it is supposed to be more sensitive in areas with dense vegetation.
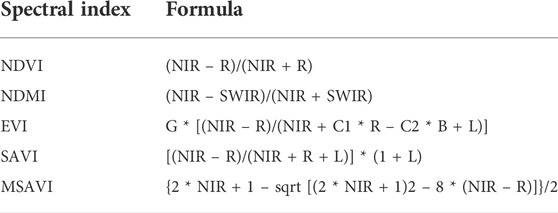
TABLE 1. Spectral indices used for time series and land cover changes analyses. Normalized difference vegetation index (NDVI), normalized difference moisture index (NDMI), enhanced vegetation index (EVI), soil-adjusted vegetation index (SAVI), and modified soil-adjusted vegetation index (MSAVI).
On the other hand, the SAVI and its modified version MSAVI developed to minimize the effect of bare soil in the SAVI index are used to correct the NDVI for the influence of soil brightness in areas where vegetative cover is low. Finally, the NDMI is used to determine vegetation water content. Despite the high similarity between some of the implemented indices used to analyze the vegetation status and soil humidity (NDVI, NDMI, EVI, SAVI, and MSAVI), it was decided that all Landsat surface reflectance-derived spectral indices supplied were to be analyzed to evaluate their consistency.
In addition, all the different land uses and individual croplands were delineated by using the 2014 high-resolution (0.25 m pixel) aerial orthophoto (National Plan of Aerial Orthophotography, Instituto Geográfico Nacional, 2022). Based on this delineation, the information was extracted from all the indices and the different land uses in each sub-catchment. Thus, not only the vegetation status but also the cropland rotations were detected and evaluated as a possible conditioning factor of the grain size of the exported sediment as well as the mass exported to the stream.
Precipitation data
Two different datasets were evaluated and combined to avoid gaps regarding the precipitation data. The primary dataset was extracted from a tipping bucket rain gauge connected to an Em50 Decagon data logger located in the study catchment installed in March 2016. However, some gaps were present in the temporal line due to technical issues. Data from the Yesa weather station (30T ETRS89 X:648317 Y:4719912, altitude: 487 m.a.s.l), located 20 km north of the Barués rain gauge, were extracted and combined to complete the lacking days before its installation and the observed gaps. Before merging both datasets, a matrix of Pearson’s r was computed using the function rcorr from the package Hmisc to assess the relationships between the daily common data. The correlation between both rainfall datasets for the common matches displayed an r coefficient of 0.71, which supports filling the NA from the Barués dataset with the data extracted from the Yesa weather station. However, one major drawback is that while the Barués station records minutely data, the Yesa station only allows the download of daily information. Thus, the intensity of the precipitation events cannot be evaluated during the filled periods.
Statistical analysis
Satellite imagery data were analyzed with digital image processing methods and spatial analysis techniques in R (version 4.0.3) (R Core Team, 2020) to detect spatial and temporal changes in cropland rotation and the different types of vegetation such as pine afforestation, Mediterranean forest, and riverbank. After cropping the study images to different extents, Pearson’s correlation coefficients analyses were used to assess the relationships between the different vegetation indices at the catchment and sub-catchment scale and also between the different land uses by using the R function rcorr from the package Hmisc.
To visualize the differences in the analyzed indices between the three sub-catchments, a heatmap of the Pearson correlation r values combined with a dendrogram was computed by using the heatmap function from the base package stats. The heatmap function creates a false-color image with a dendrogram added to the left side and to the top sides. The order and grouping of the dendrogram were performed by the default function hclust, which uses the Ward error sum of squares hierarchical clustering (ward.D2) as the agglomerative default method. At each stage, distances between the clusters are recomputed by the Lance–Williams dissimilarity update formula according to the clustering Ward’s method which aims at finding compact spherical clusters. Cluster analyses are common tools to analyze and group data points into classes of similar points based on a series of variables.
Results
Remote sensing for catchment monitoring
At the sub-catchment scale, correlations between EVI, SAVI, and MSAVI indices were strong for the three sub-catchments, reaching up to 0.99 (Table 2). The NDVI and NDMI were also highly correlated in all sub-catchments ranging from 0.81–0.87. However, correlations among the first group of indices (EVI, SAVI, and MSAVI) and the NDMI and NDVI varied from maxima of 0.78 and 0.74 in SBC2 to minima in SBC3 of 0.44 and 0.34 for NDMI and NDVI, respectively. In terms of LU, the highest correlations between the different indices were for CF, followed by MF and RB, while the lowest correlations were for PI (Table 3).
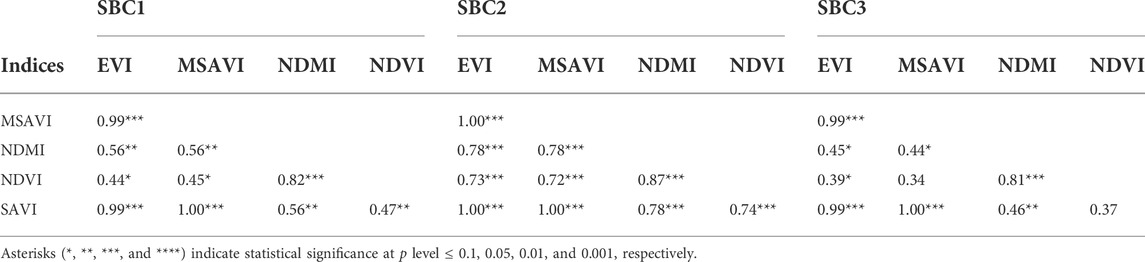
TABLE 2. Pearson correlation coefficients between the normalized difference vegetation index (NDVI), normalized difference moisture index (NDMI), enhanced vegetation index (EVI), soil-adjusted vegetation index (SAVI), and modified soil-adjusted vegetation index (MSAVI) of the study sub-catchments SBC1, SBC2, and SBC3.
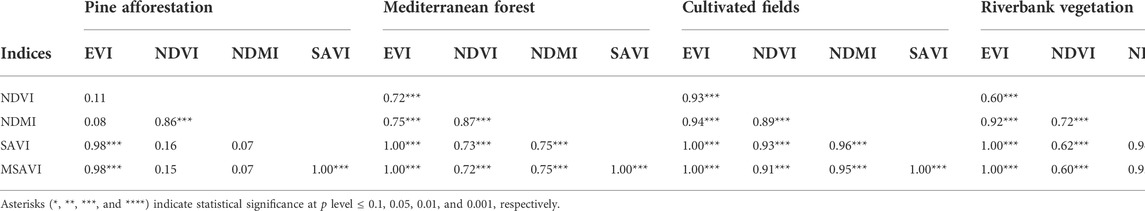
TABLE 3. Pearson correlation coefficients between the normalized difference vegetation index (NDVI), normalized difference moisture index (NDMI), enhanced vegetation index (EVI), soil-adjusted vegetation index (SAVI), and modified soil-adjusted vegetation index (MSAVI) for different land uses.
The linear trends of the average index values for each survey date showed similar patterns in SBC1 and SBC2. A slightly different behavior was observed in SBC3 (Figure 2) that was further evidenced by the cluster analysis, which grouped both SBC1 and SBC2 together (Figure 3). The differences are mainly influenced by the higher percentage of cropland area in SBC3 and pine afforestation in SBC1, while SBC2 can be considered an intermediate state.
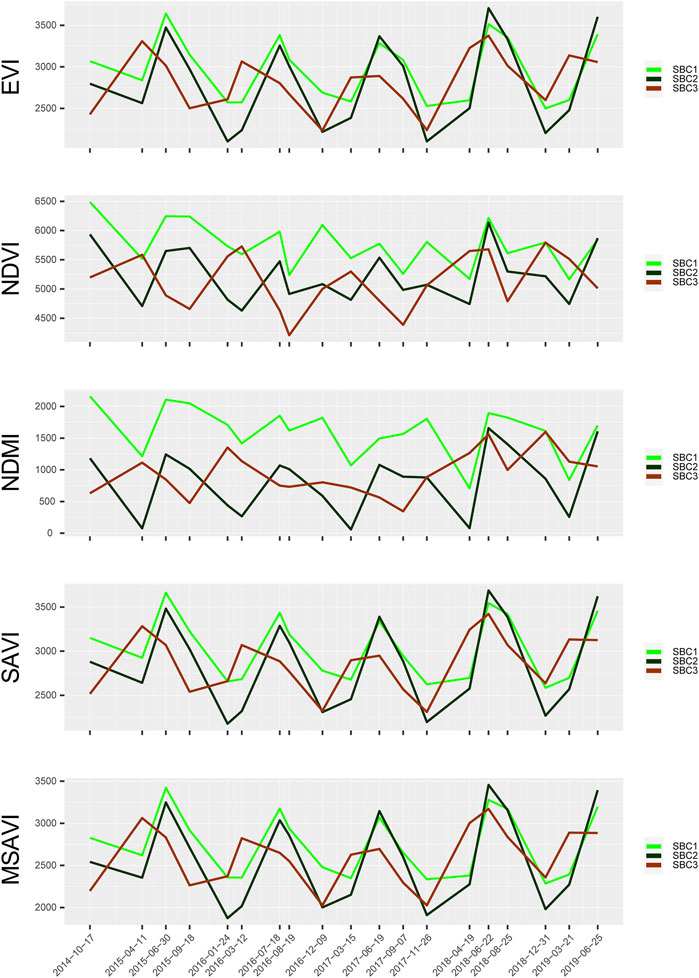
FIGURE 2. Enhanced vegetation index (EVI), normalized difference vegetation index (NDVI), normalized difference moisture index (NDMI), soil-adjusted vegetation index (SAVI), and modified soil-adjusted vegetation index (MSAVI) mean values from Landsat 8-OLI for the 19 sampling campaigns divided by the three studied sub-catchments (SBC1, SBC2, and SBC3).
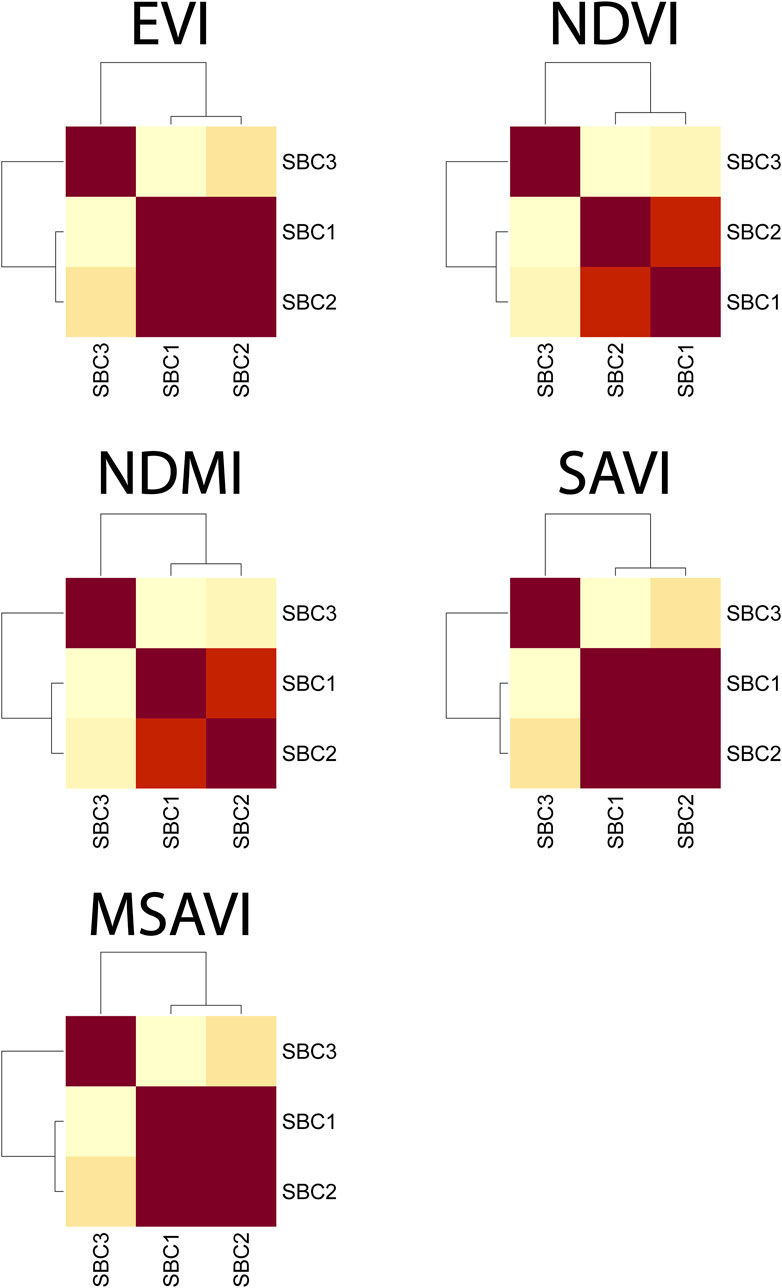
FIGURE 3. Cluster analysis of the three sub-catchments (SBC1, SBC2, and SBC3) for the enhanced vegetation index (EVI), normalized difference vegetation index (NDVI), normalized difference moisture index (NDMI), soil-adjusted vegetation index (SAVI), and modified soil-adjusted vegetation index (MSAVI) Landsat 8-OLI indices.
Overall, the average values for the NDVI, EVI, MSAVI, SAVI, and NDWI indices for the three sub-catchments were mainly dominated by the agricultural and deciduous forest cycle, with a minimum at the end of summer and a maximum during spring for most croplands, while the MF had its minimum during winter and its maximum during summer as shown in Figure 2. However, a slightly different behavior was seen in SBC3 in contrast with SBC1 and SBC2.
A similar analysis by land uses revealed such differences in more detail (Figures 4A–C); while the SBC3 signal was dominated by the cropland rotation and the different crop stages with only small patches of pine afforestation and a Mediterranean forest composed of a mix of scrubland and deciduous trees, SBC2 was dominated by well-developed deciduous and pine forests with patches of cropland. However, in SBC1, mature and dense pine afforestation predominated. Thus, signals were led by croplands in SBC3, deciduous forests in SBC2, and pine afforestation in SBC1. In addition, the riverbank vegetation with abundant deciduous species displayed similar trends in all three sub-catchments, with sharp increasing–decreasing cycles from December to June and more stable values between July and November (Figures 4A–C). The growth peaks of the RB cover exhibited sharper cycles in SBC3, less defined in SBC2, and lesser in SBC1 due to the wider channel of the main stream in SBC3 and the narrower ones at the headwater’s catchments.
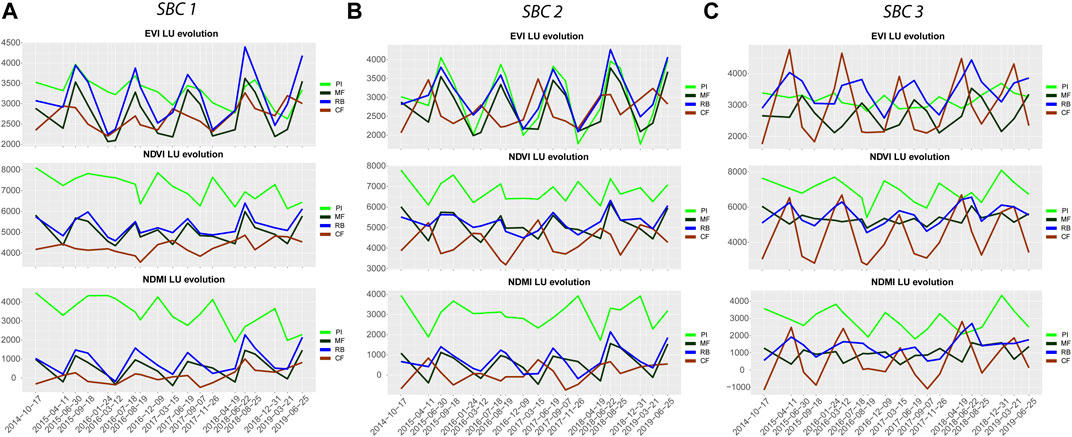
FIGURE 4. Enhanced vegetation index (EVI), normalized difference vegetation index (NDVI), normalized difference moisture index (NDMI), soil-adjusted vegetation index (SAVI), and modified soil-adjusted vegetation index (MSAVI) mean values from Landsat 8-OLI for the 19 sampling campaigns divided by the three studied sub-catchments((A)-SBC1, (B)-SBC2, and (C)-SBC3) and for the different land uses, agricultural (AG), Mediterranean forest (MF), pine afforestation (PI), and riverbank vegetation (RB).
Regarding the differences between the computed indices, different behavior was observed in the three sub-catchments. For example, SBC3 NDVI and NDMI indices displayed more defined patterns than EVI, MSAVI, and SAVI, while the same indices showed less efficiency and more erratic trends in SBC2 and SBC1. However, EVI, MSAVI, and SAVI indices displayed well-defined trends for the headwater sub-catchments for all land uses.
Our results suggest that the NDVI index is more sensitive to small changes in land cover and vegetation, at least for CF, such as the first growth stages of croplands. This can be observed in Figures 4A–C, where the NDVI reflects an increase for the last months of the year (November–December) when wheat and barley were at their first growth stages (especially in SBC3 where cropland dominates), as can be seen between the images collected from 19/08/2016 to 09/12/2016 and 07/09/2019 to 26/11/2017 (Figure 4C). In addition, the NDMI index also detected some of these changes, while EVI, MSAVI, and SAVI indices did not reflect such increases for most images. Interestingly, despite detecting these small variations, the NDVI tended to increase rapidly and sharply even in response to the small vegetation found at these early growth stages. Similar but less significant assumptions can be raised about the small (17 ha) pine forest in SBC3. While the NDMI index showed the expected pattern of the pine cycle, EVI, SAVI, and MSAVI indices, despite showing similar patterns, did not reflect such a sharp cycle as could be expected compared to SBC1 and SBC2.
On the contrary, when analyzing MF or PI land uses located in more hilly areas and with higher surface area (SBC1 and SBC2), the NDVI and NDMI indices were likely more affected by external factors such as topography, different sensing period, and most likely, saturation. Thus, instead of following the evergreen or deciduous forest cycle, the NDVI and NDMI presented values slightly different from the expected pattern of deciduous Mediterranean forests. However, the rest of the indices (EVI, SAVI, and MSAVI) followed the same expected pattern for these vegetation types. The absence of this pattern for the NDVI was particularly marked in SBC3, where MF is dominated by patches of younger forest or scrubland contrary to the well-developed forest found in most parts of the upper sub-catchments.
Furthermore, another interesting result from the remote sensing images was that the PI afforestation in SBC1 exhibited a generalized decreasing trend in the study period, which is likely related to thinning works.
Due to the high temporal and spatial resolution of planet images (Planet Team, 2017), it was possible to detect and monitor the clearcutting of the pine forest. As shown in Figure 4A, none of the indices had been significantly influenced by these changes produced in SBC1, where most pine forests are located. Clearcutting works are usually carried out progressively but separated in time, during medium to short periods (1–3 months), advancing to the next area after finishing the previous one. Thus, analyzing the mean values of the entire pine forest instead of these specific areas likely produces a homogenization effect in the index patterns that blur the possible side effect. For this reason, it was decided to target the known clear-cut areas individually during these specific periods to see which indices performed better in detecting the clearcutting effects on the vegetation. We selected three areas that underwent strip clearcut following geometrical thinning, two of them during spring and one during autumn. For one of the areas, three Landsat 8 free cloud images were available: 1) before clearcutting, 2) during thinning, and 3) once it was finished. However, only images from before and after the thinning were available for the other two areas.
By analyzing the raster image differences between thinning stages (Figure 5) and the median values from the different indices at the three experimental setups (Figure 6), the NDVI and NDMI underwent a marked decrease, contrary to EVI, SAVI, and MSAVI, which displayed small increases. This pattern was especially significant in the South and oldest forest in SBC1, where EVI, SAVI, and MSAVI increased from pre-thinning to post-thinning works. Turning now to the NE thinning setup, an extra middle-stage analysis was possible due to the availability of three Landsat images (pre-, during, and post-). In this setup, the NDMI index displayed a decreasing trend with similar decreases for the three time periods (pre-, during, and post-). On the other hand, NDVI, SAVI, and MSAVI values sharply decreased between pre-thinning and during thinning works while slightly increasing in the post-thinning stage. Surprisingly, the EVI presented a different pattern with a small increase from the pre-thinning stage to the middle stage, followed by a small decrease afterward.
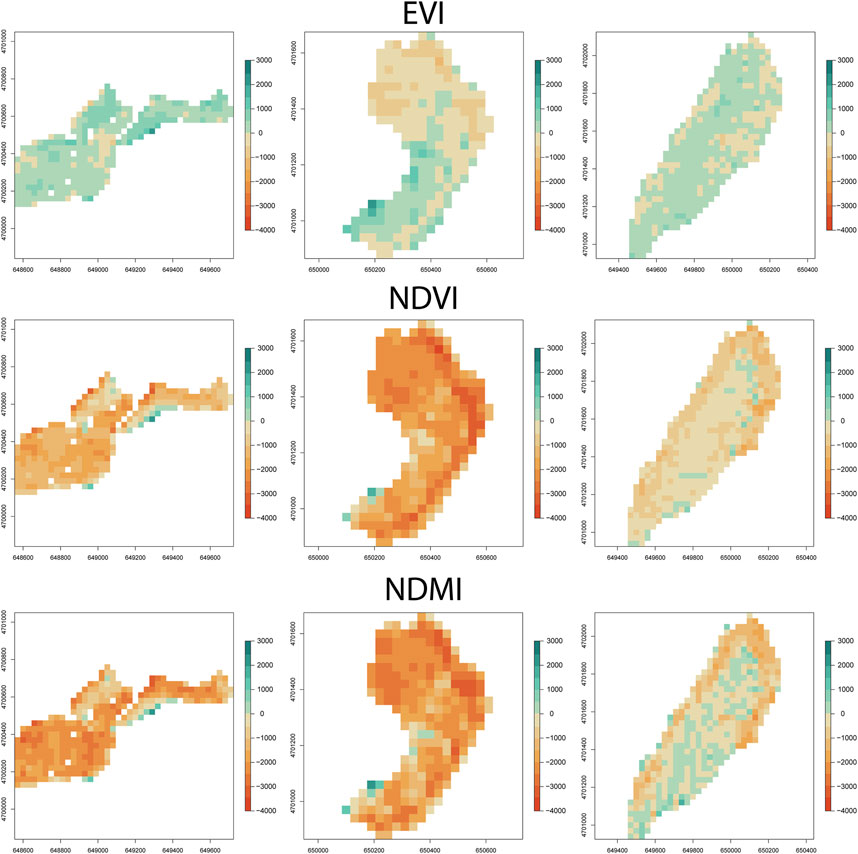
FIGURE 5. Vegetation recovery analysis for the enhanced vegetation index (EVI), normalized difference vegetation index (NDVI), normalized difference moisture index (NDMI), soil-adjusted vegetation index (SAVI), and modified soil-adjusted vegetation index (MSAVI) calculated by the difference between the index values pre and post the thinning labors.
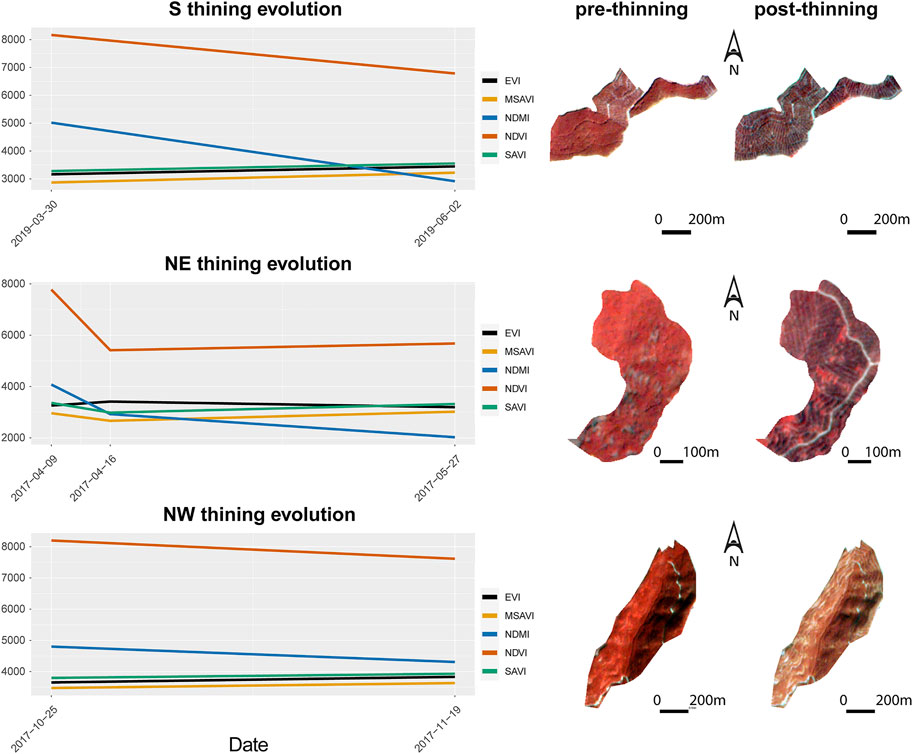
FIGURE 6. Enhanced vegetation index (EVI), normalized difference vegetation index (NDVI), normalized difference moisture index (NDMI), soil-adjusted vegetation index (SAVI), and modified soil-adjusted vegetation index (MSAVI) value tendencies pre- and post-thinning labors. False-color HR satellite images (Planet, 2017) collected close to the Landsat-OLI collection images to visualize the canopy cover variation.
Catchment behavior and sediment export
The statistics of particle size and collected mass (Table 4) show that the samples collected at the sub-catchment outlets had similar contents of clay (<2 μm), silt (2–50 μm), and very fine sand (50–63 μm), with mean values between 20.5–23.8%, 67.1–71.1%, and 8.3–10.4%, respectively. SBC1 and SBC2 presented higher correlations between clay and silt fractions and the collected mass than SBC3 (Table 5). In addition, SBC1 had higher clay contents, while silt contents were generally higher in SBC3. Regarding the collected mass, a significant difference was found between the three sub-catchments with the highest amounts collected in SBC3. Looking at the trends (Figure 7), it appears that the three sub-catchments exhibited homogenous export rates except during heavy storm events when the collected mass doubled or tripled.
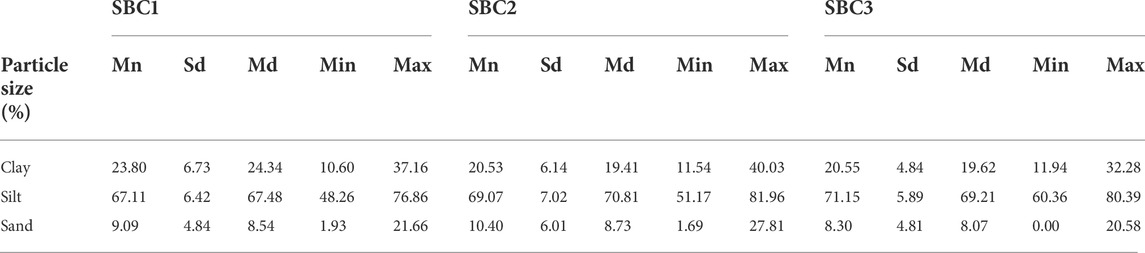
TABLE 4. Basic statistics for the particle size for the three different sub-catchments (SBC1, SBC2, and SBC3).
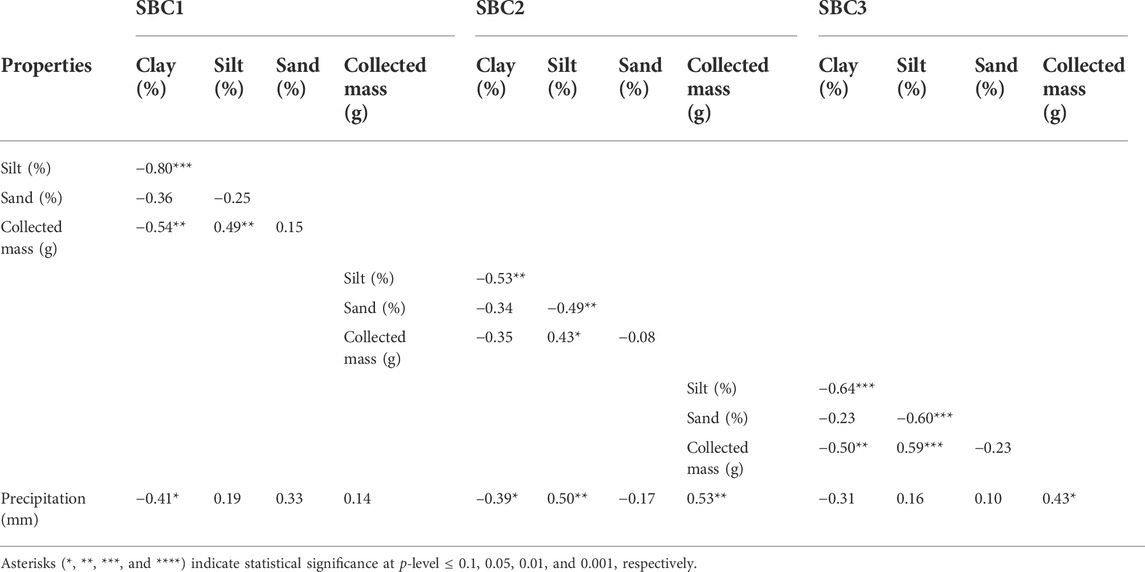
TABLE 5. Pearson correlation coefficients between particle size, collected mass, and precipitation for the three sub-catchments (SBC1, SBC2, and SBC3).
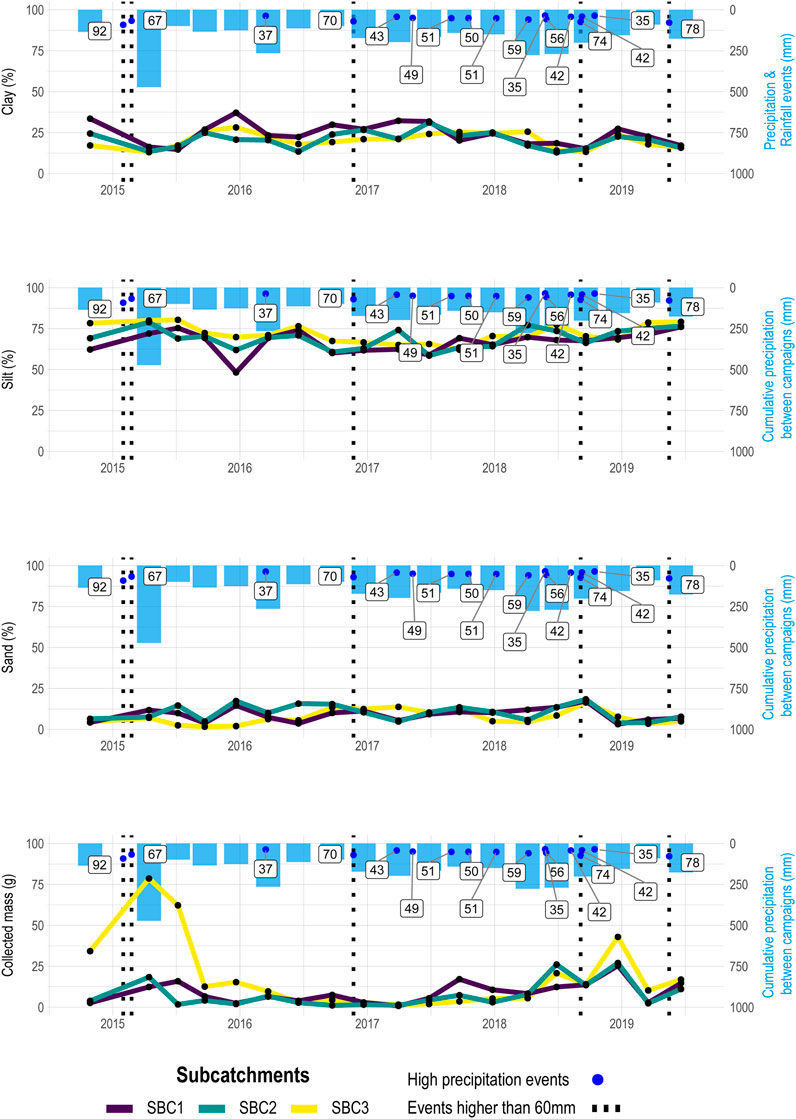
FIGURE 7. Temporal trends of the mean/median values of the different particle sizes, clay, silt, and sand and the collected mass in the three sub-catchments (SBC1, SBC2, and SBC3). Vertical black dashed lines highlight rainfall events higher than 60 mm. Blue dots represent high rainfall events with the labels of mm of rainfall.
Regarding particle size behavior, an inverse correlation was found between clay and precipitation for the three sub-catchments with statistical significance for SBC1 and SBC2. Silt displayed a positive correlation for all sub-catchments being significant only in SBC2, while sand exhibited different correlation patterns with precipitation but was not significant (Table 5). As expected, the three sub-catchments presented positive correlations between precipitation and collected mass, being significant for SBC2 and SBC3.
Regarding remote sensing imagery, all indices and CF values were significantly correlated with clay, silt, and sand for SBC2 and clay and silt for SBC1 except for the NDVI index, but correlations were not significant in SBC3 (Supplementary Tables S1–S5). All three sub-catchments presented correlations between clay percentage and the riverbank (RB) values for the five indices and negative and significant correlations for the EVI, SAVI, and MSAVI (Supplementary Tables S1–S5).
From these results, it is not well-defined which are the major conditioning factors for the differences found in particle size exports and the collected mass. Hence, we analyzed high-intensity rainfall events during the study period to further assess the possible influence of the other main factors. The temporal trends of particle size, precipitation, and collected mass evidenced the effect of heavy precipitation events that occurred on 31/01/2015 and 24/02/2015. The effect of heavy precipitation events is additionally reflected after the middle of 2017 when an increase in rainfalls was recorded, modifying the patterns of short- and long-term particle size export. The clay and silt contents were certainly affected by these events, but the sand fraction was only significantly influenced by two consecutive high rainfall events in the summer of 2018.
Regarding the long-term effect, since mid-2017, an increasing trend in the exported silt was observed in the three sub-catchments (Figure 7). Interestingly, this increase in particle size was not significantly paralleled by the total amount of precipitation. However, a small gap in the trends of increasing mass and silt exported was detected in the summer of 2018 when a sudden increase in the sand export was found though it sharply decreased after this campaign. This was likely produced by two heavy precipitation events, one on 05/09/2018 with 68.4 L in 4 h 15 min and the second one on 07/09/2018 with 30.6 L in only 30 min. However, despite these two high-intensity rainfalls, the collected mass decreased sharply compared with the pre- and post-campaigns in SBC2 and SBC3. The referred events modified the channel’s morphology and flushed out one of the three samplers in SBC3 (Figure 8). As mentioned previously, mass measurement is only a relative indicator of changes in the transported suspended sediment. These types of collectors were not engineered specifically as sediment traps, and they could have been blocked by debris or turbulences in such flash flood events. However, despite the decrease in the total precipitation and the near absence of heavy precipitations after this campaign, the three sub-catchments exhibited a sharp increase in the collected mass. This mass increase was characterized by an increment in the clay percentage, the reappearance of the increasing trend of the silt fraction, and a sand content decrease.
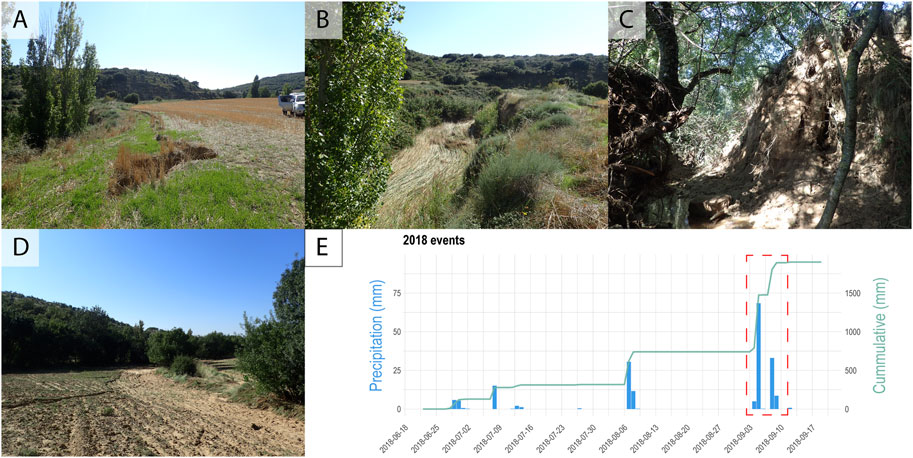
FIGURE 8. (A–D) Images showing the impacts on the study area after the two heavy precipitation events of September 2018. (E) Historical intraday data of summer 2018, highlighted with a red-dashed line square, the two heavy precipitation events occurred between 05/09/2018 with 68.4 l and 07/09/2018 with 30.6 l.
Discussion
Remote sensing for tracking the role of natural and human-induced processes in landscape evolution
Despite the high correlations between the indices of vegetation status in CF and RB and particle size, our results indicate that rainfall is the main controlling factor that governs the differences in particle size and collected mass. As expected, in Figure 7, heavy precipitation events dominate the largest variations from the general trend in terms of particle size and collected mass. As highlighted by previous studies, exceptional rainfall and high rainfall events increased the connectivity and suspended sediment loads, modifying the characteristics of the streambed sediments by decreasing or increasing the concentration of different-sized particles during floods (Lizaga et al., 2019b; Ramos et al., 2022). Their effect is evidenced in this study by the silt’s increasing trend due to the increase of individual heavy precipitations from 2017 onward despite the total precipitation amount not increasing. Furthermore, the increase of individual rainfall events is also correlated with the exported mass, supporting the hypothesis of an increase in sediment export due to these intense events.
Regarding the collected mass, its positive and significant correlation with rainfall confirms the impact of these events. However, the sharp decrease in the collected mass during the summer of 2018 evidenced that issues may arise with flash floods. The recorded rainfall data from the tipping gauge, visual evidence (Figure 8), and the sharp increase in the sand fraction indicate high exported mass during the summer of 2018. In agreement with our observations, previous studies dealing with heavy precipitation events in the area record a sharp sand fraction increase after these events and a decrease in both silt and clay fractions (Lizaga et al., 2019b). Therefore, when dealing with flash floods due to heavy and localized rainstorms, errors may arise in the mass collected with integrated samplers.
With this in mind, there is evidence that localized events increase the sediment export in the short-term as well as the available eroded sediment storage, but the exported mass increases after these events in winter 2015 and autumn 2019 despite the intense rainfall decrease. In addition, high export is observed together with increases in clay and silt fractions, pointing to the transport of more erodible available sediment from previous events (Aguilar et al., 2020).
Following previous research on this subject, our results agree with the possible saturation of the NDVI in more dense vegetation canopy areas, which may lead to an underestimation of ecosystem productivity (Hobbs, 1995; Gu et al., 2013) compared with indices such as the EVI. In addition, the NDVI and NDMI appear to be more erratic when dealing with the less-developed Mediterranean forest existing in SBC3.
Some of the analyzed indices were developed to improve vegetation monitoring in certain conditions. For example, the EVI corrects for some atmospheric conditions and canopy background noise and is more sensitive in areas with dense vegetation (Vermote et al., 2016). The SAVI is used to correct the normalized difference vegetation index (NDVI) for the influence of soil brightness in areas where vegetative cover is low (Vermote et al., 2016). However, results from this study indicate higher sensitivity of the NDVI and NDMI to small vegetation changes such as the first growth stages of croplands than EVI, SAVI, and MSAVI that follow the same pattern. On the other hand, the NDVI’s higher sensitivity tends to blur general trends such as the natural increase–decrease vegetation cycle of the MF in SBC3.
On the contrary, results from the small setups (Figure 6) established to analyze the detection capacity of clearcutting corroborate higher sensitivity of the NDVI and NDMI to detect thinning between images. Despite higher or lower sensitivity of the different indices to thinning, all of them detect the decreasing trend in pine forests in SBC1 likely linked to clearcutting but also influenced by plagues of the pine caterpillar. However, the decreasing pattern is slightly more challenging to visualize in the NDVI. Similar research dealing with plant recovery, particularly for sparsely vegetated and arid areas, suggests using the MSAVI and NDMI as the optimal indices for this monitoring task (Aljahdali et al., 2021). However, a similar study focused on detecting the different stages and the plant height by Payero et al. (2004) also found benefits and drawbacks for the NDVI. The authors highlighted that the NDVI became insensitive when alfalfa reached heights of 0.45 m, while for grass, the NDVI displayed a reasonably good linear relationship with plant height.
Based on these results, it can be suggested that different subjects and areas could benefit from using different indices or combined for use to analyze specific and general patterns of vegetation status.
Addressing the sediment export complexity in Mediterranean catchments
Rainfall and vegetation cover mainly produce differences in the exported particle size over the three sub-catchments. These results are particularly evident for the rainfall in the strong positive and significant correlations despite the possible data bias introduced by combining two rainfall datasets. However, regarding the vegetation cover effect, much more complex processes related to cover changes, such as tillage or thinning, are linked to changes in the exported sediment. Thus, although some significant correlations are observed between the vegetation status and the variations in the exported particle size, this factor interplays with others, such as different types of tillage, clearcutting, and the traffic with machinery on pathways crossing the streams that are mainly used during specific periods of the year such as during fertilizing and harvest seasons, creating a more complex setting (Lang et al., 2015; Nolan et al., 2015; Boggs et al., 2018; Ryken et al., 2018).
In addition, the homogenous particle size distribution in the catchment soils, the vegetation buffer strips, and the fact that most agricultural areas are located on less steep areas likely prevent high incomes from cultivated fields compared to those produced by stream banks. This was the case especially during exceptional events, as found in this catchment by Lizaga et al. (2019a) and Gaspar et al. (2019). For this reason, a significant correlation between low values in vegetation indices, particle size, and collected mass could be challenging to obtain due to the aforementioned catchment’s complexity.
Overall, two main areas can be identified at the catchment scale by the slope, drainage system, and vegetation contrast, as explained in the study area section. On the one hand, PI afforestation and thinning processes in SBC1 increase its complexity and likely influence the lower correlations between precipitation, mass, and remote sensing values. In addition, some of the abandoned crops are plowed one year and abandoned the next, likely producing changes in the mean values of the vegetation indices but an unknown effect on the short-term sediment export, though probably also affecting the correlations between the indices values and particle size in SBC1. On the other hand, SBC2 evidences fewer human impacts or more extended periods of abandonment, being the only one with a significant correlation between clay and silt and precipitation. Additionally, a significant correlation was found between the CF indices and all the different particle sizes with the collected mass and precipitation. However, higher connectivity due to the steep slopes and the presence of only one main stream cannot be totally discarded as a factor influencing these higher correlations.
The significant and inverse correlation of clay with the collected mass and precipitation for all sub-catchments and the positive correlation with the silt fraction evidence a higher sediment export and the transport of coarser fractions during rainfall events in agreement with previous studies (Walling et al., 2000; Gallart et al., 2013).
On the other hand, the significant correlations between the CF index data and the particle size only in SBC1 and SBC2, contrary to the more complex SBC3, confirm the higher connectivity in the upper part and the less complex behavior in terms of sediment transport. Thus, higher values in the phenological status of croplands likely influence a reduction in the clay export with a subsequent increase in silt which displays inverse and positive correlations with rainfall, respectively. Despite acknowledging that the positive correlation with precipitation likely influences these positive correlations, the non-significant correlation of CF values with the precipitation in SBC1 and the absence of correlation in SBC3 between particle size and the CF indices support the hypothesis of the silt export reduction due to the crop cover protection.
Conclusion
Our findings highlight the significant effect of heavy rainfall events and the vegetation status or vegetation cover on the particle size of the exported sediment. However, this research evidences the existence of additional and multifaceted factors influencing the sediment export dynamic in this Mediterranean mountain agro-ecosystem. These processes are likely related to human intervention in the natural dynamic of the catchment, such as tillage, clearcutting, and pathways crossing the streams during specific periods of the year.
This research evaluated and demonstrated the significant effect of selecting one or other vegetation index depending on the study topic, vegetation, and the study area’s size. It is shown that indices such as the NDVI and the NDMI help in the detection of small changes in vegetation cover, while the EVI, SAVI, and MSAVI are more robust for detecting general patterns and preventing the appearance of artefacts in the data, creating a trade-off between accuracy and precision. Taken together, our findings suggest the need for using more than one index for understanding complex environments and recommend the use of the NDVI or NDMI for small change detection and the EVI, SAVI or MSAVI for analyzing general patterns. Yet, future studies with higher temporal resolution on the current topic would be required to verify our results.
Despite the complexity of the study catchment, our results confirm and support the utility of remote sensing and seasonal suspended sediment collection for analyzing the effect of human and natural processes in mountain agro-ecosystems. An advantage of this method is that it is possible to obtain data without continuous sampling for ungauged catchments, in addition to the free availability of remote sensing images and the low cost of particle size analysis. However, the apparent lack of correlations during some periods and land covers evidence the difficulty of applying these combined approaches in complex agro-ecosystems. For this reason, future studies might benefit from targeting simpler catchments with higher resolution in terms of sampling and image collection to confirm our results and further explore the intricate processes affecting sediment export dynamics.
Data availability statement
The raw data supporting the conclusion of this article will be made available by the authors, without undue reservation.
Author contributions
IL contributed to the conceptualization, writing—original draft, writing—review and editing, software, data curation, methodology, formal analysis, investigation, and resources. BL contributed to the writing—review and editing, supervision, and methodology. LG contributed to the data curation and writing—review and editing. MR contributed to the writing—review and editing. AN contributed to the conceptualization, writing—review and editing, supervision, project administration, and funding acquisition.
Funding
This research is part of the Project I+D+i PID 2019-104857RB-I00, funded by the MCIN/AEI/10.13039/501100011033/. This work represents a contribution to CSIC Interdisciplinary Thematic Platform (PTI) Teledetección (PTI-TELEDETECT). The contribution of IL was partially supported by the Research Foundation-Flanders (FWO, mandate 12V8622N).
Conflict of interest
The authors declare that the research was conducted in the absence of any commercial or financial relationships that could be construed as a potential conflict of interest.
Publisher’s note
All claims expressed in this article are solely those of the authors and do not necessarily represent those of their affiliated organizations, or those of the publisher, the editors, and the reviewers. Any product that may be evaluated in this article, or claim that may be made by its manufacturer, is not guaranteed or endorsed by the publisher.
Supplementary material
The Supplementary Material for this article can be found online at: https://www.frontiersin.org/articles/10.3389/feart.2022.923447/full#supplementary-material
References
Aguilar, G., Cabré, A., Fredes, V., and Villela, B. (2020). Erosion after an extreme storm event in an arid fluvial system of the southern atacama desert: An assessment of the magnitude, return time, and conditioning factors of erosion and debris flow generation. Nat. Hazards Earth Syst. Sci. 20, 1247–1265. doi:10.5194/nhess-20-1247-2020
Aljahdali, M. O., Munawar, S., and Khan, W. R. (2021). Monitoring mangrove forest degradation and regeneration: Landsat time series analysis of moisture and vegetation indices at rabigh lagoon, red sea. Forests 12, 52. doi:10.3390/f12010052
Anwar, S. A., and Diallo, I. (2021). A RCM investigation of the influence of vegetation status and runoff scheme on the summer gross primary production of Tropical Africa. Theor. Appl. Climatol. 145, 1407–1420. doi:10.1007/s00704-021-03667-0
Boggs, J. L., Sun, G., and McNulty, S. G. (2018). The effects of stream crossings on total suspended sediment in North Carolina piedmont forests. J. For. 116, 13–24. doi:10.5849/jof.2016-059
Borrelli, P., Alewell, C., Alvarez, P., Anache, J. A. A., Baartman, J., Ballabio, C., et al. (2021). Soil erosion modelling: A global review and statistical analysis. Sci. Total Environ. 780, 146494. doi:10.1016/j.scitotenv.2021.146494
Brigatti, M. F., Galán, E., and Theng, B. K. G. (2013). “Chapter 2 - structure and mineralogy of clay minerals,” in Developments in clay science, handbook of clay science. Editors F. Bergaya, and G. Lagaly (Amsterdam, Netherlands: Elsevier), 21–81. doi:10.1016/B978-0-08-098258-8.00002-X
Gallart, F., Pérez-Gallego, N., Latron, J., Catari, G., Martínez-Carreras, N., and Nord, G. (2013). Short- and long-term studies of sediment dynamics in a small humid mountain Mediterranean basin with badlands. Geomorphology, Geomorphology in Spain Special issue in honour of Prof. Mateo Gutiérrez 196, 242–251. doi:10.1016/j.geomorph.2012.05.028
García-Ruiz, J. M., Nadal-Romero, E., Lana-Renault, N., and Beguería, S. (2013). Erosion in Mediterranean landscapes: Changes and future challenges. Geomorphology 198, 20–36. doi:10.1016/j.geomorph.2013.05.023
Gaspar, L., Lizaga, I., Blake, W. H., Latorre, B., Quijano, L., and Navas, A. (2019). Fingerprinting changes in source contribution for evaluating soil response during an exceptional rainfall in Spanish pre-pyrenees. J. Environ. Manage. 240, 136–148. doi:10.1016/j.jenvman.2019.03.109
Ge, Y., Thomasson, J. A., and Sui, R. (2011). Remote sensing of soil properties in precision agriculture: A review. Front. Earth Sci. 5, 229–238. doi:10.1007/s11707-011-0175-0
Grangeon, T., Legout, C., Esteves, M., Gratiot, N., and Navratil, O. (2012). Variability of the particle size of suspended sediment during highly concentrated flood events in a small mountainous catchment. J. Soils Sediments 12, 1549–1558. doi:10.1007/s11368-012-0562-5
Gu, Y., Wylie, B. K., Howard, D. M., Phuyal, K. P., and Ji, L. (2013). NDVI saturation adjustment: A new approach for improving cropland performance estimates in the greater platte river basin, USA. Ecol. Indic. 30, 1–6. doi:10.1016/j.ecolind.2013.01.041
Hobbs, T. J. (1995). The use of NOAA-AVHRR NDVI data to assess herbage production in the arid rangelands of Central Australia. Int. J. Remote Sens. 16, 1289–1302. doi:10.1080/01431169508954477
Instituto Geográfico Nacional (2022). Cursos en linea 2022. Available at: https://www.ign.es/web/ign/portal.
Ito, A., and Wagai, R. (2017). Global distribution of clay-size minerals on land surface for biogeochemical and climatological studies. Sci. Data 4, 170103. doi:10.1038/sdata.2017.103
Lang, A., Aust, W., Bolding, M., Barrett, S., McGuire, K., and Lakel, W. (2015). Streamside management zones compromised by stream crossings, legacy gullies, and over-harvest in the piedmont. J. Am. Water Resour. Assoc. 51, 1153–1164. doi:10.1111/jawr.12292
Liu, S., Qin, T., Lv, X., Shi, X., Dong, B., Wang, J., et al. (2021). Experimental study of runoff and sediment yield affected by ridge direction and width of sloping farmland. Front. Earth Sci. 9. doi:10.3389/feart.2021.694773
Lizaga, I., Gaspar, L., Blake, W. H., Latorre, B., and Navas, A. (2019a). Fingerprinting changes of source apportionments from mixed land uses in stream sediments before and after an exceptional rainstorm event. Geomorphology 341, 216–229. doi:10.1016/j.geomorph.2019.05.015
Lizaga, I., Gaspar, L., Latorre, B., and Navas, A. (2020). Variations in transport of suspended sediment and associated elements induced by rainfall and agricultural cycle in a Mediterranean agroforestry catchment. J. Environ. Manage. 272, 111020. doi:10.1016/j.jenvman.2020.111020
Lizaga, I., Quijano, L., Gaspar, L., and Navas, A. (2018). Estimating soil redistribution patterns with 137Cs measurements in a Mediterranean mountain catchment affected by land abandonment. Land Degrad. Dev. 29, 105–117. doi:10.1002/ldr.2843
Lizaga, I., Quijano, L., Gaspar, L., Ramos, M. C., and Navas, A. (2019b). Linking land use changes to variation in soil properties in a Mediterranean mountain agroecosystem. CATENA 172, 516–527. doi:10.1016/j.catena.2018.09.019
Mariani, L., and Parisi, S. G. (2014). “Extreme rainfalls in the mediterranean area,” in Storminess and environmental change: Climate forcing and responses in the mediterranean region. Editors N. Diodato, and G. Bellocchi (Dordrecht: Springer Netherlands), 17–37. doi:10.1007/978-94-007-7948-8_2
Mateo-Sagasta, J., Zadeh, S. M., Turral, H., and Burke, J. (2017). Water pollution from agriculture: A global review. Executive summary. Colombo, Srilanka: FAO Colombo, Sri Lanka: International Water Management Institute (IWMI). CGIAR Research Program on Water, Land and Ecosystems WLE.
Melland, A. R., Fenton, O., and Jordan, P. (2018). Effects of agricultural land management changes on surface water quality: A review of meso-scale catchment research. Environ. Sci. Policy 84, 19–25. doi:10.1016/j.envsci.2018.02.011
Nadal-Romero, E., Martínez, T. L., González-Hidalgo, J. C., Luis, M., and García-Ruiz, J. M. (2012). The effect of intense rainstorm events on the suspended sediment response under various land uses : The aísa valley experimental station. Cuad. Investig. Geográfica 38, 27–47. doi:10.18172/cig.1274
Navas, A., Quine, T. A., Walling, D. E., Gaspar, L., Quijano, L., and Lizaga, I. (2017). Relating intensity of soil redistribution to land use changes in abandoned Pyrenean fields using fallout caesium-137. Land Degrad. Dev. 28, 2017. doi:10.1002/ldr.2724
Navas, A., Valero Garcés, B., and Machín, J. (2004). Research note:an approach to integrated assessement of reservoir siltation: The joaquín costa reservoir as a case study. Hydrol. Earth Syst. Sci. 8, 1193–1199. doi:10.5194/hess-8-1193-2004
Nolan, L., Aust, W. M., Barrett, S. M., Bolding, M. C., Brown, K., and McGuire, K. (2015). Estimating costs and effectiveness of upgrades in forestry best management practices for stream crossings. Water 7, 6946–6966. doi:10.3390/w7126668
Ongley, E.D (1996). “Control of water pollution from agriculture,” in Fertilizers as water pollutants, Food and Agriculture. Organization of the United Nation, Chap. 3, 55. Available at: https://www.nrc.gov/docs/ML1434/ML14345A539.pdf.
Owens, P. N., Blake, W. H., Gaspar, L., Gateuille, D., Koiter, A. J., Lobb, D. A., et al. (2016). Fingerprinting and tracing the sources of soils and sediments: Earth and ocean science, geoarchaeological, forensic, and human health applications. Earth. Sci. Rev. 162, 1–23. doi:10.1016/j.earscirev.2016.08.012
Owens, P. (2020). Soil erosion and sediment dynamics in the anthropocene: A review of human impacts during a period of rapid global environmental change. J. Soils Sediments 20, 4115–4143. doi:10.1007/s11368-020-02815-9
Payero, O., Neale, J., and Wright, C. (2004). Comparison of eleven vegetation indices for estimating plant height of alfalfa and grass. Appl. Eng. Agric. 20, 385–393. doi:10.13031/2013.16057
Phillips, J. M., Russell, M. A., and Walling, D. E. (2000). Time-integrated sampling of fluvial suspended sediment: A simple methodology for small catchments. Hydrol. Process. 14, 2589–2602. doi:10.1002/1099-1085(20001015)14:14<2589::AID-HYP94>3.0.CO;2-D
R Core Team (2020). R: A language and environment for statistical computing. Vienna, Austria: R Foundation for Statistical Computing. Available at: https://www.R-project.org/.
Ramos, M. C., Lizaga, I., Gaspar, L., and Navas, A. (2022). The impacts of exceptional rainfall on phosphorus mobilisation in a mountain agroforestry catchment (NE, Spain). Catena 216, 106407. doi:10.1016/j.catena.2022.106407
Ryken, N., Vanden Nest, T., Al-Barri, B., Blake, W., Taylor, A., Bodé, S., et al. (2018). Soil erosion rates under different tillage practices in central Belgium: New perspectives from a combined approach of rainfall simulations and 7Be measurements. Soil Tillage Res. 179, 29–37. doi:10.1016/j.still.2018.01.010
Sepuru, T. K., and Dube, T. (2018). An appraisal on the progress of remote sensing applications in soil erosion mapping and monitoring. Remote Sens. Appl. Soc. Environ. 9, 1–9. doi:10.1016/j.rsase.2017.10.005
Serrano-Notivoli, R., Mora, D., Ollero, A., Sánchez-Fabre, M., Sanz, P., and Saz, M. Á. (2017). Floodplain occupation and flooding in the central pyrenees. Cuad. Investig. Geográfica 43, 309–328. doi:10.18172/cig.3057
Sheldrick, B. H., and Wang, C. (1993). “Particle-size distribution,” in Soil sampling and methods of analysis, Canadian society of soil science. Editor M. R. Carter (Ann Arbor, MI: Lewis Publishers), 499–511.
Sirisena, T. A., Maskey, S., Bamunawala, J., and Ranasinghe, R. (2021). Climate change and reservoir impacts on 21st-century streamflow and fluvial sediment loads in the irrawaddy river, Myanmar. Front. Earth Sci. 9. doi:10.3389/feart.2021.644527
Sukumaran, P., Sant, D. A., Krishnan, K., Rangarajan, G., Basavaiah, N., and Schwenninger, J.-L. (2021). Multi-proxy records of late holocene flood events from the lower reaches of the narmada river, western India. Front. Earth Sci. 9. doi:10.3389/feart.2021.634354
Vermote, E., Justice, C., Claverie, M., and Franch, B. (2016). Preliminary analysis of the performance of the Landsat 8/OLI land surface reflectance product. Remote Sens. Environ. 185, 46–56. doi:10.1016/j.rse.2016.04.008
Vrieling, A. (2006). Satellite remote sensing for water erosion assessment: A review. CATENA 65, 2–18. doi:10.1016/j.catena.2005.10.005
Walling, D. E., Owens, P. N., Waterfall, B. D., Leeks, G. J. L., and Wass, P. D. (2000). The particle size characteristics of fluvial suspended sediment in the Humber and Tweed catchments, UK. Sci. Total Environ. 251–252, 205–222. doi:10.1016/S0048-9697(00)00384-3
Wang, J., Ding, J., Yu, D., Ma, X., Zhang, Z., Ge, X., et al. (2019). Capability of Sentinel-2 MSI data for monitoring and mapping of soil salinity in dry and wet seasons in the Ebinur Lake region, Xinjiang, China. Geoderma 353, 172–187. doi:10.1016/j.geoderma.2019.06.040
Wu, K., Shi, X., Lou, Z., Wu, B., Li, J., Zhang, H., et al. (2021). Sedimentary responses to climate changes and human activities over the past 7400 Years in the western sunda shelf. Front. Earth Sci. 9, 631815. doi:10.3389/feart.2021.631815
Keywords: particle size, remote sensing, vegetation indices, suspended sediment collectors, heavy rainfall events
Citation: Lizaga I, Latorre B, Gaspar L, Ramos MC and Navas A (2022) Remote sensing for monitoring the impacts of agroforestry practices and precipitation changes in particle size export trends. Front. Earth Sci. 10:923447. doi: 10.3389/feart.2022.923447
Received: 19 April 2022; Accepted: 15 September 2022;
Published: 19 October 2022.
Edited by:
Ioannis N. Daliakopoulos, Technological Educational Institute of Crete, GreeceReviewed by:
Jesús Rodrigo-Comino, University of Granada, SpainShuci Liu, Nanjing University of Information Science and Technology, China
Copyright © 2022 Lizaga, Latorre, Gaspar, Ramos and Navas. This is an open-access article distributed under the terms of the Creative Commons Attribution License (CC BY). The use, distribution or reproduction in other forums is permitted, provided the original author(s) and the copyright owner(s) are credited and that the original publication in this journal is cited, in accordance with accepted academic practice. No use, distribution or reproduction is permitted which does not comply with these terms.
*Correspondence: Ivan Lizaga, aXZhbi5saXphZ2FAdWdlbnQuYmU=, bGl6YWdhLml2YW4xMEBnbWFpbC5jb20=