 Paolo Papale
 Deepak Garg
 Warner Marzocchi
- 1Istituto Nazionale di Geofisica e Vulcanologia, Sezione di Pisa, Pisa, Italy
- 2Dipartimento di Scienze della Terra, Dell'Ambiente e delle Risorse, Università di Napoli Federico II, Napoli, Italy
Knowledge of the global rates of volcanism is fundamental for modeling the Earth, as those rates closely relate to plate tectonics, crustal growth, mantle dynamics, atmospheric evolution, climate change, and virtually any aspect of the global Earth dynamics. In spite of their huge relevance, the global rates of volcanism have remained unknown, hidden within data that appeared disordered, largely fragmented and incomplete, reflecting poor preservation of small eruptions in the geological record, rareness of large eruptions, and distributions far from normal. Here we describe and validate a model that reproduces global volcanism to high statistical significance, and that is so simple to comfortably fit on a t-shirt. We use the model to compute the expected rates of global terrestrial volcanism over time windows from 1 to 100,000 years, and validate it by comparing with observations back to a few million years. Notably, the model can be tested against independent observations collected in the near future, a feature which is relatively uncommon among global models of Solid Earth dynamics.
Introduction
The global rates of volcanism, or the rates at which magma is transferred from the Earth interior to the surface, represent one fundamental aspect of the dynamics of our planet. In fact, those rates relate to some of the most relevant large scale geophysical processes on Earth, such as mantle dynamics (Huang et al., 1997), Earth crust formation (Ito and Clift, 1998), plate tectonics (Xu et al., 2009), and climate change (Robock, 2000). Quantitative estimates of the rate of volcanism are made difficult by the apparently disordered occurrence of volcanic eruptions, as it emerges from observations and field reconstructions at the basis of volcanic databases. In fact, volcanic eruptions appear on Earth at times and with scale and violence which have largely escaped any attempts of parameterization or understanding. Global subaerial volcanic eruption databases such as the Smithsonian GVP (Global Volcanism Program, 2013: https://volcano.si.edu) and LaMEVE (Crosweller et al., 2012: www.bgs.ac.uk/vogripa) are major data sources to understand and model volcanic activity on Earth. However, the information they bring is highly heterogeneous as a consequence of the enormous differences in the frequency and potential for geological preservation of eruptions spanning from highly frequent, small effusions to rare, globally impacting catastrophic events (Crosweller et al., 2012; Brown et al., 2014; Kiyosugi et al., 2015).
Discovering that over the global scale, eruption inter-event times are exponentially distributed (Papale 2018), or equivalently, that global volcanic eruptions are Poisson distributed, allowed a robust definition of catalogue completeness for each eruption magnitude in terms of VEI (Volcanic Explosivity Index, Newhall and Self, 1982). The exponential distribution of eruption inter-event times helps understand the difficulties in obtaining a global picture from the dataset. In fact, the exponential distribution is the maximum entropy probability distribution for a random variate (with the random variate being greater than zero and over a given range of variability). The implication is that the occurrence of volcanic eruptions appears as much disordered as it could be. When summed up with effective holes and gaps in the record, and with size-dependent deterioration of the information with age, the distribution appears as a messy sequence of data where variably long periods with high eruption rate alternate without any apparent order to periods with low or very low rate, and to more or less long periods of stasis (Figure 1). That apparent disorder turned into high order once the exponential distribution of return times was recognized, also providing the theoretical basis for a global assessment of volcanic hazard (Papale and Marzocchi, 2019).
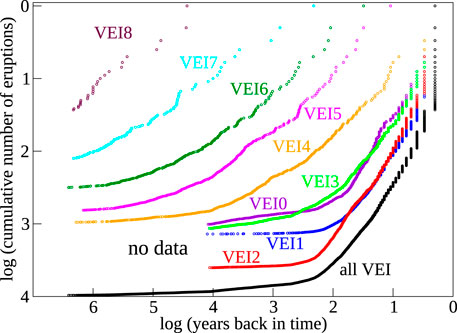
FIGURE 1. Observed cumulative number of eruptions vs. time, for all eruptions (black) and for different VEI classes (colors). VEI 0–3 eruptions are reported in the Smithsonian GVP database which refers to only the Holocene. The time resolution for this plot is 1 year, and time 0 is taken at year 2022 CE. Slope decrease when moving back in time, larger for lower VEI eruptions, reflects loss of preservation in the geological record with increasing eruption age. Complex distributions are visible for the large VEI eruptions, where periods with largely variable rate alternating to variably long periods of stasis emerge. Those distributions are entirely similar to the ones from lower VEI eruptions (or from all eruptions together), although less or not visible at the scale and resolution of this plot.
While volcanic eruptions appear on Earth at times reflecting an underlying Poisson distribution, their size distributes as a power law over a large portion of its spectrum (Papale et al., 2021). Small eruptions with volume less than order 102 Mm3, and giant eruption above 103 km3, depart from the power law, with the former depicting a log-normal distribution, and the latter displaying a more rapid fall in their frequency than for a power law, as for so-called tapered power law distributions (e.g., Kagan and Schoenberg, 2001; Vere-Jones et al., 2001; Geist and Parsons, 2014).
The above describes the global time-size distribution of volcanic eruptions on Earth. The mathematical counterpart is comparably simple (Papale, 2018; Papale et al., 2021):
In Eqs 1–3,
In the following we show that such a remarkable simplicity embeds the globally observed time-size distribution of subaerial volcanism on Earth, including the complexities introduced above (and partly visible from Figure 1): variably long intervals with average eruption rates significantly above or beyond the long-term average, irregularly alternating and separated by randomly distributed inactive periods with apparently random length. The time-size distribution appears even more disordered, with increasingly large eruptions emerging here and there without any apparent regularity, up to rare cataclysmic events which sometimes emerge as clustered, sometimes are isolated, several tens of thousands years distant from each other.
Methods
Our objective is twofold: 1) to prove that Eqs 1–3 embed the complexities of the global time-size distribution of terrestrial subaerial volcanism, and 2) to use the model constituted by that set of equations to determine the global rates of volcanism. To achieve such objectives we adopt a Monte Carlo approach whereby Eqs 1–3 are employed to simulate 1,000 different but statistically equivalent, equally possible eruption histories of the Earth, each one 100,000 years long. The memoryless property of Poisson distributions allows us to analyze the entire sequence over mutually independent intervals of any time length. The global rates are analyzed in terms of 1) number of eruptions of any given VEI scale and 2) volume of discharged magma. Extensive discussion of the advantages and limitations in employing different indicators of eruption size, such as VEI, volume, or mass, and on the meaning of individual eruptions in the database (and consequently in our analysis), can be found in Papale (2018) and Papale et al. (2021).
Exponential distributions have been used by previous authors (one notable example is Mendoza-Rosas and De La Cruz Reyna, 2008) to model eruption occurrence at various spatial scales. The exponential distribution of inter-event times, or equivalently the Poisson distribution of eruption events, characterizes many other natural and man-made phenomena as diverse as the number of meteorites greater than a given size that strike the Earth in a given period of time; the number of calls to a telephone service, or the number of alpha particles hitting a Geiger detector, in a particular time interval; and many others (Johnson et al., 2005). The fundamental characteristic of all such phenomena is that the occurrence of each individual event is independent from the time since the previous one, which is known as the “memoryless” property (Balakrishnan and Basu, 1995).
The memoryless property of Poisson-distributed events is utilized in this work, as described in the following point-by-point description of the employed procedure.
1) We adopt a Monte Carlo approach to simulate the occurrence of eruptions of any size in a 100,000 years time frame. Return times are sampled from Eq. 1 through standard inverse transform sampling:
Homogeneous variates
2) The operations at point 1 are repeated 1,000 times, obtaining 1,000 possible volcanic eruption histories each 100,000 years long. Because of the memoryless property, the simulated individual eruptions are independent from each other. Accordingly, the obtained histories can be equally regarded as referring to a 1 × 100,000,000 years long time frame, or to any other combination ensuring constant product of number times years. Because the shape of a Poisson distribution depends on the time window, the distributions associated with each different combination differ from each other. In order to ensure consistency and properly analyze the variability of the results with the length of the observational time window, for each different time window of length
3) We use Eqs 2, 3 to assign a volume to each simulated eruptive event. In order to account for the uncertainty in the definition of the continuous volume distribution (Papale et al., 2021), the 1,000 eruption histories of the Earth, each 100,000 years long, have been simulated by varying the parameters of the continuous volume distribution according to their respective variability and interdependence (Papale et al., 2021). For each eruption we first produce a random outcome from a homogeneous
The distribution from Eqs 2, 3, obtained by solving Eqs 5, 6, provides the constrained probability (that is, the probability given the occurrence of an eruption) of observing a given eruption volume, from the smallest lava flows to the largest VEI 8 super-eruptions. In order to use it in the present analysis, another property of Poisson distributions is employed, namely, that the sum of Poisson events is also Poisson distributed with rate parameter given by the sum of the rate parameters of the individual Poisson events. In other words, the sequence of eruptions with assigned VEI, obtained at points 1 and 2 above, can also be regarded as a sequence of generic eruptions with volume assigned following the procedure at point 3 above (note that the distributions of inter-event times and volumes are entirely disjointed).
The procedure above allows us to separate the assignment of VEI from the assignment of volume to each individual eruption. In fact, especially for low to intermediate 0—5 VEI eruptions, there is no univocal relationship emerging from the database, between assigned eruption VEI and range of erupted volume (Papale et al., 2021). At the same time, the obtained global Earth histories in terms of sequence of eruptions each characterized by its VEI (points 1-2 above) or by its volume (point 3 above) are entirely consistent with each other.
Results
Number Rates of Subaerial Volcanism
Through the procedure at points 1—3 above we obtain a synthetic dataset constituted by more than four billion individual eruptions in total, described in terms of either the eruption VEI or the eruption volume, and consistent with the reconstructed overall distribution of volcanic eruptions on Earth in terms of inter-event times, relative and absolute probability of each VEI class, and distribution of eruption volumes. Number rates are entirely related to Eq. 1, and they are obtained through Eq. 4. Table 1 and Figures 2A,B report in numerical and graphical form, respectively, the distribution of the number rates of subaerial volcanism on Earth for observational time windows from 1 to 100,000 years. The distributions are normal (a consequence of the central limit theorem) with mean (and median) at 40.5 eruptions per year, and 1st and 99th percentiles over a 1-year window of 26 and 56 eruptions per year, respectively.
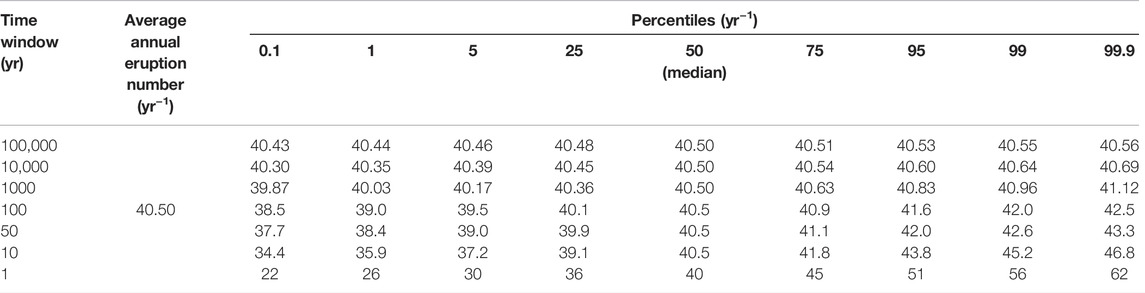
TABLE 1. Computed average annual number of eruptions from subaerial volcanism over different time windows.
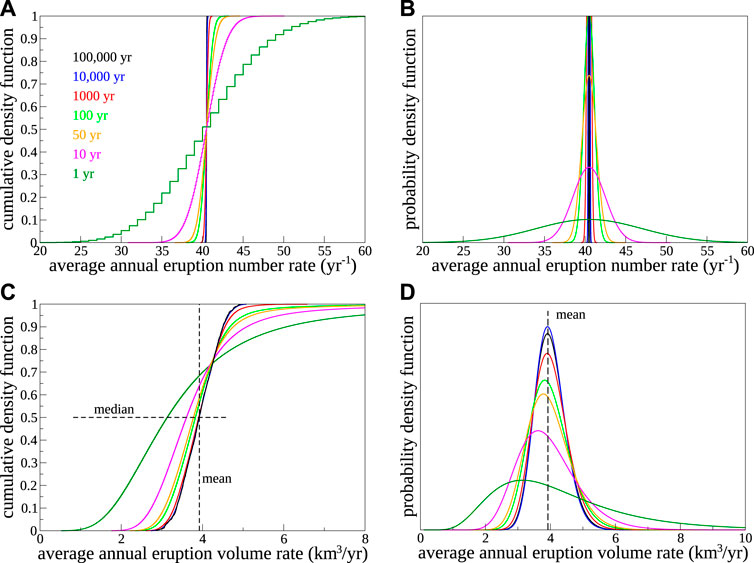
FIGURE 2. Computed distribution of the annual eruption number (A,B) and volume (C,D) rates. The left panels show the cumulative density function, while the right panels are probability density functions obtained by fitting the cumulative distributions. For the non-normal volume rate distributions in panels (C,D), the fit is made to a skewed log-normal distribution by means of a method of moments estimator (Ghorbanzadeh et al., 2017) with computation of the Owen function as in Patefield (2000). The step-wise character of the cumulative distribution for the observational time window of 1 year in panel (A) is due to the integer nature of the number of eruptions observed over the same period of time.
The capability of Eq. 1 to provide accurate forecasts of the number of observed eruptions of any VEI size is illustrated in Figure 3 for three different time windows of 1, 10, and 100 years. The comparison involves data for each VEI class up to corresponding catalogue completeness (Papale, 2018). For catalogue completeness extending back by N years, there are
FIGURE 3. Comparison between computed (lines) and observed (symbols) number of eruptions over different time windows of length 1 (A), 10 (B), and 100 (C) years. The step-wise distribution of predictions and observations is due to the integer nature of eruption numbers. Data points are reported for only VEI classes with catalogue completeness at least as long as the considered time window.
Volume Rates of Subaerial Volcanism
Figure 4 illustrates the computed cumulative eruption volumes for ten random simulations (reported in different colors) out of one thousand simulated time windows each 100,000 years long. Panel (A) shows the entire simulated time, while panels (B–F) are zoom views of the first 10,000–1 year time frame. Over the long time (panel A) the cumulative volumes appear as a line with approximately constant slope, with only a few minor steps visible on them, each one representing an extremely large eruption (three VEI 8 super-eruptions are highlighted, but others are present). The average rate over 100,000 years for the ten example cases in the figure is in the 3–4.5 km3/yr range. The long-term average rate when considering all of the simulated eruption sequences turns out to be 3.92 km3/yr (Table 2 and Figures 2C,D), two to four times larger than existing seldom rough estimates in the range 1—2 km3/yr (Nakamura and Furomoto, 1974; Fujii, 1975; Crisp, 1984). Figures 2C,D show that the volume distribution progressively changes from close to normal for long time windows, to markedly right-skewed for the shortest analyzed time windows of 1 and 10 years. Zooming into progressively shorter time periods (Figures 4B–F) reveals more features of the time distribution, as smaller eruptions progressively emerge. At the 10,000 years scale (panel B), VEI 7 eruptions are visible as clear steps in the cumulative trend. Similar steps become more and more frequent by progressively zooming in, down to the shortest 10 and 1 year scales (panels E–F) where the smallest eruptions become visible and the variability in the observed average volume production rates is the highest. At this temporal scale, which corresponds to that of our observations, the complexities of the true distribution clearly emerge. Entropy maximization due to exponentially distributed inter-event times, combined with log-normal or power law distribution of erupted volumes, efficiently mix up resulting in apparently disordered trends, similar to the observed ones, which in fact result entirely by the extreme simplicity of the present model as it is shown in Eqs 1–3.
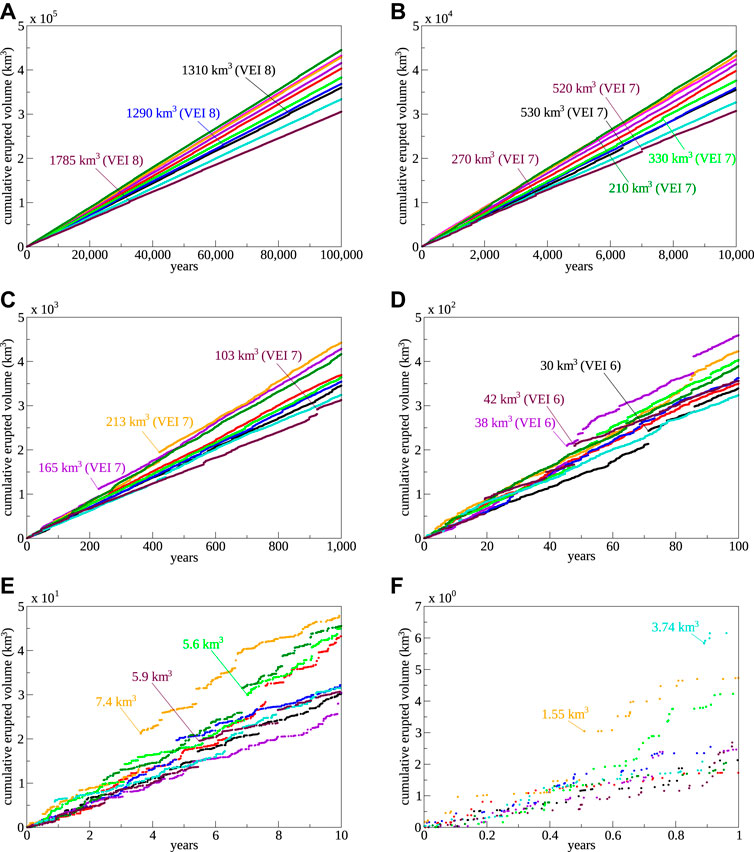
FIGURE 4. Ten random simulations, in different colors, out of 1000 performed simulations, each 100,000 years long, of the global subaerial eruptive history of the Earth. Panel (A) shows the entire length of simulations, each one consisting of >4 million individual eruptions. Panels (B‐F) are zoom views of the initial 10,000 to 1 year. Some of the largest visible eruptions are indicated in each panel, together with their corresponding volume and, for VEI ≥6, their corresponding VEI.
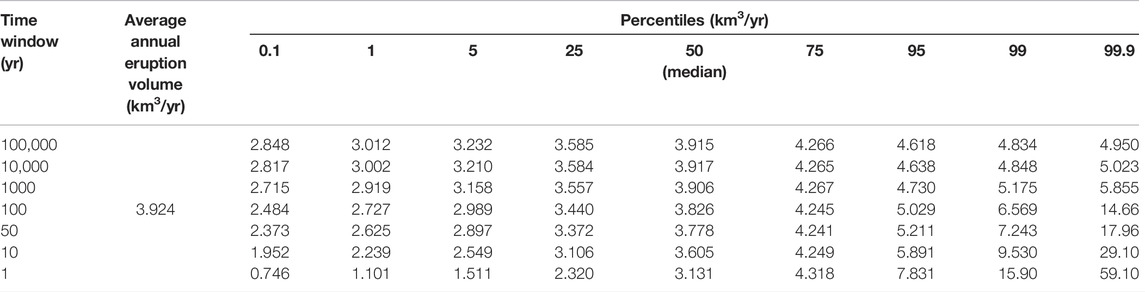
TABLE 2. Computed average annual eruption volume from subaerial volcanism over different time windows.
The volume distributions produced by the present model are compared to the observations in Figure 5. Only eruptions with VEI ≥4 can be considered for this comparison, as the databases do not report the volumes for eruptions with VEI 3 or less. Catalogue completeness for VEI ≥4 eruptions extends back to year 1840 CE (Papale, 2018), while the youngest of such eruptions with associated volume in the databases (up to year 2018) dates back to 2014 CE (https://volcano.si.edu). Therefore, we consider the forecasts we would make on any year from 1840 CE projecting into the future up to year 2014 CE, and compare with the corresponding observations. Note that such forecasts are more correctly referred to in the following as “hindcasts”, as they refer to a time in the past. The hindcasts and the observations are statistically indistinguishable over any observational time window allowed by catalogue completeness (Figure 5), well above typical significance thresholds such as 5% (p-values > 0.05). In other words, the observed volumes produced by any eruption with VEI ≥4 over the corresponding period of catalogue completeness belong to the same distribution as from the model given by Eqs 1–3.
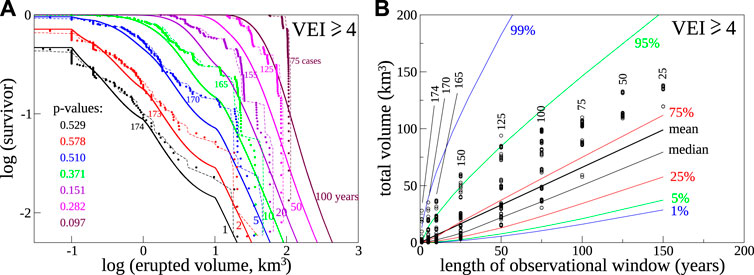
FIGURE 5. Comparison between model forecasts and eruption data. The comparison involves only eruptions with VEI ≥4, for which the employed databases report the volumes. The data extend back to year 1840 CE for which there is substantial catalogue completeness for VEI ≥4 eruptions. As for Figure 3, for catalogue completeness extending back by N years, there are
Figure 6 shows the yearly eruption volume rate per volume size class. The mean value (thick solid line) does not depend on the length of the observational time window, as it is explained above. The median as well as any other percentile, instead, depends on the observational time window. Panel (A) adopts a linear scale for the yearly eruption volume rate, whereas panel (B) shows it on a logarithmic scale that better highlights the distribution of both the marginal values and the percentiles. The figure shows that most (>50%) of the total volume erupted from global subaerial volcanism is discharged by eruptions with size corresponding to 0.1–1 km3. That size interval, therefore, combines with frequency in the most effective way when compared to any other size interval. Summed up with eruptions in the range 1—10 km3, this class of medium-sized eruptions makes up nearly three quarters of the global terrestrial subaerial eruption rate. In spite of their order-of-magnitude higher frequency of appearance, small eruption with individual volumes <0.1 km3 make up less than 17%; and in spite of their order-of-magnitude larger individual volumes, less frequent large to cataclysmic eruptions do not achieve 10% of the total production rate. Volcanic super-eruptions by themselves (individual eruption volume ≥1000 km3) contribute only a negligible proportion (<0.4%) of the global subaerial production rate on Earth.

FIGURE 6. Yearly eruption volume rate for different classes of eruption volume and different observational time windows. (A) Linear scale. (B) Logarithmic scale. Values referring to discrete eruption volume classes (on the horizontal axis) are connected for visual purposes only. In both panels: the black solid line is the mean of the distribution, which does not depend on the observational time window; the thick dashed lines are the median, and the thin dashed lines are the 5th and 95th quantiles (colors corresponding to observational time windows as shown in panel (A). The subdivision in small, medium and large eruptions in panel (A) is purely indicative.
The model provides a rare opportunity to be formally validated (Marzocchi and Jordan, 2014, for the analysis of testing in probabilistic forecasting) by comparing the model forecasts with the observations in a reasonably distant future. In fact, year-by-year observations (or any other time frame) can be collected and compared with model forecasts. Figure 7 shows such forecasts for the total erupted volume from global subaerial terrestrial volcanism, in terms of probability of exceedance (i.e., frequency of observations exceeding any given volume) over time windows of 1, 10, and 50 years. The curves in Figure 7 provide a synthetic picture of forecasts which are also relevant as robust inputs, constraints or tests for other models of global Earth dynamics.
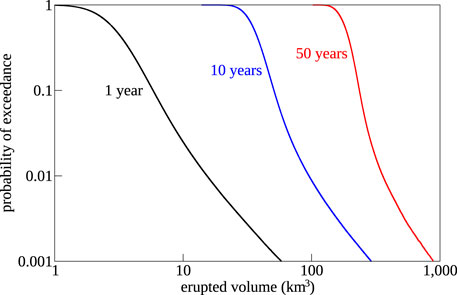
FIGURE 7. Model forecasts in terms of probability of exceedance for any given volume over time windows of 1, 10, and 50 years.
Discussion
The present model provides a statistical representation of the rates of subaerial volcanism on Earth, consistent with the available data in terms of number and volume distributions. The model is extremely simple. Its foundation rests in the observation that over the global scale, eruption inter-event times are exponentially distributed (Papale, 2018), or equivalently, that the eruptions are Poisson distributed. Eq. 1 expresses that characteristic, and is by itself sufficient to statistically simulate the subaerial eruption history of the Earth in terms of time-VEI distribution. Combined with the global eruption volume distribution at Eqs 2, 3, the model describes the global time vs. erupted volume distribution. With just that little work, the apparently disordered trends observed for the subaerial volcanism on Earth are statistically reproduced: largely variable eruption frequencies, seemingly random, irregularly long quiescent periods, complex succession of events with extreme size variability, and seldom appearance of large eruptions up to globally impacting ones, become fully logical and statistically reproducible; and the rates of subaerial volcanism emerge from the statistical analysis of a large number of possible global volcanic histories, all of them consistent with the observations, and in a statistical sense, all of them equally plausible. Importantly, the number and volume rates presented here are statistically testable, through comparison with additional data on past eruptions as they are constantly produced, as well as against future observations. Those rates can be employed to figure out if currently observed global activities fall close to averages or depict instead periods of significantly lower or higher activities, now quantitatively defined; and can be employed as an input or constraint for other Earth system models, like global tectonics, mantle dynamics, climate change, and others.
Previous estimates of global rates of subaerial volcanism on Earth are sparse. Nakamura (1974) and Fujii (1975) suggested 1.85 and 2.2 km3/yr, respectively, as the sum of volcanism from subduction areas, intracontinental and intra-oceanic hot spots. Crisp (1984) provided a more systematic analysis, although still limited by the data available at the time, concluding that much of the uncertainty associated with volume estimates was by then impossible to quantify. Crisp’s summary suggested 0.65–0.85 km3/yr as the sum of subduction-related and intraplate volcanism. That would increase to 0.8–1 km3/yr, by including the contribution from the estimated average melt ascent rates beneath Iceland (Eksinchol et al., 2019) and assuming a 5:1 ratio between intrusive and extrusive magmatism, typical of oceanic ridge environments (Crisp, 1984).
Compared with the mean yearly sub-aerial extrusion rate of nearly 4 km3/yr determined here, the above early attempts appear significant underestimations. Huybers and Langmuir (2009) and Kutterolf et al. (2013) describe significant variations in eruption rates during deglaciation periods, particularly after Termination I when the former authors describe a global eruption rate increase by a factor of 2–6. By contrast, Watt et al. (2013) find that the rate of arc volcanism, which they rank as making up about 90% of present-day sub-aerial volcanism, did not change at statistically significant levels across deglaciation. They conclude that if there was an increase, that was globally limited to non-arc volcanism and it involved at most a two-fold increase, and potentially much less than that. As a matter of fact, the time distributions of volcanic eruptions with VEI 7 and 8, characterized by substantial catalogue completeness extending back across a number of ice ages, do not show fluctuations larger than those expected by constant rate Poisson processes (Papale, 2018). The correspondence between computed and observed eruption number rates in Figure 3 suggests a similar conclusion. Thus, the present results tend to agree with Watt et al. (2013), at least to the extent to which global rate changes across interglacial periods are recorded by the largest explosive eruptions.
The global estimates obtained here, together with their accompanying uncertainties, provide a sound reference for other global models of Earth system dynamics, and for further estimates of relevant global quantities. The example above relates to possible existence and extent of feedback mechanisms between deglaciation, sub-crustal melting, and volcanism. One other relevant aspect is the estimate of global volcanic emissions, particularly carbon dioxide which is relevant for global climate change projections. Current estimates of global volcanic CO2 fluxes account for sources such as fumaroles, diffuse emissions, and persistent volcanic plumes, either non-eruptive or associated with low-level, VEI 0 to 1 eruptions (Burton et al., 2013; Werner et al., 2019). On the contrary, the amount of carbon dioxide discharged during explosive eruptions is poorly known, largely because of too high proximal risks for accurate measurements combined with limits in remote determinations as a consequence of high atmospheric ash loading during eruptions and large CO2 background concentration in the atmosphere. In their recent review of carbon dioxide emissions from subaerial volcanic regions, Werner et al. (2019) suggest that “explosive” emissions, that is, CO2 released during eruptive activity not associated with persistent plumes, may be only a small fraction of the total emissions, and estimated it to be, likely, in the range 0.6–7 Mt/yr. More than 90% of the low VEI eruptions in the 0–1 range, which contribute to current estimates of carbon dioxide emissions from volcanoes, are associated with individual eruption volumes below 100 Mm3 (Papale et al., 2021). The distributions in Figure 6 suggest therefore that such low VEI eruptions may capture only a minor proportion of the global magma discharges. Quantification of the missing CO2 flux associated with non-persistent eruptions requires an estimate of the CO2 contents in the corresponding magmas. Such contents are unfortunately poorly known, largely because glass inclusions within crystals, which trap volatiles dissolved in magmas at the time of crystallization, are poorly informative of the total content of carbon dioxide due to its extremely low solubility and overwhelming partition in the gas phase (Dixon and Stolper, 1995; Papale, 2005). Additionally, glass inclusion studies are mostly available for basaltic magmas, as the corresponding mafic minerals, first of all olivine, are effective in preserving the trapped volatiles over long times, while sialic minerals are not (Métrich and Wallace, 2008). In basaltic magmas, reconstructed total CO2 contents can often be as large as several wt% (Papale, 2005; Moretti et al., 2018, and references therein). If the mean rate of magma production from medium to large eruptions (individual volumes >100 Mm3) from Figure 6 is compared with the estimated (Werner et al., 2019) 0.6–7 Mt/yr CO2 flux from “explosive” emissions, then the average proportion of CO2 in the discharged magma turns out to be as little as 0.014–0.17 wt% (an average density of 1000 kg/m3 for the explosive volcano deposits is used to convert from volumes to masses). Differently, global mass balance from estimated total carbon dioxide released during recent, well studied explosive eruptions such as the 1980 Mt. St. Helens and 1991 Piñatubo explosive eruptions (10 and 50 Mt CO2, respectively, Werner et al., 2019, compared to 1011.8 and 1013.1 kg of erupted magma, Crosweller et al., 2012) suggest that the total CO2 content in magmas was at least 1.6 and 0.4 wt%, respectively. Thus, when compared to eruption volume rate estimates in this work, the current estimates of “explosive” CO2 emissions appear too low as they imply exceedingly low CO2 contents in magmas. If 1 wt% total (dissolved plus exsolved, as for the Mt. St. Helens and Piñatubo cases above) CO2 is roughly representative as an average for magmas discharged during eruptions with VEI 2 or larger, then Table 2 and Figure 6 show that the corresponding mean flux of carbon dioxide would be close to 40 Mt/yr; over 50 years there would be a 90% confidence to observe an average flux in the range 29—52 Mt/yr, with a 1% probability to observe less than 26 or more than 72 Mt/yr, and a 1‰ probability to observe less than 24 or more than 180 Mt/yr. The above CO2 flux from non-persistent eruptions would be a significant addition to the current estimates of total flux of volcanic CO2, with the most recent ones being in the range 180—225 Mt/yr (Fischer and Aiuppa, 2020) including persistent volcanic plumes, fumaroles and diffuse emissions, and dissolution in volcanic lakes and aquifers. More confident estimates of the contribution by non-persistent volcanic activities to the total carbon dioxide release require better knowledge of total carbon dioxide in magmas, which is unfortunately still poorly known.
Conclusion
The examples above are illustrative of how modeling global volcanic rates can impact modeling and understanding of global Earth dynamics. A more comprehensive analysis of such impacts is beyond the aims of this work, which is instead dedicated to presenting the accomplishment of a study initiated years ago by considering first the global distribution of volcanism in terms of discrete VEI classes (Papale, 2018), then prosecuted by analyzing the continuous volume distribution (Papale et al., 2021), finally completed here by quantifying the global rates of subaerial volcanism on Earth. We stress here the beauty deriving from the simplicity in the formulation of the present model, that in just three elementary equations reproduces with satisfactory accuracy one relevant aspect of the large-scale Earth dynamics represented by the time-size distribution of the global subaerial volcanism on Earth. This would never be possible without the availability of global eruption databases, the importance of which cannot be overstated. The relevance of databases is destined to increase further in the coming years together with the explosion of machine learning and artificial intelligence techniques, and we foresee and encourage significant resources dedicated to further developments of databases in volcano and Earth system science.
Our analysis refers to volcanic eruptions as they are identified and categorized in the available databases, and to the global scale represented by the whole Earth system (excluding eruptions on the ocean bottom and flood basalts). At such a scale subaerial volcanic eruptions emerge as Poisson events, separated by exponentially distributed inter-event times (Eq. 1). The Poisson distribution implies that at the global scale volcanic eruptions are independent from each other. Such a global scale behavior does not necessarily apply at the individual volcano scale, where the occurrence of an eruption can be related to previous ones. Hence, the statistical distribution of eruptions for an individual volcano may be different from Poisson. Observations at individual volcano scale are normally too few to discern unambiguously a distribution. The individual volcano scale needs further dedicated investigation, and we recommend that the arguments, modeling, findings and conclusions presented here are limited to the global scale to which our study refers.
Some aspects of the model require further understanding. The initial log-normal portion of the overall distribution may either reflect some fundamental difference in the origin and dynamics of small vs. large eruptions, or it may be an artifact due to grouping of small individual eruptions into larger ones covering longer periods of time, as it is normal practice in database construction (Global Volcanism Program, 2013; Papale et al., 2021). The origin of the power law section of the distribution may relate to highly non-linear dynamics and to a sort of critical behavior which has been described for other natural systems (including faulting and earthquake generation, Fisher et al., 1997; Huang et al., 1998), resulting in the emergence of self-similarity and scale invariance (e.g., Bak et al., 1988a,b; Marković and Gros, 2014). These aspects need specific investigation to be addressed. Similarly, the relationships with the behaviors in limited geographical or geodynamic regions down to individual volcano scale, which are relevant for local hazard forecasts, require further dedicated investigation.
Data Availability Statement
Publicly available datasets were analyzed in this study. This data can be found here: https://volcano.si.edu (Smithsonian GVP database, Global Volcanism Program, 2013) and www.bgs.ac.uk/vogripa (LaMEVE database, Crosweller et al., 2012).
Author Contributions
PP conceived the work, developed the theory, made the calculations, and wrote the manuscript. DG checked the calculations and supported in writing the manuscript. WM provided theoretical supervision and supported in writing the manuscript.
Fundings
DG was supported by an EPOS-IT grant.
Conflict of Interest
The authors declare that the research was conducted in the absence of any commercial or financial relationships that could be construed as a potential conflict of interest.
Publisher’s Note
All claims expressed in this article are solely those of the authors and do not necessarily represent those of their affiliated organizations, or those of the publisher, the editors and the reviewers. Any product that may be evaluated in this article, or claim that may be made by its manufacturer, is not guaranteed or endorsed by the publisher.
References
Bak, P., Tang, C., and Wiesenfeld, K. (1988a). Self-Organized Criticality. Phys. Rev. A 38, 364–374. doi:10.1103/physreva.38.364
Bak, P., Tang, C., and Wiesenfeld, K. (1988b). “Scale-invariant Spatial and Temporal Fluctuations in Complex Systems in Random Fluctuation and Pattern Growth,” in Random Fluctuations and Pattern Growth: Experiments and Models. Editors H. E. Stanley, and N. Ostrowsky (Dordrecht: Kluwer Academic Press), 329–335. doi:10.1007/978-94-009-2653-0_47
Balakrishnan, N., and Basu, A. P. (1995). Exponential Distribution: Theory, Methods and Applications. London: CRC Press.
Brown, S. K., Crosweller, H. S., Sparks, R. S. J., Cottrell, E., Deligne, N. I., Guerrero, N. O., et al. (2014). Characterisation of the Quaternary Eruption Record: Analysis of the Large Magnitude Explosive Volcanic Eruptions (LaMEVE) Database. J. Appl. Volcanol. 3, 5. doi:10.1186/2191-5040-3-5
Burton, M. R., Sawyer, G. M., and Granieri, D. (2013). “Deep Carbon Emissions from Volcanoes” in Carbon in Earth,” in Reviews in Mineralogy and Geochemistry. Editors R. M. Hazen, A. P. Jones, and J. A. Baross (Mineralogical Society of America), 323–354. doi:10.2138/rmg.2013.75.11
Crisp, J. A. (1984). Rates of Magma Emplacement and Volcanic Output. J. Volcanol. Geotherm. Res. 20, 177–211. doi:10.1016/0377-0273(84)90039-8
Crosweller, H. S., Arora, B., Brown, S. K., Cottrell, E., Deligne, N. I., Guerrero, N. O., et al. (2012). Global Database on Large Magnitude Explosive Volcanic Eruptions (LaMEVE). J. Appl. Volcanol. 1, 4. doi:10.1186/2191-5040-1-4
Dixon, J. E., and Stolper, E. M. (1995). An Experimental Study of Water and Carbon Dioxide Solubilities in Mid-ocean Ridge Basaltic Liquids. 2. Applications to Degassing. J. Pet. 36, 1633–1646.
Eksinchol, I., Rudge, J. F., and Maclennan, J. (2019). Rate of Melt Ascent beneath Iceland from the Magmatic Response to Deglaciation. Geochem. Geophys. Geosyst. 20, 2585–2605. doi:10.1029/2019gc008222
Fischer, T. P., and Aiuppa, A. (2020). AGU Centennial Grand Challenge: Volcanoes and Deep Carbon Global CO2 Emissions from Subaerial Volcanism — Recent Progress and Future Challenges. Geochem. Geophys. Geosyst. 21, e2019GC008690. doi:10.1029/2019gc008690
Fisher, D. S., Dahmen, K., Ramanathan, S., and Ben-Zion, Y. (1997). Statistics of Earthquakes in Simple Models of Heterogeneous Faults. Phys. Rev. Lett. 78, 4885–4888. doi:10.1103/physrevlett.78.4885
Fujii, N. (1975). Material and Energy Production from Volcanoes. Bull. Volcanol. Soc. Jpn. 20, 197–204.
Geist, E. L., and Parsons, T. (2014). Undersampling Power-Law Size Distributions: Effect on the Assessment of Extreme Natural Hazards. Nat. Hazards 72, 565–595. doi:10.1007/s11069-013-1024-0
Ghorbanzadeh, D., Durand, P., and Jaupi, L. (2017). “Generating the Skew Normal Random Variable,” in Proc. World Congress on Engineering, WCE 2017, London, July 5-7, 2017. 2078-0966.
Huang, Y., Hawkesworth, C., van Calsteren, P., Smith, I., and Black, P. 1997). Melt Generation Models for the Auckland Volcanic Field, New Zealand: Constraints from UTh Isotopes. Earth Planet. Sci. Lett. 149, 67–84. doi:10.1016/S0012-821X(97)00064-2
Huang, Y., Saleur, H., Sammis, C., and Sornette, D. (1998). Precursors, Aftershocks, Criticality and Self-Organized Criticality. Europhys. Lett. 41, 43–48. doi:10.1209/epl/i1998-00113-x
Huybers, P., and Langmuir, C. (2009). Feedback between Deglaciation, Volcanism, and Atmospheric CO2. Earth Planet. Sci. Lett. 286, 479–491. doi:10.1016/j.epsl.2009.07.014
Ito, G., and Clift, P. D. (1998). Subsidence and Growth of Pacific Cretaceous Plateaus. Earth Planet. Sci. Lett., 161, 85–100. doi:10.1016/S0012-821X(98)00139-3
Johnson, N. L., Kemp, A. W., and Kotz, S. (2005). Univariate Discrete Distributions. Hoboken, New Jersey: John Wiley & Sons.
Kagan, Y. Y., and Schoenberg, F. (2001). Estimation of the Upper Cutoff Parameter for the Tapered Pareto Distribution. J. Appl. Probab. 38, 158–175. doi:10.1017/s0021900200112756
Kiyosugi, K., Connor, C., Sparks, R. S. J., Crosweller, H. S., Brown, S. K., Siebert, L., et al. (2015). How Many Explosive Eruptions Are Missing from the Geologic Record? Analysis of the Quaternary Record of Large Magnitude Explosive Eruptions in Japan. J. Appl. Volcanol. 4, 17. doi:10.1186/s13617-015-0035-9
Kutterolf, S., Jegen, M., Mitrovica, J. X., Kwasnitschka, T., Freundt, A., and Huybers, P. J. (2013). A Detection of Milankovitch Frequencies in Global Volcanic Activity. Geology 41, 227–230. doi:10.1130/g33419.1
Marković, D., and Gros, C. (2014). Power Laws and Self-Organized Criticality in Theory and Nature. Phys. Rep. 536, 41–74.
Marzocchi, W., and Jordan, T. H. (2014). Testing for Ontological Errors in Probabilistic Forecasting Models of Natural Systems. Proc. Natl. Acad. Sci. U. S. A. 111 (11), 11973–11978. doi:10.1073/pnas.1410183111
Métrich, N., and Wallace, P. J. (2008). “Volatile Abundances in Basaltic Magmas and Their Degassing Paths Tracked by Melt Inclusions” in Minerals, Inclusions and Volcanic Processes,” in Reviews in Mineralogy and Geochemistry. Editors K. D. Putirka, and F. J. Tepley (Mineralogical Society of America), 363–402.
Mendoza-Rosas, A. T., and De la Cruz-Reyna, S. (2008). A Statistical Method Linking Geological and Historical Eruption Time Series for Volcanic Hazard Estimations: Applications to Active Polygenetic Volcanoes. J. Volcanol. Geotherm. Res. 176, 277–290. doi:10.1016/j.jvolgeores.2008.04.005
Moretti, R., Métrich, N., Arienzo, I., Di Renzo, V., Aiuppa, A., and Allard, P. (2018). Degassing vs. Eruptive Styles at Mt. Etna Volcano (Sicily, Italy). Part I: Volatile Stocking, Gas Fluxing, and the Shift from Low-Energy to Highly Explosive Basaltic Eruptions. Chem. Geol. 482, 1–17. doi:10.1016/j.chemgeo.2017.09.017
Nakamura, K. (1974). “Preliminary Estimates of Global Volcanic Production Rate,” in The Utilization of Volcanic Energy. Editors J. Colp, and A. Furomoto (Hilo: Univ. Hawaii), 273–285.
Newhall, C. G., and Self, S. (1982). The Volcanic Explosivity Index (VEI) an Estimate of Explosive Magnitude for Historical Volcanism. J. Geophys. Res. 87, 1231–1238. doi:10.1029/jc087ic02p01231
Papale, P., and Marzocchi, W. (2019). Volcanic Threats to Global Society. Science 363, 1275–1276. doi:10.1126/science.aaw7201
Papale, P., Marzocchi, W., and Garg, D. (2021). Global Volume Distribution for Subaerial Volcanism on Earth. J. Geophys. Res. Solid Earth 126, e2021JB021763. doi:10.1029/2021jb021763
Papale, P. (2005). Determination of Total H2O and CO2budgets in Evolving Magmas from Melt Inclusion Data. J. Geophys. Res. 110, B03208. doi:10.1029/2004jb003033
Papale, P. (2018). Global Time-Size Distribution of Volcanic Eruptions on Earth. Sci. Rep. 8, 6838. doi:10.1038/s41598-018-25286-y
Patefield, M. (2000). Fast and Accurate Calculation of Owen’s T Function. J. Stat. Soft. 5. doi:10.18637/jss.v005.i05
Press, W. H., Teukolsky, S. A., Vetterling, W. T., and Flannery, B. P. (1992). Numerical Recipes in Fortran. 2nd Edition. New York, NY: Cambridge University Press.
Robock, A. (2000). Volcanic Eruptions and Climate. Rev. Geophys., 38(2), 191–219. doi:10.1029/1998rg000054
Global Volcanism Program (2013). "Volcanoes of the World, v. 4.7.6," in Smithsonian Institution Editor E. Venzke. doi:10.5479/si.GVP.VOTW4-2013
Vere-Jones, D., Robinson, R., and Yang, W. (2001). Remarks on the Accelerated Moment Release Model: Problems of Model Formulation, Simulation and Estimation. Geophys. J. Int. 144, 517–531. doi:10.1046/j.1365-246x.2001.01348.x
Watt, S. F. L., Pyle, D. M., and Mather, T. A. (2013). The Volcanic Response to Deglaciation: Evidence from Glaciated Arcs and a Reassessment of Global Eruption Records. Earth-Sci. Rev. 122, 77–102. doi:10.1016/j.earscirev.2013.03.007
Werner, C., Fischer, T. P., Aiuppa, A., Edmonds, M., Cardellini, C., Carn, S., et al. (2019). “Carbon Dioxide Emissions from Subaerial Volcanic Regions: Two Decades in Review,” in Deep Carbon: Past to Present. Editors B. Orcutt, I. Daniel, and R. Dasgupta (Cambridge: Cambridge University Press), 188–236. doi:10.1017/9781108677950.008
Keywords: global terrestrial volcanism, global rates of volcanism, poisson distributions in nature, power laws in nature, distribution of volcanism
Citation: Papale P, Garg D and Marzocchi W (2022) Global Rates of Subaerial Volcanism on Earth. Front. Earth Sci. 10:922160. doi: 10.3389/feart.2022.922160
Received: 17 April 2022; Accepted: 24 May 2022;
Published: 20 June 2022.
Edited by:
Roberto Sulpizio, University of Bari Aldo Moro, ItalyReviewed by:
Jonathan Dehn, University of Alaska Fairbanks, United StatesStephen R. McNutt, University of South Florida, United States
Copyright © 2022 Papale, Garg and Marzocchi. This is an open-access article distributed under the terms of the Creative Commons Attribution License (CC BY). The use, distribution or reproduction in other forums is permitted, provided the original author(s) and the copyright owner(s) are credited and that the original publication in this journal is cited, in accordance with accepted academic practice. No use, distribution or reproduction is permitted which does not comply with these terms.
*Correspondence: Paolo Papale, cGFvbG8ucGFwYWxlQGluZ3YuaXQ=