
95% of researchers rate our articles as excellent or good
Learn more about the work of our research integrity team to safeguard the quality of each article we publish.
Find out more
ORIGINAL RESEARCH article
Front. Earth Sci. , 08 July 2022
Sec. Interdisciplinary Climate Studies
Volume 10 - 2022 | https://doi.org/10.3389/feart.2022.922013
This article is part of the Research Topic Climate Change and Associated Impacts View all 16 articles
 Tiantian Li1,2†
 Qiang Zhang1,2*†Vijay P. Singh3
 Jiaqi Zhao1,2Jinbo Song1,2Shuai Sun1,2,4
 Gang Wang1,2Zexi Shen1,2Wenhuan Wu1,2,5
Ecological conservation and high-quality development of the YRB (Yellow River Basin) has been adopted as a national strategy. However, the ecological environment of the YRB is fragile and it has degraded in recent years. Here we proposed an ecological degradation index system based on the Pressure-State-Response (PSR) model and evaluated trends in ecological degradation of the YRB using the Mann-Kendall trend test. We found an upward-downward-upward trend in the ecological degradation index (EDI) during the period of 2000–2019. We also observed an intensifying degradation of eco-environment from the upper to the lower YRB. Meanwhile, 69.9% of the YRB is under degraded eco-environment, while 29.5% of the YRB is dominated by improved eco-environment. Specifically, the ecological degradation intensity of Henan and Shandong Province with dense population and rapid economic development is the highest. Due to active and effective improvement measures taken by the government, the degradation intensity has been having a decreasing tendency. However, higher degradation intensity of eco-environment of the YRB should arouse human concerns. As to the driving factors, human activities can be regarded as the major driving factors for degraded eco-environment, and water stress and economic development exert increasing impacts on the eco-environment of the YRB. Our finding can provide a decision-making basis for the ecological management and high-quality development of the YRB.
The Yellow River is the second largest river in China and is an important ecological safety barrier. It plays a crucial role in Chinese economic development and food security. It directly supports 12% of the national population, feeds 15% of the irrigation area, and contributes to 9% of China’s GDP (Miao et al., 2010; Chen et al., 2012). At the same time, there are rich mineral resources, where coal and petroleum mining volume account for 50% and 25% of the total production in China (Wen et al., 2008). The Central Chinese government issued the “Ecological Protection and High-Quality Development Plan for the Yellow River Basin” on 8 October 2021. Therefore, the ecological protection and high-quality development of the YRB have become major national strategies and it is the great revival and sustainable development target of China.
In recent years, rapid population growth, booming urbanization and industrialization, and warming climate combine to afflict the ecosystem of the YRB (Li et al., 2017; Zhang et al., 2017). The continuous degradation of watershed ecological environment may eventually inflict damaging effects on the ecosystem structure, loss of ecosystem service functions (Heinrichs et al., 2016). Ecological fragility is a challenging issue for the YRB with low vegetation coverage, severe wind and sand, serious soil erosion (Huang et al., 2012), excessive development of agriculture (Liu et al., 2019), as well as the long-term overuse of land resources by increased urbanization and population boom (Zhang et al., 2022), which have resulted in expanding ecologically vulnerable areas in the YRB. The ecological degradation and ecological sustainable development have aroused widespread human concerns. Therefore, for the ecological protection and sustainable development of the YRB, it is of great significance to comprehensively understand the evolution of landscape or ecosystem and identify the ecologically-degraded areas and relevant driving factors.
Nowadays, ecological environment issues have aroused widespread concerns. A large body of studies addressed the factors affecting ecological environment, including human activities (Song et al., 2014), soil erosion (Zhao et al., 2013), biological integrity (Niu et al., 2021), etc. Song et al. (2014) believed that human activities usually exert remarkable impacts on fluvial ecosystems. Previous studies have shown that human activities have changed one-third to half of the Earth terrestrial surface. If the impact of human activities is ignored, the structure and function of ecosystem cannot be properly grasped (Vitousek et al., 2008). Zhao et al. (2013) investigated the evolution of the ecological environment by analyzing changes in soil erosion in the YRB. Patil et al. (2018) analyzed flow and sediment deposition to anatomize mechanisms behind changes of the fluvial ecosystem and ecological degradation. Niu et al. (2021) quantitatively evaluated the ecological health at the headwater region of the YRB by analyzing the biological integrity of bacterial communities, and found that grazing pressure was the leading factor in ecological degradation. In addition, the rising demand of energy leads to an increase in hydropower production, which will also cause more pressure on the fluvial ecosystem (Gorla & Perona, 2013). Wohlfart et al. (2016) argued that the adverse consequences of unreasonable continuous development of watershed resources not only offset the benefits of economic development, but also threatened social stability. Due to the complexity of ecosystem structure and driving factors of ecological degradation of the YRB, a multitude of studies attempted to address the ecological degradation at different spatial scales. Zhang et al. (2018) found that the ecological risk was lower in the upper YRB and was higher in the lower YRB by analyzing the hydrological changes over the YRB. Moreover, researchers used various methods to analyze ecosystem quality and ecosystem evolution. Pettorelli et al. (2005) reasoned that using NDVI (Normalized Difference Vegetation Index) to monitor vegetation distribution and dynamic changes can better reflect the impact of environmental changes on ecological degradation and fragmentation. Das et al. (2020) and Wang et al. (2021) used the Pressure-State-Response (PSR) model to assess the quality of ecosystems. Zhang et al. (2017) proposed a Pressure-Support-State-Response (PSSR) model and used a single-factor evaluation method to reflect the dynamic changes in the vulnerability of the YRB Delta wetland ecosystem. However, most studies are based on single influencing factors to explore the driving factors behind the ecosystem degradation, but these studies usually did not compare degradation evolution characteristics in respect of spatial distribution under the same standard. Therefore, here we integrated the impacts of climate change, underlying surface changes, human activities, economic development and government response measures on the ecological degradation. We analyzed the temporal and spatial characteristics and identified the influencing factors of ecological degradation in the YRB.
The YRB (95°53′-119°05′E, 32°10′-41°50′N) (Figure 1) is sourced from the Bayan Har Mountains of the Qinghai-Tibet Plateau and flows into the Bohai Sea. It is of 795,000 km2 in drainage area with a river length of 5,464 km (YRCC, 2020). The terrain is high in the west and low in the east and runs through arid and semi-humid climate regions. The precipitation decreases from southeast to northwest and monthly precipitation is extremely spatially uneven. In addition, the flood and drought disasters occur frequently. In the past 20 years, the temperature of the YRB has increased under 1°C. The area accounts for 8.3% of the country’s land area, and the per capita water consumption of the YRB is 23% of the national per capita water consumption (YRCC, 2020).
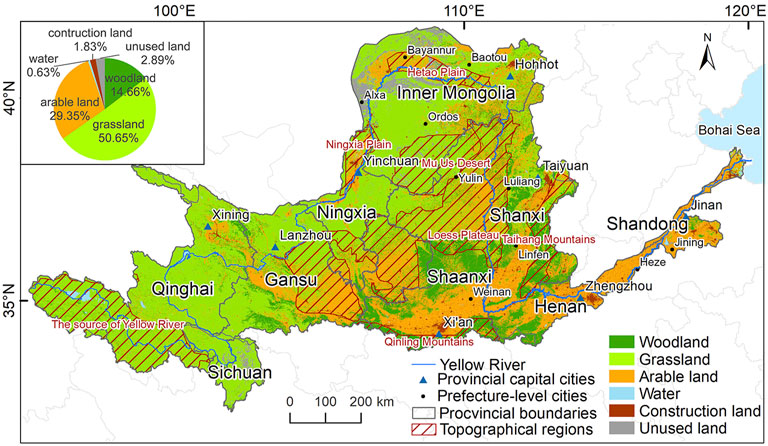
FIGURE 1. Spatial distribution map of land use in the Yellow River Basin in 2019.
Therefore, we integrated aforementioned factors and developed a comprehensive indicator system of ecological degradation based on the PSR model. We formulated the following objectives: 1) to develop a comprehensive ecological degradation indicator system in the YRB; 2) to incorporate the landscape ecological risk index into the assessment of ecological degradation intensity, divide ecological units with the same scale, and consider the impact of the landscape scale on ecological degradation; 3) to identify key driving factors affecting the ecological degradation of the YRB; and 4) to analyze the ecological degradation trend of the YRB during 2000–2019 and identify the degradation area within the YRB.
The precipitation data was sourced from the China Meteorological Administration Land Data Assimilation System (CLDAS) and is a grid data at daily scale with spatial resolution of 0.0625°×0.0625° during January 2000 to December 2019. The dataset was sourced from http://data.cma.cn/. We used the precipitation data to calculate the annual rainstorm days, annual heavy rain days, annual dry days, and precipitation intensity in the YRB.
The land use data was issued by ESA (European Space Agency) with spatial resolution of 300 m×300 m from 2000 to 2019 which was sourced from http://maps.elie.ucl.ac.be/CCI/viewer/. In this study, land use types were classified into six categories: woodland, grassland, arable land, water, construction land, and unused land, which were used to calculate the proportion of different land use types.
The population density, urbanization rate, GDP per capita, number of reservoirs, total reservoir capacity, area of soil erosion control and proportion of environmental protection expenditure were obtained from the 2000–2019 statistical yearbooks of provinces within the YRB.
The Pressure-State-Response model (PSR) was proposed by the Organization for Economic Cooperation and Development (OECD) and the United Nations Environment Programme (UN-EP) which has been widely used for environmental quality evaluation (Xu et al., 2017; Clab et al., 2018). In this study, the PSR model (Wang et al., 2018; Qiu et al., 2022) was applied to establish the indicator system of ecological degradation in the YRB. It can strengthen the correlation between the indicators (Wolfslehner & Vacik, 2008), so that the index system has a strong theoretical basis.
Pressure increases the vulnerability of ecological environment. The pressure layer included seven indicators: the annual rainstorm, annual heavy rain days, annual dry days, precipitation intensity, urbanization rate, population density, and per capita GDP. Due to the large latitude and longitude span of the YRB, precipitation has spatial and temporal heterogeneity. In order to reflect the impact of climatic variations on the ecological environment of the YRB, we chose the annual dry days and precipitation intensity to reflect the dry and wet conditions and rainfall intensity in different areas of the YRB. The climate in the upper YRB is dry, the middle YRB is affected by rainfall and the terrain of the Loess Plateau, and the soil erosion is serious. The lower YRB is prone to floods due to the low terrain. So the annual rainstorm and the annual heavy rain days are selected to reflect the impact of different intensities of rainfall on the ecological environment. Among them, the rainstorm refers to the consecutive 24-h rainfall of more than 50 mm, heavy rain refers to the consecutive 24-h rainfall of more than 20 mm, and drought refers to the consecutive 24-h rainfall of less than 1 mm (i.e., no rain). The precipitation intensity is the ratio of total daily precipitation to 24 h. The population density of the YRB is 143 persons per km2, which is higher than the national average of 134 persons per km2 (YRCC, 2020). Considering the widespread impact of population growth (Sun et al., 2018), We chose the population density index to reflect the population pressure carried by the ecological environment of the YRB. After 2000, the average annual growth rate of GDP in the YRB was as high as 14.1%, which was also higher than the national average (YRCC, 2020). The rapid economic development, accompanied by the continuous expansion of cities, has brought about tremendous changes in the landscape and ecosystem structure of the YRB. Therefore, the per capita GDP indicator and the urbanization rate indicator are also included in the pressure indicator.
State represented the structure of the ecological environment. The land use is both the cause and the result of environmental change (Turner et al., 2007), and it is an important source of information for understanding the interaction between human activities and the ecological environment (El-Hamid et al., 2020). The landscape pattern based on land use determines the distribution form of the environment and it has a significant impact on the stability of the ecological environment (Paukert et al., 2011; Liu et al., 2012). Landscape ecological risk is the adverse consequence of the interaction between landscape patterns and ecological processes under the influence of natural or human factors (Xu et al., 2021). Landscape ecological risk index is often used to assess and predict the impact of human activities and natural disasters on the structure and function of regional landscapes (Peng et al., 2015). Therefore, we selected the landscape ecological risk index and the proportion of woodland, grassland, cultivated land, water, construction land, and unused land to represent the actual ecological environment state of the YRB.
Response refers to the environmental protection and some improvement measures taken by the government to solve the problem of ecological degradation (Sun et al., 2016). The construction of reservoirs not only brings huge social and economic benefits to the YRB in terms of water storage, power generation, flood control and irrigation, but also can change the fluvial morphology and the spatial-temporal distribution of water resources. This directly or indirectly affects the ecological environment (Qiu et al., 2019). Reservoir dispatch management has important practical significance for further improving the ecological health of the YRB (Bai et al., 2020). In this paper, we chose the number of reservoirs and the total capacity of reservoirs to represent the government’s response to the protection of ecological environment quality in the YRB. Since soil erosion is the most important ecological problem in the YRB, we chose the area of soil erosion control to represent the positive feedback from the government. In addition, we use the proportion of environmental protection expenditure to directly reflect the government’s investment in ecological protection of YRB. The above four indicators construct the response layer index. The ecological degradation index system of the YRB based on the PSR model included three layers and 18 secondary indicators (Table 1).
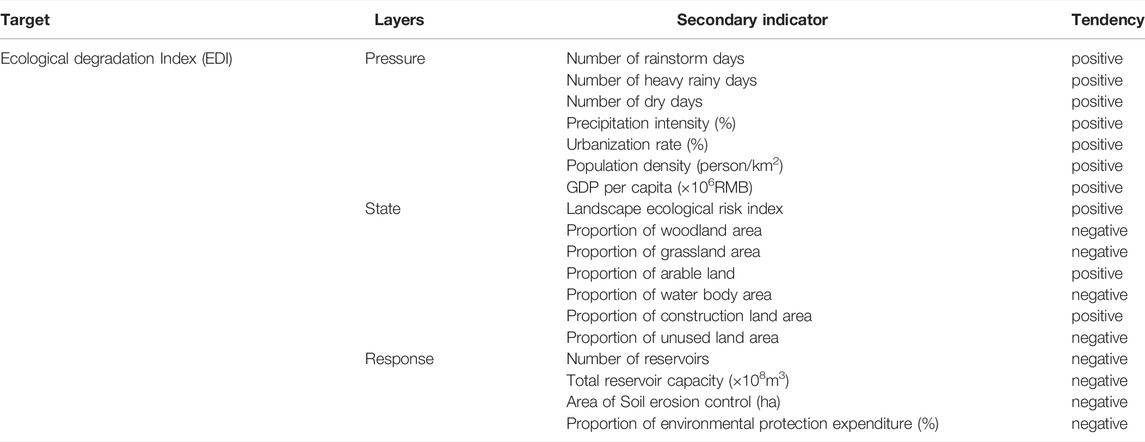
TABLE 1. Selection of indicators for ecological degradation assessment in the Yellow River Basin.
According to the impact of indicators on ecological degradation, it can be divided into positive indicators and negative indicators. The higher the positive index value, the greater the impact on ecological degradation, and vice versa. Because the pressure indicators accelerate the degradation of ecological environment in the YRB, they are all positive indicators. In the state layer, since woodland, grassland, and water bodies contribute to the conservation of soil and water in the ecological environment, they are negative indicators. Unused land does not change the structure of the ecosystem, and its state is relatively stable, so the area of unused land is also a negative indicator. However, cultivated land and construction land have a high degree of land reclamation, which seriously damages the original structure of the ecosystem and promotes ecological degradation. Therefore, cultivated land and construction land are positive indicators. Similarly, landscape ecological risk describes the fragmentation of landscape structure, which is also a positive indicator. Here we attached remarkable importance to the role of reservoir in the ecological environment. On the one hand, the reservoir can divert water and have positive effects on flood control and drought mitigation. On the other hand, the water quality of the water storage area deteriorates and submerges the surrounding land, which has a negative effect on the ecological environment. However, in our study area, the reservoir is mainly for irrigation, regulation of water and sediment, generation of electricity and flood control (Zhang et al., 2021), the positive effects outweigh the negative effects. Therefore, we defined the number of reservoirs and the total reservoir capacity as negative indicators. Then, the secondary indicators were dimensionless processed by extreme standardization method. The indices with positive ecological impacts were standardized using Eq. 1, the indices with negative ecological impacts were standardized using Eq. 2:
where
In this paper, the weight of each index was obtained, based on the principal component analysis (PCA) method, which can eliminate the influence of commonality between variables, and automatically and objectively assign the weight according to the contribution of each factor to the principal component (Hu and Xu, 2018). The subjectivity of human decision can be greatly reduced. If the cumulative variance contribution rate of the principal component factors is greater than 70%, it means that the principal component has a good explanatory ability to the total difference with convincing reliability of the data. The cumulative variance contribution rate calculation equation is as follows:
Where
In this paper, the cumulative contribution rate of the principal components calculated by SPSS software (https://www.ibm.com/analytics/spss-statistics-software) is above 84% (As shown in Table 2), implying the reliability of analysis of this current study. Therefore, we used SPSS software to calculate the weights of indicators. The method of calculating the index weight using the principal component analysis method is as follows:
a. Calculate the coefficient of the corresponding indicator in each principal component. The specific calculation equation is as follows:
Where
b. Use the cumulative variance contribution rate of the principal components to determine the comprehensive score coefficient. The specific calculation equation is as follows:
Where
c. Calculate indicator weights. The specific calculation equation is as follows:
Where
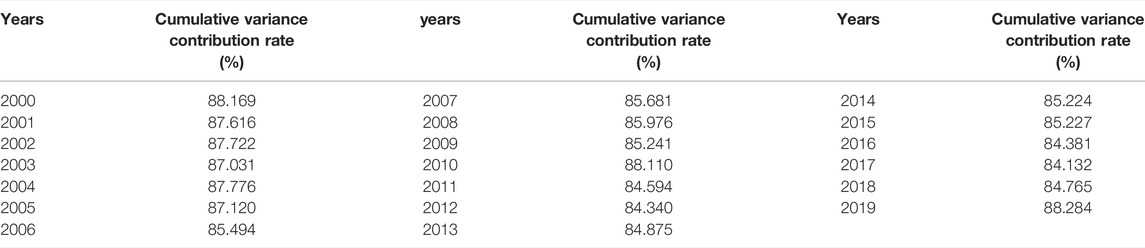
TABLE 2. Cumulative variance contribution rate (%) of principal components obtained by principal component analysis from 2000 to 2019.
Then, the normalized value of each indicator was multiplied by the corresponding weight to calculate the final Ecological Degradation Index (EDI). The specific calculation equation is as follows:
Where
The greater the value of EDI, the higher the degree of ecological degradation, indicating the worse quality of the ecological environment. The EDI is divided into five grades to compare the ecological degradation intensity in different parts of the YRB.
The landscape ecological risk assessment focuses on spatiotemporal heterogeneity and its scale effect, and risk zoning is an important step to improve the accuracy of ecological risk indicators and the spatial visualization of ecological risk (Fan et al., 2016). Landscape metrics vary with scale (or size) (Gal et al., 2007). In this paper, we considered the resolution of CLDAS data (0.0625°×0.0625°) and the size of the study area, and it was found that 0.125°×0.125° could better reflect the spatial differences of the ecological degradation areas in the YRB and facilitate the unified calculation of indicators. Therefore, we performed equidistant sampling based on ArcGIS, and divided the study area into 5,671 units with a scale of 0.125° × 0.125°. In data processing, grids were used as small research units for spatial sampling, and the landscape ecological risk index value for each ecological unit was calculated from the landscape pattern index. The Fragstats software (https://fragstats.software.informer.com/) was used to calculate the landscape pattern: Edge Density (ED), Area-weighted Mean Shape Index (SHAPE_AM), Patch Cohesion Index (COHESION), Aggregation Index (AI), Interspersion Juxtaposition Index (IJI) Largest Patch Index (LPI). They can reflect ecological changes between different regions.
The landscape fragmentation index (Fi), landscape disturbance index (Di), and landscape dominant index (Doi) were constructed, based on the landscape pattern indices selected above. The landscape vulnerability index (Vi) was superimposed to calculate the final Landscape Ecological Risk Index (ERI) (Peng et al., 2010). The landscape fragmentation index (Fi) represents the process of landscape type transformation from a single continuous entirety to a complex discontinuous patch (Llausas and Nogue, 2012). The larger the value, the lower the stability of the corresponding landscape ecosystem. The landscape pattern index obtained based on Fragstats software represents the influence of different land object types and their structure, distribution and other characteristics on the landscape, and is multiplied by the corresponding weight to calculate the Di (Peng et al., 2010), where Di represents the degree of separation between different patches in the landscape type, and the larger the value, the more complex the corresponding spatial distribution of the landscape. The landscape dominance index (Doi) indicates that a region takes a single or multiple landscape types as the overall landscape, which directly reflects the impact of this landscape type on the landscape pattern (Liu et al., 2020). The landscape vulnerability index (Vi) reflects the vulnerability of different ecosystems, and the vulnerability level can reflect the sensitivity and resilience of the landscape to external risk disturbances. The greater the vulnerability of the landscape, the greater the ecological risk. The landscape ecological risk index is as follows:
where
where a, b, c, d, e, and f are the weights of the corresponding landscape indices, which are calculated by the CRITIC objective weighting method. The formula for calculating the weight of the CRITIC method is as follows:
a. Calculate the standard deviation of the jth indicator. In the CRITIC method, the standard deviation is used to represent the difference and fluctuation of the internal values of each indicator. The larger the standard deviation, the greater the numerical difference of the indicator, the more information it can reflect and the more weight should be assigned to the indicator. The specific calculation is as follows:
Where
b. Carry out the conflict test of the indicators, the conflict between the indicators is represented by the correlation coefficient. The stronger the correlation with other indicators, the less conflict between the indicator and other indicators and the more evaluation content can be reflected. The repetition will weaken the evaluation strength of the indicator to a certain extent, and the weight assigned to the indicator should be reduced. The specific calculation is as follows:
Where
c. Calculate the information flux of the indicator. The larger the value of information flux, the greater the role it plays in the entire indicator system, and more weights should be assigned to it. The specific calculation formula is as follows:
Where
d. Weight calculation. The specific calculation formula is as follows:
Where
The weight and ecological significance of the landscape ecological risk index we selected are shown in Table 3.
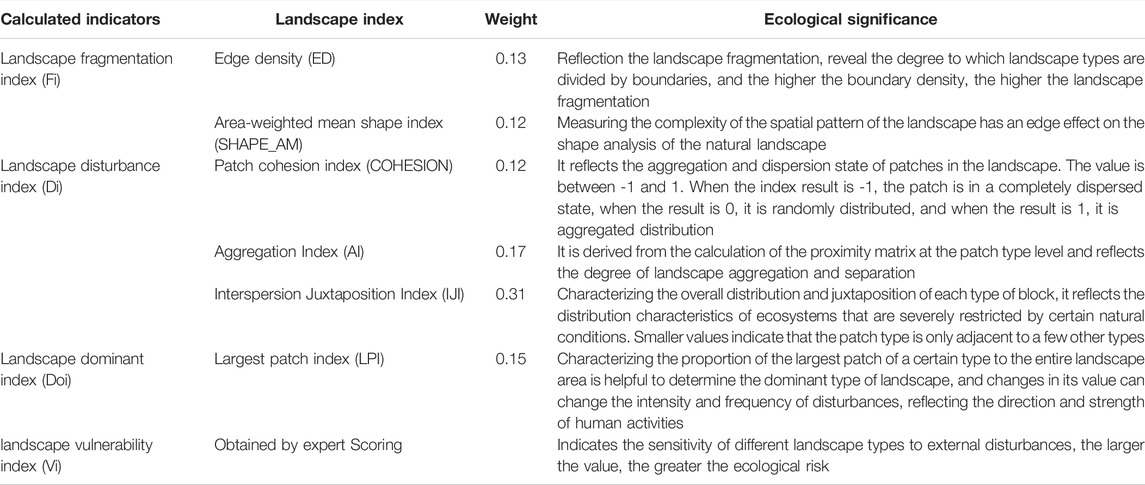
TABLE 3. Landscape index weights and their ecological significance.
Landscape vulnerability index (Vi) refers to the vulnerability of the landscape ecosystem when encountering different factors. Generally, the lower the ecosystem level, the higher the internal vulnerability of the system. It was generally obtained through expert scoring. Generally speaking, the vulnerability of unused land, water, cultivated land, grassland, woodland, and constructed land was 6, 5, 4, 3, 2 and 1. Then normalization was performed to obtain the respective vulnerability indices Vi (Qiao et al., 2021).
Finally, after analysis of the landscape ecological risk index value of 5,671 ecological units, mapping of the landscape ecological risk index was done by the Kriging interpolation method in ArcGIS (https://www.esri.com/). The landscape ecological risk index value was classified using the natural breakpoint method: the lowest ecological risk (7.0–7.8), the lower ecological risk (7.8–8.2), the medium ecological risk (8.2–8.5), the higher ecological risk (8.5–8.8), and the highest ecological risk (8.8–9.2).
In this study, the Mann-Kendall trend test method (Jiang et al., 2015) was used to decide the ecological degradation index and the trend of the six land use types. Trends were divided into three grades: increasing trend (Zs>0), decreasing trend (Zs<0), and no trend (Zs=0). Significance was quantified at the 0.05 significance level.
From 2000 to 2019, the pressure index of the YRB continued to rise, indicating increasing pressure, and the spatial pattern of pressure index showed decreasing pressure from upper to lower YRB. The pressure intensity was the greatest in Henan and Shandong provinces with the highest population density and high level of economic development (Figure 2A). For the secondary indicators of the pressure layer, the number of heavy rain days and the precipitation intensity showed the same spatial distribution as the pressure index, and gradually increased from northwest to southeast of the YRB (Figures 2B,C), while the number of dry days gradually decreased from north to south of the YRB. Inner Mongolia and northern Ningxia province had the highest average number of dry days (Figure 2D), while Sichuan province had the least number of dry days. The urbanization level across the YRB was higher in the middle and lower YRB and lower urbanization in the upper YRB. Inner Mongolia had the highest urbanization rate, and Qinghai Province had the slowest urbanization rate (Figure 2E). The spatial pattern of urbanization rate was in line with that of per capita GDP (Figure 2G). Therefore, we found that the higher the urbanization rate and per capita GDP, the higher the pressure index value, such as in Shandong Province in the lower YRB, while the upper YRB was dominated by lower urbanization rate and per capita GDP, and hence lower pressure index, implying that urbanization was conducive to economic development, but it would also bring greater pressure on the ecological environment. Meanwhile, the population density of Shandong Province was much higher than that of other provinces (districts) over the YRB, and the spatial distribution of population density was similar to that of the pressure index (Figure 2F), indicating that population density had remarkable impacts on pressure.
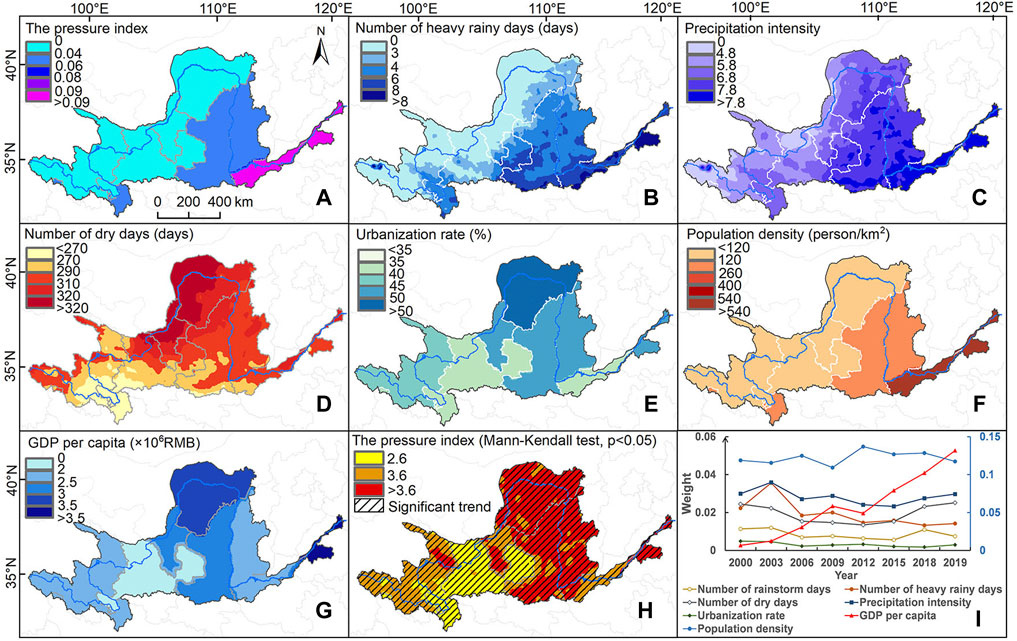
FIGURE 2. Spatial distribution of pressure index (A), spatial distribution of pressure layer indicators (B–G), Mann-Kendall test results of pressure index at the 0.05 significance level (H), the trend of pressure layer indicator weight over time (I).
The pressure in the Yellow River Basin showed an increasing trend during 2000–2019 (Figure 2H). The largest magnitude of trends of pressure can be found in Inner Mongolia, Shaanxi, Shanxi, Henan, and Shandong Province and even 99.93% of the YRB was dominated by increasing pressure, indicating that the ecological environment of the YRB was under enormous pressure. Therefore, it is critical to take reasonable and effective measures to alleviate the pressure on the ecological environment of the YRB. It can be seen from Figure 2I that the weight of population density indicator is the highest, indicating the greatest impact of population density on the pressure. Among climatic factors, before 2013, precipitation had a greater impact than drought on pressure, meanwhile the impact of drought on pressure was enhancing. After 2013, the weight of the drought indicator exceeded the weight of precipitation intensity and the number of heavy rain days, indicating that the drought had an amplifying impact on the ecological pressure (Gampe et al., 2021). Therefore, negative impacts of dry weather on the ecological environment of the YRB should arouse considerable concern.
In the past 20 years, the spatial distribution of the state index increased from east to west of the YRB, and the difference between the north and the south of the YRB was obvious (Figure 3A). Grassland is the dominant land use type in the YRB, which is mainly distributed in the upper YRB and specifically the Mu Us Sandy Land, accounting for 49.96% of the total area of the YRB. Cultivated land and woodland accounted for 30.25 and 15.03% of the YRB. The cultivated land is mainly distributed in the Hetao Plain in the upper YRB, the Fenhe-Weihe Basin in the middle YRB, as well as the plains and valley basins in the lower YRB with good water and heat conditions in Shaanxi Province and southern Shanxi Province.
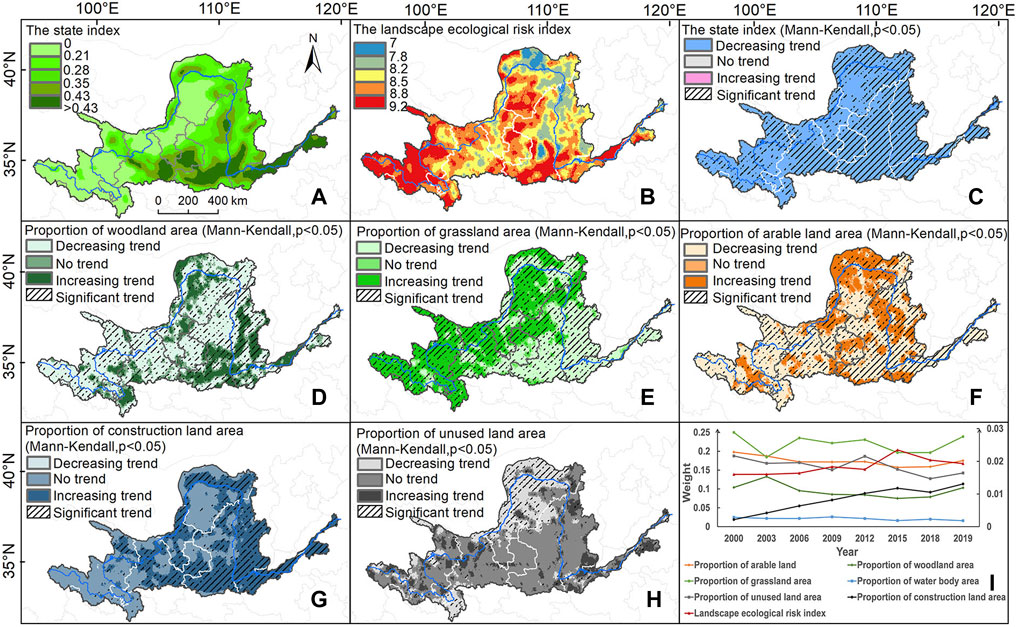
FIGURE 3. Spatial distribution of state index (A), spatial distribution of landscape ecological risk index (B), Mann-Kendall test results of state layer indicators at the 0.05 significance level (C–H), the trend of weights of each indicator over time (I). Note: The weight values of grassland, arable land and woodland correspond to the left axis of Figure 3I, and the weight values of construction land, water body and unused land correspond to the right axis of Figure 3I.
The land use of the watershed changed significantly in its spatial distribution and area during the study period. Based on the results of the Mann-Kendall trend test, the increased woodland area accounted for 25.37% of the total watershed area., while the decreased woodland area reached 59.71%, of which 39.9% passed the 0.05 significance level. Among them, Alxa, northwestern Ordos City, southern Shaanxi Province, Luliang City, Linfen City, Heze City, and Jining City showed an increasing trend of woodland (Figure 3D). Changes in the woodland area followed a “decreasing-increasing-decreasing” temporal pattern during the past 20 years, and the overall area of the woodland had decreased by 0.8%. The decrease of woodland was started by early agricultural reclamation activities, and vegetation restoration due to environmental protection policies, such as the project of Grain for Green which triggered the increase of woodlands, which was followed by decrease of woodland due to increased demand for land for agricultural development, urban construction, etc.
We found increasing grassland area over 50.29% of the YRB, located in upper YRB, specifically the Mu Us sandy land (Figure 3E). Under the influence of natural factors and various ecological protection projects, the vegetation of the Mu Us Sandy Land has basically been restored (Xiu et al., 2018). The area with decreasing grassland accounted for 39.18% of the YRB, mainly concentrated in the lower YRB. In order to promote rapid economic development, grassland and cultivated land were continuously converted into construction land. As a result, the construction land area in the lower YRB increased dramatically (Figure 3G). Meanwhile, 56.2% of the regional construction land in the entire YRB had an increasing tendency, no evident changes in 43.7% of the regional construction land and a decreasing tendency in only 0.1% of the regional construction land.
We also found decreasing arable land which accounted for 65.97% of the YRB. In the upper YRB and the Loess Plateau, the conversion of land types from arable land to woodland and grassland is remarkable due to ecological protection projects initiated by Chinese government, while the arable land in the lower YRB was mainly converted to the construction land. The area of the increased cultivated land accounted for 22.68% of the YRB (Figure 3F). Specifically, the Hetao Plain is of flat terrain and good soil quality with an irrigation area of 11 million acres (HIAAB/BWCB, 2007). It is one of the three largest irrigation areas in China and an important commercial grain base in Ningxia and Inner Mongolia (Kerschbaumer et al., 2015), where the area of arable land increased significantly. In addition, the area of cultivated land is increasing in Yulin City, Shaanxi Province, which is located in the agricultural and animal husbandry interlaced belt in North China. This is mainly due to the implementation of land engineering (Wu et al., 2019) in Yulin City, where agriculture is the main industry for the growing demand of food. In addition, 11.36% of the regional cultivated land area is relatively stable and no changes can be detected.
We found little changes in 55.95% of the unused land area within the YRB, while an increasing tendency was detected in 19.59% of the unused land area. Another 24.46% of the unused land showed a decreasing trend (Figure 3H). The decreased unused land areas were mainly distributed in the Hetao Plain and the Ningxia Plain, and most of them were converted into woodland and arable land.
The landscape Ecological Risk Index (ERI) witnessed a persistent decrease from 2000 to 2016, and shifted to increase from 2016 to 2019. The increase of ERI was mainly due to the conversion of landscape types. The expansion of construction land and traffic roads encroached large areas of woodland and arable land, and the shape of the landscape pattern became irregular and diversified, resulting in a decrease in the anti-interference ability. In terms of the spatial distribution, areas with the lowest ecological risk accounted for 4.43%, the lower ecological risk areas accounted for 11.16%, medium ecological risk areas accounted for 21.02%, higher ecological risk areas accounted for 29.48%, and highest ecological risk areas accounted for 33.91% of the YRB, respectively (Figure 3B). Among them, the source of Yellow River, Ordos city’ Xi’an city, Weinan city, and the Henan province had the highest landscape ecology risk.
The larger the value of the state index, the more complex the structure of the ecological landscape. Based on Figure 3I, we found that grassland, cultivated land, and woodland were assigned a larger weight, indicating large contributions of these land types to the state index, while water bodies, construction land, and unused land had minor contribution to the state index. It is due to the fact that the landscape structure of the YRB is mainly grassland, cultivated land, and woodland, and these land types account for 94.65% of the YRB with high vulnerability to external driving factors. Land use and land cover conversion amongst these three land types have remarkable impacts on the state index. From 1999 to 2012, the total woodland area of Ningxia, Shaanxi, and Shanxi provinces accounted for 11.20% of the total area of these three provinces (Xiao, 2015). The vegetation coverage of the Loess Plateau almost doubled. Large-scale afforestation and ecological protection projects tended to green the YRB (Fu et al., 2016).
The response index had an increasing tendency during a period from 2000 to 2019 (Figure 4G), indicating that the government have been responding positively to the ecological degradation of the YRB. Figures 4B,C show that the Aba Prefecture and Shandong Province had the largest number of reservoirs, Qinghai Province, Henan, and Shandong Province had the largest total reservoir capacity, indicating that reservoirs played a great role in water governance in the upper and lower reaches in the YRB. The upper reaches of the YRB is mainly used for water conservation and the lower reaches of the YRB for water and sediment regulation. The area of soil erosion control in the middle and lower YRB is significantly higher than in the upper YRB (Figure 4D), indicating that the ecological protection measures in the middle and lower YRB are mainly for soil erosion control. The proportion of environmental protection expenditures in the upper and middle YRB is significantly higher than in the lower YRB (Figure 4E), indicating that the environmental protection in the downstream YRB is not enough, the investment in environmental protection should be increased and the restoration of ecological environmental should be strengthened. Among all the response indicators, the area of soil erosion control was assigned to the largest weight (Figure 4H), indicating that the control of soil erosion is the most critical measure for the ecological protection of the YRB. The second is the influence of reservoirs in significantly changing the hydraulic conditions of the natural rivers (Xu et al., 2018). In order to store and use water efficiently, the government has carried out large-scale reservoir construction activities and achieved relatively high benefits. However, because of severe soil erosion and excessive sediment production in the YRB, the long-term safe storage capacity of reservoirs is at risk of being reduced (Liu et al., 2018).
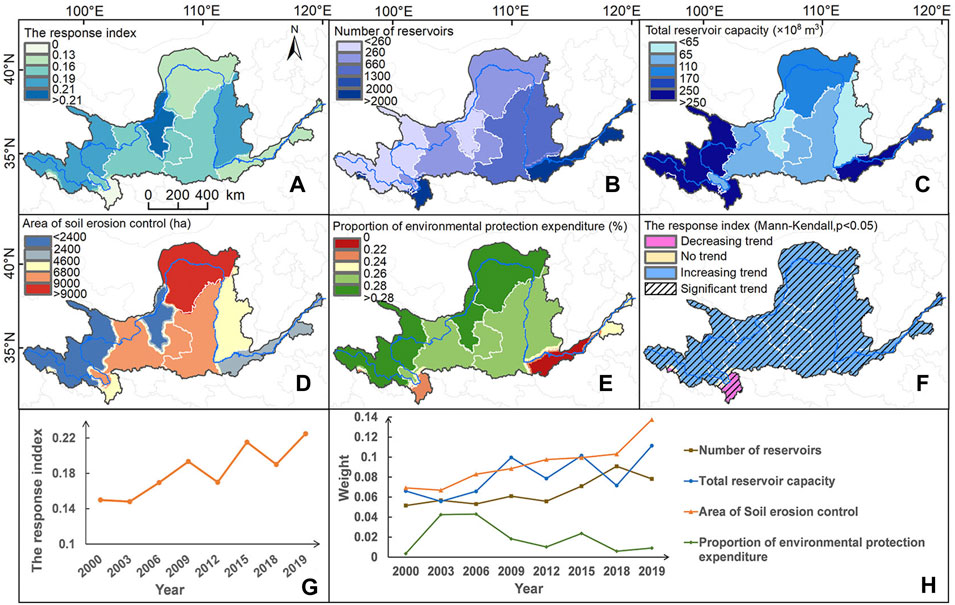
FIGURE 4. Spatial distribution of response index (A), spatial distribution of response layer indicators (B–E), Mann-Kendall test results of response index at the 0.05 significance level (H), time change of stress index (G), and change of each indicator weight over time trend (H).
We divided the ecological degradation indices into 5 grades to evaluate the magnitude of degradation intensity: grade I (0–0.42), grade II (0.42–0.52), grade III (0.52–0.62), grade IV (0.62–0.72) and V grade (>0.72) (Figure 5). From the perspective of time scale, the EDI of the watershed increased from 2000 to 2002 (Figure 5I), and the ecology continued to degrade. From 2003 to 2005, the ecological degradation was alleviated and it showed a downward trend. The main reason is that in 2002, the government fully launched the ecological protection project of returning farmland to forests. At the same time, policies and measures, such as pollution control and soil erosion control, were conducted, which jointly promoted the improvement of the ecological environment quality of the YRB. However, as the poverty elimination goal stimulated economic development and exacerbated man-land relations, the area of woodland and grassland showed a decreasing trend in 2005 with increased built-up areas. In addition, due to the imperfect compensation mechanism for returning farmland to forest and grassland, some farmers had converted woodland for agricultural purposes (Bennett, 2008; Song et al., 2014). Affected by the climate, there occurred rainstorms in 2005, where the precipitation intensity was high. Multiple factors led to the increasing trend of EDI in 2005 and the decline of the ecological environment quality of the YRB. We detected moderate changes in EDI during a period from 2005 to 2012. The increase of EDI occurred since 2013, reaching its peak value in 2019. On the one hand, it is due to pressure of human activities and the economic development. On the other hand, the compensation forest species in Grain-to-Green project ended in 2011 for more agricultural production and economic development and crop planting was resumed. These lands may undergo repeated logging and land type replacement, making the ecosystem structure of the YRB more fragile (Guo & Gong, 2016).
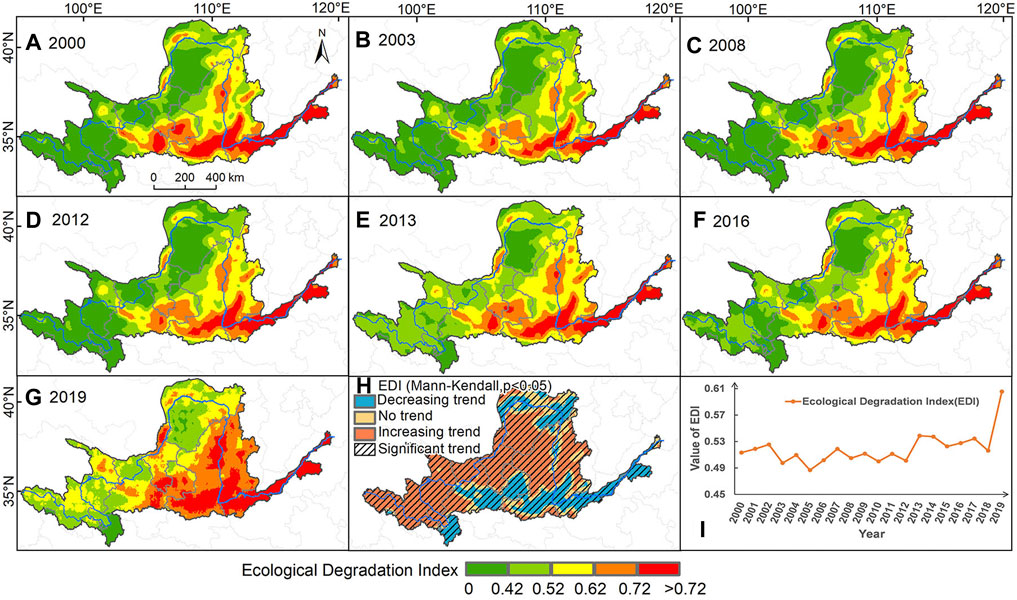
FIGURE 5. Spatial distribution of ecological degradation index EDI in 2000, 2003, 2008, 2012, 2013, 2016 and 2019 (A–G), Mann-Kendall test results at the 0.05 significance level of EDI (H), and the trend of ecological degradation index over time (I).
Although the government started the second phase of the Grain-to-Green project in 2014, the grassland has continued to increase. Recent years witnessed increasing impacts of human activities, alongside the rapid economic growth, on degradation of ecological environment quality. In terms of spatial distribution, the EDI intensity is the highest in the lower YRB because of the massive pressure on population and economic development. The upper reaches of the YRB are least affected by human activities and have the lowest EDI intensity.
Approximately 69.9% of the regional ecological environment further degraded from 2000 to 2019, while 29.5% of the regional ecological environment improved (Figure 5H). The intensity of ecological degradation in different times and spaces was affected by the comprehensive effects of climate change, human activities, socio-economic development, and land use and land cover conversion. Although Hebei and Shandong provinces had the highest intensity of ecological degradation, they also had a higher degree of response to ecological degradation, so the intensity of ecological environment degradation gradually decreased. The EDI of Gansu Province, Shaanxi Province, southern parts of Shanxi Province, eastern parts of Bayannur City, Inner Mongolia, and Baotou City had a decreasing tendency, and the ecological environment gradually improved, while in most areas of Qinghai Province, Lanzhou, Ningxia, Ordos City, and Yulin City, Taiyuan City and Yangquan City, the intensity of ecological degradation continued to increase.
In this paper we found that population density was proportional to the pressure index. The rapid population growth was the main factor driving the increase in pressure, and the contribution rate of population density to the pressure index is 54.5%. The contribution of precipitation to the pressure index was second, with a contribution rate of 21.2%. The impact of drought on the pressure index continued to increase, which can be attributed to drought-induced water shortage, enhancing vegetation degradation and land desertification, modifying the structure and stability of the ecological environment, rendering the YRB more prone to degradation. The implementation of ecological protection projects, such as Grain-to-Green project, has greatly increased the vegetation coverage, which has played a key role in controlling soil erosion. However, Chen, 2015 believed that continued expansion of vegetation would potentially exert negative impacts on eco-environment because of the introduction of exotic plant species and high-density planting. Therefore, in order to ensure the sustainable and high-quality development of the YRB, attention should be paid to the balance between food supply and vegetation coverage suitable for climatic conditions, water supply and soil erosion, so as to maintain a good historical landscape in the YRB.
In this current study, we used 18 indicators to develop a comprehensive evaluation index system for ecological degradation assessment and grade zoning. By mapping of the EDI in the YRB, the intensity of ecological degradation in different regions can be visually presented. Moreover, the Mann-Kendall trend test was used to determine the areas where the degree of ecological degradation was enhanced or improved. The main conclusions of this paper are as follows:
(1) From 2000 to 2019, the pressure on the ecological environment of the Yellow River Basin has continued to increase, and the rapid population growth is the main driving factor. The stimulus of economic development and the increase of drought days under the background of climate warming have an increasing impact on the ecological pressure of the YRB. The government should strengthen the allocation of resources in various cities, especially in the densely populated lower reaches of the YRB in Henan Province and Shandong Province, and carry out rational control between population and resources. For green spaces and forests that have not yet been developed or have been slightly damaged by humans, natural restoration is the main focus, and human intervention is minimized. Optimize the development pattern of land resources, and limit economic activities to the range that the resources and environment can bear. Strengthen the construction of flood control facilities in the lower reaches of the YRB, and strengthen the conservation and utilization of water resources in the upper reaches of the YRB, such as Ningxia Province and Inner Mongolia, and optimize the water use structure.
(2) During 2000 to 2019, the area of grassland and construction land increased in an accelerating way, while the arable land decreased, and the area of woodland also decreased slowly. These four land use types are dominant over the fluvial landscape of the YRB, accounting for 96.5% of the total area of the YRB. In addition, due to no coordination amongst food demand, ecological protection demand, and ecological compensation, there occurred frequent conversions between land use types. With the enhancement of human activities, the landscape diversity gradually decreased and the landscape fragmentation increased, and the intensity of ecological degradation in the YRB was increasing. It is necessary to strengthen the modernization of agriculture according to local conditions. For example, we should strengthen centralized grain production in areas with suitable climate and sufficient water resources, such as the Hetao Irrigation Area, the Fenwei Basin, and the Ningxia Plain, and develop these areas into key grain bases. Convert other areas with scattered arable land and normal crop planting conditions into forest land or nature reserves. Especially Gansu and Shaanxi provinces should continue to expand the construction of forest land and grassland.
(3) In the process of ecological degradation governance, soil erosion control is the most critical ecological improvement measure, and downstream areas of the YRB need to increase investment and construction for ecological environmental protection. Strengthen the utilization efficiency of reservoirs, develop new functions of reservoirs and promote major projects such as embankment construction, river regulation, floodplain management, and ecological restoration as a whole.
(4) The overall ecological environment of the YRB presents an obvious trend of degradation, and the EDI in the lower YRB is the highest. The ecological environment of Qinghai Province, Lanzhou City, Ningxia, Ordos City, and Yulin City, Taiyuan City and Yangquan City are further degraded. The protection is far from enough, and more and more reasonable protection measures must be taken to curb the ecological degradation as soon as possible. For example, the construction of artificial afforestation and nature reserves has been increased in Ningxia and Gansu provinces, and comprehensive environmental management has been strengthened in Henan and Shandong provinces in the lower reaches of the YRB.
Publicly available datasets were analyzed in this study. This data can be found here: The precipitation data The China Meteorological Administration Land Data Assimilation System (CLDAS), http://data.cma.cn/. The land use data: ESA (European Space Agency), http://maps.elie.ucl.ac.be/CCI/viewer/Statistical yearbooks of provinces within the Yellow River Basin.
TL is responsible for the conceptualization, methodology, data analysis, and writing- Original draft preparation. QZ: gave the necessary guidance and the original revision of the paper (TL and QZ have the equal contribution to this paper.) VS: proposed amendments and review for this paper. JZ and JS: provided help to the data management and analysis of this paper. SS: supported the Meteorological data of this paper. GW, ZS, WW: Reviewing and Editing.
This research has been supported by The Major Science and Technology Projects of Inner Mongolia Autonomous Region (2020ZD0009) and Collaborative Innovation Center for Integrated Management of Water Resources and Water Environment in the Inner Mongolia Reaches of the Yellow River, Hohhot, China.
The authors declare that the research was conducted in the absence of any commercial or financial relationships that could be construed as a potential conflict of interest.
All claims expressed in this article are solely those of the authors and do not necessarily represent those of their affiliated organizations, or those of the publisher, the editors and the reviewers. Any product that may be evaluated in this article, or claim that may be made by its manufacturer, is not guaranteed or endorsed by the publisher.
Abd El-Hamid, H. T., Caiyong, W., Hafiz, M. A., and Mustafa, E. K. (2020). Effects of Land Use/land Cover and Climatic Change on the Ecosystem of North Ningxia, China. Arab. J. Geosci. 13, 1–13. doi:10.1007/s12517-020-06047-6
Bai, T., Liu, X., Ha, Y.-p., Chang, J.-x., Wu, L.-z., Wei, J., et al. (2020). Study on the Single-Multi-Objective Optimal Dispatch in the Middle and Lower Reaches of Yellow River for River Ecological Health. Water 12 (3), 915. doi:10.3390/w12030915
Bennett, M. T. (2008). China's Sloping Land Conversion Program: Institutional Innovation or Business as Usual? Ecol. Econ. 65, 699–711. doi:10.1016/j.ecolecon.2007.09.017
Chen, Y., Syvitski, J. P. M., Gao, S., Overeem, I., and Kettner, A. J. (2012). Socio-economic Impacts on Flooding: a 4000-year History of the Yellow River, China. Ambio 41, 682–698. doi:10.1007/s13280-012-0290-5
Chen, Y., Wang, K., Lin, Y., Shi, W., Song, Y., and He, X. (2015). Balancing Green and Grain Trade. Nat. Geosci. 8, 739–741. doi:10.1038/ngeo2544
Chiyuan Miao, C., Jinren Ni, J., and Borthwick, A. G. L. (2010). Recent Changes of Water Discharge and Sediment Load in the Yellow River Basin, China. Prog. Phys. Geogr. Earth Environ. 34, 541–561. doi:10.1177/0309133310369434
Das, S., Pradhan, B., Shit, P. K., and Alamri, A. M. (2020). Assessment of Wetland Ecosystem Health Using the Pressure-State-Response (PSR) Model: A Case Study of Mursidabad District of West Bengal (India). Sustainability 12, 5932. doi:10.3390/su12155932
Dongguang, W., Fawang, Z., Eryong, Z., Cunrong, G., and Han, Z. (2008). Outline of the Yellow River Basin, China. Bull. Geol. Surv. Jpn. 60, 9–18. doi:10.9795/bullgsj.60.9
Fan, J., Wang, Y., Zhou, Z., You, N., and Meng, J. (2016). Dynamic Ecological Risk Assessment and Management of Land Use in the Middle Reaches of the Heihe River Based on Landscape Patterns and Spatial Statistics. Sustainability 8, 536. doi:10.3390/su8060536
Fu, B., Wang, S., Liu, Y., Liu, J., Liang, W., and Miao, C. (2017). Hydrogeomorphic Ecosystem Responses to Natural and Anthropogenic Changes in the Loess Plateau of China. Annu. Rev. Earth Planet. Sci. 45, 223–243. doi:10.1146/annurev-earth-063016-020552
Gampe, D., Zscheischler, J., Reichstein, M., O’Sullivan, M., Smith, W. K., Sitch, S., et al. (2021). Increasing Impact of Warm Droughts on Northern Ecosystem Productivity over Recent Decades. Nat. Clim. Chang. 11, 772–779. doi:10.1038/s41558-021-01112-8
Gorla, L., and Perona, P. (2013). On Quantifying Ecologically Sustainable Flow Releases in a Diverted River Reach. J. Hydrology 489, 98–107. doi:10.1016/j.jhydrol.2013.02.043
Guo, J., and Gong, P. (2016). Forest Cover Dynamics from Landsat Time-Series Data over Yan'an City on the Loess Plateau during the Grain for Green Project. Int. J. Remote Sens. 37, 4101–4118. doi:10.1080/01431161.2016.1207264
Heinrichs, J. A., Bender, D. J., and Schumaker, N. H. (2016). Habitat Degradation and Loss as Key Drivers of Regional Population Extinction. Ecol. Model. 335, 64–73. doi:10.1016/j.ecolmodel.2016.05.009
HIAAB/BWCB (2007). Introduction to Inner Mongolia Hetao Irrigation. Hetao Water Resources. In Inner Mongolia Hetao Irrigation Administration Bureau/Inner Mongolia Bayannur Bureau of Water Resources. Available from: http://www.zghtgq.com/plus/list.php?tid=43 ((in Chinese).
Hu, X., and Xu, H. (2018). A New Remote Sensing Index for Assessing the Spatial Heterogeneity in Urban Ecological Quality: a Case from Fuzhou City, China. Ecol. Indic. 89, 11–21. doi:10.1016/j.ecolind.2018.02.006
Huang, J., Guan, X., and Ji, F. (2012). Enhanced Cold-Season Warming in Semi-arid Regions. Atmos. Chem. Phys. 12 (2), 5391–5398. doi:10.5194/acp-12-5391-2012
Jiang, W., Yuan, L., Wang, W., Cao, R., Zhang, Y., and Shen, W. (2015). Spatio-temporal Analysis of Vegetation Variation in the Yellow River Basin. Ecol. Indic. 51, 117–126. doi:10.1016/j.ecolind.2014.07.031
Kerschbaumer, L., Köbbing, J. F., Ott, K., Zerbe, S., and Thevs, N. (2015). Development Scenarios on Hetao Irrigation Area (China): a Qualitative Analysis from Social, Economic and Ecological Perspectives. Environ. Earth Sci. 73, 815–834. doi:10.1007/s12665-014-3061-8
Li, H., Zhang, Q., Singh, V. P., Shi, P., and Sun, P. (2017). Hydrological Effects of Cropland and Climatic Changes in Arid and Semi-arid River Basins: a Case Study from the Yellow River Basin, China. J. Hydrology 549, 547–557. doi:10.1016/j.jhydrol.2017.04.024
Liao, C., Yue, Y., Wang, K., Fensholt, R., Tong, X., and Brandt, M. (2018). Ecological Restoration Enhances Ecosystem Health in the Karst Regions of Southwest China. Ecol. Indic. 90, 416–425. doi:10.1016/j.ecolind.2018.03.036
Liu, D., Chen, H., Zhang, H., Geng, T., and Shi, Q. (2020). Spatiotemporal Evolution of Landscape Ecological Risk Based on Geomorphological Regionalization during 1980-2017: A Case Study of Shaanxi Province, China. Sustainability 12, 941. doi:10.3390/su12030941
Liu, D., Chen, J., and Ouyang, Z. (2020). Responses of Landscape Structure to the Ecological Restoration Programs in the Farming-Pastoral Ecotone of Northern China. Sci. Total Environ. 710, 136311. doi:10.1016/j.scitotenv.2019.136311
Liu, D. D., Qu, R. J., Zhao, C. H., Liu, A. P., and Deng, X. Z. (2012). Landscape Ecological Risk Assessment in Yellow River Delta. J. Food Agric. Environ. 10, 970–972. doi:10.1016/j.foodres.2011.12.018
Liu, Y., Liu, Y., Li, J., Lu, W., Wei, X., and Sun, C. (2018). Evolution of Landscape Ecological Risk at the Optimal Scale: a Case Study of the Open Coastal Wetlands in Jiangsu, China. Ijerph 15, 1691. doi:10.3390/ijerph15081691
Llausàs, A., and Nogué, J. (2012). Indicators of Landscape Fragmentation: the Case for Combining Ecological Indices and the Perceptive Approach. Ecol. Indic. 15, 85–91. doi:10.1016/j.ecolind.2011.08.016
Niu, L., Guo, Y., Li, Y., Wang, C., Hu, Q., Fan, L., et al. (2021). Degradation of River Ecological Quality in Tibet Plateau with Overgrazing: a Quantitative Assessment Using Biotic Integrity Index Improved by Random Forest. Ecol. Indic. 120, 106948. doi:10.1016/j.ecolind.2020.106948
Patil, R., Wei, Y., Pullar, D., and Shulmeister, J. (2018). Understanding Hydro-Ecological Surprises for Riverine Ecosystem Management. Curr. Opin. Environ. Sustain. 33, 142–150. doi:10.1016/j.cosust.2018.05.021
Paukert, C. P., Pitts, K. L., Whittier, J. B., and Olden, J. D. (2011). Development and Assessment of a Landscape-Scale Ecological Threat Index for the Lower Colorado River Basin. Ecol. Indic. 11, 304–310. doi:10.1016/j.ecolind.2010.05.008
Peng, J., Dang, W. X., Liu, Y. X., Zong, M. L., and Hu, X. X. (2015). Review on Landscape Ecological Risk Assessment. Acta Geogr. Sin., 70:664–677. doi:10.11821/dlxb201504013
Peng, J., Wang, Y., ZhangZhang, Y., Wu, J., Li, W., and Li, Y. (2010). Evaluating the Effectiveness of Landscape Metrics in Quantifying Spatial Patterns. Ecol. Indic. 10, 217–223. doi:10.1016/j.ecolind.2009.04.017
Pettorelli, N., Vik, J. O., Mysterud, A., Gaillard, J.-M., Tucker, C. J., and Stenseth, N. C. (2005). Using the Satellite-Derived NDVI to Assess Ecological Responses to Environmental Change. Trends Ecol. Evol. 20, 503–510. doi:10.1016/j.tree.2005.05.011
Qiao, F., Bai, Y., Xie, L., Yang, X., and Sun, S. (2021). Spatio-Temporal Characteristics of Landscape Ecological Risks in the Ecological Functional Zone of the Upper Yellow River, China. Ijerph 18, 12943. doi:10.3390/ijerph182412943
Qiu, J., Li, T.-J., and Li, F.-F. (2019). Evaluation of Environmental and Ecological Impacts of the Leading Large-Scale Reservoir on the Upper Reaches of the Yellow River. Sustainability 11 (14), 3818. doi:10.3390/su11143818
Qiu, M., Zuo, Q., Wu, Q., Yang, Z., and Zhang, J. (2022). Water Ecological Security Assessment and Spatial Autocorrelation Analysis of Prefectural Regions Involved in the Yellow River Basin. Sci. Rep. 12, 5105. doi:10.1038/s41598-022-07656-9
Song, C., Zhang, Y., Mei, Y., Liu, H., Zhang, Z., Zhang, Q., et al. (2014). Sustainability of Forests Created by China's Sloping Land Conversion Program: a Comparison Among Three Sites in Anhui, Hubei and Shanxi. For. Policy Econ. 38, 161–167. doi:10.1016/j.forpol.2013.08.012
Sun, J., Li, Y. P., Gao, P. P., and Xia, B. C. (2018). A Mamdani Fuzzy Inference Approach for Assessing Ecological Security in the Pearl River Delta Urban Agglomeration, China. Ecol. Indic. 94, 386–396. doi:10.1016/j.ecolind.2018.07.011
Sun, T., Lin, W., Chen, G., Guo, P., and Zeng, Y. (2016). Wetland Ecosystem Health Assessment through Integrating Remote Sensing and Inventory Data with an Assessment Model for the Hangzhou Bay, China. Sci. Total Environ. 566-567, 627–640. doi:10.1016/j.scitotenv.2016.05.028
Turner, B. L., Lambin, E. F., and Reenberg, A. (2007). The Emergence of Land Change Science for Global Environmental Change and Sustainability. Proc. Natl. Acad. Sci. U.S.A. 104, 20666–20671. doi:10.1073/pnas.0704119104
Vitousek, P. M., Mooney, H. A., Lubchenco, J., and Melillo, J. M. (2008). Human Domination of Earth's Ecosystems. Springer U. S. 277, 3–13. doi:10.1007/978-0-387-73412-5_1
Wang, F., Lu, Y., Li, J., and Ni, J. (2021). Evaluating Environmentally Sustainable Development Based on the PSR Framework and Variable Weigh Analytic Hierarchy Process. Ijerph 18, 2836. doi:10.3390/ijerph18062836
Wang, Z., Tang, L., Qiu, Q., Chen, H., Wu, T., and Shao, G. (2018). Assessment of Regional Ecosystem Health-A Case Study of the Golden Triangle of Southern Fujian Province, China. Ijerph 15, 802. doi:10.3390/ijerph15040802
Wohlfart, C., Kuenzer, C., Chen, C., and Liu, G. (2016). Social-ecological Challenges in the Yellow River Basin (China): a Review. Environ. Earth Sci. 75, 1066. doi:10.1007/s12665-016-5864-2
Wolfslehner, B., and Vacik, H. (2008). Evaluating Sustainable Forest Management Strategies with the Analytic Network Process in a Pressure-State-Response Framework. J. Environ. Manag. 88, 1–10. doi:10.1016/j.jenvman.2007.01.027
Wu, W., Chen, Z., Li, Y., Wang, Y., Yan, J., and Song, C. (2019). Land Engineering and its Role for Sustainable Agriculture in the Agro-Pastoral Ecotone: a Case Study of Yulin, Shaanxi Province, China. J. Geogr. Sci. 29, 818–830. doi:10.1007/s11442-019-1630-1
Xiao, J. (2014). Satellite Evidence for Significant Biophysical Consequences of the "Grain for Green" Program on the Loess Plateau in China. J. Geophys. Res. Biogeosci. 119, 2261–2275. doi:10.1002/2014JG002820
Xiu, L., Yan, C., Li, X., Qian, D., and Feng, K. (2018). Monitoring the Response of Vegetation Dynamics to Ecological Engineering in the Mu Us Sandy Land of China from 1982 to 2014. Environ. Monit. Assess. 190, 543. doi:10.1007/s10661-018-6931-9
Xu, B., Yang, D., Yao, P., Burnett, W. C., Ran, X., Charette, M., et al. (2018). A New Perspective for Assessing Water Transport and Associated Retention Effects in a Large Reservoir. Geophys. Res. Lett. 45, 9642–9650. doi:10.1029/2018GL079687
Xu, W., Wang, J., Zhang, M., and Li, S. (2021). Construction of Landscape Ecological Network Based on Landscape Ecological Risk Assessment in a Large-Scale Opencast Coal Mine Area. J. Clean. Prod. 286, 125523. doi:10.1016/j.jclepro.2020.125523
Xu, Y., Cai, Y., Sun, T., and Tan, Q. (2017). A Multi-Scale Integrated Modeling Framework to Measure Comprehensive Impact of Coastal Reclamation Activities in Yellow River Estuary, China. Mar. Pollut. Bull. 122, 27–37. doi:10.1016/j.marpolbul10.1016/j.marpolbul.2017.05.065
Yaacobi, G., Ziv, Y., and Rosenzweig, M. L. (2007). Effects of Interactive Scale-dependent Variables on Beetle Diversity Patterns in a Semi-arid Agricultural Landscape. Landsc. Ecol. 22, 687–703. doi:10.1007/s10980-006-9061-7
Yellow River Conservancy Commission (YRCC) (2020). Yellow River Yearbook. China: Yellow River Yearbook Press, 85–93. (in Chinese).
Zhang, Q., Zhang, Z., Shi, P., Singh, V. P., and Gu, X. (2018). Evaluation of Ecological Instream Flow Considering Hydrological Alterations in the Yellow River Basin, China. Glob. Planet. Change 160, 61–74. doi:10.1016/j.gloplacha.2017.11.012
Zhang, X., Liu, K., Wang, S., Wu, T., Li, X., Wang, J., et al. (2022). Spatiotemporal Evolution of Ecological Vulnerability in the Yellow River Basin under Ecological Restoration Initiatives. Ecol. Indic. 135, 108586. doi:10.1016/j.ecolind.2022.108586
Zhang, X., Wang, L., Fu, X., Li, H., and Xu, C. (2017). Ecological Vulnerability Assessment Based on PSSR in Yellow River Delta. J. Clean. Prod. 167, 1106–1111. doi:10.1016/j.jclepro.2017.04.106
Zhang, Y., Cao, Z., Wang, W., and Jin., X. (2021). Using Systems Thinking to Study the Coordination of the Water-Sediment-Electricity Coupling System: a Case Study on the Yellow River. Sci. Rep. 11, 21974. doi:10.1038/s41598-021-01578-8
Keywords: intensity of ecological degradation, landscape ecological risk index, PSR model, land use change, the yellow river basin
Citation: Li T, Zhang Q, Singh VP, Zhao J, Song J, Sun S, Wang G, Shen Z and Wu W (2022) Identification of Degradation Areas of Ecological Environment and Degradation Intensity Assessment in the Yellow River Basin. Front. Earth Sci. 10:922013. doi: 10.3389/feart.2022.922013
Received: 17 April 2022; Accepted: 20 June 2022;
Published: 08 July 2022.
Edited by:
Xingcai Liu, Institute of Geographic Sciences and Natural Resources Research (CAS), ChinaReviewed by:
Kun Shi, Nanjing Institute of Geography and Limnology (CAS), ChinaCopyright © 2022 Li, Zhang, Singh, Zhao, Song, Sun, Wang, Shen and Wu. This is an open-access article distributed under the terms of the Creative Commons Attribution License (CC BY). The use, distribution or reproduction in other forums is permitted, provided the original author(s) and the copyright owner(s) are credited and that the original publication in this journal is cited, in accordance with accepted academic practice. No use, distribution or reproduction is permitted which does not comply with these terms.
*Correspondence: Qiang Zhang, emhhbmdxNjhAYm51LmVkdS5jbg==
†These authors have contributed equally to this work
Disclaimer: All claims expressed in this article are solely those of the authors and do not necessarily represent those of their affiliated organizations, or those of the publisher, the editors and the reviewers. Any product that may be evaluated in this article or claim that may be made by its manufacturer is not guaranteed or endorsed by the publisher.
Research integrity at Frontiers
Learn more about the work of our research integrity team to safeguard the quality of each article we publish.