 Qi Yan
 Jin Cui1
 Zhenghua Tan
 Bao-Jie He
- 1Key Opening Laboratory for Northeast China Cold Vortex Research, Institute of Atmospheric Environment, China Meteorological Administration, Shenyang, China
- 2Shenyang Central Meteorological Observatory, Liaoning Meteorological Bureau, Shenyang, China
- 3Smart City Research Institute of Chongqing University in Liyang, Chongqing University, Liyang, China
- 4Centre for Climate-Resilient and Low-Carbon Cities, School of Architecture and Urban Planning, Chongqing University, Chongqing, China
- 5Key Laboratory of New Technology for Construction of Cities in Mountain Area, Ministry of Education, Chongqing University, Chongqing, China
Blizzard is a severe weather-related disaster with significant environmental, economic, and social impacts. What is worse, the blizzard is increasingly frequent along with climate change. To enhance resilience, it is important to accurately estimate the blizzards. While some studies have reported the blizzard formation and characteristics, limited studies have not well presented the backflow blizzard associated with the cold vortex in Northeast China. In order to overcome this research gap, this study aims to analyze the characteristics of a backflow blizzard in Liaoning, China, and reveal the reasons behind the spatial heterogeneity of snowstorm intensity and duration. With observation data and mesoscale numerical simulation, this study discovered that the northeast cold vortex was the combined results of airflows from the Sea of Japan transported by the easterly airflow, the East China Sea, and the Yellow Sea transported by the southeast airflow, and the low-level southwest airflow, and the vortex was an important driver to the blizzard. Results further indicate that the interactions of airflow movement, water vapor variation, and frontogenesis occurrence at different layers caused the differences in snowfall intensity, duration, and volume at Zhangwu and Huanren stations. In particular, at Zhangwu station, there was an interaction of warm-wet and cold-dry airflows, but low-layer water vapor content was small, under which background only the cold air pushed the warm air as the southwest wind did not increase significantly, leading warm-humid air to be forced to climb and resulting in frontogenesis at 700–925 hPa. Therefore, the situation of no frontogenesis and poor humidity conditions in the low-level cold air contributed to the weak and a short-duration of snowfall at Zhangwu Station. The water vapor content of warm-wet and cold-wet airflows over Huanren station was better than that at Zhangwu so that during cold and warm air interaction, there was frontogenesis at 500–925 hPa. Near the top of the inverted trough in the ground layer, there was a convergence of the southeasterly wind and the northeasterly winds, resulting in the occurrence of horizontal frontogenesis throughout the layer of 500 hPa and forming an upward movement column. Moreover, a deep near-saturated water vapor layer formed below 600 hPa due to the upward movement column. Overall, the abundant water vapor combined with the deep dynamic uplift led to the heavy and long duration of snowfall at the Huanren station. Overall, this study is an important reference for understanding the backflow blizzard and its mechanism. Moreover, it is conducive to the accurate estimation of backflow blizzards in Northeast China and eastern China, the eastern coast of the Korean peninsula, and other similar areas where on the east part of the continent is the ocean.
Introduction
Extensive greenhouse gas (GHG) emissions have brought significant challenges to the global climate (IPCC, 2018). The ever-changing climate leads to an increase in weather-related disasters such as heatwaves, drought, flooding, bushfire, and snowstorm, with serious environmental, social, and economic consequences (UNEP, 2021). Climate change mitigation and adaptation is a critical theme in the world, especially given the expectations that climate change will be a new normal in the coming decades (Solecki et al., 2018). There have been many international, national, and local frameworks and initiatives for curbing GHG emissions to limit global warming below 1.5°C and 2.0°C (Millar, 2017; Salvia et al., 2021). However, in the meantime of climate change mitigation, there is an urgent need for climate change adaptation through climate monitoring and forecasting to generate warning signals and response actions to protect people from climate-induced impacts (Rosenzweig et al., 2018). An accurate estimation of climate-related disasters is significant in supporting climate change adaptation (He et al., 2021).
Snowstorm or blizzard, one of the deadliest disasters, is increasingly frequent because of increasing vapor feeding into the atmosphere under warming conditions (Rawlins, 2022). It is reported that the blizzard in the United States in 2008–2018 increased to three times that in 1958–1968 (Rawlins, 2022). Moreover, blizzard severity in many cities hit the record frequently, such as Boston and New York, with intensifying consequences. The blizzard disasters are mainly in the mid- and high-latitude climates. Many northeast and northwest cities in China are also undergoing severe threats and risks of blizzards. In March 2007, a blizzard hit Northeast China, leading to the paralysis of urban road traffic and causing a direct economic loss of 14.59 billion RMB (Li et al., 2007). In March 2012, Liaoning province underwent severe, large-scale rain and snow weather, in which the blizzard in Zhuanghe, Dalian, caused the collapse of 122 agricultural greenhouses and many other facilities, covering an area of about 200,000 sqm. In November 2013, two historical snowstorms attacked Heilongjiang and Jilin provinces, causing serious impacts on civil aviation, railways, highway transportation, and agricultural facilities. In December 2017, a heavy snowstorm occurred in Urumqi, seriously affecting civil aviation transportation and urban traffic. Overall, mid- and high-latitude cities have already been and will be challenged by blizzards with significant consequences on urban traffic, highways, facility agriculture, and the safety of people’s lives. It is important to improve the resilience to blizzards, and understanding the reasons behind snowstorm formation is meaningful.
Studies on blizzards started in the 1970s and are mainly contextualized in European and North American cities. Due to the heterogeneity of geographic characteristics (e.g., ocean, terrain, and latitude), the focus and findings on blizzards are diverse. For instance, early studies in Europe and the United States suggested that most blizzards are associated with the formation and development of extratropical cyclones (Braham, 1983; Pearce et al., 2001; Ulbrich et al., 2001). Studies in Japan exhibited that, under most conditions, the snowstorm is concurrent with the formation and evolution of low-pressure systems (Ninomiya, 1991; Shimizu & Uchida, 1974). A further understanding of the mechanism of blizzard formation has also been explored. With the combination of theoretical studies, numerical simulation, and observations based on Radar and Satellite, Bennetts and Hoskins suggested that the symmetric baroclinic instability in saturated air could contribute to the band characteristics of frontal cloud and precipitation (Bennetts & Hoskins, 1979). Based on the National Centers for Environmental Prediction (NCEP) reanalysis data on blizzards in North America in 2015, Cui and Qiao (2016) suggested that the occurrence of extra strong northerly wind and weakened westerly jet stream allowed the polar cold current and wet air to invade the North American continental area easily. Sanders and Bosart (1985) found an extensive snowstorm covering areas from Washington to Boston after a cyclone moved onshore in the northeast part of the United States in 1983 and explained that the frontogenesis forcing and symmetric instability might be the main drivers.
In comparison, within China context, most studies had focused on the fact and characteristics of heavy snow and blizzard when snowstorm studies emerged in the 1970s. Attention was gradually shifted to the blizzard cause analysis, where the diagnostic analysis of the blizzard process was particularly conducted on aspects of climate background, weather system evolution, and water vapor thermodynamic conditions (Duan et al., 2013; Zhao, 2007; Zhou et al., 2011). The blizzard characteristics and synoptic causes in different regions were classified. Based on daily and monthly average data from the NCEP, Gao et al. (2020) analyzed water vapor transport characteristics of regional snowstorms in Liaoning, finding that the water vapor was pumped by the Western Pacific, Sea of Japan, East China Sea, and the Yellow Sea, in which the East China Sea and the Yellow Sea were most direct vapor sources. Li et al. (2007) investigated the evolutions of three times of blizzards in Nanjing in the winter of 2018 and found that the snowflake spectrum exhibited a multimodal distribution and co-occurrence of frost growth and frost collision drove the formation of heavy snowflakes. In particular, the mesoscale numerical simulation facilitated the analysis of the interactions among multi-scale weather systems and their impacts on snowfall, making up for the lack of observational data and low spatial resolution of reanalysis observational data (Ji et al., 2014; Miao et al., 2010; Wu et al., 2011). Based on the mesoscale numerical simulation, the studies on blizzards have achieved fruitful achievements as well (Fernández-González et al., 2015; Hamzeh et al., 2021).
Nevertheless, studies on blizzards in Northeast China are still limited, but it is important to conduct relevant studies because of its different blizzard characteristics from other regions. The mechanism behind the blizzards in Northeast China, particularly the backflow blizzards, is still unclear to support accurate forecasting. For instance, Wu et al. (2012) investigated factors driving the formation of backflow blizzards in Tianjin, pointing out that the backflow snowstorm resulted from the co-impacts of backflow cold high pressure and inverted low-pressure trough in North China. Cui and Su (2019) adopted observation data and NCEP reanalysis data to analyze the characteristics and causes of a heavy snowstorm in southern Henan in early 2018, suggesting that a low-level cold pad was conducive to the climb of southwest warm-humid air above the inversion layer, and the change of low-altitude vertical wind shear could indicate the change of snowfall intensity. Their interactions amplified the blizzard. Overall, previous studies have only explained that northeast airflow acted as a cold pad, causing the southwest warm-humid airflow near the height of 850 hPa to crawl, driving blizzard occurrence. However, limited studies have explained the heterogeneity of snowstorm intensity, namely, some areas undergoing heavy snowstorms but some areas undergoing light snowstorms, whereas these areas are under the same circulation conditions with warm-humid air crawl on the cold pad.
In order to overcome this research gap, this study aims to reveal the reasons behind snowstorm intensity heterogeneity. This study was conducted within the context of eastern Liaoning province, where an inverted snowstorm occurred under the background of a northeast cold vortex on 14–15 February 2020. The snowstorm exhibited a large spatial distribution gradient that the snowfall intensity in the east was about 15 times that in the west, whereas the distance between them was only about 300 km. Accordingly, the objectives of this study are as follows: 1) to investigate the characteristics of the northeast cold vortex and the associated sources and 2) to understand the cause of the backflow blizzard in aspects of snowfall environmental field evolution and the water vapor, thermodynamics, and low-level frontogenesis. Using mesoscale numerical simulation to explain snowstorm intensity heterogeneity is important because it reveals the interactions of airflows at different heights and with different properties. Moreover, this study will also address the gap in the snowstorm mechanism in Northeast China and even East and Northeast Asia to a certain extent.
Materials and Methods
Case Study Area and Snowstorm Disaster
This study is conducted in the context of Liaoning province (118.835–125.787E, 38.723–43.491N), which is located on the east coast of Eurasia (Figure 1), and in the south part of Northeast China. Liaoning has a temperate continental monsoon climate. From 1961 to 2020, Liaoning underwent more than 10 episodes of snowstorm disasters with significant impacts, most of which happened in early winter and early spring. In comparison, only four episodes of snowstorms occurred in winters. Compared with winters, water vapors were better and conducive to snowstorm formation in early winter and early spring when cold and warm air movement was more active and frequent, and the temperature was higher.
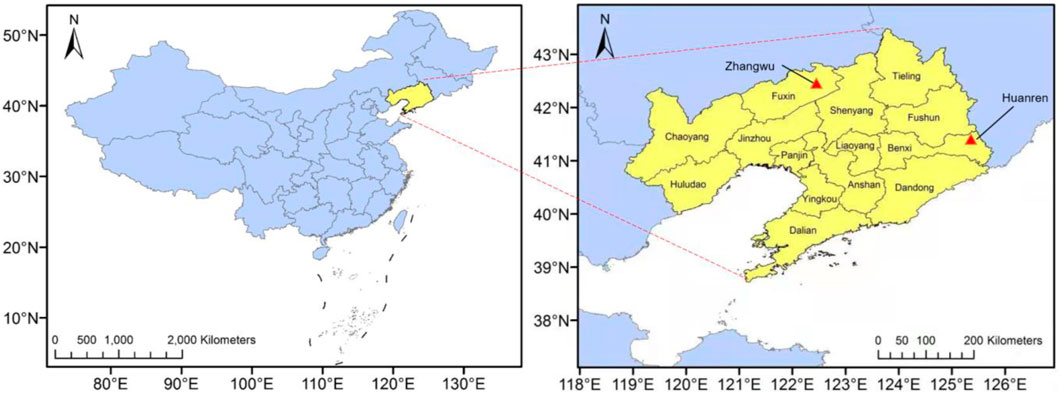
FIGURE 1. Location and cities in Liaoning province, China.
Table 1 presents 18 snowfall episodes in winter (including December, January, and February) and their impacts from 2000 to 2020. The most significant blizzard was on 13 February 2009, with an economic loss of 36.52 million RMB, followed by the one on 25 February 2015, with an economic loss of 27.13 million RMB. The most recent one was on 15 February 2020, with an economic loss of 16.67 million RMB. In particular, Huanren Station witnessed the highest daily precipitation in 24 h snowfall, ranking fifth in its history from 1961 to 2020 (Figure 1). Dalian, Benxi, Dandong, and Yingkou were the four cities undergoing severe agricultural impacts, such as the greenhouses collapse and damage, livestock sheds damage, livestock death, and factory damage. The total impact areas were about 16,000 ha. Given its backflow characteristics and severe impacts, this snowstorm was selected for completing the study on snowstorm intensity heterogeneity.
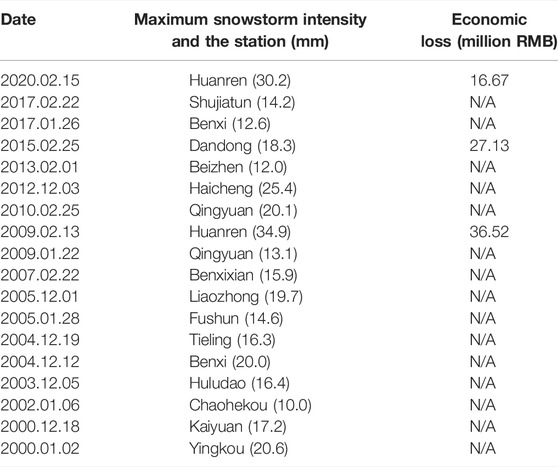
TABLE 1. The snowfall episodes and their impacts in 2000–2020.
Definition
The division of snowstorms is in alignment with the national standard of “Precipitation Grades” (GB/T 28592–2012) (Table 2). According to the definition of extreme winter snowstorm events, the wintertime period is from December to February of next year. There are 126 episodes with maximum daily precipitation of more than 10 mm per station during the winter period from 1961 to 2020. On 15 February 2022, the 24 h snowfall at Huanren station was 30.2 mm, also exceeding the 95th percentile of the historical snowfalls (27.4 mm). The precipitation phase was pure snow, so it is defined as an extreme blizzard episode. The northeast cold vortex is defined as having at least one closed contour in the range of 35–60°N, 105–145°E on the 500 hPa high-altitude synoptic map, and there is a cyclonic circulation with an obvious cold trough of a cold center. The same northeast cold vortex that could last for three or more consecutive days is defined as a continuous northeast cold vortex episode. Backflow snowfall refers to the snowfall that occurs after the surface cold front (east-northeast wind in this study) passes.

TABLE 2. Snow grade according to the national standard of “Precipitation Grades.”
Data Sources
Data used for analyzing snowstorm evolution and its mechanism consists of field observation data, radar data (Liaoning Provincial Meteorological Information Center), and NCEP reanalysis data (https://rda.ucar.edu/datasets/ds083.3/). The period of the data used ranged from 0:00 on 14 February (Day 1) to 24:00 on 15 February (Day 2) (universal time). The artificially encrypted hourly snowfall observation data were used to analyze the spatial distribution of snowfall amount and its hourly variation characteristics. Radar wind profile at Shenyang station with an hour interval was used to validate mesoscale numerical simulation of wind fields. The point-grid NCEP reanalysis data with a horizontal resolution of 1° × 1° were adopted to understand the circulation background and the evolution of the large-scale influence system during the snowstorm. The vertical resolution was 25 hPa below 900 hPa and 50 hPa above 900 hPa, and the time step was 6 h.
The snowstorm started from 1:00 on Day 1 to 8:00 on 16 February 2020. The average provincial precipitation was 10.9 mm, where the blizzards occurred in the east of central Liaoning (Figure 2A), and it reached the maximum in the eastern part. The maximum snowfall was 36.2 mm at Huanren station, and the maximum snow depth was 29 cm at both Benxi station and Kuandian station. According to the observation at Huanren station, blizzards lasted for nearly 46 h. The snowfall became increasingly heavy from 8:00 to 14:00 on Day 2, whereas snow intensity generally was below 1.5 mm/h. The snowfall exhibited a spatial gradient with the highest in the east and smallest in the west (Figure 2A). Both Huanren and Zhangwu stations were selected for subsequent analysis due to their comparable snowfall volumes. The distance between them was about 320 km. The snowfall amount at Huanren station was about 15 times that at Zhangwu station, and the snowfall duration at Zhangwu Station was shorter than that at Huanren station (Figure 2B).
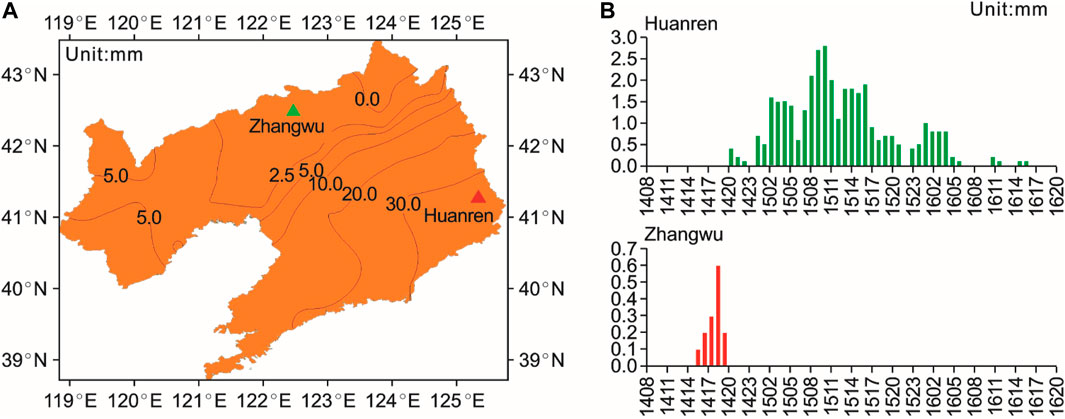
FIGURE 2. Snowfall characteristics in Liaoning province (A) and the snowfall process at Huanren and Zhangwu stations (B).
Mesoscale Numerical Simulation
Field data of the Global Forecasting System provided by the NCEP, with a spatial resolution of 0.5° × 0.5° and a time interval of 6 h, were adopted as the initial field and lateral boundary conditions to drive the Weather Research and Forecast Model (WRF) (Version 4.1.2). The mesoscale simulation area is shown in Figure 3. The model adopted a two-layer nested grid scheme, in which the horizontal range was centered at (42°N, 116°E), the coarse grid spacing was 9 km with the grid number of 701 × 601, and the fine grid spacing was 3 km with the grid number of 691 × 703. The vertical direction was 50 layers, and the pressure at the top of the model was 10 hPa. The initial time of the model was 8:00 on Day 1, and the integration was 48 h until 8:00 on 16 February. In addition, the model adopted the WSM6 microphysics scheme, RRTM long-wave radiation scheme, the Dudhia short-wave radiation scheme, Noah land surface process scheme, YSU boundary layer parameterization scheme, cumulus convection parameterization 9 km based on the Kain–Fritsch (new Eta) scheme, and 3 km grid off cumulus parameterization scheme.
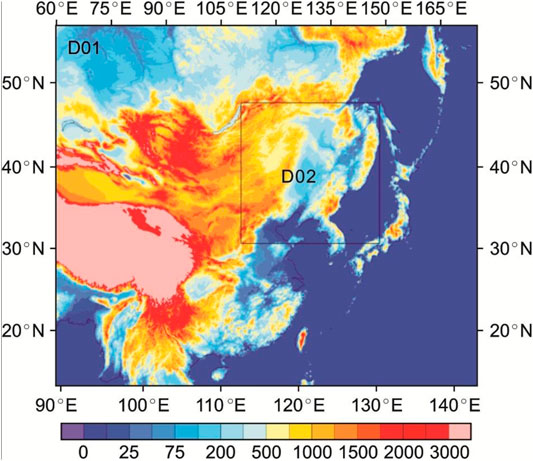
FIGURE 3. The mesoscale simulation area and two-layer nested grid scheme in the WRF.
Results and Discussion
This section presents results on the northeast cold vortex and the associated sources and the cause of the backflow blizzard in aspects of snowfall environmental field evolution and the water vapor, thermodynamics, and low-level frontogenesis.
Northeast Cold Vortex and Drivers
Figure 4 presents the air pressure at the 500 hPa and sea levels. Results indicate that at the 500 hPa level, there were two ridges and one trough, where the high-pressure ridges were around the Baikal Lake and the east coast of Asia. The meridional degree of atmospheric circulation in the mid and high latitudes increased, beneficial to a movement of cold air in the polar regions toward Northeast China. The southerly airflow in front of the high-altitude trough was also conducive to the warm-humid air transportation toward the northeast region. As a result, an intersection of cold and warm air occurred in the northeast region, promoting the development of strong northeast cold vortexes, as shown in Figure 4B. With the slow eastward movement of the northeast cold vortexes, the trough was enhanced between the two high-pressure ridges ranging from the central and southern regions to Northeast China. The southwest airflow front then transported the water vapors from southern China and the Bohai Sea areas to Liaoning province, as indicated by the red arrow in Figure 4B. Such long-distance and long-term water vapor transport were very scarce in the same season in Liaoning. At the 850 hPa level, in particular, the normalized outlier of specific humidity in the eastern part of Liaoning exceeded 2σ, reaching an extreme anomaly threshold, which can provide sufficient water vapor for the formation of this episode of the blizzard. According to Figures 4C,D, the Siberian continental high pressure at sea level was strong, so the cold air entered Liaoning from the northeast to southwest along with the easterly airflow (blue arrow). This fostered the cold air layer near the surface of Liaoning and pushed warm-humid air to climb over the cold air layer slowly. The interaction of cold and warm air in the mid and low layers could lead to a snowfall.
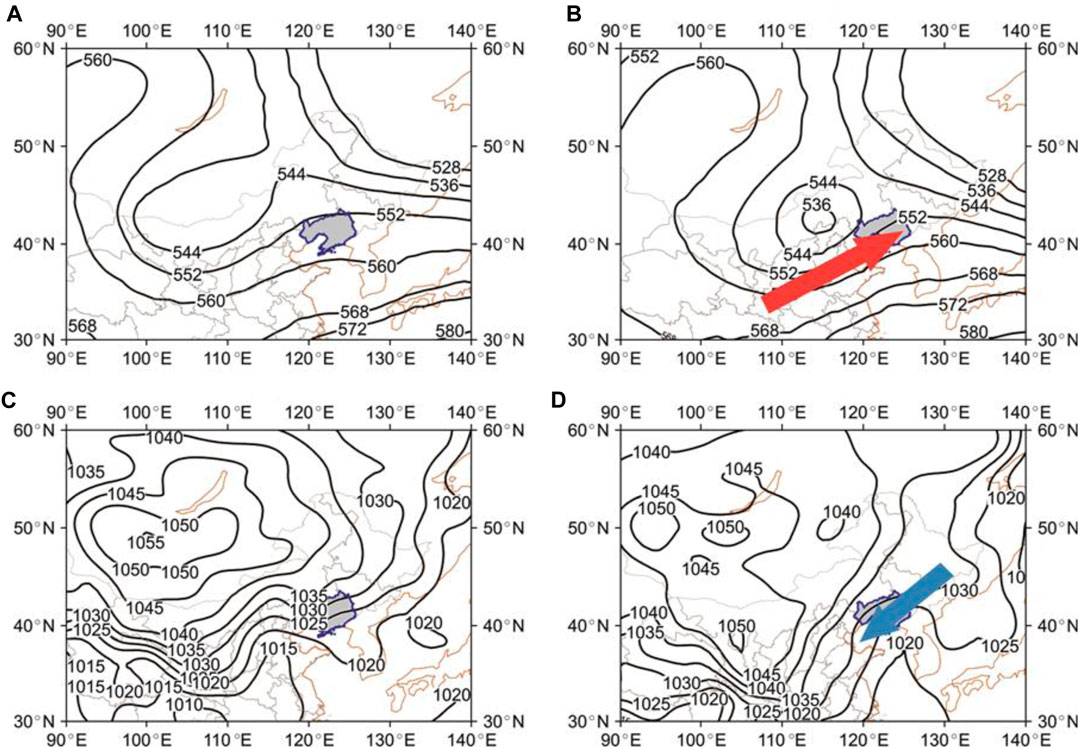
FIGURE 4. Geopotential height at the 500 hPa level (A), 0:00 on Day 1; (B), 0:00 on Day 2) (unit: 10 gpm) and sea level (C), 0:00 on Day 1; (D), 0:00 on Day 2) (unit: hPa).
Validation of Mesoscale Numerical Simulation
According to Figure 2, there was a large difference in the snowfall volumes of the Huanren and Zhangwu stations. However, it is difficult to analyze the reasons behind it. In order to overcome this challenge, the mesoscale numerical simulation is expected to accurately compare the differences in water vapor and dynamic conditions. Figure 5 compares the estimated heavy snowfall area and the actual situation. Results indicate that the southeastern part of Northeast China underwent heavy snowfall, and the snow distribution exhibited a belt pattern. Moreover, the snowfall intensity was above 30 mm at the center of the heavy snowfall area. Overall, the numerical results were accurate, regardless of the snowfall area or intensity. In addition, the simulated phase state was mainly snowfall, which is consistent with the observed snow phase in most areas, and the precipitation particles are mainly ice-phase particles.
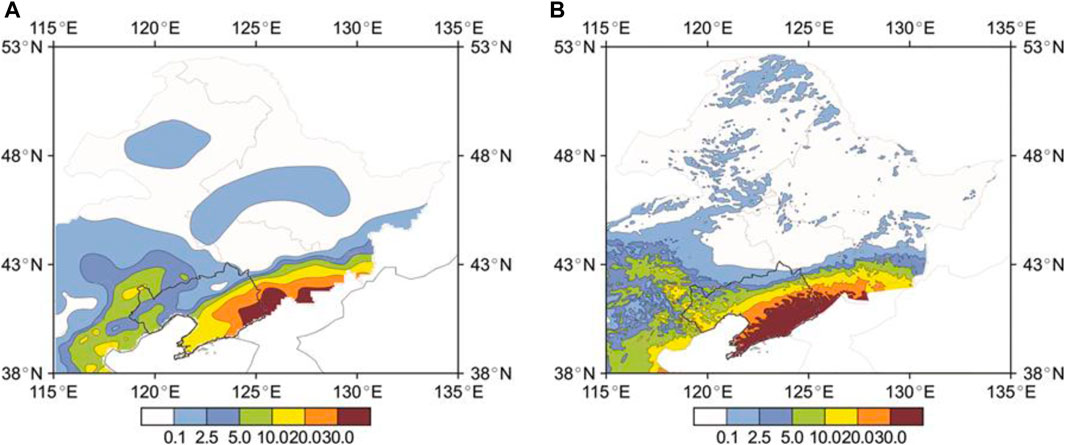
FIGURE 5. Comparison of observed snowfall (A) and simulated snowfall (B) from 0:00 on Day 1 to 0:00 on Day 2.
Figure 6 compares wind fields obtained from radar observation and mesoscale numerical simulation. Overall, the simulated wind field was generally consistent with the observed field. In particular, at 8:00 in February, the intensifying southwest wind above the 850 hPa level and the northeast backflow below 850 hPa were well identified through simulation. The simulation results could well present the snowfall area, intensity, phase state, and wind field at each layer.
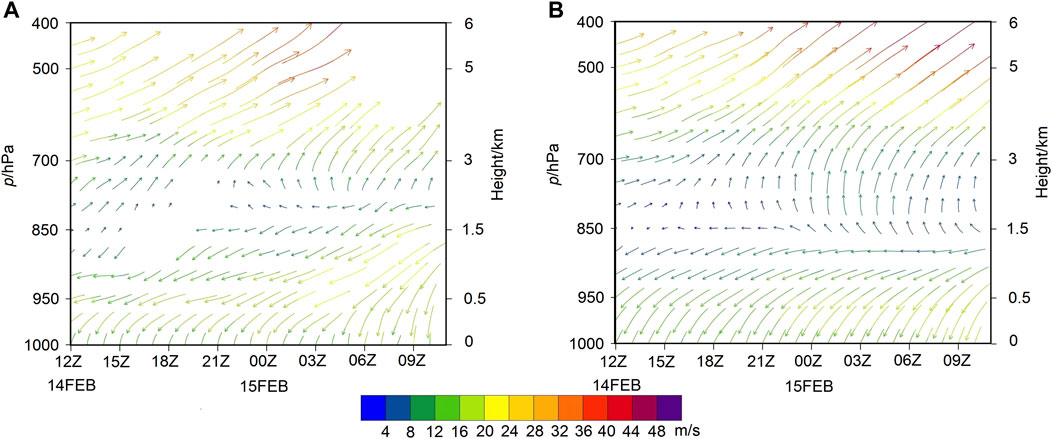
FIGURE 6. Radar wind field (A) and simulated wind field (B) in Shenyang during the snowfall period from 0:00 on Day 1 to 0:00 on Day 2.
Wind, Humidity, and Temperature Field Variations
In Liaoning province, winter (including December, January, and February) is the dry season throughout the year. In this season, a specific humidity above 2 g/kg, a threshold to screen dry and wet air conditions, is a good water vapor content condition. Namely, air is defined as dry air when the specific humidity is below 2 g/kg and wet air when above 2 g/kg. Moreover, the airflow flowing from a low-temperature area to a high-temperature area is defined as cold airflow and vice versa. Figure 7 and Figure 8 present the variations of temperature, specific humidity, and wind at different altitudes, including 700, 850, 925, and 975 hPa. The bold black curve is the 2 g/kg iso-humidity line, and the blue solid line is the southerly and northerly wind shear lines. According to the hourly variations of the snowfall (Figure 2B), two moments 8:00 on Day 1 (Figure 7) and 01:00 on Day 2 (Figure 8), were selected for comparison. At 8:00 on Day 1, the snowfall was heavy at Zhangwu station, whereas the snowfall did not begin at Huanren station. At 01:00 on Day 2, the snowfall in Zhangwu ended, whereas the snowfall in Huanren peaked.
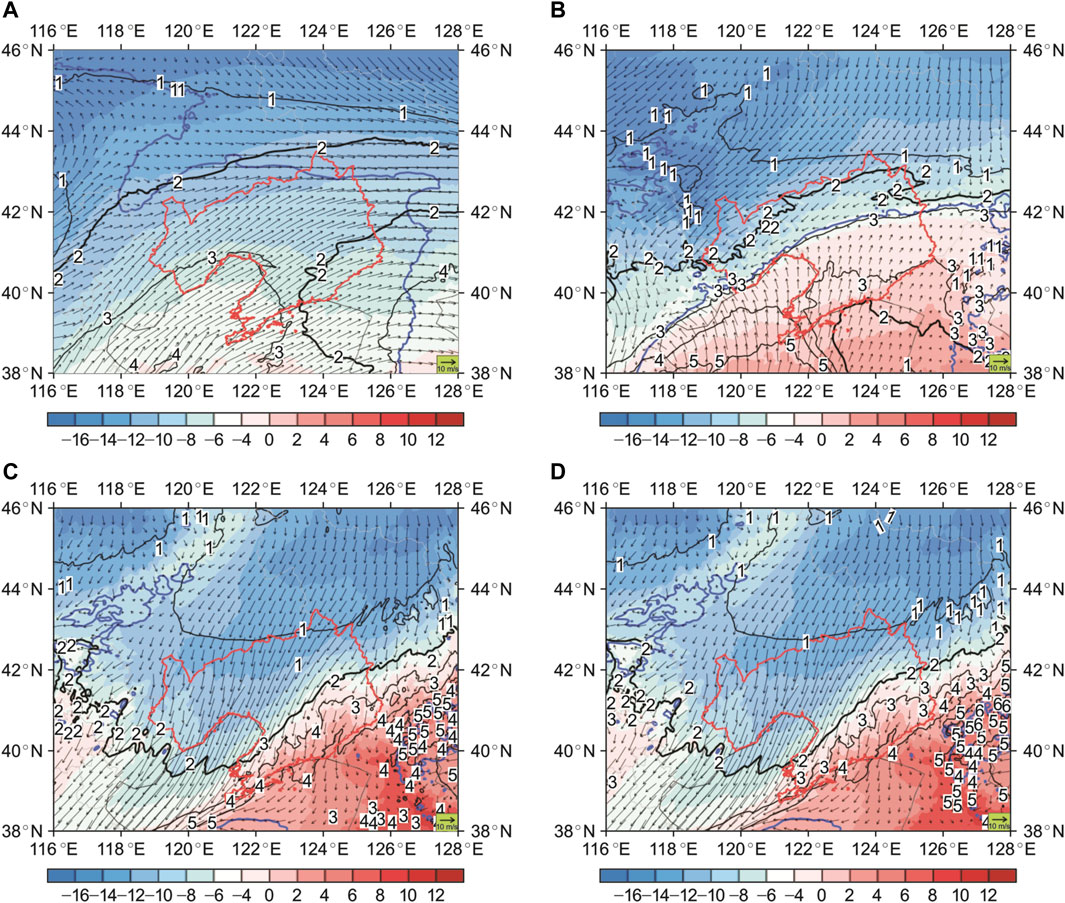
FIGURE 7. Temperature, specific humidity, and wind at 700 (A), 850 (B), 925 (C), and 975 (D) hPa at 8:00 on Day 1 (unit, temperature: °C, specific humidity: g/kg, wind speed: m/s, blue bold solid line: wind shear lines).
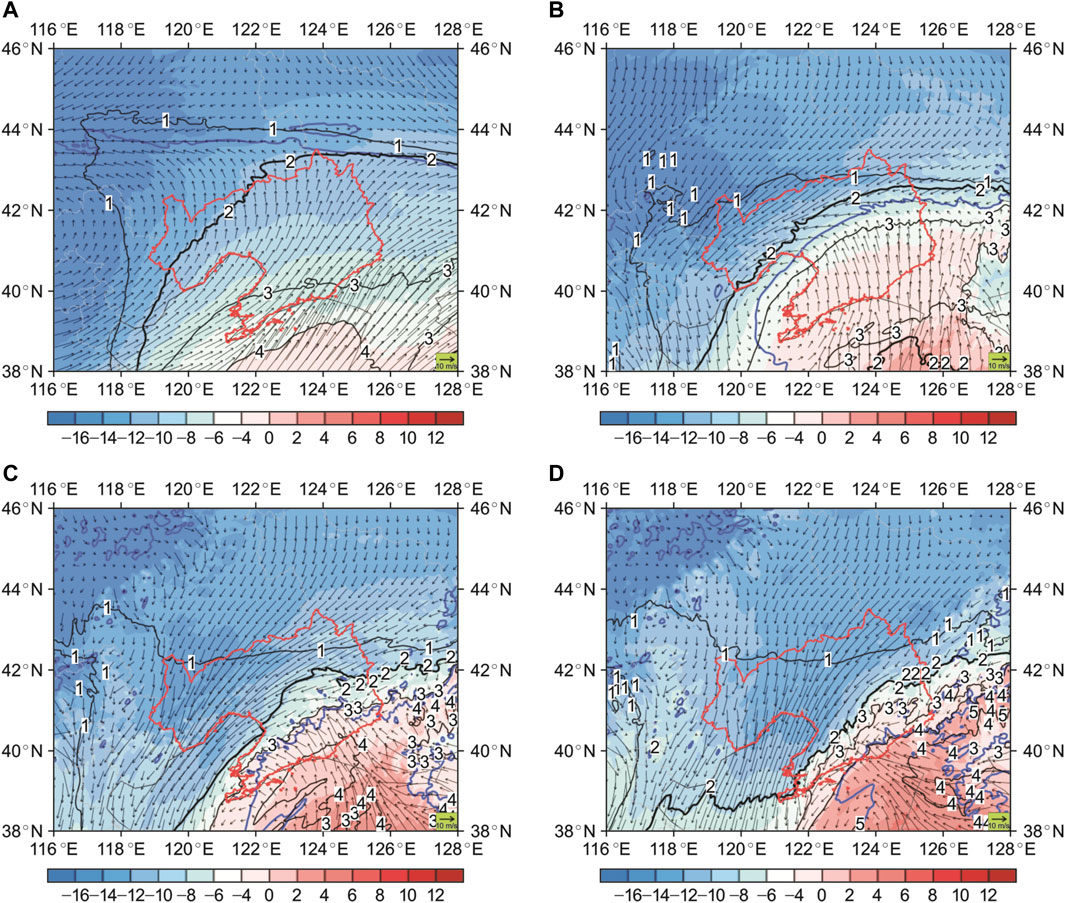
FIGURE 8. Temperature, specific humidity, and wind at 700 (A), 850 (B), 925 (C), and 975 (D) hPa at 1:00 on Day 2 (unit, temperature: °C, specific humidity: g/kg, wind speed: m/s, blue bold solid line: wind shear lines).
According to Figure 7, the warm-humid airflow covered the whole Liaoning province at 700 hPa. At 850 hPa, the center of the low-pressure vortex was around the point at 38°N and 117°E. The location of the southwesterly and northeasterly shear lines was at the top of the vortex, as shown by the blue solid line in Figure 7B. At this time, Zhangwu station was in a cold-wet northeasterly recirculation area. The convergence of the southwesterly warm-humid wind and the northeasterly cold-wet wind was conducive to the frontogenesis in the horizontal direction. Meanwhile, the warm-humid air near 700 hPa climbed on the cold pad of the northeasterly recirculation, resulting in frontogenesis in the vertical direction. Therefore, the frontogenesis in both horizontal and vertical directions strengthened the dynamic uplift effects at 700–850 hPa, associated with the humidity conditions, providing a favorable condition for snowfall formation at Zhangwu station. Below 925 hPa, Zhangwu station was in the domain of cold-dry northeast airflow, where the frontogenesis was not obvious in the horizontal and vertical directions, and the dynamic, uplifting effect of the lower layer was not strong. Moreover, the air was dry so that snowflakes formed between 700 and 850 hPa could fall to the cold-dry lower layers, leading to the occurrence of weak evaporation. All these processes contributed to a weak snowfall intensity at Zhangwu station. At this time, the Huanren station was in a wet environment, where it was in the control of warm-wet airflow above 850 hPa and cold-wet airflow below 850 hPa. The low-level shear was not obvious, which was not conducive to the formation of frontogenesis in the horizontal direction. In comparison, the southwest airflow near the 850 hPa was weak, and the wind speed near Huanren station ranged between 2 and 4 m/s. As a result, the warm-humid airflow was weak to climb along with the cold pad in the vertical direction. Meanwhile, while the water vapor at mid and low layers was good, the frontogenesis in the horizontal and vertical directions was not well coordinated. In particular, the frontogenesis in the vertical direction was weak, and the dynamic uplift conditions were poor, so there was no snowfall at the Huanren station.
At 01:00 on Day 2, the snowfall at Huanren station was the strongest, whereas the snowfall at Zhangwu station ended (Figure 8). At 700 hPa, the whole Liaoning was in the control of southwest warm-humid airflow. However, compared with Figure 7A, the southwesterly wind in the eastern Liaoning (Huanren station within this area) was significantly stronger, indicating that warm-humid airflow was identified in the eastern Liaoning. The vortex at 850 hPa moved toward the northeast (centered at 39.3°N and 112.5°E). The southwesterly and northeasterly wind shear lines at the top of the vortex moved slowly eastward and southward (Figure 8B), compared with the one in Figure 7B. In comparison, the Huanren station was in the control of warm-humid airflow. Wind speed was 6–8 m/s, about 4 m/s stronger than that at 8:00 on Day 1, and the warm-humid airflow intensity was significantly enhanced.
The convergence of southwesterly and northeasterly winds below 925 hPa strengthened (indicated by the blue lines in Figure 8C and Figure 8D, conducive to the frontogenesis in the horizontal direction. Meanwhile, the warm-humid airflow near 850 hPa climbed on the cold pad of the northeasterly backflow, conducive to the frontogenesis in the vertical direction. With the co-impacts of horizontal and vertical frontogenesis, the dynamic, uplifting effect below 700 hPa strengthened. Furthermore, the enhancement of the northeast cold vortex near 500 hPa fostered the formation of deep upward motion conditions. Overall, the lower layers of the Huanren station were under the control of cold-humid airflow, and its mid and upper layers were under the control of warm-humid airflow. The high humidity level and the deep upward movement were the main drivers for the heavy snowfall at Huanren station. However, the southwesterly wind around 700 hPa at Zhangwu station weakened obviously, and the cold-dry northeasterly backflow controlled the domain at 850 hPa. As a result, the snowfall ceased with the weakening frontogenesis and water vapor conditions.
Water Vapor, Thermodynamics, and Frontogenesis Variations
To further analyze the variation and differences of frontogenesis and water vapor at Zhangwu and Huanren stations in the vertical direction, the equivalent potential temperature (θse), relative humidity, and wind at the longitude where the two stations were located were screened, as shown in Figure 9. In Figure 9, the part with relative humidity above 90% was colored to represent a near-saturated water vapor state. The blue solid line was the shear line of southerly and northerly winds. The cold air was on the north side of the blue solid line, and warm air was on the south side of the solid line. The green straight line was the latitude of Zhangwu and Huanren stations. Before the snowfall at Zhangwu station (Figure 9A), the northeasterly cold air pad was around 850 hPa, so the iso-θse line was dense at 800–925 hPa with frontogenesis. However, only the water vapor at 800–850 hPa was above 90%, but that below 850 hPa was poor, resulting in a thin water vapor saturation layer and weak frontogenesis uplift (less than 0.2 hPa/s) (Figure 10A). The frontogenesis was not obvious below 925 hPa, not conducive to snowfall. At 8:00 on Day 1, the snowfall at Zhangwu station strengthened, as shown in Figure 9C. Compared with Figure 9A, the blue solid line moved southward, and the northeast cold air pad rose to 800 hPa, indicating that the cold air strongly pushed the warm air. The southwesterly wind at the south of 38°N was strengthened, the warm air crawled along with the cold air pad, and both the frontogenesis dynamic lifting effect between 700 and 925 hPa strengthened, as shown in Figure 10A. The upward movement between 600 and 800 hPa was above 0.2 hPa/s, with the highest speed of 0.4 hPa/s. By accompanying this, the near-saturated water vapor layer was thick at 700–900 hPa, beneficial for the snowfall formation at Zhangwu station. However, the space below 800 hPa was controlled by cold air with poor water vapor conditions, so the frontogenesis effect was not obvious and not conducive to snowfall. This explained the reason why the snowfall at Zhangwu station was weak, up only to 0.6 mm/h. The cold air advanced further to the southwest so that the cold air pad rose and the snowfall ended sooner with a small snowfall volume.
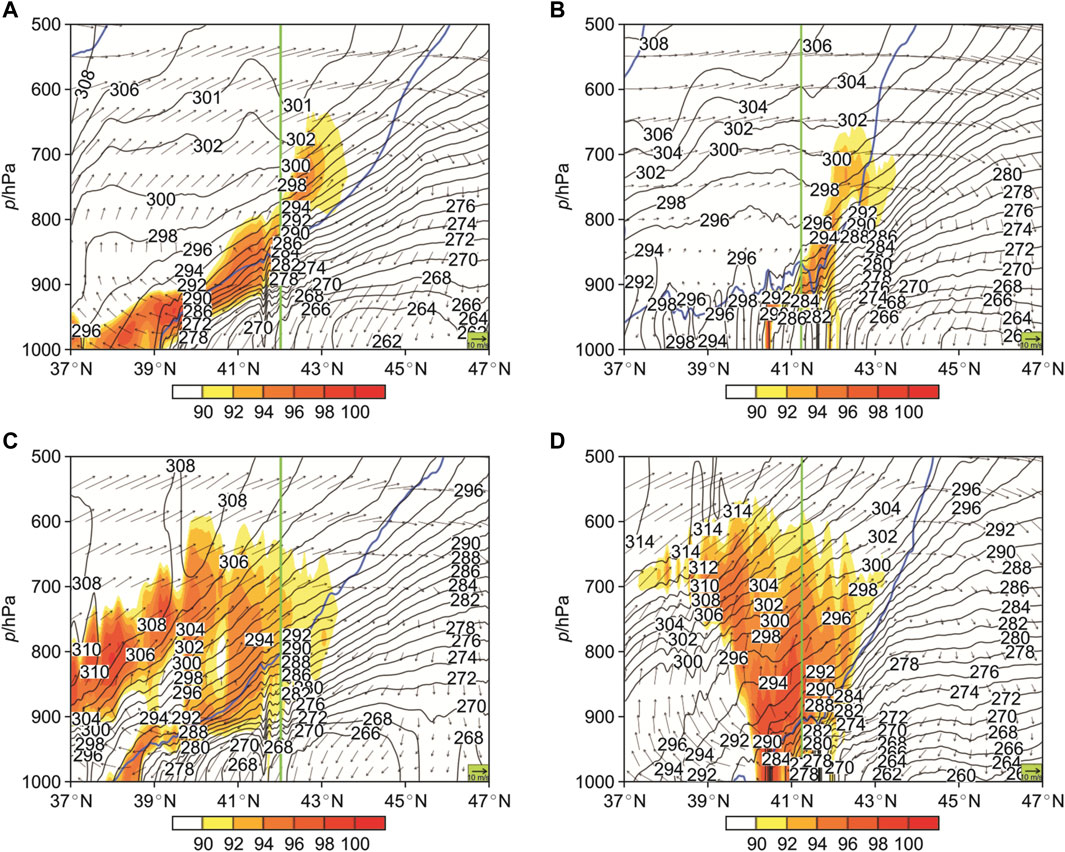
FIGURE 9. Equivalent potential temperature (θse), relative humidity, and wind at the longitude positions of Zhangwu (A), 1:00 on Day 1; (C), 8:00 on Day 1 and Huanren (B), 08:00 on Day 1; (D), 1:00 on Day 2 stations (unit, temperature: K, relative humidity: %, and wind speed: m/s, green solid line: latitudes of Zhangwu and Huanren stations).
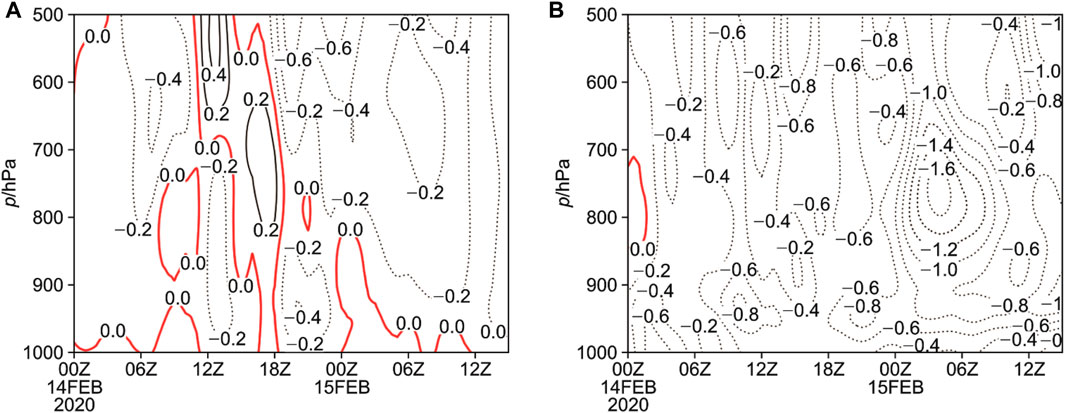
FIGURE 10. Uplift movement at Zhangwu (A) and Huanren (B) stations with time and latitude (unit: hPa/s).
As shown in Figure 9B, before the snowfall at Huanren station, the northeasterly air pad was around 875 hPa, and the iso-θse lines were dense at 850–900 hPa with frontogenesis. In comparison, the frontogenesis below 900 hPa was not obvious. A water vapor above 90% was only found at 900–950 hPa, whereas the water vapor of cold air pad below 900 hPa was poor. In particular, the warm-humid air above 850 hPa was poor in air saturation due to the weak dynamic lift and weak rising condensation effect. Overall, the thin water vapor saturation layer and the weak frontogenesis dynamic uplift resulted in a lack of snowfall. At 1:00 on Day 2, as shown in Figure 9D, the snowfall at Huanren station gradually strengthened. The blue solid line moved northward, compared with Figure 9B, and the northeast cold air pad dropped below 900 hPa, indicating that the warm air pushed the cold air strongly. Meanwhile, southerly wind below 500 hPa strengthened, especially the weak northeasterly wind near the ground turning to the southerly wind and reaching an intensity of the ultra-low-level jet. The strong warm-humid air crawled on the cold air pad, causing the enhancement of interlayer frontogenesis at 500–925 hPa. The convergence of horizontal wind fields below 925 hPa was conducive to the formation of horizontal frontogenesis, resulting in the frontogenesis in the entire layer and deep dynamic uplift, as shown in Figure 10B.
At 1:00–9:00 on Day 2, there was an upward movement column from the ground to 500 hPa, in which the maximum upward movement was up to 1.4 hPa/s, significantly stronger than that of Zhangwu station. The warm-humid air and cold-humid air were superimposed in the vertical direction, leading to an enhanced dynamic uplift and thereby the formation of a deep wet layer. Figure 9D also indicated that a deep near-saturated water vapor layer appeared below 600 hPa. Overall, the deep and strong dynamic uplift and the near-saturated water vapor layer provided favorable environments for the strong snowfall at Huanren station, with a maximum snow intensity of 2.7 mm/h. When the warm air moved northward, the cold air pad persisted, acting as a barrier to the warm air, which resulted in lasting frontogenesis and long snowfall duration, and thereby a large snowfall volume.
Conclusion
This study verified that the northeast cold vortex was an important driver of the blizzard in Liaoning on 14–15 February 2020. Overall, its strong development and movement eastward facilitated low-level low pressure, at which time the southwest jet stream developed in mid-layer, working simultaneously to transport warm-wet airflow toward Liaoning and guide ground low-pressure trough to move northeastward. In general, Liaoning is in the control of dry-cold air. However, the northeast airflow front in the southeast quadrant of the high pressure was cold-wet (blue arrow in Figure 11) before this snowfall because of the interaction of three sources of water vapor, including the one from the sea of Japan transported by the easterly airflow (green arrow), the one from the East China Sea and the Yellow Sea transported by the southeast airflow (red solid arrow), and the one carried by the low-level southwest airflow (red hollow arrow). With the mesoscale numerical simulation, this study well revealed that the complex interactions of the strong northeast cold vortex, the movement of the ground low-pressure inverted trough, the northeasterly wind, and warm-humid airflow in the mid and low-layer were the main causes of significant snowfall differences in Zhangwu and Huanren stations.
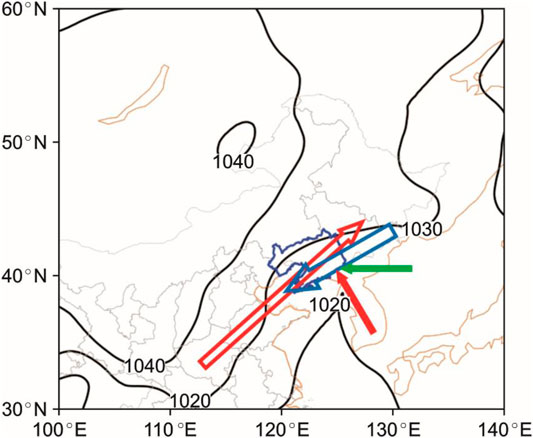
FIGURE 11. Water vapor in Liaoning before the snowfall.
The Zhangwu station first witnessed an interaction of warm-humid and cold-dry airs and small low-layer water vapor. Second, during snowfall enhancement, the southwest airflow did not intensify, and only the cold air pumped the rapid climb of warm air. Third, there was only frontogenesis at 700–925 hPa with the near-saturated water vapor at 700–900 hPa, whereas there was no frontogenesis in the low-layer cold-dry air, leading to a weak snowfall intensity at Zhangwu station. Fourth, the warm air kept advancing so that the cold-dry air pad rose rapidly, leading to a short snowfall duration and a small snowfall volume. For the Huanren station, first, the warm-humid and cold-humid air were superimposed to provide a favorable water vapor condition for snowfall formation. Second, during snowfall intensification, under the background of the northeast cold vortex, the southwest airflow strengthened, and the warm-humid air force increased, moving from the southwest to the northeast. On the one hand, the low-level warm-humid air pushed wet-cold air to move; on the other hand, the cold air force was also strong to enhance the climb of warm-humid air. As a result, there was obvious frontogenesis in the 500–925 hPa layer. Third, near the top of the inverted trough in the ground layer, there was a convergence of the southeasterly wind and the northeasterly winds, resulting in the occurrence of horizontal frontogenesis throughout the layer of 500 hPa and forming an upward movement column. Fourth, for the water vapor, the strong warm-humid airflow was superimposed on the cold-wet airflow so that a deep near-saturated water vapor layer formed below 600 hPa due to the upward movement column. In general, the abundant water vapor combined with the deep dynamic uplift led to the heavy snowfall at the Huanren station. The persisting cold air force and the slow movement of warm-humid air toward the north along with the cold air pad, provided a favorable condition for lasting snowfall and large snowfall volume.
Overall, by analyzing a blizzard in 2020 in Liaoning province, this study promotes the understanding of a typical backflow blizzard under the background of the northeast cold vortex. Moreover, with the adoption of the mesoscale numerical simulation, this study presented the formation, intensification, and termination of snowfall at Zhangwu and Huanren stations and revealed the contribution of airflow movement, water vapor variation, and frontogenesis occurrence to the snowfall intensity, duration, and volume. Therefore, this study provides a good reference for understanding snowfall heterogeneity and is conducive to the accurate prediction of backflow blizzards.
Overall, through the analysis of the heavy snowfall process under the northeast cold vortex, the heterogeneity of snowfall intensity and duration was revealed. This study has also generated some implications for the estimation of blizzards in Liaoning, a coastal area where the northeasterly wind may have different levels of water vapor. First, results are conducive to understanding such snowfall processes, which can further improve the numerical forecast and correction ability, thereby improving the accuracy and refined serviceability. Second, on the water vapor conditions, in this study, the northeasterly wind in the low-level coastal areas of eastern Liaoning carried ocean water vapor, which further transported and enhanced low-level water vapor. A similar situation might also be noticeable in the coastal areas in eastern China, the eastern coast of the Korean peninsula, and other similar areas where on the east part of the continent is the ocean. Third, the low-level northeasterly wind and the low-level wind that has an easterly wind component have the effect of transporting the water vapor on the ocean westward to the continent, which is beneficial to increasing water vapor in the lower layer. Such a process is not only applicable to the snowfall but also suitable for rainfall. Fourth, in the dynamic conditions, the low-level cold air in the northeast direction and the middle-level warm air in the southwest direction are superimposed in the vertical direction, where their forces are equivalent. Accordingly, this kind of weather situation and wind field could be a basis for analyzing the precipitation duration, which is also applicable in other regions.
Data Availability Statement
The raw data supporting the conclusions of this article will be made available by the authors without undue reservation.
Author Contributions
QY: conceptualization, methodology, formal analysis, investigation, writing—original draft. JC: formal analysis, software, review and editing, visualization. ZT: conceptualization, formal analysis, writing—review and editing, funding acquisition. B-JH: formal analysis, writing—original draft, supervision, project administration, writing—review and editing.
Funding
This project is financially sponsored by the National Key Research and Development Program (no. 2018YFC1507305) and the Special Project for Forecasters of China Meteorological Administration (no. CMAYBY 2019-024). Project NO. 2021CDJQY–004 supported by the Fundamental Research Funds for the Central Universities.
Conflict of Interest
The authors declare that the research was conducted in the absence of any commercial or financial relationships that could be construed as a potential conflict of interest.
Publisher’s Note
All claims expressed in this article are solely those of the authors and do not necessarily represent those of their affiliated organizations or those of the publisher, the editors, and the reviewers. Any product that may be evaluated in this article, or claim that may be made by its manufacturer, is not guaranteed or endorsed by the publisher.
Acknowledgments
The authors appreciate Miss Ziqi Zhao’s help in preparing figures and tables.
References
Bennetts, D. A., and Hoskins, B. J. (1979). Conditional Symmetric Instability - a Possible Explanation for Frontal Rainbands. Q.J R. Met. Soc. 105 (446), 945–962. doi:10.1002/qj.49710544615
Braham, R. R. (1983). The Midwest Snow Storm of 8-11 December 1977. Mon. Wea. Rev. 111 (2), 253–272. doi:10.1175/1520-0493(1983)111<0253:tmssod>2.0.co;2
Cui, H., and Su, A. (2019). Analysis on Characteristics and Causes of a Heavy Snowstorm Event in Southern Henan in the Beginning of January 2018. Torrential Rain Disasters 38 (2), 169–176. doi:10.3969/j.issn.1004-9045.2019.02.009
Cui, H.-Y., and Qiao, F.-L. (2016). Analysis of the Extremely Cold and Heavy Snowfall in North America in January 2015. Atmos. Ocean. Sci. Lett. 9 (2), 75–82. doi:10.1080/16742834.2016.1133057
Duan, Y., Wang, W., Tian, Z., and Zhang, N. (2013). Comparison of Two Rain-To-Blizzard Processes under Similar Conditions in Northern North China. Arid. Meteorol. 31 (4), 784–789. doi:10.11755/j.issn.1006-7639(2013)-04-0784
Fernández-González, S., Valero, F., Sánchez, J. L., Gascón, E., López, L., García-Ortega, E., et al. (2015). Numerical Simulations of Snowfall Events: Sensitivity Analysis of Physical Parameterizations. J. Geophys. Res. Atmos. 120 (19), 110130–110148. doi:10.1002/2015jd023793
Gao, S., Zhao, T., Song, L., Bai, H., Xu, L., Li, R., et al. (2020). Transporting Characteristics of Snowstorm Water Vapor over Liaoning Province in Winter. J. Glaciol. Geocryol. 42 (2), 439–446. doi:10.7522/j.issn.1000-0240.2020.0046
Hamzeh, N. H., Karami, S., Kaskaoutis, D. G., Tegen, I., Moradi, M., and Opp, C. (2021). Atmospheric Dynamics and Numerical Simulations of Six Frontal Dust Storms in the Middle East Region. Atmosphere 12 (1), 125. doi:10.3390/atmos12010125
He, B.-J., Zhao, D., Xiong, K., Qi, J., Ulpiani, G., Pignatta, G., et al. (2021). A Framework for Addressing Urban Heat Challenges and Associated Adaptive Behavior by the Public and the Issue of Willingness to Pay for Heat Resilient Infrastructure in Chongqing, China. Sustain. Cities Soc. 75, 103361. doi:10.1016/j.scs.2021.103361
IPCC (2018). “Global Warming of 1.5°C,”. An IPCC Special Report on the Impacts of Global Warming of 1.5°C above Pre-industrial Levels and Related Global Greenhouse Gas Emission Pathways, in the Context of Strengthening the Global Response to the Threat of Climate Change, Sustainable Development, and Efforts to Eradicate Poverty. Editors V. Masson-Delmotte, P. Zhai, H.-O. Pörtner, D. Roberts, J. Skea, P. R. Shuklaet al. (Cambridge, United Kingdom and NewYork, NY: Cambridge University Press), 1, 3–24. doi:10.1017/9781009157940.001
Ji, L., Quan, Z., Song, L., Kong, X., and Zhang, J. (2014). Numerical Simulation and Analysis of a Snowstorm Event in East Gansu Province. J. Arid Meteorology 32 (5), 845–850. doi:10.11755/j.issn.1006-7639(2014)-05-0845
Li, X.-f., Zhu, J.-j., Jia, Y., Liu, J., Li, N., and Li, F. (2007). Formation Process of Extraordinarily Serious Snowstorm and its Induced Damage in 2007 in Liaoning Province. Chin. J. Ecol. 26, 1250–1258.
Miao, C.-S., Xie, J., Wang, J.-h., and Zhang, N. (2010). Numerical Simulation and Diagnostic Analysis of a Cold Airflow Snowstorm Process in Shandong Peninsula. Journal of Nanjing Institute of Meteorology 33 (3), 257–265.
Millar, R. J. (2017). IPCC Says Limiting Global Warming to 1.5 °C Will Require Drastic Action. Nat. Geosci. 10, 3031. doi:10.1038/ngeo3031
Ninomiya, K. (1991). Polar Low Development over the East Coast of the Asian Continent on 9-11 December 1985. J. Meteorological Soc. Jpn. 69 (6), 669–685. doi:10.2151/jmsj1965.69.6_669
Pearce, R., Lloyd, D., and McConnell, D. (2001). The Post-christmas 'French' Storms of 1999. Weather 56 (3), 81–91. doi:10.1002/j.1477-8696.2001.tb06541.x
Rawlins, M. (2022). Why a Warming Climate Can Bring Bigger Snowstorms. The Conversation. Available at: https://theconversation.com/why-a-warming-climate-can-bring-bigger-snowstorms-176201.
Rosenzweig, C., Solecki, W., Romero-Lankao, P., Mehrotra, S., Dhakal, S., and Ibrahim, S. A. (2018). “Pathways to Urban Transformation,” in Climate Change and Cities: Second Assessment Report of the Urban Climate Change Research Network (New York: Cambridge University Press).
Salvia, M., Reckien, D., Pietrapertosa, F., Eckersley, P., Spyridaki, N.-A., Krook-Riekkola, A., et al. (2021). Will Climate Mitigation Ambitions Lead to Carbon Neutrality? an Analysis of the Local-Level Plans of 327 Cities in the EU. Renew. Sustain. Energy Rev. 135, 110253. doi:10.1016/j.rser.2020.110253
Sanders, F., and Bosart, L. F. (1985). Mesoscale Structure in the Megalopolitan Snowstorm of 11-12 February 1983. Part I: Frontogenetical Forcing and Symmetric Instability. J. Atmos. Sci. 42 (10), 1050–1061. doi:10.1175/1520-0469(1985)042<1050:msitms>2.0.co;2
Shimizu, N., and Uchida, A. (1974). An Observational Study of Organized Snow Echo over the Japan Sea. J. Meteorological Soc. Jpn. 52 (3), 289–299. doi:10.2151/jmsj1965.52.3_289
Solecki, W., Rosenzweig, C., Dhakal, S., Roberts, D., Barau, A. S., Schultz, S., et al. (2018). City Transformations in a 1.5 °C Warmer World. Nat. Clim. Change 8 (3), 177–181. doi:10.1038/s41558-018-0101-5
Ulbrich, U., Fink, A. H., Klawa, M., and Pinto, J. G. (2001). Three Extreme Storms over Europe in December 1999. Weather 56 (3), 70–80. doi:10.1002/j.1477-8696.2001.tb06540.x
UNEP (2021). “Facts about the Climate Emergency,” in Climate Actions (United Nations Environment Programme). Available at: https://www.unep.org/explore-topics/climate-action/facts-about-climate-emergency.
Wu, W., Deng, L., and Wang, S. (2011). Numerical Simulation of the "0911" North China Snowstorm and Analysis of Cloud Microphysical Characteristics. Meteorology 37 (8), 991–998. doi:10.7519/j.issn.1000-0526.2011.8.011
Wu, Z., Wang, J., and Zhao, G. (2012). Diagnostic Analysis of a Heavy Snowstorm Process in Tianjin Area. J. Meteorology Environ. 28 (6), 8–13.
Zhao, G. (2007). Analysis of the Blizzard Weather Caused by the Combined Action of a Backflow and an Inverted Trough. Meteorol. Mon. 11, 41–48. doi:10.7519/j.issn.1000-0526.2007.11.00748
Keywords: cold vortex, backflow blizzard, airflow movement, water vapor, frontogenesis occurrence
Citation: Yan Q, Cui J, Tan Z and He B-J (2022) On the Contributions of the Northeast Cold Vortex to the Formation and Evolution of Backflow Blizzard. Front. Earth Sci. 10:921043. doi: 10.3389/feart.2022.921043
Received: 15 April 2022; Accepted: 30 May 2022;
Published: 05 August 2022.
Edited by:
Xinli Ke, Huazhong Agricultural University, ChinaReviewed by:
Qian Cao, China University of Geosciences Wuhan, ChinaQingsong He, Huazhong University of Science and Technology, China
Copyright © 2022 Yan, Cui, Tan and He. This is an open-access article distributed under the terms of the Creative Commons Attribution License (CC BY). The use, distribution or reproduction in other forums is permitted, provided the original author(s) and the copyright owner(s) are credited and that the original publication in this journal is cited, in accordance with accepted academic practice. No use, distribution or reproduction is permitted which does not comply with these terms.
*Correspondence: Bao-Jie He, YmFvamllLnVuc3dAZ21haWwuY29t