- 1College of Transportation Engineering, Nanjing Tech University, Nanjing, China
- 2Key Laboratory of Urban Security and Disaster Engineering of China Ministry of Education, Beijing University of Technology, Beijing, China
- 3Institute of Geophysics, China Earthquake Administration, Beijing, China
During the rainy season from March to May 2018, four ground fissures were generated in the rift valley area along the first phase of the Nairobi–Malaba Railway in Kenya, among which the ground fissures B3 highway, DK76, and DK77 were larger in scale, which seriously endangered the safety of the railway. According to the author’s previous study, the ground fissure B3 highway belongs to a typical fault-type fissure, and the ground fissures DK76 and DK77 are qualitatively concluded to be generated under the groundwater erosion of collapsible soils. To quantitatively summarize the mechanism of ground fissures, DK76 and DK77, physical model tests on the overlying soil properties, compactness, the intersection angle between hidden cracks and the water flow direction, the height of confined water level, and the groundwater flow rate are conducted to analyze the effect of these factors on the formation and expansion of ground fissures. The test results show that the soil with strong collapsibility under the action of underground erosion produces fissures, collapses, and holes similar to those in the rift valley area along the first phase of the Nairobi–Malaba Railway in Kenya; the loose overburden is conducive to the occurrence of surface collapse; the collapse of the soil surface is the most severe when the underlaid cracks are parallel to the water flow direction; the higher confined water level and faster inflow rate will aggravate the collapse of the overlying soil layer.
1 Introduction
From March to May 2018, it was the rainy season in Kenya, and four ground fissures appeared successively in the Rift Valley along the Nairobi–Malaba Railway (hereinafter referred to as Nei-Ma railway). Among them, three larger ones are named ground fissure DK76, ground fissure DK77, and ground fissure B3 highway. The three ground fissures are arranged and spread from southwest to northeast, extending approximately vertically. The ground fissure B3 highway is distributed along the eastern boundary fault zone of the East African Rift Valley and consists of a series of nearly north–south strike normal faults, which belongs to a typical fault-type ground fissure. Compared to the ground fissure B3 highway, ground fissures DK76 and DK77 are small in scale, and there are a number of uneven ground settlements (as shown in Figures 1A,B) and local collapses along the fissures (Figures 1C,D). As can be seen from the figures, the vegetation covering the local uneven settlement and the collapsed cave is largely intact, and this geomorphic feature indicates that the formation of ground fissures is due to the loss of bearing capacity of the underlying soil layer, rather than the scouring effect of rainwater on the surface soil.
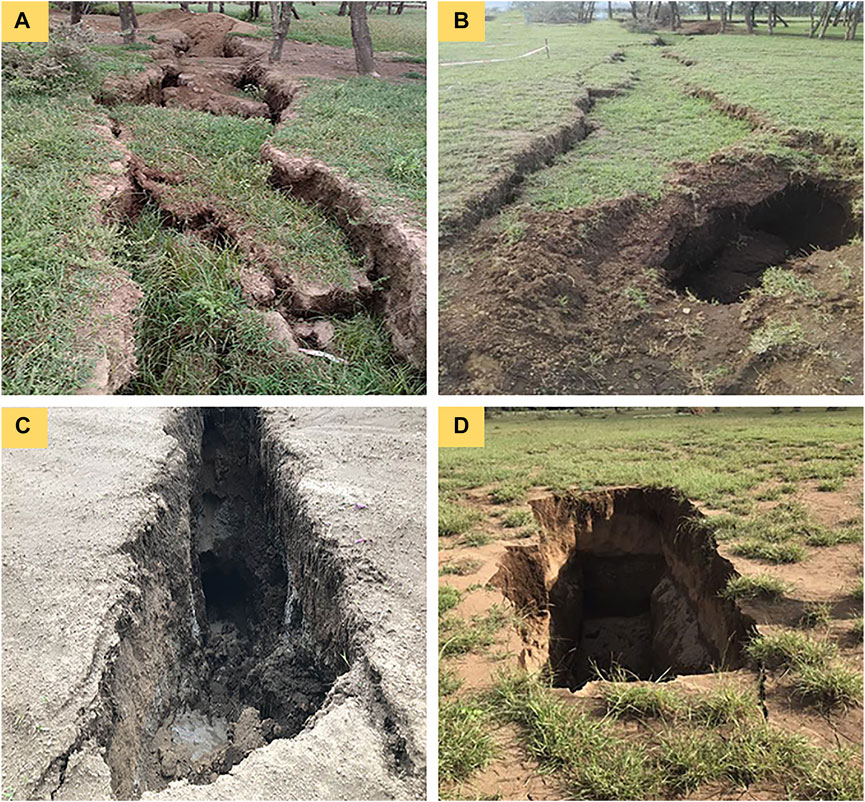
FIGURE 1. Uneven settlement of the surface. (A) Surface uneven settlement with complete vegetation; (B) surface uneven settlement with holes; (C) collapsed hole; and (D) collapsed hole with the complete surrounding vegetation.
Leonard (1929) started the first research on the mechanism of ground fissures, and then scholars usually divided them into structural and non-structural ground fissures for research. Structural ground fissures are mainly caused by crustal tectonic movement. In crustal tectonic movement, sudden seismic activity and tectonic creep activity occurring under the slow accumulation of tectonic stress over a large area may trigger ground fissures (Dobrev and Košt'ák, 2000; Wheeler, 2006; Bergemann et al., 2020; Mibei et al., 2021). The ground fissure B3 highway is characterized by such ground fissures. Non-structural ground fissures mainly include collapse-type ground fissures (Billi et al., 2016; Xu et al., 2016; Venturi et al., 2018), settlement-type ground fissures (Liu et al., 2015; Jin et al., 2016; Peng et al., 2018; Li et al., 2019), soil physical property ground fissures (Lu et al., 2019, 2021), and meteorological ground fissures (Gutie´rrez et al., 2014). It has been shown that many ground fissures are not of a single cause but are integrated causes of fissures dominated by one cause and influenced by other conditions (Wang et al., 2018; Yang et al., 2018; Valenta et al., 2021).
Therefore, when analyzing the conditions of formation of ground fissures, it is necessary to conduct targeted research in connection with specific phenomena. The primary condition controlling the activity of ground fissures is the degree of tectonic activity, followed by the degree of dynamical activity of disasters such as collapse and landslide as well as the conditions of hydrodynamic activity (Zhang et al., 2014; Peng et al., 2016; Bergemann et al., 2019; Jia et al., 2019; Nina et al., 2019; Wang et al., 2019).
2 Analysis of Influencing Factors on Ground Fissures DK76 and DK77
Through physical and mechanical tests on the soils at the ground fissures DK76 and DK77, combined with the results of the exploratory trench, our team proposed the conclusion that collapsible soils subjected to groundwater erosion is the mechanism of the ground fissures DK76 and DK77. First, during the geological tectonic activities, fractures and cracks form in the underlying bedrock, providing channels for groundwater intrusion into the overlying loose soil layer. During the dry season, the water level is low and the overlying soil layers are not affected by groundwater erosion, while in the rainy season, as the groundwater level rises, the groundwater flows along the bedrock cracks to the overlying soil layers, soaks the soils, destroying the cohesion of soils, stripping the soil particles, and subsequently leading to the continuous loss of soil-bearing capacity. As the water level drops, groundwater wrapped with stripped soil particles flows along the bedrock cracks to the lower part of the bedrock, causing the overlying soil layer to form a cavity at the bottom due to the loss of soil particles. With multiple cycles of groundwater fluctuations, the cavity at the bottom of the overlying soil layer gradually expands until the overlying soil layer loses its bearing capacity and collapses, manifesting as ground fissures and subsidence on the surface. Based on qualitative analysis, our research verified the rationality of the mechanism of ground fissures DK76 and DK77 by geotechnical and physical model tests (Hao et al., 2022).
From the previous mechanism analysis, it can be concluded that the main influencing factors for the formation and expansion of ground fissures DK76 and DK77 include: the influence of geological tectonic activities on the soil layer and the erosion of groundwater, etc. Geological tectonic activities, especially the tensional fault activities, will lead to the loosening of the overlying soil of the fault; the erosion action of groundwater is influenced by the confined water level, inflow rate, and outflow rate of groundwater and the intersection angle between hidden crack and the water flow direction.
On this basis, this study will analyze the effects of overlying soil collapsibility, compactness, confined water-level height, groundwater flow rate, and other factors on the formation and expansion of ground fissures through further physical model tests.
In addition, it is found that there are three hidden cracks in the bedrock through the ground fissure DK76 field exploratory trench, named LF1, LF2, and LF3, respectively (Figure 2), and there are three layers of soil overburden on the bedrock, the bottom layer is brownish-yellow silty clay (layer 1), the middle layer is green–gray volcanic ash (layer 2), and the top layer is grayish-yellow silty clay (layer 3). LF1 with a width of about 5 cm and no filler runs through the entire trench from south to north, and at its south end, a local collapse can be clearly seen in the soil profile corresponding to the ground fissure DK76 (the location of “this collapse” is shown in Figure 2A). LF2 filled with soil is intermittently distributed throughout the exploratory trench from south to north, and there is no surface collapse along LF2, but there are historical traces of large-scale collapse of the overlying soil at the southern end of LF2 (Figure 2B), and the structure of the overlying soil layer has changed, with layer 1 and layer 2 disappearing and only layer 3 covering the bedrock. LF3, which is about 5 cm wide and without fill, extends in an arc from the southwest corner of the exploratory trench to the east, while the volcanic ash layer of the overlying soil layer at the southern end of LF3 is about 5 cm lower than the volcanic ash layer at both sides (“predict the possible collapse in the future” in Figure 2C). To sum up, the overlying soil layers corresponding to LF1 and LF3 expose different degrees of settlement, while the overlying soil layers above LF2 are not, which results from the difference in the structure of the overlying soils. As shown in Figure 2, the overlying soil structure of LF1–LF3 from bottom to top is layer 1, layer 2, and layer 3, respectively. However, the overlying soil layer of LF2 is layer 3. The test study by Hao et al. (2022) shows that soil layer 1 has strong collapsibility compared with soil layer 2 and soil layer 3. Thus, it can be concluded that the soil property of the soil layer above the bedrock cracks is one of the factors affecting the formation and expansion of ground fissures under underground erosion.
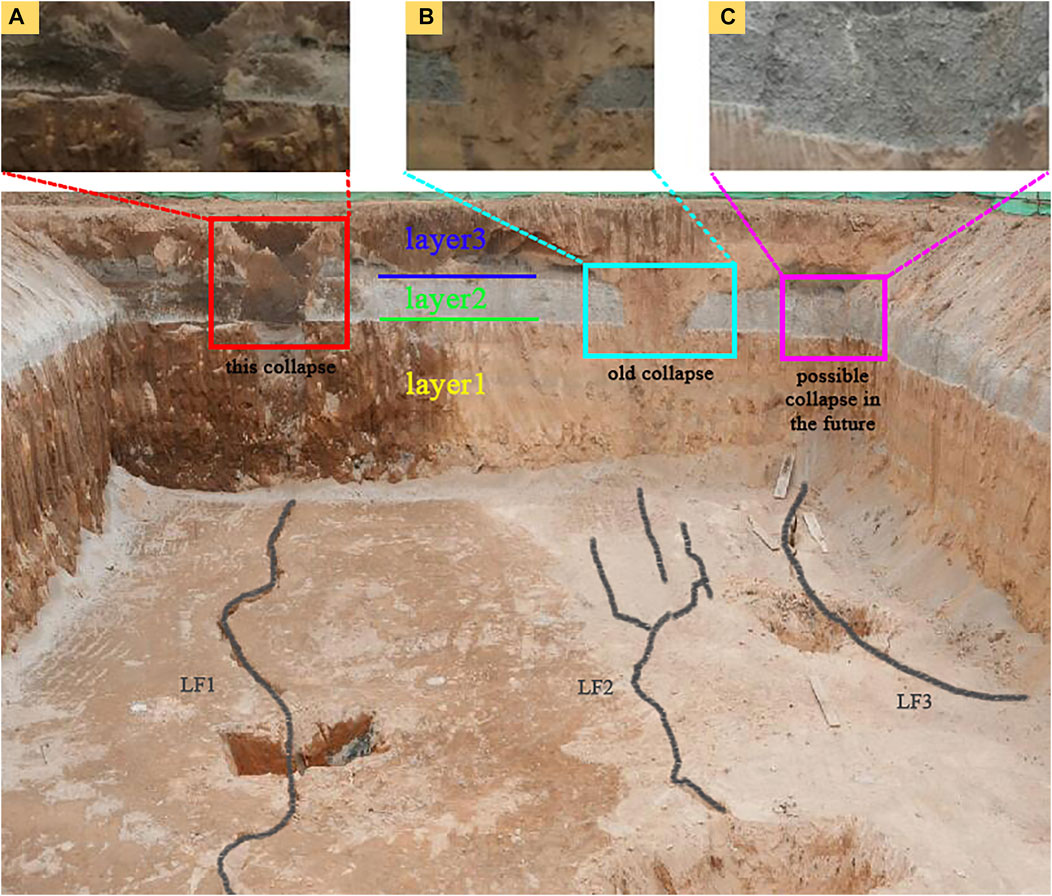
FIGURE 2. Location relation of overlying soil collapse and bedrock cracks in exploratory trench nearby ground fissure DK76. (A) Location of “this collapse”; (B) position of “old collapse”; (C) position of “possible collapse in the future.”
Based on the mechanism analysis of ground fissures, DK76 and DK77, in this study, physical model tests will be conducted on the effects of properties and compactness of the overlying soil layer, confined water level, inflow and outflow rates of groundwater, and the intersection angle between hidden cracks and the water flow direction, so as to reveal the formation mechanism and expansion feature of ground fissures DK76 and DK77.
3 Physical Model Test on the Genetic Mechanism of Ground Fissures in Kenya
3.1 Physical Model Design Principles
In the physical model test design, it should be given full consideration to the hydraulic conditions, property, and compactness of the overlying soil, to analyze the influence of various factors on the formation and expansion of ground fissures.
3.2 Test Modeling
Based on the aforementioned principles of the test model design, the model is designed into two parts, that is, a tempered glass chamber and a glass fiber-reinforced plastic tank, as represented in Figure 3. The bottom plate of the tempered glass chamber is set with three penetration joints with a parallel spacing of 50 mm to simulate hidden bedrock cracks; the test soil layer is laid on them. The tempered glass chamber is 780 mm diameter and 1000 mm height, the cracks are 5 mm wide and 760 mm long, and the chamber is equipped with a cover plate, and a positioning camera point is arranged in the center of the cover plate. A glass fiber-reinforced plastic tank is divided into the horizontal tank and vertical tank. The horizontal tank size is 1300 mm*1000 mm*500 mm, paved with stones to simulate the effect of the connecting channel under the hidden cracks and effectively reduce the speed of water influx and outflow. The top plate of the horizontal tank is equipped with an 800 mm diameter hole for positioning and installing a reinforced glass chamber, which simulates the change of the angle between the hidden cracks and the groundwater flow direction by rotating the reinforced glass chamber. There are four drainage holes with a diameter of 50 mm in front of the horizontal tank to control the falling speed of the groundwater level. The vertical flume size is 1000 mm*300 mm*1000 mm, for controlling the height of the water head and the rising speed of the groundwater level.
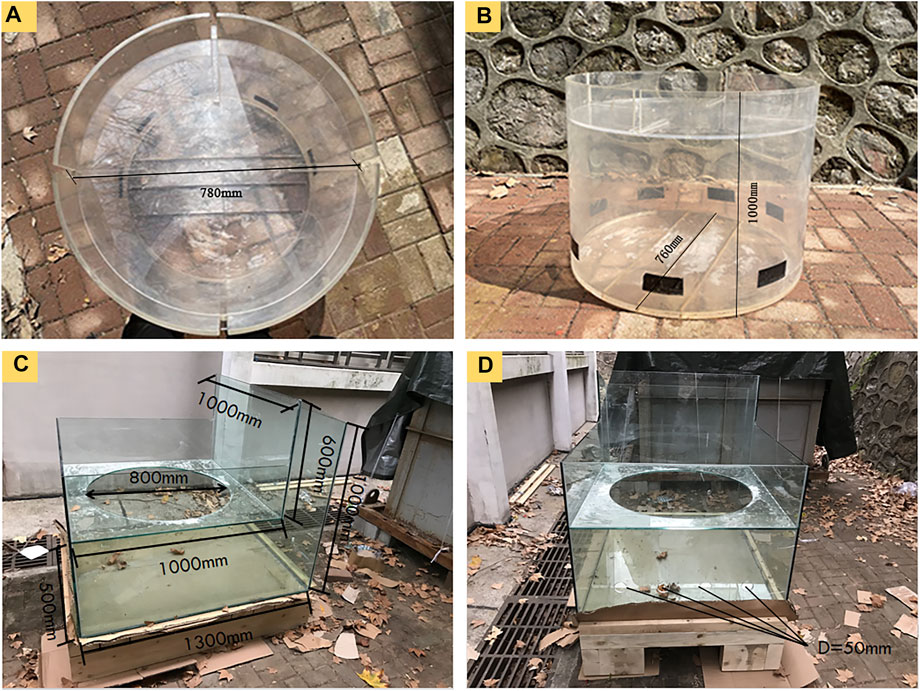
FIGURE 3. Designed test model. (A), (B) Hydrological condition control tank; (C,D) reinforced glass chamber of the simulated bedrock layer.
It is not difficult to obtain that the ratio of crack length to width is 152, and the ratio of crack spacing to crack width is 10. This design can better reflect the striking effect of hidden cracks and eliminate the mutual influence between cracks. In addition, the height of the reinforced glass chamber is set at 1000 mm to place the HD camera on the cover plate, to photograph the whole process of the soil surface change during underground erosion.
3.3 Test Design and Results Analysis
According to the factors affecting the breeding and development of ground fissures DK76 and DK77 mentioned earlier, quantitative physical model tests are carried out on the soil properties and compactness of the overlying soil layer, the angle between water flow direction and hidden cracks, the height of confined water level, inflow and outflow rates, and other factors.
3.3.1 Comparison Test of Overlying Soil Properties
Due to the shortage of undisturbed soil in the Kenya Rift Valley area, the test requirements could not be met. Therefore, based on the corresponding physical and mechanical properties obtained from geotechnical tests on undisturbed soil in the Kenya rift zone (basic physical indexes of soils are listed in Table 1). The northwest loess is used to replace layer 1, the brownish-yellow silty clay with strong collapsibility; the non-cohesive sand is used to replace the cyan–gray volcanic ash of layer 2; the silty clay with cohesive force but low collapsibility is used to simulate the grayish-yellow silty clay of layer 3, to compare and analyze the influence of soil properties of the overlying soil layers. The comparison test setup is shown in Table 2, and the tests are compared in two aspects: the first aspect is to observe the development degree of ground fissures after a long period of underground erosion. The comparison test group with thinner soil layer thickness and higher water flow rate is selected, which has a strong erosion effect, and the surface collapse can reach stability after a few times of water reserve and water discharge. The comparative analysis of the degree of collapse development can be carried out according to the collapse degree on the soil surface (Cases 1, 2, and 3). The second aspect is the collapsed form of the overlying soil layer in the process of erosion. The test group with a thicker soil layer and lower water rate, which has weaker erosion and slower development of bottom holes, was selected for the quantitative water reserve and discharge process, and the collapsed form can be observed from the profile and comparatively analyzed (Cases 4, 5, and 6).
3.3.1.1 Comparative Analysis of Soil Collapse Degree in Different Overlying Soil Layers
The test result of Case 1 is shown in Figure 4. The soil layer directly above the hidden cracks quickly infiltrates and quickly spreads to the whole soil layer when the silt clay is under erosion (e.g., Figures 4A,B); after repeated water reserve and discharge cycles, the surface collapses, followed by the formation of penetrating holes (e.g., Figures 4C,D), and a certain length of voids extend along the crack direction (e.g., Figures 4E,F).
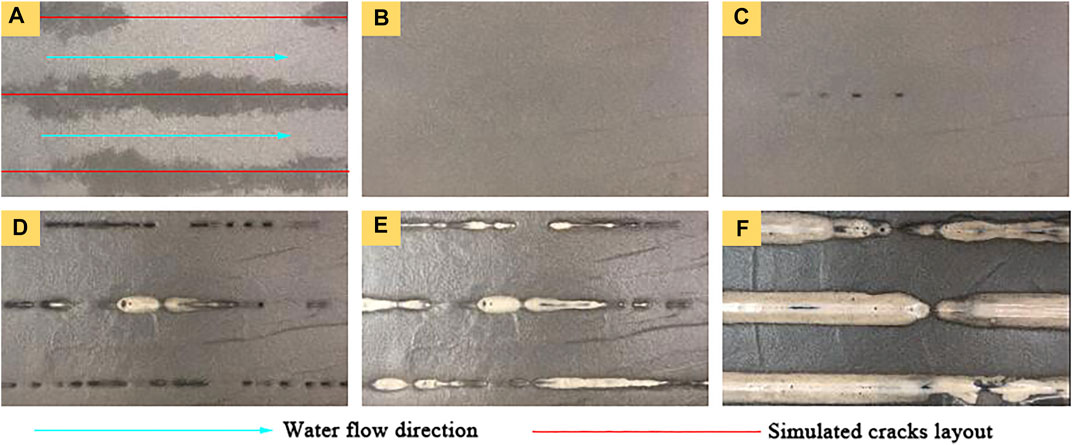
FIGURE 4. Surface collapse process under sand erosion. (A) After the first water reserve–discharge cycle; (B) after three water reserve–discharge cycles; (C) after five water reserve–discharge cycles; (D) after seven water reserve–discharge cycles; (E) after ten water reserve–discharge cycles; and (F) after thirteen water reserve–discharge cycles.
Under the action of erosion, the surface layer of non-collapsibility silt clay in Case 2 does not appear phenomenal, such as wetting belt, cracking, and collapse after exposing the same water reserve-drainage process as silt clay.
The test result of Case 3 is shown in Figure 5. Loess under the action of erosion, the surface fracture directly above the hidden cracks appears during a few times of water reserve and discharge cycle, and the surface soil is completely infiltrated (e.g., Figures 5A,B); after multiple water reserve–discharge cycles, the holes are further developed (e.g., Figures 5C,D), and intermittent penetration channels appear intermittently along the crack direction (e.g., Figures 5E,F).
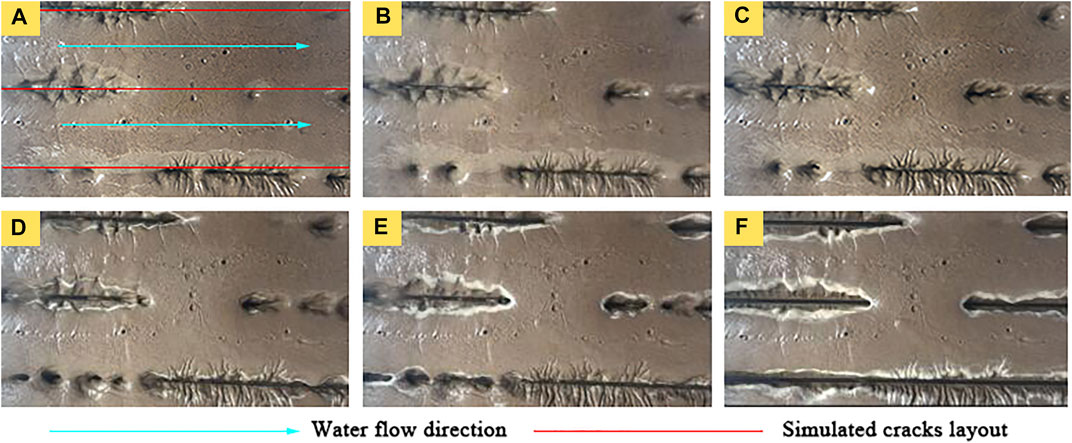
FIGURE 5. Surface collapse process under loess erosion. (A) After the first water reserve–discharge cycle; (B) after three water reserve–discharge cycles; (C) after five water reserve–discharge cycles; (D) after seven water reserve–discharge cycles; (E) after ten water reserve–discharge cycles; (F) and after thirteen water reserve–discharge cycles.
Comparing the test results of three types of soils, it can be seen that under the strong erosion effect, the test group with silt clay and loess as the overlying soil layer has an obvious collapse phenomenon, while the test group with silty clay has no surface collapse. The test results show that when the overlying soil layer is cohesionless or strong collapsibility soil, the ground surface is prone to ground fissures and collapses under erosion.
3.3.1.2 Comparative Analysis of Soil Collapse Forms in Different Overlying Layers
The profile comparison of the three categories of soils under weak erosion is given in Figure 6. The profile of Case 4 is shown in Figure 6A, it is obvious that silt forms a slide when it collapses, which is because the slit clay has low structural strength. When the silt particles at the bottom along the bedrock cracks are carried away by erosion and the bottom soil along the bedrock cracks is gradually lost, the upper soil gradually loses bearing capacity and slips toward the bottom, eventually forming a funnel-type hole or a slope-type groove above the bedrock cracks. During the test, the cracks expand to the surface at first and then filled by the slip silt, as shown in Figure 7. In the silt clay test, some small penetrating holes to the surface first appear by water reserve and discharge (Figure 7A); further water reserve and discharge makes the holes become larger, but some of the holes are filled gradually by slip silt (Figure 7B); finally, all the holes become larger and are filled by slip silt (Figure 7C). It can be seen that the characteristics of silt clay exhibits are significantly different from those investigated in field ground fissures. Figure 6B shows the test profile of Case 5, where the soil layer is undisturbed, due to the weak erosion of the low collapsibility silty clay.
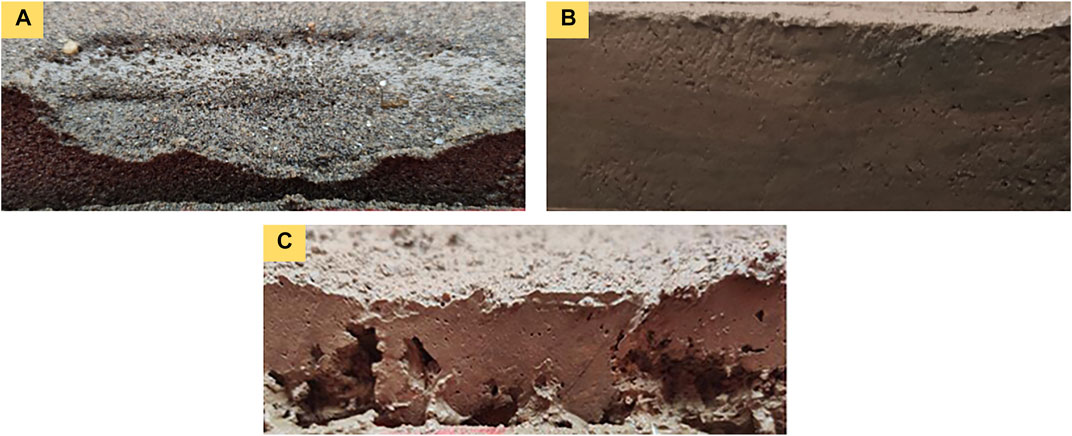
FIGURE 6. Profile phenomena after the erosion of three types of soils. (A) Silt; (B) silty clay; and (C) loess.
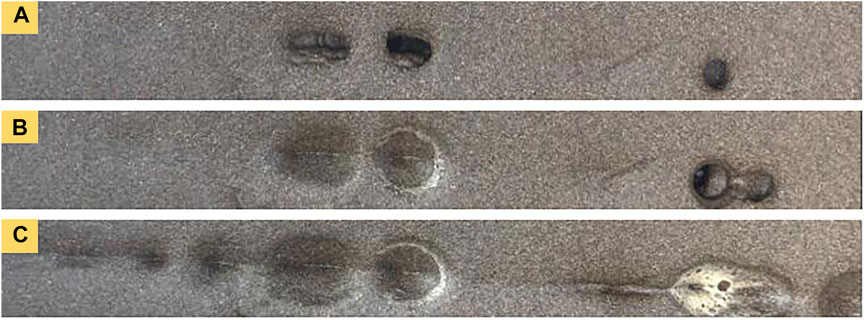
FIGURE 7. Test phenomena of the sand surface under subsurface erosion. (A) After three water reserve–discharge cycles; (B) after five water reserve–discharge cycles; and (C) after ten water reserve–discharge cycles.
The profile of Case 6 is shown in Figure 6C, the loess forms holes at the bottom of the soil layer under erosion, and its collapse pattern is different from that of the silt clay, which is due to the difference in cohesive force. By the continuous water reserve and discharge, the bottom soil particles along the bedrock cracks are taken away, the collapse holes are formed above the bedrock cracks, and due to the cohesive force, the soil on both sides of collapse holes does not slip. From the test results of loess under weak erosion, it can be seen that holes appear on the surface of loess and ground fissures appear along the direction of bedrock cracks, which is very similar to the phenomenon of uneven surface settlement accompanied by holes in situ (Figure 8A).
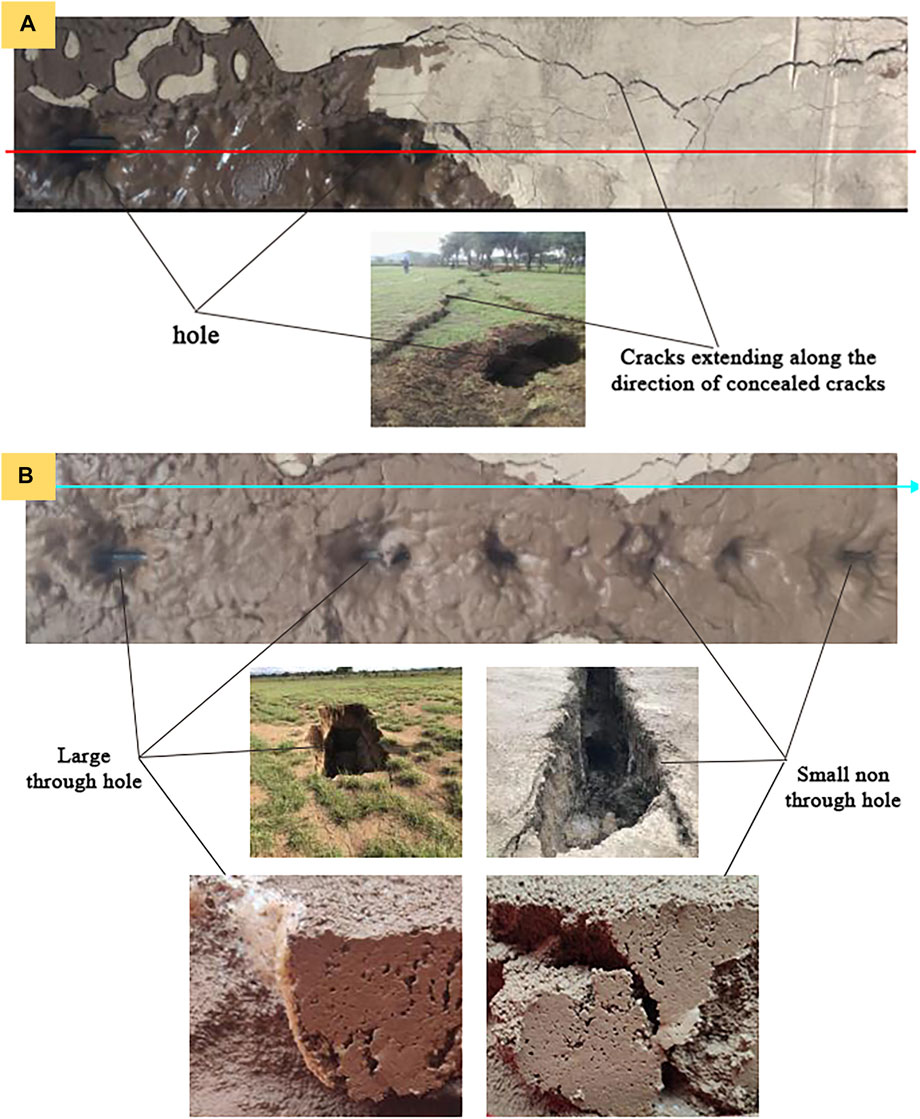
FIGURE 8. Comparison between loess test results and ground fissures with holes. (A) After the first impoundment and drainage (red line is the direction of simulated hidden fissures); and (B) after five times of impoundment and drainage (the blue arrow is the flow direction of water).
As can be observed from Figure 8B, when the underground erosion reaches a certain extent, two types of holes begin to appear in the loess surface layer, one is the larger penetration hole, occurring at the location close to the water inlet. From the corresponding profile, it can be seen that the collapse is vertical subsidence, similar to the deeper, large holes found by field investigation, and the other is the smaller size non-penetration holes, occurring at a location close to the water outlet. The collapse also shows vertical subsidence with possible small channels through the bottom, similar to the smaller holes found in the field survey.
Comparison tests results show that soils without cohesion exhibit slope collapse under erosion action, while silty clay with cohesion but weak collapsibility does not collapse under erosion, and only soils with cohesion and strong collapsibility can have a similar phenomenon to that of the ground fissure in Kenya, which is consistent with the test results of Hao Bing’s study that the brownish-yellow silty clay of layer 1 at the LF1 crack has strong collapsibility. It also explains the phenomenon that the collapse occurred after rainfall when the overlying layer of bedrock at LF2 was soil layer 1, while the collapse did not occur after rainfall when the overlying layer of bedrock was filled with layer 3, which has cohesive force but low collapsibility.
The subsequent tests will be conducted with loess as the overlying soil layer and analyzed the effects of soil compactness, simulated cracks and water flow direction angle, confined water-level height, and flow rate on the formation and development of ground fissures. The test design is listed in Table 3.
3.3.2 Comparison Test on the Compactness of the Overlying Soil Layer
The test results of Case 7 and Case 14 are used to compare and analyze the effect of overlying soil compactness on ground fissures’ incubation and development. The test results of compacted soil show local wetting near the water inlet and clear cracks appear on the top surface of the soil, while the test results of loose soil show penetration holes on the soil surface and locally connected collapse along the direction of hidden cracks. This indicates that the compacted soil has stronger resistance to erosion compared with the loose soil, and the loose soil is more likely to form ground fissures and collapses under the erosion of groundwater. The characteristics of this test are similar to the field investigation results. Combined with the previous study, it suggests that lower compacted site soils are more likely to form ground fissures and collapses under erosion.
3.3.3 Comparison Test on the Included Angle Between Simulated Crack and Water Flow Direction
Based on the test results of Case 8 and Case 14, we compare and analyze the effect of the included angle between hidden cracks and water flow direction on the incubation and development of ground fissures. The tests with an angle of 0° present discontinuous penetration holes on the surface, while the tests with an included angle of 90° present wetting and ground fissures on the surface. The test phenomenon of 0° is consistent with the distribution characteristics of ground fissures and collapses along the hidden cracks in the field.
3.3.4 Comparative Test of Different Confined Water Levels and Water Flow Rates
Tests are designed for a 2-cm-thick soil layer with a 1-cm high confined water level, and a 5-cm-thick soil layer with a 3-cm high confined water level two group tests. Each test set shows slow water reserve–slow water discharge, fast water reserve–slow water discharge, slow water reserve–fast water discharge, and fast water reserve–fast water discharge in four comparison groups. The phenomenon of the test group with a 2-cm-thick soil layer and a 1-cm high confined water level is the collapse process shown in Figure 7, which is not repetitious here. The phenomenon of the test group with a 5-cm-thick soil layer and 3-cm high confined water level is shown in Figure 9. Loess under the action of erosion, the surface fracture directly above the hidden cracks appears during the first water reserve and discharge cycle, accompanied by holes, and the surface soil is not completely infiltrated (e.g., Figures 9A,B); after multiple water reserve–discharge cycles, the soil is gradually infiltrated, the holes are further developed (e.g., Figures 9C,D), and holes of different scales appear intermittently along the direction of cracks (e.g., Figures 9E,F).
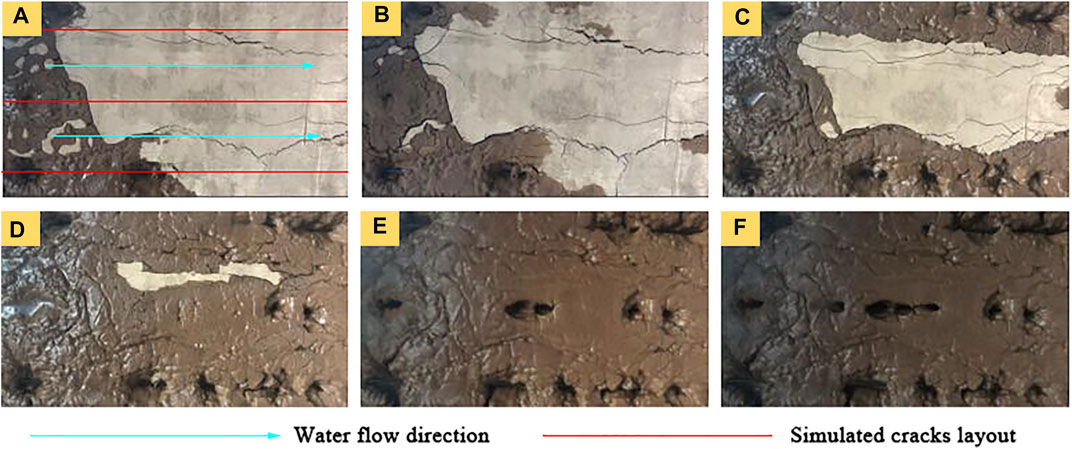
FIGURE 9. Test results of 2-cm-thick soil layer and 1-cm confined water level. (A) After the first water reserve–discharge cycle, (B) after three water reserve–discharge cycles; (C) after five water reserve–discharge cycles; (D) after seven water reserve–discharge cycles; (E) after ten water reserve–discharge cycles; and (F) after thirteen water reserve–discharge cycles.
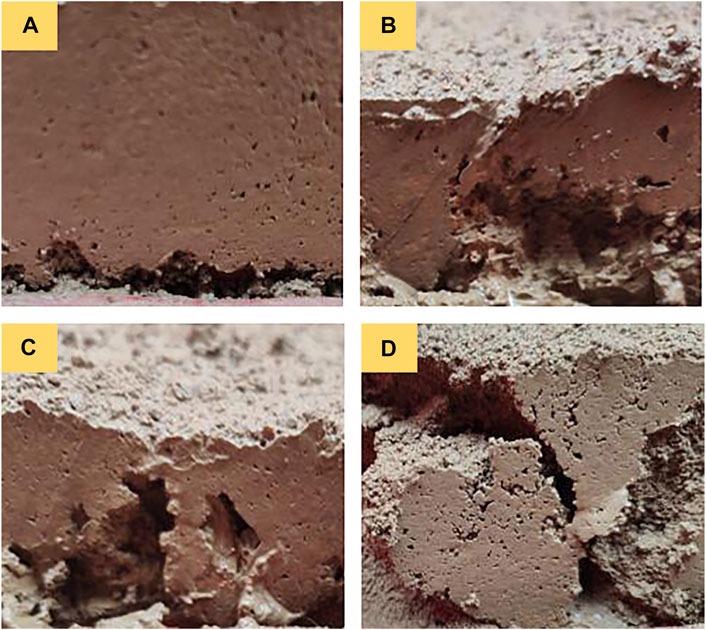
To further explain the progress of ground fissure formation, the relative test profiles are drawn in Figure 10. It is seen that the collapse progress of collapsibility soil performs as follows: under the action of erosion, first the collapsibility soil layer is hollowed out and small holes are formed (Figure 10A); next, the holes gradually expand and interpenetrate (Figure 10B); then, the holes continue to expand upward to the surface and penetrate along bedrock cracks (Figure 10C) and eventually, forms collapse holes or gutters (Figure 10D).
There are two kinds of water reserve speed settings: slow water injection and fast water injection: slow water injection is carried out by a water pipe with a diameter of 30 mm; rapid water injection is to calculate the water injection amount in advance and quickly inject the required test water into the water injection tank. Discharge speed is set to two forms middle double-hole and four-hole discharge. Each test ends after 20 cycles of water reserve and discharge.
The test phenomena under different reserve–discharge combinations with the same collapse form are very close, and it is difficult to conduct a comparative analysis. Therefore, it is necessary to quantify the test results and quantitatively analyze the effects of water reserve and discharge rate on underground erosion. Quantitative analysis of test pictures requires data processing of images, and binarization of the pictures is a simple and effective method for data processing of images. The RGB images of the test results are grayed out according to the test situation to obtain grayed-out images that retain information about the collapse, and then the grayed-out images are binarized by selecting a threshold value to obtain binarized images with only black and white color points. The binary images are read and the proportion of white spots is determined, to determine the proportion of the crack area in the whole shooting area. The specific processing method is as follows: Figure 11A is the original RGB image, and the image is processed to obtain a grayscale image where the ground fissures and the uncollapsed soil can be clearly distinguished, as shown in Figure 11B; an appropriate threshold is selected to make the image become a binarized image while keeping the shape of the cracks on the soil surface as much as possible, as shown in Figure 11C, from which the number of white spots is calculated as 6,92,386, accounting for 36.61% of the total points, and the crack development degree is determined to be 36.61%.

FIGURE 11. Display of picture-processing results. (A) Original picture, (B) grayscale picture, and (C) binary picture.
According to the aforementioned image-processing method, the crack development degree determined after processing the test results is listed in Table 4. It can be concluded that the closer the confined water level is to the soil surface, the easier it is to breed and develop ground fissures. Under the conditions of fast reserve and fast discharge, the proportion of crack area discrimination is the largest, while under the conditions of slow reserve and slow discharge, the proportion of crack area discrimination is the smallest, which shows that fast reserve and fast discharge aggravate the occurrence of cracks. Under the condition of the same layer thickness and confined water level, the discrimination ratio of a crack area in fast reserve–slow discharge test is larger than that in slow reserve–fast discharge test, which indicates that fast reserve is more likely to cause ground cracks than fast discharge.
4 Discussion
Combining the previously mentioned tests for a comprehensive analysis, the overlying soil layer above the bedrock has strong cohesion and collapsibility. The continuous expansion of rock cracks loosens the overlying soil layer near the bedrock cracks, and the included angle between hidden cracks and the groundwater flow direction is close to 0°—are important factors to produce ground fissures DK76 and DK77. The closer the confined water level is to the soil surface, the faster the groundwater flows into and out of the overlying soil layer and the more obvious the development of ground fissures is. Based on the earlier findings, the inference of the formation mechanism of ground fissures in the valley floor area of Nei-Ma Railway in Kenya proposed by previous research is supplemented as follows:
First, during the geological tectonic activity, the bedrock is subjected to tension and pressure to produce hidden cracks, forming a channel for the upward and downward flow of groundwater; the continuous expansion of bedrock cracks makes the overlying soil near it loose and susceptible to underground erosion and makes groundwater flow easily along the direction of crack extension, providing tectonic conditions for the formation of ground fissures. During strong rainfall, the groundwater level in bedrock cracks rises continuously due to rainwater inflow, and groundwater flows upward through the hidden cracks, soaking the brownish-yellow silty clay layer with high cohesion and strong collapsibility, partially destroying its structure, and with the continuous erosion effect, the soil structure damage area increases and gradually spreads to the surface. After heavy rainfall, the groundwater level decreases due to seepage, and some soil particles flow out along bedrock cracks to lower cracks and cavities, forming small holes at the bottom of the overlying soil layer. Because of the high cohesive force of soil, there is still partial bearing capacity for the upper part of the soil layer, and the ground surface will not collapse immediately. During the strong rainfall season, the groundwater level keeps rising and falling, and the cavity at the bottom of the overlying soil layer gradually expands, leading to the gradual loss of its bearing capacity on the upper part of the soil layer. When the groundwater level is far from the surface of the soil layer and the flow rate is slow, it is easy to produce ground fissures, uneven settlement, and intermittent holes on the surface; when the groundwater level is close to the surface of the soil layer and the flow rate is fast, it is easy to trigger geological disasters such as surface collapses and gullies.
5 Conclusion
Based on the inference of the genesis mechanism of ground fissures DK76 and DK77 in the rift valley area of Kenya, through field investigation and combined with geological exploration data, this study concluded that the influencing factors of ground fissure incubation and development include the properties and compactness of the overlying soil on the bedrock, the included angle between the hidden cracks and the water flow direction, the height of confined water level, and the rate of groundwater flow. The main conclusions drawn from the item-by-item analysis in combination with the physical model tests are as follows:
1) The cohesive force and high collapsibility of the overlying soil layer on the bedrock are important factors for the generation of ground fissures DK76 and DK77. When the overlying soil layer has no cohesion, it is easy to form landslide collapse under the action of erosion; when the overlying soil layer has cohesion but low collapsibility, the surface is not easy to appear ground fissure or collapse; only when the overlying soil has cohesion and high collapsibility, it can produce geological phenomena similar to the field situation.
2) The small compactness of soil and the angle between hidden cracks and the direction of groundwater flow is close to 0° are important factors for the generation of ground fissures. Therefore, before the occurrence of a ground fissure, the continuous expansion of bedrock cracks loosens the overlying soil near the bedrock cracks, making it easy for groundwater to flow along the direction of crack extension, providing tectonic conditions for the formation of ground fissures.
3) The closer the confined water level is to the soil surface, the easier it is to breed and develop ground fissures; the faster the groundwater inflow and outflow rates are, the more remarkable the development of fissures is. When the groundwater level is far from the surface of the soil layer and the flow rate is slow, it is easy to produce ground fissures, uneven settlement, and intermittent holes on the surface; when the groundwater level is close to the surface of the soil layer and the flow rate is fast, it is easy to trigger geological disasters such as surface collapses and gullies.
Data Availability Statement
The original contributions presented in the study are included in the article/Supplementary Material; further inquiries can be directed to the corresponding author.
Author Contributions
All authors contributed to the study conception and design. XiL provided the background conditions for the research. ZZ contributed to the conception of the study and the materials needed for the experiments. YL and BH designed and completed a series of experimental works. YL, XuL, and YH processed and analyzed the results. YL wrote the first draft of the manuscript. BH enriched the manuscript and improved the quality of all the images. ZZ revised and embellished the language, and LJ revised the overall framework and format of the manuscript. All authors read and approved the final manuscript.
Funding
The authors would like to thank the financial support for the study presented in this article from the National Natural Science Foundation of China (Grant Nos. U1839202 and 41374049).
Conflict of Interest
The authors declare that the research was conducted in the absence of any commercial or financial relationships that could be construed as a potential conflict of interest.
Publisher’s Note
All claims expressed in this article are solely those of the authors and do not necessarily represent those of their affiliated organizations, or those of the publisher, the editors, and the reviewers. Any product that may be evaluated in this article, or claim that may be made by its manufacturer, is not guaranteed or endorsed by the publisher.
References
Bergemann, C. A., Gnos, E., Berger, A., Janots, E., and Whitehouse, M. J. (2020). Dating Tectonic Activity in the Lepontine Dome and Rhone-Simplon Fault Regions through Hydrothermal monazite-(Ce). Solid earth. 11 (1), 199–222. doi:10.5194/se-11-199-2020
Bergemann, C. A., Gnos, E., and Whitehouse, M. J. (2019). Insights into the Tectonic History of the Western Alps through Dating of Fissure Monazite in the Mont Blanc and Aiguilles Rouges Massifs. Tectonophysics 750, 203–212. doi:10.1016/j.tecto.2018.11.013
Billi, A., De Filippis, L., Poncia, P. P., Sella, P., and Faccenna, C. (2016). Hidden Sinkholes and Karst Cavities in the Travertine Plateau of a Highly-Populated Geothermal Seismic Territory (Tivoli, Central Italy). Geomorphology 255, 63–80. doi:10.1016/j.geomorph.2015.12.011
Dobrev, N. D., and Košt'ák, B. (2000). Monitoring Tectonic Movements in the Simitli Graben, SW Bulgaria. Eng. Geol. 57 (3-4), 179–192. doi:10.1016/s0013-7952(00)00027-2
Gutie´rrez, F., Parise, M., De Waele, J., and Jourde, H. (2014). A Review on Natural and Human-Induced Geohazards and Impacts in Karst. Earth Sci. Rev. 138, 61–88.
Hao, B., Zhou, Z. H., Li, Y. D., Li, X. J., and Jin, L. G. (2022). Experimental Analysis on Mechanical Characteristics of Foundation Soil in Rift Valley Area of Kenya Nairobi-Malaba Railway. Front. Earth Sci. 2022, Under review. doi:10.3389/feart.2022.909102
Jia, Z., Lu, Q., Peng, J., Qiao, J., Wang, F., Wang, S., et al. (2019). Analysis and Comparison of Two Types of Ground Fissures in Dali County in the Weihe Basin, China. Environ. Earth Sci. 79 (1), 38. doi:10.1007/s12665-019-8783-1
Jin, W.-z., Luo, Z.-j., and Wu, X.-h. (2016). Sensitivity Analysis of Related Parameters in Simulation of Land Subsidence and Ground Fissures Caused by Groundwater Exploitation. Bull. Eng. Geol. Environ. 75 (3), 1143–1156. doi:10.1007/s10064-016-0897-z
Leonard, R. J. (1929). An Earth Fissure in Southern Arizona. J. Geol. 37, 765–774. doi:10.1086/623676
Li, M., Ge, D., Liu, B., Zhang, L., Wang, Y., Guo, X., et al. (2019). Research on Development Characteristics and Failure Mechanism of Land Subsidence and Ground Fissure in Xi'an, Monitored by Using Time-Series SAR Interferometry. Geomatics, Nat. Hazards Risk 10 (1), 699–718. doi:10.1080/19475705.2018.1542350
Liu, H., Deng, K., Lei, S., and Bian, Z. (2015). Mechanism of Formation of Sliding Ground Fissure in Loess Hilly Areas Caused by Underground Mining. Int. J. Min. Sci. Technol. 25 (4), 553–558. doi:10.1016/j.ijmst.2015.05.006
Liu, N., Feng, X., Huang, Q., Fan, W., Peng, J., Lu, Q., et al. (2019). Dynamic Characteristics of a Ground Fissure Site. Eng. Geol. 248, 220–229. doi:10.1016/j.enggeo.2018.12.003
Liu, Z., Lu, Q., Qiao, J., and Fan, W. (2021). In Situ water Immersion Research on the Formation Mechanism of Collapsible Earth Fissures. Eng. Geol. 280, 105936. doi:10.1016/j.enggeo.2020.105936
Lu, Q. Z., Qiao, J. W., Peng, J. B., Liu, Z. H., Liu, C., Tian, L. Y., et al. (2019). A Typical Earth Fissure Resulting from Loess Collapse on the Loess Plateau in the Weihe Basin. China. Eng. Geol. 259. doi:10.1016/j.enggeo.2019.105189
Mibei, G., Harðarson, B. S., Franzson, H., Bali, E., Geirsson, H., and Guðfinnsson, G. H. (2021). Eruptive History and Volcano-Tectonic Evolution of Paka Volcanic Complex in the Northern Kenya Rift: Insights into the Geothermal Heat Source. J. Afr. Earth Sci. 173, 103951. doi:10.1016/j.jafrearsci.2020.103951
Peng, J., Qu, W., Ren, J., Zhang, Q., and Wang, F. (2018). Geological Factors for the Formation of Xi'an Ground Fractures. J. Earth Sci. 29 (2), 468–478. doi:10.1007/s12583-018-0841-1
Peng, J., Xu, J., Ma, R., and Wang, F. (2016). Characteristics and Mechanism of the Longyao Ground Fissure on North China Plain, China. Eng. Geol. 214, 136–146. doi:10.1016/j.enggeo.2016.10.008
Valenta, J., Verner, K., Martínek, K., Hroch, T., Buriánek, D., Megerssa, L. A., et al. (2021). Ground Fissures within the Main Ethiopian Rift: Tectonic, Lithological and Piping Controls. Earth Surf. Process. Landf. 46 (15), 3158–3174. doi:10.1002/esp.5227
Venturi, S., Tassi, F., Vaselli, O., Vougioukalakis, G. E., Rashed, H., Kanellopoulos, C., et al. (2018). Active Hydrothermal Fluids Circulation Triggering Small-Scale Collapse Events: the Case of the 2001-2002 Fissure in the Lakki Plain (Nisyros Island, Aegean Sea, Greece). Nat. Hazards 93 (2), 601–626. doi:10.1007/s11069-018-3318-8
Wang, F. Y., Peng, J. B., Meng, Z. J., Qiao, J. W., Wen, H. G., Ma, P. H., et al. (2019). The Origin and Impact of the Shizhuang Ground Fissure, Yingxian Area, Datong Basin, China. Eng. Geol. 261. doi:10.1016/j.enggeo.2019.105283
Wang, Z.-F., Cheng, W.-C., and Wang, Y.-Q. (2018). Investigation into Geohazards during Urbanization Process of Xi'an, China. Nat. Hazards 92 (3), 1937–1953. doi:10.1007/s11069-018-3280-5
Wheeler, R. L. (2006). Quaternary Tectonic Faulting in the Eastern United States. Eng. Geol. 82 (3), 165–186. doi:10.1016/j.enggeo.2005.10.005
Xu, L., Li, S., Cao, X., Somerville, I. D., Suo, Y., Liu, X., et al. (2016). Holocene Intracontinental Deformation of the Northern North China Plain: Evidence of Tectonic Ground Fissures. J. Asian Earth Sci. 119 (1), 49–64. doi:10.1016/j.jseaes.2016.01.003
Yang, C., Lu, Z., Zhang, Q., Zhao, C., Peng, J., and Ji, L. (2018). Deformation at longyao ground fissure and its surroundings, north china plain, revealed by alos palsar ps-insar. Int. J. Appl. Earth Observation Geoinformation 67 (1), 1–9. doi:10.1016/j.jag.2017.12.010
Keywords: Rift Valley area, ground fissure, underground erosion, physical model test, collapsibility, compactness
Citation: Hao B, Zhou Z, Li Y, Li X, Liu X, Han Y and Jin L (2022) Analysis of the Mechanism of Ground Fissures in the Nairobi–Malaba Railway Rift Valley Area in Kenya. Front. Earth Sci. 10:916753. doi: 10.3389/feart.2022.916753
Received: 10 April 2022; Accepted: 09 May 2022;
Published: 20 June 2022.
Edited by:
Guang-Liang Feng, Institute of Rock and Soil Mechanics (CAS), ChinaReviewed by:
Weibing Gong, University of California, Berkeley, United StatesWeiyun Chen, Sun Yat-sen University, China
Copyright © 2022 Hao, Zhou, Li, Li, Liu, Han and Jin. This is an open-access article distributed under the terms of the Creative Commons Attribution License (CC BY). The use, distribution or reproduction in other forums is permitted, provided the original author(s) and the copyright owner(s) are credited and that the original publication in this journal is cited, in accordance with accepted academic practice. No use, distribution or reproduction is permitted which does not comply with these terms.
*Correspondence: Xiaojun Li, bGl4aWFvanVuQGJqdXQuZWR1LmNu
 Bing Hao
 Zhenghua Zhou1
 Yuandong Li
 Xiaojun Li
 Xujin Liu
 Liguo Jin


