
94% of researchers rate our articles as excellent or good
Learn more about the work of our research integrity team to safeguard the quality of each article we publish.
Find out more
ORIGINAL RESEARCH article
Front. Earth Sci., 24 August 2022
Sec. Volcanology
Volume 10 - 2022 | https://doi.org/10.3389/feart.2022.912835
This article is part of the Research TopicVolcanic Forecasting, Crisis Management, and Risk CommunicationView all 8 articles
 Benjamin Bernard1*
 Pablo Samaniego2
 Larry Mastin3
 Stephen Hernandez1
 Gerardo Pino1
 Jamie Kibler4
 Marjorie Encalada1
 Silvana Hidalgo1
 Nicole Vizuete2
Volcanic ash is a hazard to human health and activities. Accurate and timely forecasts coupled with effective communication about the dispersion and fallout of volcanic ash during explosive events are essential to reduce impacts on local communities and limit economic losses. In this study, we present the first detailed description of an eruptive pulse at Sangay volcano and its eruption source parameters. The eruptive pulse on September 20, 2020, started at about 9:20 UTC and lasted between 90 and 100 min, producing an eruptive column that rapidly separated into (1) a higher (15.2 km above sea level, asl), gas-rich cloud moving east-southeast and (2) a lower (12.2 km asl), ash-rich cloud moving west and causing ash fallout up to 280 km from the volcano. Field data collected immediately after the event allow estimating the volume of bulk tephra to be between 1.5 and 5.0 × 10⁶ m3, corresponding to a volcanic explosivity index of 2. The eruptive pulse, identified as violent Strombolian, emitted andesitic ash that was more mafic than products ejected by Sangay volcano in recent decades. Component analysis and glass chemistry of juvenile particles support the hypothesis that this event excavated deeper into the upper conduit compared to typical Strombolian activity at Sangay volcano, while grain-size analysis allows reconstruction of the total grain-size distribution of the fallout deposit. The discrepancies between the ash fallout simulations performed with the Ash3D online tool and the actual deposit are mainly the result of inaccurate pre- and syn-eruptive configurations and highlight the importance of additional processes such as aggregation. Communication products issued during the event included (1) several standard short reports, (2) volcano observatory notices for aviation, (3) social media posts, and (4) a special report providing the results of the ash fallout simulation. Although communication was effective with the authorities and the connected population, an effort must be made to reach the most vulnerable isolated communities for future events. This study shows that forecasting ash dispersion and fallout during volcanic eruptions can guide early warnings and trigger humanitarian actions, and should become a standard in volcano observatories worldwide.
Volcanic eruptions are natural phenomena that can be highly disruptive for our society. The extent of the disruption depends on the eruption style and magnitude as well as the community preparedness and response, which can be greatly enhanced by timely and relevant monitoring, forecasting and warning protocols (Pallister et al., 2019 and references therein, Lowenstern et al., 2022). Although this work is carried out by many volcano observatories, it is rare to read in the scientific literature about lessons learned from the real-time applications of these protocols (Mei et al., 2013; Parker, 2015; Poland et al., 2016; Coombs et al., 2018; Wright et al., 2019; Lowenstern et al., 2022). In recent years, major progress has been made in tracking and forecasting the dispersion of volcanic ash clouds using near-real-time satellite imagery and numerical simulations (Webley and Mastin, 2009; Bonadonna et al., 2012 and references therein; Falconieri et al., 2018; Gouhier et al., 2020; Pardini et al., 2020). Assessing the effectiveness of forecasts made during volcanic eruptions is essential to improve eruption source parameters, numerical codes and operational protocols.
Since 1983, the Instituto Geofísico de la Escuela Politécnica Nacional (IG-EPN) has been monitoring Ecuadorian volcanoes, improving through time its ground-based instrument networks, remote sensing capabilities and communication protocols (Ruiz et al., 1998; Kumagai et al., 2007; Carn et al., 2008; Galle et al., 2010; Alvarado et al., 2018; Pritchard et al., 2018; Ramón et al., 2021; Bernard et al., 2022). Additionally, since 1997, the Washington Volcanic Ash Advisory Center (W-VAAC) has been tracking and forecasting ash clouds in Ecuador (Bernard et al., 2019), although satellite monitoring of volcanic clouds began in the late 1980s (Heffter et al., 1990). It is worth mentioning that more than 40% of the advisories issued by the W-VAAC during 2009–2019 (6197 out of 15374) were for Ecuadorian volcanoes (Engwell et al., 2021), highlighting the importance of this hazard in this country. In recent years, numerical modeling of ash dispersion and sedimentation has become an important tool for volcanic hazard evaluation in Ecuador (Volentik et al., 2010; Biass et al., 2012; Parra et al., 2016; Parra, 2018; Tadini et al., 2020).
Sangay volcano (2.00°S, 78.34°W, 5326 m above sea level–asl, Figures 1A, B), located at the southern end of the Northern Volcanic Zone of the Andes (Morona Santiago province), has frequently been referred to as one of the most active volcanoes in the world (Siebert et al., 2010). This mostly andesitic stratovolcano exhibits a large range of geochemical compositions (from basalt to dacite) and eruptive phenomena (lava flows and domes, pyroclastic density currents, tephra fallout), as well as rain-triggered lahars and giant landslides (Monzier et al., 1999; Valverde et al., 2021). First documentation of activity dates back to 1628 CE when the city of Riobamba, located 50 km northwest of the volcano, and surroundings were covered in ash, damaging crops and affecting livestock (Wolf, 1904; Lewis, 1950; Monzier et al., 1999). Many eruptions occurred during the 18th, 19th and 20th centuries although none of them reached the magnitude and impact of the 1628 CE eruption. Due to its remote location and mostly low-intensity activity, Sangay has not been monitored as closely as other Ecuadorian volcanoes, such as Cotopaxi, Tungurahua and Pichincha (Alvarado et al., 2018). Nonetheless, some efforts have been carried out to obtain meaningful information on its eruptive dynamics (Johnson et al., 2003; Lees and Ruiz, 2008; Ruiz et al., 2017). Recently, ground-based and satellite instruments have been combined to increase the monitoring capability at Sangay (Vasconez et al., 2022), but eruption source parameters (ESPs), generally constrained by detailed field and remote sensing studies, are still lacking.
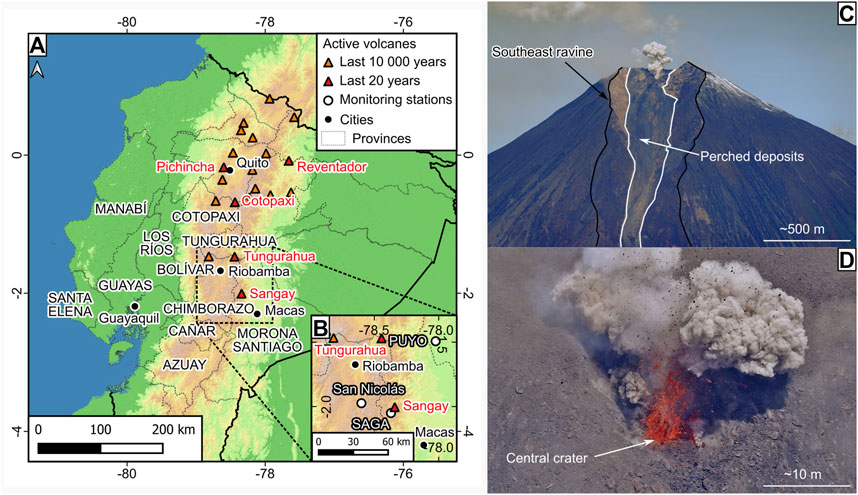
FIGURE 1. General map and photos of Sangay volcano. (A) General map of active Ecuadorian volcanoes (data source: Digital Elevation Model FABDEM; Volcanoes and Monitoring stations IG-EPN; Cities and Provinces IGM; WGS 84); (B) Close up to the Sangay area and the monitoring network in 2020; (C) view of Sangay volcano from the Southeast with focus on the southeast ravine (December 27, 2021); (D) Strombolian explosion in the central crater from Sangay volcano (December 27, 2021).
According to Vasconez et al. (2022), since 2003 Sangay has been semi-continuously active with mostly low-intensity ash emissions (<3.5 km above the crater) and short-runout lava flows (1–3 km long). Its most recent eruptive period began on May 7, 2019 and is still ongoing as of July 2022. This eruptive period is the first in more than 6 decades to produce significant impacts both locally and regionally. The 2019-ongoing eruptive period has been characterized by frequent Strombolian explosions (jet height of tens to few hundred meters above the crater, duration <1 min, Figures 1C, D) and continuous blocky lava flows. The lava flows and their collapses, forming pyroclastic density currents (PDCs), excavated a deep valley in the southeastern flank of the volcano (Figure 1C), directing the flows toward the Río Volcán. Rain-triggered lahars in the Río Volcán partially blocked the Upano-Volcán confluence, forced the evacuation of about 30 persons living on the riverbanks of the Río Upano and damaged the access road to the bridge of Macas city, the capital of Morona Santiago province.
Since 2019, frequent light ash fallouts (0.01–0.1 kg m−2) have affected principally Chimborazo province but also Morona Santiago, Bolívar, Cañar, Azuay, Los Ríos, Santa Elena, Tungurahua, Cotopaxi and Guayas provinces. At least six eruptive pulses produced moderate (0.1–1 kg m−2) to heavy (1–10 kg m−2) ash fallouts at regional scale that were widely reported by the population and forced the repeated closure of the José Joaquín de Olmedo International Airport in Guayaquil, the second largest city in Ecuador. The September 20, 2020 eruptive pulse was the second of those eruptive pulses and the first with a high eruptive column (>10 km above the crater). It tested the IG-EPN, authorities and public response. For the first time at Sangay volcano, the ash fallout was quantified through a 4-days field campaign initiated immediately after the eruption and characterized by an in-depth study of the ash samples that include grain-size distribution, componentry and geochemical analysis.
This article presents lessons from this event based on seismic records, satellite imagery, ash fallout reports, field and laboratory data, and public communications from IG-EPN. We present the first set of ESPs (duration, column height, total mass, mass eruption rate and total grain-size distribution) at Sangay volcano and discuss its eruptive dynamics. The results obtained in this study contribute to the analysis of ash transport in the atmosphere and to evaluate the performance of the Ash3D model (Schwaiger et al., 2012), which is used to simulate ash dispersion and sedimentation during the eruptive pulse. Finally, the IG-EPN forecasting and communication protocols are evaluated. This work is essential for future hazard assessment and crisis management of this and other remote explosive volcanoes worldwide.
The multiparametric monitoring station SAGA, operated by the IG-EPN, is located 6 km southwest of the summit (Figure 1B) and has the nearest seismo-acoustic sensor to Sangay summit. Unfortunately, due to frequent power and transmission outages likely due to repeated ash fallout, SAGA did not record the September 20, 2020 eruptive pulse. The study by Vasconez et al. (2022) found that a broadband seismic sensor with low anthropogenic noise levels located 67 km to the north-northeast (PUYO, Figure 1B) generally had fewer outages than SAGA and was a suitable alternative for identifying high-magnitude explosive activity from Sangay. Frequency-filtered RSAM (Real-time Seismic Amplitude Measurement) is computed in 1-min windows at the IG-EPN for PUYO seismic records in the 0.6–1.2 Hz band (raw seismic records and filtered RSAM data for September 20, 2020 are available in Supplementary Material S1). This band was chosen because it maximizes the signal-to-noise ratio of explosions emanating from Sangay, which was confirmed during time periods when both SAGA and PUYO were operating simultaneously. While the filter is quite narrow and susceptible to earthquake body wave noise, we confirmed both visually and by consulting local and global earthquake catalogs that on September 20, 2020 no teleseismic, regional, or local events contaminated our signal of interest. Finally, in order to characterize the significance of the RSAM amplitudes of this eruptive pulse relative to historical values, we performed a retrospective analysis of the PUYO record dating back to when the sensor was first installed in 2012 and employing the same methodology. This task was expedited because the sensor model (Trillium Compact 120) and digitizer model remained unchanged over the last 10 years, so no corrections for different sensitivities were required. Based on these data we reconstructed the typical amplitude distributions of 1-min RSAM data for similar minutes-of-day and computed the 90th amplitude percentile from those data for that time window to establish the seismic baseline that takes into account the ambient noise according to the time of the day (Supplementary Material S1).
Before the September 20, 2020 eruptive pulse, the IG-EPN protocol for identifying, tracking, forecasting and emitting warnings for volcanic clouds and ash fallout from Sangay was based on the following approaches. Under good visibility conditions, the eruptive columns were identified on the SAGA webcam or on webcams from the Ecuadorian Integrated Security Service (ECU911). The ground-based monitoring network also included Differential Optical Absorption Spectroscopy (DOAS) instruments at SAGA and San Nicolás stations to measure the amount of SO2 in the volcanic plume (Figure 1B). After the previous event at Sangay that produced regional ash fallouts on June 8–12, 2020, the IG-EPN trained a national network of volcano observers (Red de Observadores Volcánicos del Ecuador ROVE) to identify ash clouds and fallout. On September 20, 2020 the network included about 150 volunteers from the Ecuadorian Red Cross (CRE), the National Service of Risk and Emergency Management (SNGRE) and the general public trained via an open access virtual workshop (June 23–26, 2020). Volunteers are spread throughout Ecuador, some being able to report directly on the surface activity of Sangay from nearby cities such as Macas and Riobamba, others reporting the presence of volcanic ash from more distant areas (e.g. Guayaquil, Cuenca, Quito). Volunteers built and installed their own ashmeters to collect and measure the ash fallout following the procedure described in Bernard (2013). Since the Cotopaxi 2015 eruption, the IG-EPN also implemented an online form on its webpage to collect information about ash fallout from the general public (https://www.igepn.edu.ec/reporte-de-caida-de-ceniza). Ash fallout reports from the ROVE and the general public are compiled in Supplementary Material S2.
The tracking of ash clouds in the atmosphere was performed in near-real time using the Volcanic Cloud Monitoring webpage provided by the NOAA/CIMSS (https://volcano.ssec.wisc.edu/) that allows visualization of GOES-16 imagery with a 10-min interval and a 20–30-min lag-time. In this webpage, the results of the VOLCAT algorithm allow assessing the height of the eruptive column and characterize its ash content (probability, load and radius). W-VAAC provided information on the eruptive column height, direction, and velocity (https://www.ssd.noaa.gov/VAAC/messages.html), with a notification frequency of 6 h or sooner depending on the evolution of the eruptive activity.
In parallel, daily simulations at the erupting Ecuadorian volcanoes were performed from Monday to Friday using the online application of the Ash3D code developed by the U.S. Geological Survey (Mastin et al., 2013). Ash3D is a Eulerian, finite volume code that calculates the advection and diffusion of tephra under three-dimensional, time-varying wind conditions forecast using the NOAA Global Forecast System (GFS) 0.5-degree model (https://www.ncdc.noaa.gov/data-access/model-data/model-datasets/global-forcast-system-gfs). A simplified online tool (https://vsc-ash.wr.usgs.gov) makes it possible for registered users to run the model remotely by specifying the volcano name, eruption start time, plume height and duration. Other inputs such as grain-size distribution, are pre-set within the code (Mastin et al., 2013).
The IG-EPN communication protocols dictate that the SNGRE must be contacted first in case of an hazardous event, and to issue different types of reports depending on the type of activity and potential hazards (Bernard et al., 2022). The reports are then distributed through the IG-EPN webpage and social networks. The IG-EPN is also in charge of issuing a Volcano Observatory Notice for Aviation (VONA) when ash emissions and ash clouds are detected. The log for the September 20, 2020 eruptive pulse, including public communications and ash fallout reports, is presented in Table 1.
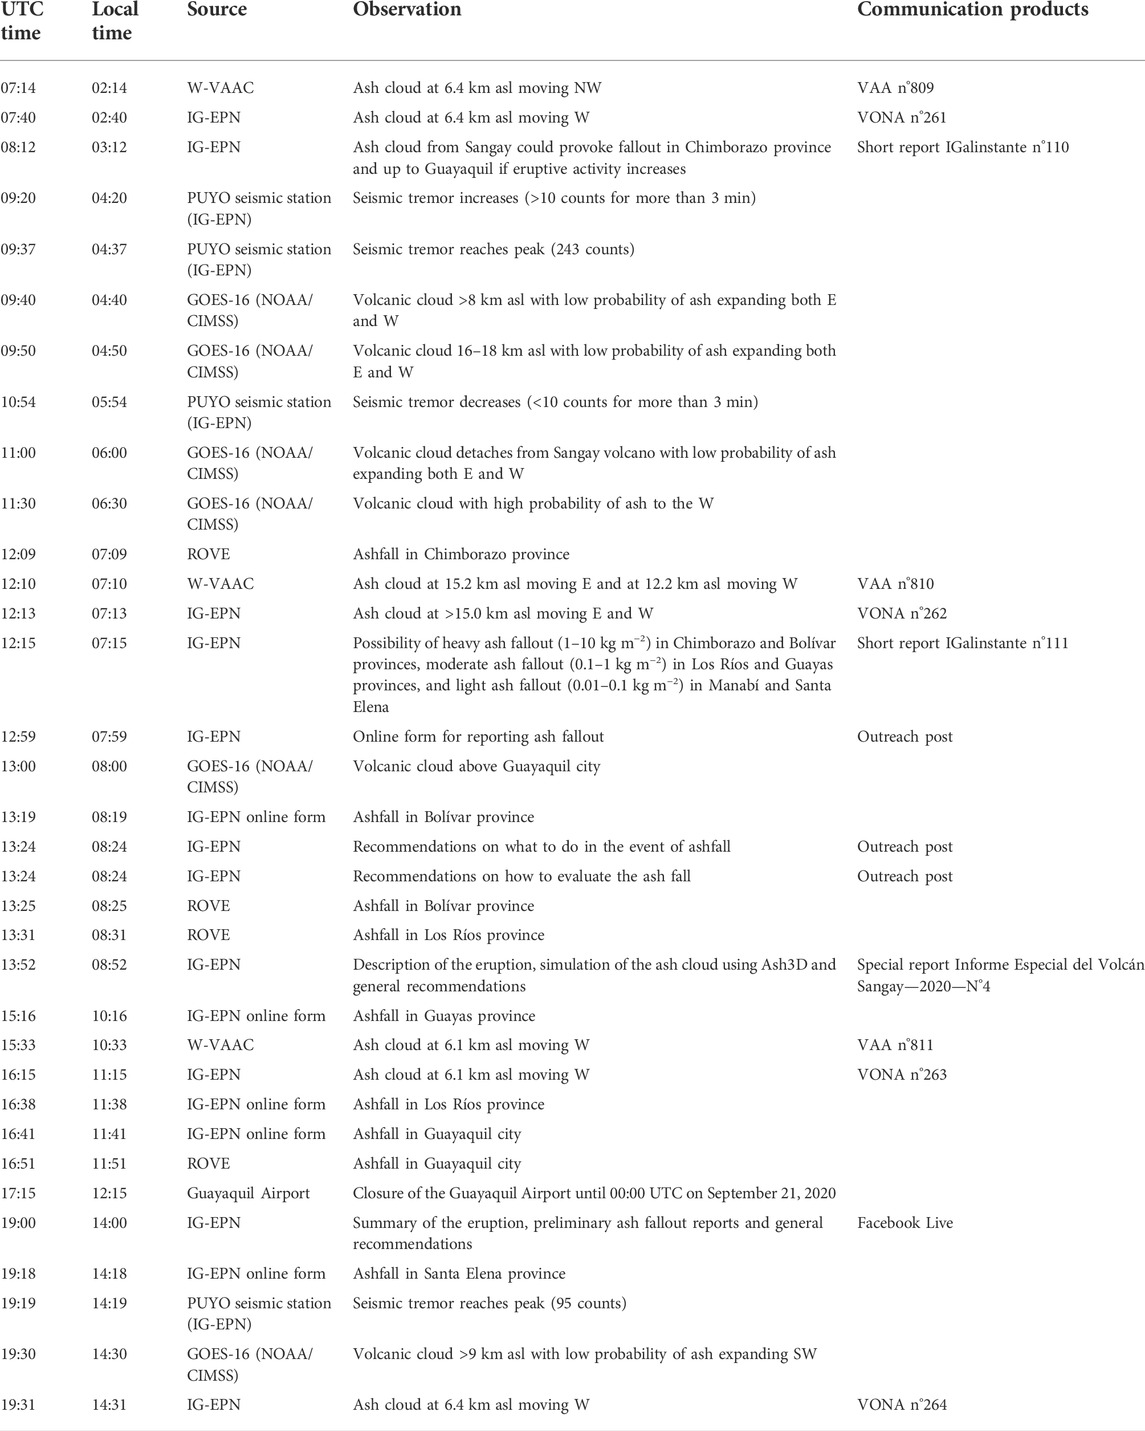
TABLE 1. September 20, 2020 eruptive pulse log. Only the first ash fallout reports are presented by provinces and by source (ROVE or IG-EPN online form).
A 4-day field campaign was initiated immediately after the September 20, 2020 eruptive pulse to collect data on the ash fallout (Figure 2, Supplementary Material S3). It was possible to measure and sample the ash in the median zone (between 30 and 100 km from the volcano) on essentially fresh and un-reworked deposits. Due to accessibility reasons, we were unable to sample from proximal sites (<30 km from the vent). Sampling sites consisted mostly of roofs, benches, cars, tombstones and washing stones and were chosen to be as flat as possible. Three sites had previously installed homemade ashmeters that were used to validate the traditional measuring and sampling technique. Where the deposit was thicker than 1 mm, thickness was measured with a caliper at least 4 times to ensure repeatability. An area of the deposit (typically 50 × 50 cm) was then sampled carefully and stored in a sealed plastic bag. The ash mass was measured in the field using a 10−1 g precision scale (Ohaus Traveler). Distal samples from Guayas and Los Ríos provinces (up to 180 km from the volcano) were provided by volcano observers that built and installed four additional homemade ashmeters outside their houses. Finally, a measurement and sample from Guayaquil city was provided by Prof. Maurizio Mulas (Escuela Superior Politécnica del Litoral). In total, we obtained data for 36 sites.
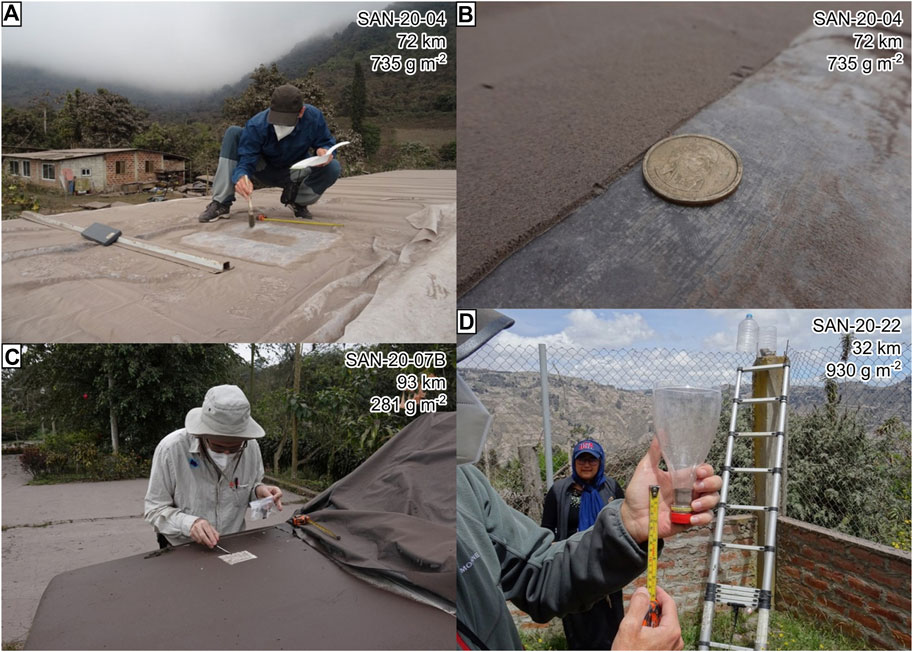
FIGURE 2. Ash sampling and field measurements of the September 20, 2020 ash fallout from Sangay volcano. (A) Sillagoto (SAN-20–04), September 20, 2020; (B) Sillagoto, dollar coin (2 mm-thick) for scale; (C) Cumandá (SAN-20-07B), September 21, 2020, wet deposit; (D) San Nicolás ashmeter (SAN-20–22), September 22, 2020. Color changes in D are due to moisture and thickness of the plastic of the inner container. Distance from the volcano in km and load in g m−2.
In the laboratory, the samples were weighed, then dried at 40 °C for 24 h, and weighed again on a 10−2 g precision scale (Ohaus Explorer Precision). Isomass polylines were created automatically in a Geographic Information System (QGIS 3.10) with the help of ordinary kriging (Surfer 8.0) and modified manually to take into account the position of the volcano. Reports of ash fallout from volcano observers and the general public (Supplementary Material S2) were used to limit the 0.0025 kg m−2 isomass contour. This threshold was chosen based on reports from eruptions with known fallout loads at different volcanoes in Ecuador (Tungurahua, Cotopaxi and Reventador). Total mass of the ash fallout was estimated using different empirical thinning laws (Pyle, 1989; Fierstein and Nathenson, 1992; Bonadonna and Houghton, 2005; Bonadonna and Costa, 2012). Conversion from total mass to bulk volume was done using minimum and maximum deposit density from 11 thickness measurements. Conversion from total mass to dense-rock equivalent (DRE) volume was calculated using a 2500 kg m−3 density for andesite (Crosweller et al., 2012). These results are used to estimate the eruption Volcanic Explosivity Index (VEI; Newhall and Self, 1982), magnitude and intensity (Pyle, 2000).
As none of the samples contained lapilli (2–64 mm), grain-size distribution was obtained using a Horiba LA-960 particle analyzer (range 30 nm–5 mm). Optical properties were set for andesitic ash (Vogel et al., 2017) and samples were shaken before separating a subsample and introducing it in the particle analyzer (Horwell, 2007). Many measurement settings were tested to obtain reproducibility and repeatability. The best results were obtained using a transmittance between 70 and 85%, except for the most distal samples, for which a transmittance of 90–95% was used. The material was dispersed using a circulation speed of 4–6 (no unit), an agitation speed of 2–4 (no unit) and 1 minute of ultrasound (power 2, no unit) before the measurement. The measurement acquisition time was set to 1 minute and repeated 3 to 6 times. Quality of the results was checked for reproducibility and repeatability to comply the ISO 13320:2020 (2020) norm. Average grain-size distributions for each sample are presented and analyzed in the φ scale (φ = -log2D, where D is the particle diameter) in ¼ φ intervals (Supplementary Material S4). To better describe their grain-size distributions, we choose to complement the traditional graphical statistics (Folk and Ward, 1957) with the deconvolution of the polymodal mixtures using the freeware DECOLOG 6.0 (https://www.lorenzo-borselli.eu/decolog/). As shown for many volcanic deposits, natural grain-size distributions are generally polymodal and non-Gaussian (Eychenne et al., 2015; Rodríguez-Sedano et al., 2022). DECOLOG uses a Montecarlo resampling to optimize the deconvolution process and allows for Log-normal and Weibull sub-populations. To distinguish if a grain-size distribution is a mixture of one or more sub-populations, we visually identify if there are one or more peaks on the histogram. DECOLOG automatically calculates the model efficiency coefficient (EF) and the coefficient of determination (R2). The closer the values of EF and R2 are to 1, the better the model fit to the data. Total Grain-Size Distribution (TGSD) was estimated through weighting, using only the load as a weighting factor, and Voronoi Tessellation, using both the load and the Voronoi Tessella area as weighting factors (Bonadonna and Houghton, 2005).
Major element analyses from agate-crushed powders of three ash samples were obtained at the Laboratoire Géosciences Océan, Université de Bretagne Occidentale (Brest, France), using an Inductively Coupled Plasma-Atomic Emission Spectrometer (ICP-AES) and following the analytical procedure described by Cotten et al. (1995) (Supplementary Material S5). Calibrations were performed using international standards (ACE, ME, WSE, JB2). Relative standard deviation (2 sigma) is ≤1% for SiO2 and ≤2% for the other major elements. Additionally, componentry analysis of one sample from September 20, 2020 and one from January 31, 2020 were carried out under the binocular microscope using the methodology from Eychenne et al. (2013). In order to have representative sample size, at least 300 grains were counted in three to four grain-size fractions (Supplementary Material S5). Finally, juvenile particles from the 1.5 φ fraction of the September 20, 2020 sample were analyzed using an electron microprobe. The particles were glued onto a plastic plug with epoxy resin. They were then carefully polished so flat surfaces of the grains were exposed to be analyzed. First, silicon carbide (SiC) grinding papers (1200 and 2400 grid) were used, and second, an automatic polishing machine, using 6 μm, 3 μm and ¼ μm diamond pastes. The major elements of the glass and minerals of the juvenile particles were determined at Laboratoire de Magmas et Volcans, Clermont-Ferrand, France, using a CAMECA SxFiveTactis microprobe. The operating conditions were 15 kV accelerating voltage, 15 nA beam current and 10 s counting time for minerals; and, 15 kV accelerating voltage, 8 nA beam current, 10–20 μm beam size and 10 s counting time for matrix glass measurements (Supplementary Material 5). Relative standard deviation is ≤1% for SiO2 for the analyzed elements.
The September 20, 2020 eruptive pulse occurred after 3 days of increased SO2 emission (September 17 = 1247.5 t; September 18 = 1629.5 t; September 19 = 1656.4 t) according to the MOUNTS platform (http://www.mounts-project.com/timeseries/352090). While these values are not outside the range of SO2 emission since the start of the eruptive period in 2019, it was the first time it exceeded 1000 t for 3 days in a row. Before the eruptive pulse, Sangay volcano was already erupting with frequent explosions (175 events on September 19, 2020) and a semi-continuous plume of ash 6.4 km asl visible on satellite images the night before (Table 1). Because of this activity, the IG-EPN issued a short report (IG-EPN, 2020a) at 08:12 UTC (UTC = local time +5 h, all times in the text are given in UTC, local times are provided in Table 1) on Sunday, September 20 to warn of the ongoing volcanic activity and the possibility of ash fallout in Chimborazo province. The short report also indicated that ash fallout could reach Guayaquil if the activity continued to increase. According to the seismic record (Figure 3, Supplementary Material S1), the eruption intensity increased gradually around 09:20, then rapidly at 09:30 and reached a peak at 09:37 (RSAM = 243) associated with the rapid growth of an unusually high eruptive column (Figure 4). Due to poor visibility, no images of the eruption were available from the ECU911 cameras. The VOLCAT algorithm automatically estimated the column height between 16 and 18 km asl. According to the W-VAAC, the eruptive column rapidly split into a high-altitude (15.2 km asl) gas-rich cloud, drifting east-southeast (N113°) and a low-altitude (12.2 km asl) ash-rich cloud, drifting westward (N257°) (Figure 4). Smaller peaks (RSAM >50) in the seismic records were detected at 09:52, 10:04, 10:14 and 10:25. Then, the eruption gradually waned around 11:00 when the volcanic cloud detached from the volcano, as observed in the satellite images (Figure 4).
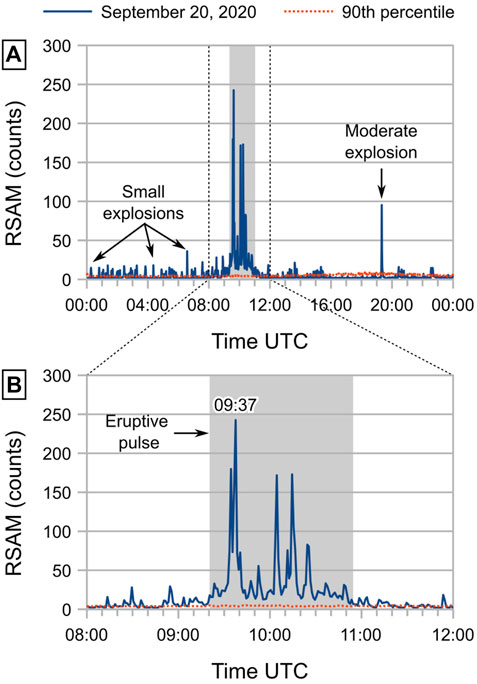
FIGURE 3. Real-time Seismic Amplitude Measurement (RSAM) calculated from PUYO seismic station on (A) September 20, 2020 and (B) from 08:00 to 12:00 UTC with a 0.6–1.2 Hz frequency filtering, in digital counts. Red dotted line corresponds to the 90th percentile of all values for that minute in the day since PUYO was installed in 2012 (see text for description); grey area corresponds to the duration of the eruptive pulse.
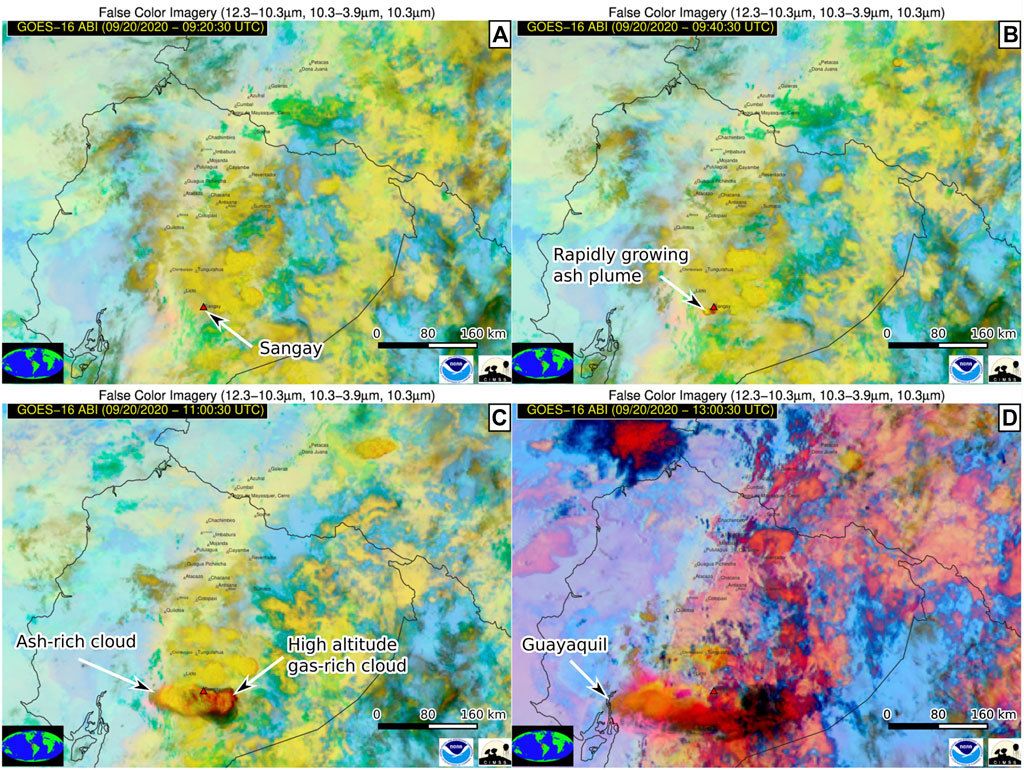
FIGURE 4. False color imagery (satellite GOES-16) of the September 20, 2020 eruptive pulse at Sangay volcano (source: NOAA/CIMSS). (A) Small ash emission at 09:20 UTC; (B) rapidly growing ash plume at 09:40 UTC; (C) separation of the high-altitude gas-rich cloud (to the east) and the ash-rich cloud (to the west) at 11:00 UTC; (D) ash cloud reach Guayaquil city at 13:00 UTC.
Ashfall in Chimborazo province was first reported by the volcano observers (ROVE) at 12:09 and by the general public at 12:48 (Table 1, Supplementary Material S2). The IG-EPN emitted a second short report at 12:15 (IG-EPN, 2020b) to warn about the possibility of heavy ash fallout in Chimborazo and Bolívar provinces, moderate ash fallout in Los Ríos and Guayas provinces and light ash fallout in Manabí and Santa Elena provinces. At 12:59 and 13:24 the IG-EPN published outreach posts on its social media accounts, giving general recommendations about volcanic ash and how to report ash fallout on its online form (https://www.igepn.edu.ec/reporte-de-caida-de-ceniza). At 13:52 the IG-EPN published a special report (IG-EPN, 2020c) that included a description of the eruptive pulse, a simulation using the VEI three scenario (syn-eruptive in Table 2) based on the maximum eruptive column height given by the W-VAAC, and general recommendations including links to the International Volcanic Health Hazard Network webpage for ash protection (https://www.ivhhn.org/). Reports from the city of Guayaquil indicate that the ash fallout started around 16:00, forcing the closure of Guayaquil International Airport from 17:15 to 00:00 (September 21). At 19:00, the IG-EPN transmitted live on Facebook to present a summary of the eruptive pulse including preliminary reports of the ash fallout and general recommendations. Throughout the day several VONAs were issued to inform civil aviation about the dispersion of the volcanic clouds including a moderate explosion at 19:19.
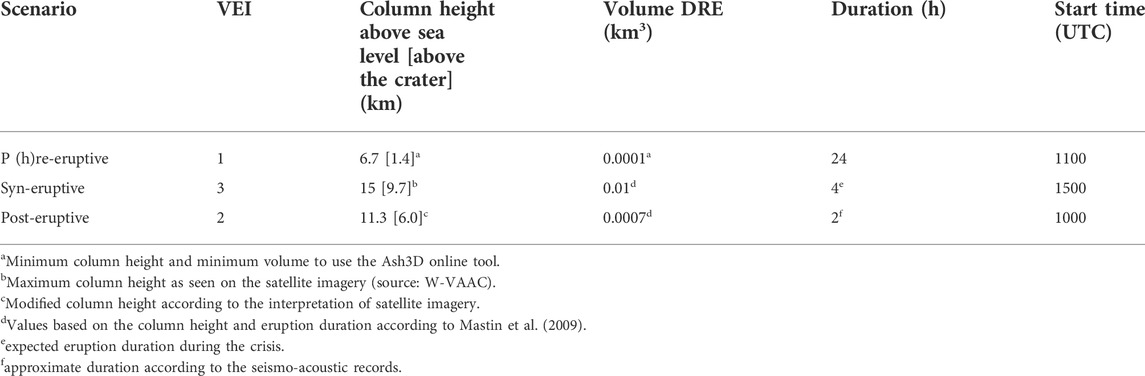
TABLE 2. Eruption source parameters for the simulations performed for the September 20, 2020 eruption of Sangay volcano.
On September 21 at 00:54, thermal anomalies were spotted by the VIIRS satellite instrument (https://firms.modaps.eosdis.nasa.gov/) in the Río Volcán, southeast of the volcano. These thermal anomalies are interpreted as hot pyroclastic deposits with a runout distance of 15.4 km from the vent and a vertical drop of about 3400 m (H/L = 0.22). They display the longest runout measured at Sangay volcano since satellite monitoring started. According to empirical relationships based on the H/L factor (Hayashi and Self, 1992; Ogburn and Calder, 2017), the volume of the September 20, 2020 pyroclastic density currents is estimated between 1.7 and 6.5 × 10⁶ m3.
The results of the field campaign (Supplementary Material S3) combined with the ashfall reports (Supplementary Material S2) allowed to draw the first isomass map for this eruptive pulse (Figure 5). The deposit did not exhibit any layering and looked fairly homogeneous, even in San Nicolás ashmeter (Figure 2). The isomass map was used to calculate the total mass of the ash fallout using different empirical laws (Table 3). The power law (Bonadonna and Houghton, 2005) does not accurately fit the dataset (coefficient of determination R2 = 0.829). The power-law coefficient is inferior to 2 (m = 1.944), probably due to the absence of sampling points close to the volcano (<30 km), which explains its sensitivity to the integration limits (Bonadonna and Houghton, 2005). In this case, the result from the power law can be used as a minimum value. The decreasing load trend best fits exponential or Weibull laws (R2 = 0.993–0.997). Accordingly, the obtained total mass ranges from 1.71 to 2.03 × 10⁹ kg (Table 3). In the field, it was possible to measure thickness at only 11 sites due to the limited thickness of the deposit (<2 mm), which is not sufficient to create an isopach map. Nonetheless, this information allows estimating the bulk density of the deposit. It is worth noting that the deposit density was highly variable (range = 411–1163 kg m−3). The lowest density values were measured less than 12 h after the eruptive pulse at about 70 km from the volcano while the highest values were measured about 60 h after the eruptive pulse at about 30 km to the volcano. We should stress that no rain occurred during the sampling campaign, but wind and dew could have affected the deposit packing. Assuming a minimum density of the fallout deposit of 411 kg m−3 and a maximum density of 1163 kg m−3, the bulk volume is therefore estimated between 1.47 and 4.95 × 10⁶ m3 (Table 3). Uncertainties are large, but on a log scale, we are reasonably confident that bulk volume is consistent with a small to medium-sized VEI two event. The dense-rock equivalent (DRE) volume obtained (6.9–8.1 × 10⁵ m3) is very close to the post-eruptive scenario (7 × 10⁵ m3, VEI 2, Table 2) simulated 5 hours after the eruptive pulse using an 11.3 km asl eruptive column lasting for 2 hours.
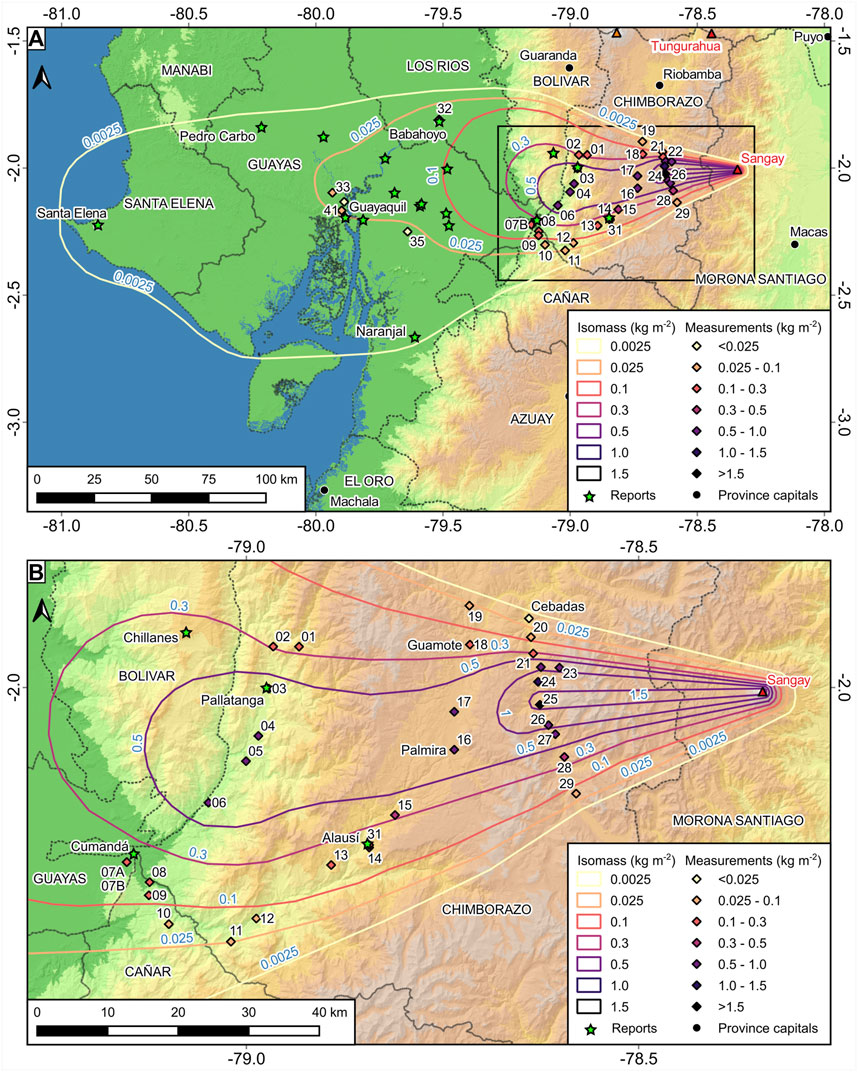
FIGURE 5. Fallout reports, measurement and sampling sites, and isomass map for the September 20, 2020 eruptive pulse of Sangay volcano. (A) general map; (B) zoom in the medial area. Sampling site names are shortened (no SAN-20-) for clarity.
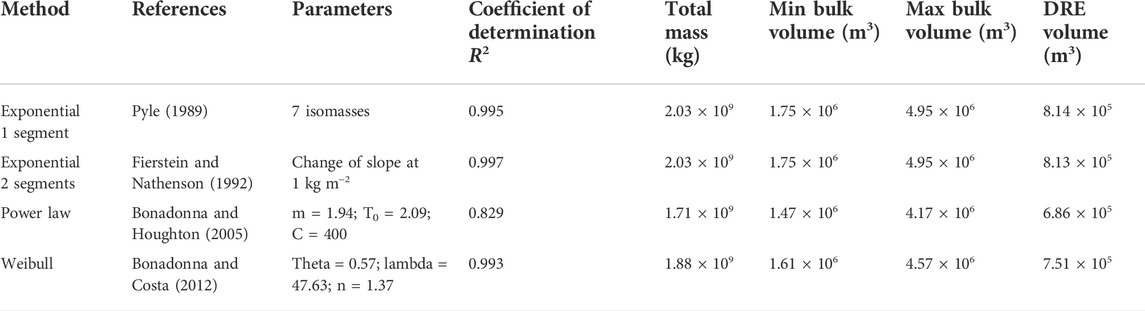
TABLE 3. Mass, bulk and DRE volumes of the ash fallout. Minimum (Min) and Maximum (Max) bulk volumes are calculated using maximum and minimum deposit density. Dense-rock equivalent (DRE) volume was calculated using a 2500 kg/m3 density for andesitic magmas (Crosweller et al., 2012).
Grain-size distribution was obtained for 35 of the 36 samples (the last one was too small) from the September 20, 2020 eruptive pulse (Supplementary Material S3, S4). As a first result, none of the samples had particles over 1 mm in diameter, probably due to the absence of proximal samples. All the samples are very fine to extremely fine grained (graphical mean range = 3.57–5.30 φ). According to Figure 6, there is a vague decrease in the mean in the medial area that is not observed in the distal area. On the contrary, there is a clear decrease in standard deviation from very poorly sorted (up to 2.32 φ) to moderately sorted (down to 0.92 φ) with increasing distance from the volcano. Most of the distributions are symmetrical (skewness between −0.1 and 0.1) with some skewed toward the fine (positively skewed between 0.1 and 0.3). Very positively skewed (between 0.3 and 0.5) distributions are mostly located in the medial area between Palmira and Cebadas (Figure 5). The distributions appear more positively skewed with increasing distance from the volcano. The shape of the distributions also changes from platykurtic (flat-topped) in the medial area to mesokurtic (normal distribution) and leptokurtic (narrow peak and fat tails) in the distal area. One sample (SAN-20–29) stands out from these trends. This sample is the finest (mean = 5.30 φ) with the highest negative skewness (-0.45) and the highest kurtosis (1.36). The geographical position of this sample, at the southern margin of the deposit, and/or reworking processes (wind and dew) between the fallout and sampling on September 22 could explain its particular grain-size distribution.
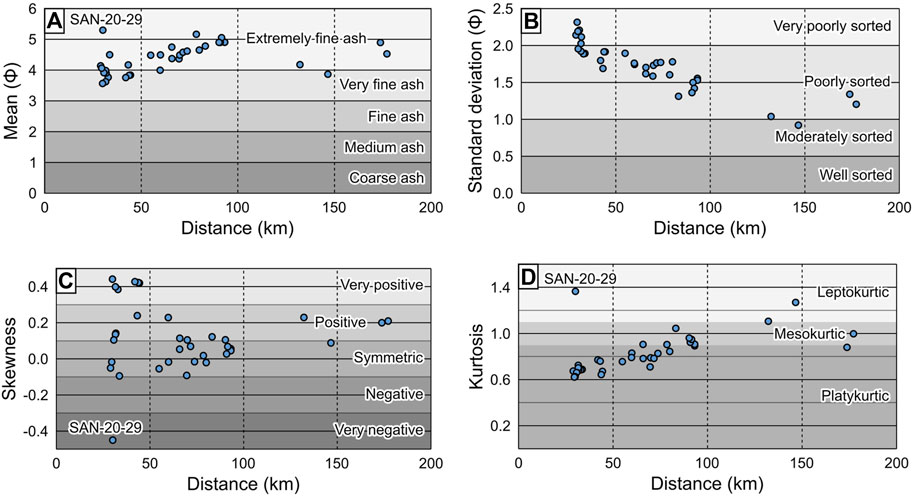
FIGURE 6. Graphical statistics (Folk and Ward, 1957) of grain size distributions of samples from the September 20, 2020 eruptive pulse relative to their distance from Sangay volcano. (A) Mean (φ); (B) Standard deviation (φ); (C) Skewness; (D) Kurtosis.
Grain-size distributions appear bimodal in the medial area and unimodal in the distal area (Figure 7). The deconvolution of the bimodal distributions using DECOLOG shows that the Weibull sub-populations (average EF = 0.991; average R2 = 0.995) generally fit better the data than the Log-normal sub-population (average EF = 0.981; average R2 = 0.991) (Supplementary Material S3, S4). The transition between bi- and unimodal distribution occurs at a distance of about 90 km from the volcano where the decreasing coarse mode (from 1.44 to 4.34 φ) merges with the more stable fine mode (range 4.34–6.39 φ) (Figure 7C).
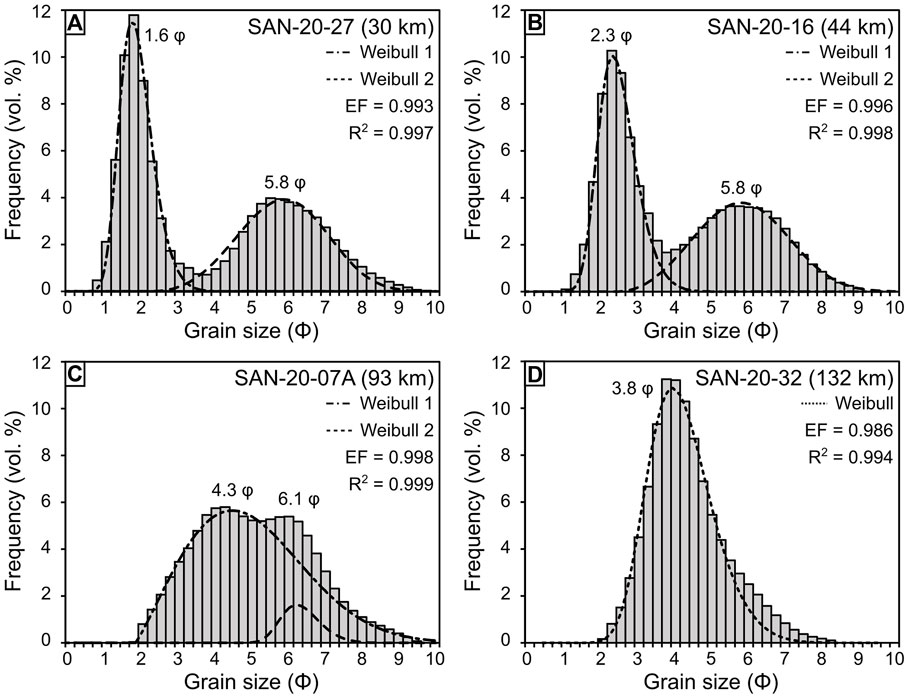
FIGURE 7. Example of grain-size distribution from the Sangay fallout with Weibull sub-populations. (A) and (B) are unimodal; (C) is bimodal in transition to unimodal; (D) is unimodal. Samples are order by distance from the volcano. EF: model efficiency coefficient; R2: coefficient of determination.
The total grain-size distributions calculated using the weighting (TGSD-W) and Voronoi Tessellation (TGSD-VT) techniques are relatively similar in terms of graphical statistics (mean = 4.17–4.39 φ, standard deviation = 2.00–1.75 φ, skewness = 0.04–0.02 φ, Kurtosis = 0.72–0.85 φ for TGSD-W and TGSD-VT respectively) but are quite different in terms of histogram shape. The TGSD-VT is almost unimodal while the TGSD-W is clearly bimodal (Figure 8). The Voronoi Tessellation technique tends to give more weight to the distal samples which represent a much larger fraction of the deposit area while the weighting technique gives more weight to the samples with the highest load that are geographically close together in the Sangay case. Therefore, the Voronoi Tessellation technique seems more appropriate when the geographical distribution of the sampling points is heterogeneous. It is important to note that the absence of proximal sampling probably affected the calculated TGSDs and we suspect that the real TGSD is coarser.
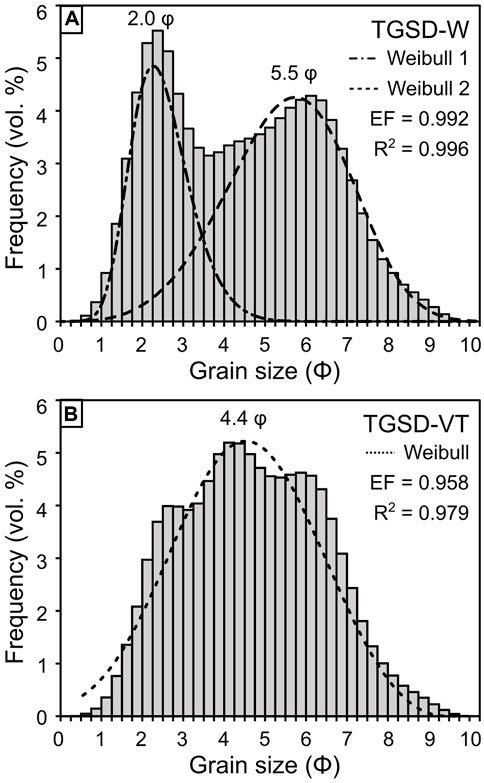
FIGURE 8. Total Grain-Size Distributions using (A) weighting (TGSD-W) and (B) Voronoi Tessellation (TGSD-VT) with Weibull sub-populations. Load is the weighting factor in the calculation of the TGSD-W. Load and Voronoi tessellas area are the weighting factor in the calculation of TGSD-VT.
Additionally, about 71% (range 48–90%) of the ash emitted during the September 20, 2020 is classified as inhalable (<100 μm), 10.4% (range 1.8–24.9%) can enter the thorax (<10 μm) and 1.88% (range 0.02–4.29%) is breathable and can enter the alveoli (<4 μm) (Supplementary Material S3).
We analyzed the whole-rock composition of three ash samples located 31.6 km (SAN-20–25), 44.4 km (SAN-20–16) and 71.6 km (SAN-20–04) from Sangay volcano along the main dispersion axis (Supplementary Material S5). Although the analyses were done on bulk samples from different locations, the results are similar for major elements oxides, in particular for SiO2 (57.65–57.76 wt%) and K2O (2.24–2.29 wt%) while MgO is slightly more variable (2.88–3.48 wt%). No correlation or pattern is observed with the distance from the vent. We note that the composition of the September 20, 2020 ash samples fall within the compositional field of the Sangay III edifice (Monzier et al., 1999) but is more mafic than the composition analyzed from the recent decades (Monzier et al., 1999; Vasconez et al., 2022) (Figure 9).
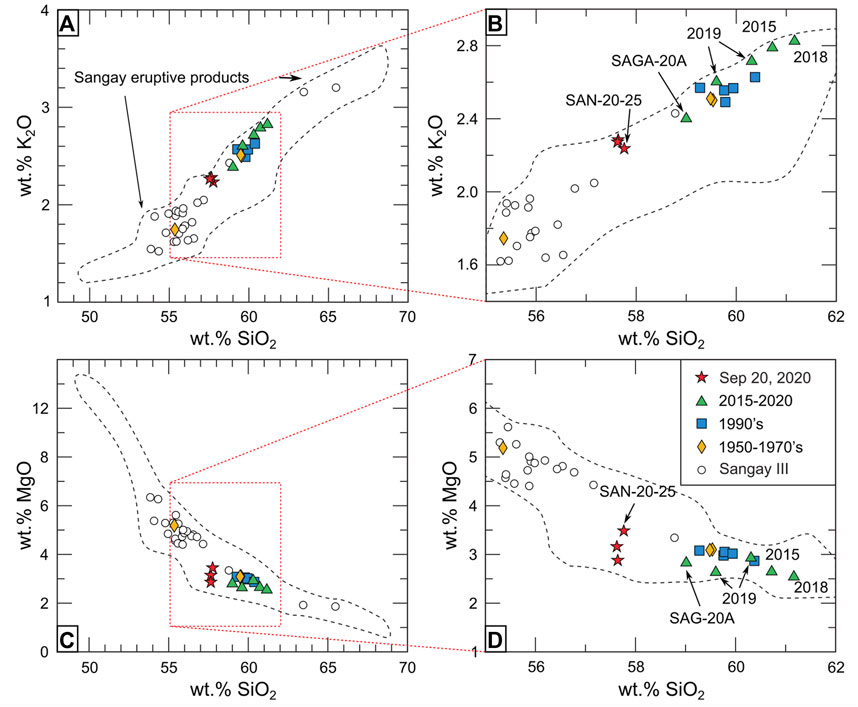
FIGURE 9. Major element composition of September 20, 2020 ash samples compared to previous data from Monzier et al. (1999) and Vasconez et al. (2022). (A) K2O vs SiO2 diagram; (B) Zoom on (A) showing the recent products compositions; (C) MgO vs SiO2 diagram; (D) zoom on (C) showing the recent products compositions. Analytical error is smaller than the size of the symbols.
We chose the samples SAN-20–25 and SAGA-20A to perform an exploratory componentry analysis (Supplementary Material S5). SAN-20–25 is one of the closest samples to the volcano from the September 20, 2020 eruptive pulse (31.6 km). It is located along the main dispersion axis and does not present any evidence of reworking. SAGA-20A was collected on January 31, 2020 at SAGA station and corresponds to the accumulation of ash on a clean surface (solar panel) from January 29 to January 31. This sample represents the ash deposit of a typical eruptive activity of Sangay volcano, the height of the eruptive column during this period being between 5.8 and 6.4 km asl (i.e. 500–1100 m above the crater). SAGA-20A was analyzed for major elements in a previous study and was approximately 1.3 wt% higher in SiO2 (Vasconez et al., 2022). Based on optical characteristics and morphology observed with the binocular microscope, four main classes of components were identified in the ash samples (Figure 10A): 1) Dark colored juvenile fragments are black to brown, glassy, translucent to opaque, massive to vesicular, various shapes (blocky, sub-rounded, irregular); 2) Light-colored juvenile fragments are light gray, glassy, translucent, massive, blocky to sub-rounded; 3) Accidental material is variously colored (mostly red, dark gray, white), dull, opaque, variously shaped (blocky, sub-rounded, irregular); 4) Free crystals are white (plagioclase) and green (pyroxene), shiny, translucent and blocky. One clear difference between the two samples is the shape of the dark-colored juvenile fragments. The dark colored juvenile fragments of SAN-20–25 have blockier shapes, while those of SAGA-20A have more elongated fluid shapes (Figure 10A). The components have different proportions and trends in the two samples according to the size fraction. In the sample SAGA-20A (Figure 10B), the dark-colored juvenile class clearly dominates in the coarsest fraction (2 φ, coarser fraction could not be counted because of a low number of grains) but decreases as the size decreases (from 78 to 62%). On the contrary, the accidental material and light-colored juvenile classes increase as the size decreases (from 16 to 21% and from 6 to 14%, respectively). In the sample SAN-20–25 (Figure 10C), the dark-colored juvenile class also dominates but is apparently lower than in SAGA-20A. Nonetheless, its percentage shows a different trend and increase from 33% for the 1.5 φ fraction to 54% for the three φ fraction. The second most abundant class is the accidental material that reaches 39% of the grains which is twice the amount in SAGA-20A. The amount of accidental material decreases as the fraction size decreases from 49 to 31%. Light-colored juveniles are much less abundant (14% with decrease from 18 to 11% as the fraction size decreases). Free crystals are scarce in both samples and appears mostly in the smallest size fraction (up to 3%).
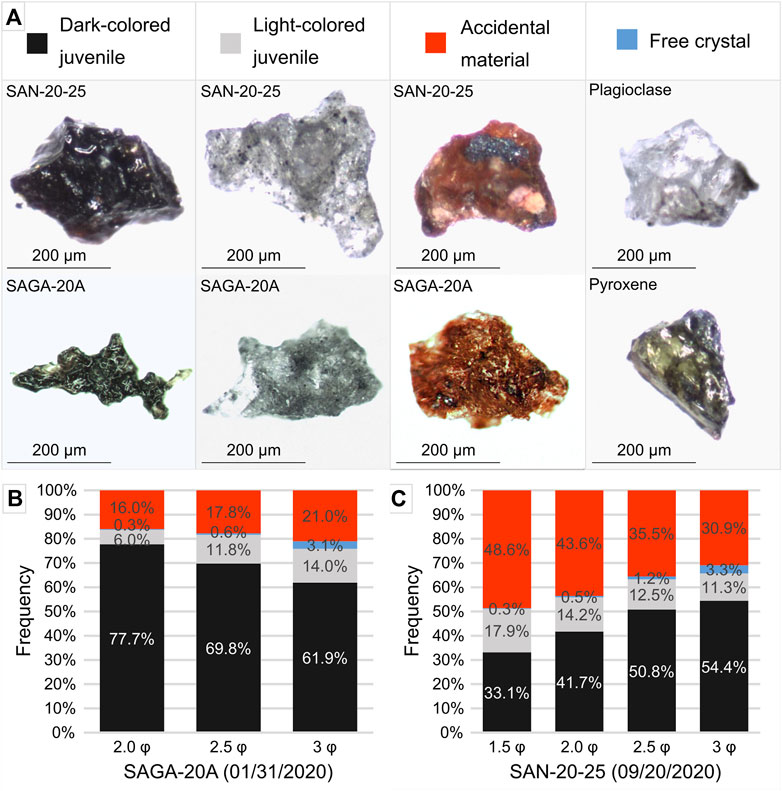
FIGURE 10. Optical classification and componentry analysis of the Sangay ash samples. (A) Dark colored juvenile fragments are black to brown, glassy, translucent to opaque, massive to vesicular, various shapes (blocky, sub-rounded, irregular); Light-colored juvenile fragments are light gray, glassy, translucent, massive, blocky to sub-rounded; Accidental material is variously colored (mostly red, dark gray, white), dull, opaque, variously shaped (blocky, sub-rounded, irregular); Free crystals are white (plagioclase) and green (pyroxene), shiny, translucent and blocky. (B) The 2.0 φ, 2.5 φ and 3.0 φ fractions represent respectively 2.6%, 6.6% and 11.5% of the SAGA-20A sample according to the grain size analysis. (C) The 1.5 φ, 2.0 φ, 2.5 φ and 3.0 φ fractions represent respectively 6.5%, 11.5%, 11.4% and 8% of the SAN-20–25 sample according to the grain size analysis.
The juvenile grains of sample SAN-20–25 were characterized using backscattered electron images (Figure 11). Light-colored juvenile fragments are non-vesicular to incipiently vesicular with irregular shaped vesicles. They also exhibit a high crystallinity with a mineral assemblage of plagioclase, orthopyroxene, clinopyroxene, olivine and titanomagnetite. Glass chemistry (Figure 11, Supplementary Material S5) reveals that the light-colored juvenile fragments have a high silica content (SiO2 = 69–75 wt%) and were identified as silicic glass, although their crystalline texture differs greatly from obsidian (McPhie et al., 1993). Dark-colored juvenile fragments have the same mineral assemblage as the light-colored ones but display much more varied textures that were classified as sideromelane, tachylite and intermediate according to Go et al. (2017). Sideromelane grains have the highest surface proportion of glass and the least Fe-Ti oxide microlites. They are incipiently to moderately vesicular with sub-rounded vesicles. Sideromelane glasses has the lowest silica content (SiO2 = 61–64 wt%). Tachylite grains have the least surface proportion of glass and the most Fe-Ti oxide microlites. They are non to incipient vesicular with irregular to sub-rounded vesicles. Tachylite glasses have a silica content intermediate between sideromelane and silicic glass (SiO2 = 64–69 wt%). Intermediate particles have intermediate characteristics between sideromelane and tachylite concerning the texture (crystallinity and vesicularity) and overlapping glass composition (SiO2 = 61–69 wt%). All the juvenile glasses fall in the same differentiation trend (Figure 11), probably indicating a single differentiation process. The decrease of Na2O and Al2O3 contents with increasing silica supports the fractional crystallization of plagioclase as responsible for this evolution trend.
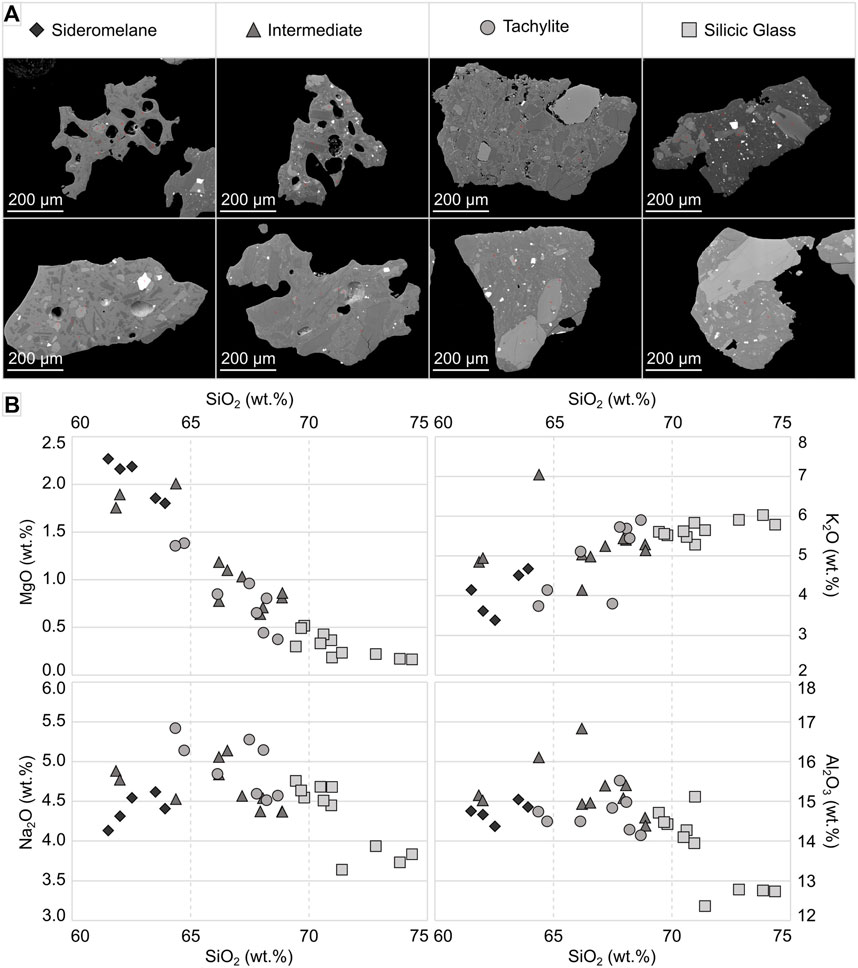
FIGURE 11. (A) Backscattered electron classification and (B) glass chemistry of the juvenile material in sample SAN-20–25. The light-colored juvenile fragments in Figure 10 are classified as silicic glass. The dark colored juvenile fragments in Figure 10 are subdivided into sideromelane with high glass/crystal surface ratio and low Fe-Ti oxide microlite content, tachylite with low glass/crystal surface ratio and high Fe-Ti oxide microlite content, and intermediate with transitional characteristics.
Two main phenomena occurred on September 20, 2020 at Sangay volcano: 1) a high-altitude eruptive column; 2) long-runout PDCs. Unfortunately, due to poor weather conditions, it was not possible to directly observe the temporal relationship between the two. According to the seismic record and satellite imagery, the eruptive column lasted between 90 and 100 min, reached a maximum altitude of 15.2 km asl, and emitted at least 1.71 to 2.03 × 10⁹ kg of ash into the atmosphere, which translates into a mass eruption rate of 2.85–3.75 × 10⁵ kg s−1. The PDCs could not be identified on the seismic record due to the distance between the volcano and the seismic sensor (67 km) and were detected by satellite more than 15 h after the eruptive pulse. Although we did not have access to the deposits, they were channeled into a single drainage of the volcano (southeast), which is consistent with block-and-ash flows (Brown and Andrews, 2015). Since 2019, this drainage has been the site of repeated lava flows and their collapse (Vasconez et al., 2022). During the June 8–12, 2020 period, PDCs formed without explosive triggers or high-altitude eruptive column and reached a distance of 13.5 km from the summit (IG-EPN, 2020d). In contrast, the March 2021 eruptive pulses produced two high-altitude (∼15 km asl) eruptive columns without long-runout PDCs (IG-EPN, 2021). Therefore, we postulate that the September 20, 2020 PDCs also correspond to collapses of lava flows and other perched deposits emplaced in the southeast drainage, as occurred just after the June 3, 2018 Fuego eruption (Risica et al., 2022). Accordingly, based on the eruptive column height and the fallout volume, the September 20, 2020 eruptive pulse can be classified as a VEI two event with a magnitude of 2.2–2.3 and an intensity of 8.5–8.6. If we compare this eruptive pulse and its impact at country scale with historical press reports, we have to go back to 1959 to find events of similar or greater size at Sangay volcano (El Comercio, 1959a and El Comercio, 1959b).
In terms of eruption dynamics, the September 20, 2020 eruptive pulse stands out from the daily activity of Sangay volcano characterized by Strombolian explosions and lava flows (Vasconez et al., 2022). It is also the first eruption to produce a high eruptive column since modern monitoring of Sangay volcano, which began in the early 2000s. According to W-VAAC records, previous volcanic clouds were all within 3.2 km above the summit. The mass eruption rate obtained for this eruption largely exceeds the typical values for Strombolian explosions and is one order of magnitude lower than that of Subplinian eruptions (Cioni et al., 2015; Taddeucci et al., 2015). Based on the plume height, duration and tephra mass, it can be classified as a violent Strombolian event (Pioli et al., 2008; Barsotti et al., 2015; Taddeucci et al., 2015).
The geochemical composition of the ash samples follows the decreasing trend in silica observed since 2015 by Vasconez et al. (2022). Indeed, the silica content lost more than 1.3 wt% compared to the January 31, 2020 sample. Vasconez et al. (2022) propose that the 2019-ongoing eruptive period and associated phenomena (increased SO2 and lava emissions, decrease in Silica content) could have been triggered by the refill of the shallow reservoir by a more mafic and volatile-rich magma. According to this hypothesis, the September 20, 2020 eruptive pulse, which was preceded by an increase of SO2 emission, could be interpreted as a batch of this magma reaching the surface and exploding in a more violent way. The large amount of accidental material, the wide range of glass composition (SiO2 = 61–75 wt%) and texture of the juvenile components (sideromelane, tachylite and silicic glass), all belonging to the same differentiation trend, indicate that the eruptive pulse probably excavated a large portion of the crystalizing magmatic column along with an important part of the upper conduit. Further volcano-physical and petrologic analysis are needed to better constrain the eruptive mechanism, which is beyond the scope of this study.
At the time of the event, the daily simulations were configured with a VEI one scenario (pre-eruptive in Table 2 and Supplementary Material S6) to represent the low-intensity, semi-continuous activity characteristic of most of the ongoing eruption since 2019 (Vasconez et al., 2022). As the eruptive column reached 10 km above the crater, a different simulation was performed during the crisis using a VEI three scenario (syn-eruptive in Table 2). This simulation was used to inform the authorities and public about the area potentially affected by the ash fallout. Finally, a simulation was performed 5 h after the end of the eruption using a VEI two scenario after further analysis of seismic records and satellite imagery suggested a lower plume and shorter duration. This simulation was used by the field team to guide their field campaign. All other parameters were set as default in the online application (Mastin et al., 2013). The global westward azimuth of the deposit is respected between the simulations (Figure 12) and the isomass map (Figure 5) but we noted that the syn- and post-eruptive simulations are shifted northward (N282°) while the pre-eruptive scenario is shifted to the south (N255°). The isomass map shows a dispersal axis almost westward (N265°). This small discrepancy is possibly due to the accuracy of the wind fields used in the different simulations, the real column height and the vertical mass distribution within the eruption column.
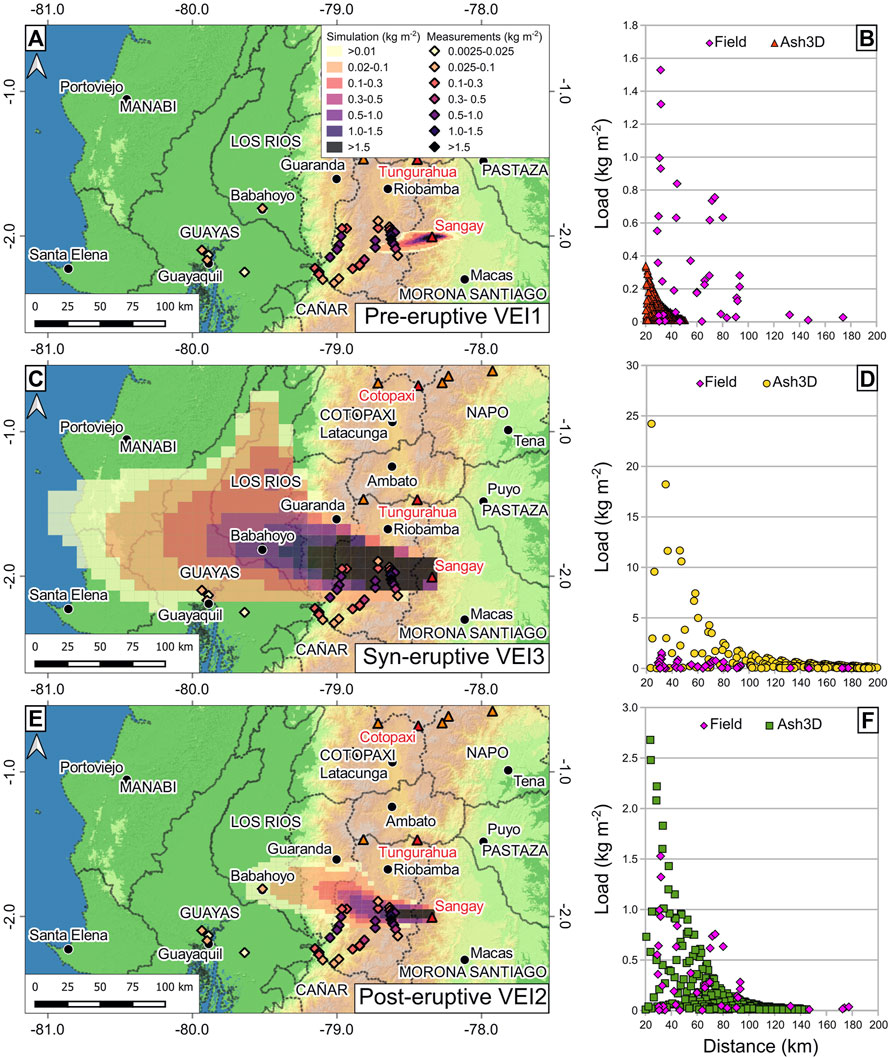
FIGURE 12. Comparison between the results of the Ash3D simulations and the field data. (A) map and (B) bivariate diagram (distance from the volcano in km versus load in kg m−2) comparing the results of the pre-eruptive (VEI 1) scenario simulation to the field results; (C) map and (D) bivariate diagram for the syn-eruptive (VEI 3) scenario; (E) map and (F) bivariate diagram for the post-eruptive (VEI 2) scenario.
In order to quantitatively compare the simulations and the field data without taking into account azimuth differences, we plotted all the values as a function of the distance from the volcano (Figure 12B, D, F). Using this approach, if the simulation accurately reproduces the decaying pattern of deposition, we expect the field data to overlap the simulation data. As expected, the pre-eruptive and syn-eruptive scenarios lead to under- and over-estimation of the ash fallout, respectively. Although the post-eruptive scenario (VEI 2) is more consistent with the results obtained in the field, it is clear that the decaying trend of load with distance is different. In particular, samples located 70–100 km from the volcano have a load up to thrice as high as expected in the simulation while the opposite is observed in the more proximal area. This overloading of the deposit in the medial area can be related to a secondary deposition maximum, similar to what was observed in Mount St. Helens (Brazier et al., 1983) and Crater Peak (Durant and Rose, 2009), possibly due to aggregation processes in the eruptive column and/or in the ash cloud. At Mount St. Helens, secondary thickening was produced when fine ash aggregated and fell en masse (Carey and Sigurdsson, 1986; Durant et al., 2009) as dry aggregates that disaggregated upon impact (Sorem, 1982). At Sangay, the abundance of fine ash and the bimodal grain-size distribution in the media area suggest that thickening resulted from similar processes, although gravitational instabilities (Bonadonna et al., 2015), or deposition of ash elutriated from PDCs travelling at lower altitude (Eychenne et al., 2012) are also possible mechanisms. The bimodal distribution could be the result of the mixing of the waxing and waning parts of the eruptive pulse, although no layering was noticed in the millimeter-thick deposit, even in the San Nicolás ashmeter sample. The overloading in this region could also be due to the complexity of the atmosphere and wind field in the Ecuadorian Andes, which may not be well simulated by the global forecast system. In the future, regional-scale weather forecasts could be used to better simulate the wind field over Sangay volcano, but for now these models have the disadvantage of consuming a lot of computer resources (Parra et al., 2016). Overall, agreement within about a factor of three between measured and modeled mass loads are about as good as has been achieved anywhere, including at well-studied eruptions (Folch et al., 2010, Figure 8; Mastin et al., 2016, Figure 11; Tadini et al., 2020).
The three simulations showed a great variation in the areal extent of the tephra fall, which reflected uncertainty in erupted volume. Estimating erupted volume during an eruption is one of the grand challenges, which has limited model forecast accuracy (e.g. Mastin et al., 2009). Nonetheless, the DRE volume from the post-eruptive scenario, simulated before having the results of the field campaign and based on a deeper analysis of the satellite imagery and a more precise duration of the eruptive pulse, fall within the DRE volume range obtained using the field data. Another key uncertainty in forecasting areal extent of tephra is the aggregation properties of fine ash. Reconstruction of the real TGSD and inclusion of the effects of aggregation could greatly improve the results of the simulations (Reckziegel et al., 2016). In a fine-grained deposit such as this one, deposit distribution depends almost entirely on how rapidly ash aggregates and falls. The aggregate properties used in this version of Ash3D are those that were empirically found to reproduce other well-mapped deposits; in particular, the May 18, 1980 Mount St. Helens deposit (Mastin et al., 2016). The deposits from Sangay and from Mount St. Helens are both very rich (>60%) in extremely fine ash (<63 µm), and therefore we expect their distributions to be controlled by aggregation. However, properties of aggregation vary with atmospheric conditions and the physics is not yet sufficiently understood to be accurately included in the model.
From the observatory’s perspective, according to its role and responsibility, the success of eruption management depends on the observatory’s effectiveness in communicating what the volcano is doing and how it may affect the local population. Along with the June 8–12, 2020 eruption period, the September 20, 2020 eruptive pulse is one of the first eruptions of Sangay volcano to cause regional-scale ash fallout since IG-EPN began monitoring volcanic activity in Ecuador. As presented in Table 1, a short report (IG-EPN, 2020a) was issued about 1 hour and a half before the peak of the eruption, informing of the possibility of ash fallout in the Chimborazo province. This report reached 115,592 and 56,967 people on Facebook and Twitter respectively (Supplementary Material S7). VONA were also issued before and after the event to warn the Ecuadorian Civil Aviation of the volcanic cloud. As soon as the first ash falls were reported by the volcano observers, a second short report (IG-EPN, 2020b) was issued, increasing the size of the potentially affected area (105,018 and 91,775 people reached on Facebook and Twitter respectively). Finally, the special report (IG-EPN, 2020c) issued at 13:52 satisfactorily forecasted the provinces affected by the fallout, although the actual fallout intensity was less than the simulation (109,583 and 59,593 people reached on Facebook and Twitter respectively). Along with the reports on the eruption, the IG-EPN also issued three outreach messages to give general recommendations on personal safety and to encourage the public to report ash fallout. On average, these posts reached 103,379 and 76,920 people on Facebook and Twitter respectively. In parallel, the IG-EPN website was visited by 58,810 people (530,560 pages) on September 20, 2020 with a peak at 17:00 UTC when the ash fallout reached Guayaquil.
Although the timing and reach of the publications issued by the IG-EPN during this event can be considered a success, we must admit that, according to interviews with locals in the Chimborazo province during the field campaign, this information did not reach some of the rural communities affected by the heaviest ash fallout. This is likely due to a combination of low preparedness in these communities, limited access to online information, and poor relay from local medias such as radio stations. Comparing this situation to the experience at Tungurahua volcano (Mothes et al., 2015), it is clear that part of the population of the Chimborazo province, especially in the Cebadas parish (Guamote canton), was not prepared for such an event as the September 20, 2020 eruptive pulse. In some cases, there is also a language barrier, with some communities speaking more Kichwa than Spanish. Prior to the event, the Ecuadorian Red Cross launched a training program in the Guamote canton, Chimborazo province, with the support of the IG-EPN within the framework of the project “Forecast-based Financing”. It included the training of local volunteers and also the preparation of several communities (Laime Capulispongo, Laime San Carlos, Totorillas, San Carlos de Chuquira) that were affected by the September 2020 ash fallout. Unfortunately, the communities affected by the most severe fallout, located in the parish of Cebadas, were not included in this training. To address this, the United Nations Development Program (UNDP) in Ecuador, in collaboration with the IG-EPN, launched a project in 2021 to prepare 10 additional communities in the Guamote canton, including the Cebadas parish. This project also plans to produce audio materials in Spanish and Kichwa to be more inclusive.
As a consequence of the first estimate of the eruptive pulse explosivity index (VEI 3) reported in the special report (IG-EPN, 2020c), the Ecuadorian Red Cross triggered the activation of the “Forecast-based Financing” early action protocol which allowed the distribution of different kits (human health kit: facemasks for adults and children, goggles for adults and swimming goggles for children, saline solution; livelihoods kit: tarpaulin and tool kit to build an animal shelter) and the transfer of money to 1,000 families in the affected area in the days following the event. According to the SNGRE (SITREP 23), no crop and livestock loss were reported, but about 105,489 ha, 55,913 farming animals, and 345 people (unspecified health issues) were affected. Humanitarian assistance from the SNGRE included 26,250 volcano kits (5 facemasks, one goggle and one scarf), 186,025 facemasks, and 168 food kits. Assistance from the Ministry of Agriculture, Livestock, Aquaculture and Fisheries (MAGAP) included 1,160 tons of livestock feed. Finally, the European Union allocated 100,000 euros in October 2020 to support the population affected by the eruption in the provinces of Chimborazo and Bolívar, through the Ecuadorian Red Cross program.
Since the September 20, 2020 Sangay eruptive pulse, the IG-EPN monitoring team implemented several new procedures to its toolbox: 1) definition of automatic alert based on seismic recordings from SAGA and/or regional stations with adequate filtering; 2) training of the monitoring team in the interpretation of satellite images and in running simulations using the Ash3D online tool; 3) continuous communication with the W-VAAC through the NWSchat; 4) checklists based on the proposal of Newhall et al. (2021) in case of a volcanic event, including the role and responsibility of the members of the IG-EPN and procedure manuals; 5) an improved communication plan, including templates and order for each communication products (Bernard et al., 2022). This improved protocol can be used as an example for monitoring remote explosive volcanoes around the world.
With experience from other volcanic events in Ecuador, the IG-EPN monitoring team was able to manage the September 20, 2020 Sangay eruptive pulse quite effectively. Nonetheless, this event challenged the forecasting and communicating protocol in several ways. Due to transmission failure, the reference seismic station (SAGA) was not available that day for early warning and the monitoring team had to use the distal array to detect and characterize the event. It was also the first moderate explosive event that produced a high eruptive column in several decades at this almost continuously erupting volcano. Through continuous communication with W-VAAC, the height of the volcanic clouds was determined to perform a dispersion and fallout simulation using the Ash3D online tool. The communication material, including relevant information, was published on time and was disseminated to a large portion of the population and the authorities, although it did not reach all the communities affected by the ash fallout. The simulation of the ash dispersion and fallout realized during the event helped guide the public and decision makers about the area potentially affected and trigger early actions. Some discrepancies were observed between the simulation and the real fallout, which may be related to the inaccuracy of the global weather forecast model, the use of generic eruption source parameters and the complexity of the eruption itself. Nevertheless, these forecasts have proven to be useful. The analysis of the ash samples collected immediately after the event provides the first complete set of eruption source parameters at Sangay volcano which is critical to improve ash dispersion and fallout forecast accuracy. New geochemical and component analyses also complement geophysical data in order to better understand Sangay eruptive dynamics, providing information about the magmatic system and clues to the eruption triggers. Several challenges remain, such as preparing the community, identifying effective media channels in rural area, and tailoring message content. In conclusion, the September 20, 2020 Sangay eruptive pulse tested and helped improve the response of the IG-EPN and provided clues as to where further progress can be made to reduce the impact of explosive eruptions in Ecuador and elsewhere.
The datasets presented in this study can be found in online repositories. The names of the repository/repositories and accession number(s) can be found in the article/Supplementary Material.
BB designed the study, analyzed the samples, compiled the information and wrote the first draft. PS and BB conducted the field work in Chimborazo province and PS analyzed the geochemical data. LM helped with the simulation set-up and interpretation. SHe analyzed the seismic records. GP provided social network and website statistics. JK provided and assisted in the interpretation of satellite imagery. ME carried on the Ash3D simulations and compiled the reports from the ROVE. SHi helped design the response protocol and edit the figures. NV performed the electron microprobe analysis. All authors participated in the review of the final manuscript and agree to be responsible for the content of this work.
This work is part of the Ecuadorian-French cooperation carried out between the IG-EPN and the Institut de Recherche pour le Développement (IRD, France) through a Laboratoire Mixte International program “Séismes et Volcans dans les Andes du Nord”. This work is part of the project “Generación de Capacidades para la Emisión de Alertas Tempranas” funded by the Secretaria Nacional de Planificación y Desarrollo (SENPLADES). This is Laboratory of Excellence ClerVolc contribution number 557. This publication is funded by the Vicerrectorado de Investigación, Innovación y Vinculación de la Escuela Politécnica Nacional.
The authors acknowledge Céline Liorzou from the Université de Bretagne Occidentale (Brest, France) for the geochemical analyses. The authors also thank Maurizio Mulas from the Escuela Superior Politécnica del Litoral (Guayaquil, Ecuador) for the data from the ash fallout in Guayaquil and David Santacruz, Sandra Mera, Nabila Aguila and Janeth Marcillo, members of the ROVE for sending ash samples to the IG-EPN. The authors thank Jean-Luc Devidal from the Laboratoire Magmas et Volcans (Clermont-Ferrand, France) for his help for the acquisition of the electron microprobe data. The authors thank two reviewers and Natalia Deligne for their constructive comments that helped improve the quality of this work.
The authors declare that the research was conducted in the absence of any commercial or financial relationships that could be construed as a potential conflict of interest.
The reviewer KF declared a past collaboration with the author LM to the handling editor.
All claims expressed in this article are solely those of the authors and do not necessarily represent those of their affiliated organizations, or those of the publisher, the editors and the reviewers. Any product that may be evaluated in this article, or claim that may be made by its manufacturer, is not guaranteed or endorsed by the publisher.
The Supplementary Material for this article can be found online at: https://www.frontiersin.org/articles/10.3389/feart.2022.912835/full#supplementary-material
Alvarado, A., Ruiz, M., Mothes, P., Yepes, H., Segovia, M., Vaca, M., et al. (2018). Seismic, volcanic, and geodetic networks in Ecuador: Building capacity for monitoring and research. Seismol. Res. Lett. 89, 432–439. doi:10.1785/0220170229
Barsotti, S., Neri, A., Bertagnini, A., Cioni, R., Mulas, M., and Mundula, F. (2015). Dynamics and tephra dispersal of violent strombolian eruptions at vesuvius: Insights from field data, wind reconstruction and numerical simulation of the 1906 event. Bull. Volcanol. 77, 58. doi:10.1007/s00445-015-0939-6
Bernard, B., Encalada Simbaña, M., Báez, C., Chito, R., and Manosalvas, S. (2019). Dispersion of volcanic ash clouds in Ecuador: A 20 years perspective, Abstract volume of the 8th International Symposium on Andean Geodynamics, Sep. 2019, Quito, Ecuador. Available at: https://www.igepn.edu.ec/8isag-abstracts/volcanology/22852-bernard-etal-1/file (Accessed March 16, 2022).
Bernard, B. (2013). Homemade ashmeter: A low-cost, high-efficiency solution to improve tephra field-data collection for contemporary explosive eruptions. J. Appl. Volcanol. 2, 1. doi:10.1186/2191-5040-2-1
Bernard, B., Ramón, P., García, L., Hernandez, S., Vasconez, F. J., Viracucha, G., et al. (2022). Volcanic event management in the galápagos islands, Ecuador. Volcanica 5 (1), 209–225. doi:10.30909/vol.05.01.209225
Biass, S., Frischknecht, C., and Bonadonna, C. (2012). A fast GIS-based risk assessment for tephra fallout: The example of Cotopaxi volcano, Ecuador-Part II: Vulnerability and risk assessment. Nat. Hazards (Dordr). 64 (1), 615–639. doi:10.1007/s11069-012-0270-x
Bonadonna, C., and Costa, A. (2012). Estimating the volume of tephra deposits: A new simple strategy. Geology 40, 415–418. doi:10.1130/G32769.1
Bonadonna, C., Costa, A., Folch, A., and Koyaguchi, T. (2015). “Chapter 33 - tephra dispersal and sedimentation,” in The encyclopedia of volcanoes. Editor H. Sigurdsson. Second Edition (Amsterdam: Academic Press), 587–597. doi:10.1016/B978-0-12-385938-9.00033-X
Bonadonna, C., Folch, A., Loughlin, S., and Puempel, H. (2012). Future developments in modelling and monitoring of volcanic ash clouds: Outcomes from the first IAVCEI-WMO workshop on ash dispersal forecast and civil aviation. Bull. Volcanol. 74, 1–10. doi:10.1007/s00445-011-0508-6
Bonadonna, C., and Houghton, B. F. (2005). Total grain-size distribution and volume of tephra-fall deposits. Bull. Volcanol. 67, 441–456. doi:10.1007/s00445-004-0386-2
Brazier, S., Sparks, R. S. J., Carey, S. N., Sigurdsson, H., and Westgate, J. A. (1983). Bimodal grain size distribution and secondary thickening in air-fall ash layers. Nature 301, 115–119. doi:10.1038/301115a0
Brown, R. J., and Andrews, G. D. M. (2015). “Chapter 36—deposits of pyroclastic density currents A2—sigurdsson, haraldur,” in En the Encyclopedia of volcanoes. Second Edition (Academic Press), Cambridge, Massachusetts, United States, 631–648. http://www.sciencedirect.com/science/article/pii/B9780123859389000365.
Carey, S., and Sigurdsson, H. (1986). The 1982 eruptions of El Chichon volcano, Mexico (2): Observations and numerical modelling of tephra-fall distribution. Bull. Volcanol. 48, 127–141. doi:10.1007/bf01046547
Carn, S. A., Krueger, A. J., Arellano, S., Krotkov, N. A., and Yang, K. (2008). Daily monitoring of Ecuadorian volcanic degassing from space. J. Volcanol. Geotherm. Res. 176, 141–150. doi:10.1016/j.jvolgeores.2008.01.029
Cioni, R., Pistolesi, M., and Rosi, M. (2015). “Chapter 29—plinian and subplinian eruptions A2—sigurdsson, haraldur,” in En the Encyclopedia of volcanoes. Second Edition (Academic Press), Cambridge, Massachusetts, United States, 519–535. http://www.sciencedirect.com/science/article/pii/B9780123859389000298.
Coombs, M. L., Wech, A. G., Haney, M. M., Lyons, J. J., Schneider, D. J., Schwaiger, H. F., et al. (2018). Short-term forecasting and detection of explosions during the 2016–2017 eruption of bogoslof volcano, Alaska. Front. Earth Sci. 6, 1–17. doi:10.3389/feart.2018.00122
Cotten, J., Le Dez, A., Bau, M., Caroff, M., Maury, R. C., Dulski, P., et al. (1995). Origin of anomalous rare-earth element and yttrium enrichments in subaerially exposed basalts: Evidence from French Polynesia. Chem. Geol. 119, 115–138. doi:10.1016/0009-2541(94)00102-E
Crosweller, H. S., Arora, B., Brown, S. K., Cottrell, E., Deligne, N. I., Guerrero, N. O., et al. (2012). Global database on large magnitude explosive volcanic eruptions (LaMEVE). J. Appl. Volcanol. 1, 4. doi:10.1186/2191-5040-1-4
Durant, A. J., Rose, W. I., Sarna-Wojcicki, A. M., Carey, S., and Volentik, A. C. (2009). Hydrometeor-enhanced tephra sedimentation: Constraints from the 18 may 1980 eruption of Mount St. Helens. J. Geophys. Res. 114, B03204. doi:10.1029/2008JB00575610.1029/2008JB005756
Durant, A. J., and Rose, W. I. (2009). Sedimentological constraints on hydrometeor-enhanced particle deposition: 1992 eruptions of Crater Peak, Alaska. J. Volcanol. Geotherm. Res. 186, 40–59. doi:10.1016/j.jvolgeores.2009.02.004
El Comercio (1959a). El volcán Sangay en erupción (Quito, Ecuador: Grupo El Comercio CA). 24-03-1959.
El Comercio (1959b). El volcán Sangay está lanzando desde ayer una enorme columna d’hum (Quito, Ecuador: Grupo El Comercio CA). 25-09-1959.
Engwell, S., Mastin, L., Tupper, A., Kibler, J., Acethorp, P., Lord, G., et al. (2021). Near-real-time volcanic cloud monitoring: Insights into global explosive volcanic eruptive activity through analysis of volcanic ash advisories. Bull. Volcanol. 83, 9. doi:10.1007/s00445-020-01419-y
Eychenne, J., Cashman, K., Rust, A., and Durant, A. (2015). Impact of the lateral blast on the spatial pattern and grain size characteristics of the 18 May 1980 Mount St. Helens fallout deposit. J. Geophys. Res. Solid Earth 120 (9), 6018–6038. doi:10.1002/2015JB012116
Eychenne, J., Le Pennec, J.-L., Ramón, P., and Yepes, H. (2013). Dynamics of explosive paroxysms at open-vent andesitic systems: High-resolution mass distribution analyses of the 2006 Tungurahua fall deposit (Ecuador). Earth Planet. Sci. Lett. 361, 343–355. doi:10.1016/j.epsl.2012.11.002
Eychenne, J., Le Pennec, J.-L., Troncoso, L., Gouhier, M., and Nedelec, J.-M. (2012). Causes and consequences of bimodal grain-size distribution of tephra fall deposited during the August 2006 Tungurahua eruption (Ecuador). Bull. Volcanol. 74, 187–205. doi:10.1007/s00445-011-0517-5
Falconieri, A., Cooke, M. C., Filizzola, C., Marchese, F., Pergola, N., and Tramutoli, V. (2018). Comparing two independent satellite-based algorithms for detecting and tracking ash clouds by using SEVIRI sensor. Sensors 18, 369. doi:10.3390/s18020369
Fierstein, J., and Nathenson, M. (1992). Another look at the calculation of fallout tephra volumes. Bull. Volcanol. 54, 156–167. doi:10.1007/BF00278005
Folch, A., Costa, A., Durant, A., and Macedonio, G. (2010). A model for wet aggregation of ash particles in volcanic plumes and clouds: 2. Model application. J. Geophys. Res. 115, B09202. doi:10.1029/2009JB007176
Folk, R. L., and Ward, W. C. (1957). Brazos river bar: A study of the significance of grainsize parameters. J. Sediment. Res. 27, 3–26. doi:10.1306/74d70646-2b21-11d7-8648000102c1865d
Galle, B., Johansson, M., Rivera, C., Zhang, Y., Kihlman, M., Kern, C., et al. (2010). Network for observation of volcanic and atmospheric change (NOVAC)—a global network for volcanic gas monitoring: Network layout and instrument description. J. Geophys. Res. 115, D05304. doi:10.1029/2009JD011823
Go, S. Y., Kim, G. B., Jeong, J. O., and Sohn, Y. K. (2017). Diatreme evolution during the phreatomagmatic eruption of the Songaksan tuff ring, Jeju Island, Korea. Bull. Volcanol. 79 (3), 23. doi:10.1007/s00445-017-1103-2
Gouhier, M., Deslandes, M., Guéhenneux, Y., Hereil, P., Cacault, P., and Josse, B. (2020). Operational response to volcanic ash risks using HOTVOLC satellite-based system and MOCAGE-accident model at the toulouse VAAC. Atmosphere 11, 864. doi:10.3390/atmos11080864
Hayashi, J. N., and Self, S. (1992). A comparison of pyroclastic flow and debris avalanche mobility. J. Geophys. Res. 97 (B6), 9063–9071. doi:10.1029/92JB00173
Heffter, J. L., Stunder, B. J. B., and Rolph, G. D. (1990). Long-range forecast trajectories of volcanic ash from redoubt volcano eruptions. Bull. Am. Meteorological Soc. 71 (12), 1731–1738. doi:10.1175/1520-0477(1990)071<1731:LRFTOV>2.0.CO;2
Horwell, C. J. (2007). Grain-size analysis of volcanic ash for the rapid assessment of respiratory health hazard. J. Environ. Monit. 9, 1107–1115. doi:10.1039/B710583P
IG-EPN (2020a). #IGAlInstante informativo volcán SANGAY No. 110. Available at: https://informes.igepn.edu.ec/igepn-registro-web/pages/public/InformeGenerado.jsf?directorio=12604 (Accessed March 16, 2022).
IG-EPN (2020b). #IGAlInstante informativo volcán SANGAY No. 111. Available at: https://informes.igepn.edu.ec/igepn-registro-web/pages/public/InformeGenerado.jsf?directorio=12605 (Accessed March 16, 2022).
IG-EPN (2020d). Informe Especial del Volcán Sangay - 2020 - N°1. Available at: https://informes.igepn.edu.ec/igepn-registro-web/pages/public/InformeGenerado.jsf?directorio=12691 (Accessed March 16, 2022).
IG-EPN (2020c). Informe Especial del Volcán Sangay - 2020 - N°4. Available at: https://informes.igepn.edu.ec/igepn-registro-web/pages/public/InformeGenerado.jsf?directorio=12694 (Accessed March 16, 2022).
IG-EPN (2021). Informe Especial del Volcán Sangay - 2020 - N°5. Available at: https://informes.igepn.edu.ec/igepn-registro-web/pages/public/InformeGenerado.jsf?directorio=25446 (Accessed March 16, 2022).
ISO 13320:2020 (2020). Particle size analysis — laser diffraction methods. ISO. Available at: https://www.iso.org/cms/render/live/en/sites/isoorg/contents/data/standard/06/91/69111.html (Accessed February 15, 2021).
Johnson, J. B., Aster, R. C., Ruiz, M. C., Malone, S. D., McChesney, P. J., Lees, J. M., et al. (2003). Interpretation and utility of infrasonic records from erupting volcanoes. J. Volcanol. Geotherm. Res. 121, 15–63. doi:10.1016/S0377-0273(02)00409-2
Kumagai, H., Yepes, H., Vaca, M., Caceres, V., Naga, T., Yokoe, K., et al. (2007). Enhancing volcano-monitoring capabilities in Ecuador. Eos Trans. AGU. 88, 245–246. doi:10.1029/2007EO230001
Lees, J. M., and Ruiz, M. (2008). Non-linear explosion tremor at Sangay, volcano, Ecuador. J. Volcanol. Geotherm. Res. 176, 170–178. doi:10.1016/j.jvolgeores.2007.08.012
Lowenstern, J. B., Wallace, K., Barsotti, S., Sandri, L., Stovall, W., Bernard, B., et al. (2022). Guidelines for volcano-observatory operations during crises: Recommendations from the 2019 Volcano Observatory best practices meeting. J. Appl. Volcanol. 11, 3. doi:10.1186/s13617-021-00112-9
Mastin, L. G., Guffanti, M., Servranckx, R., Webley, P., Barsotti, S., Dean, K., et al. (2009). A multidisciplinary effort to assign realistic source parameters to models of volcanic ash-cloud transport and dispersion during eruptions. J. Volcanol. Geotherm. Res. 186, 10–21. doi:10.1016/j.jvolgeores.2009.01.008
Mastin, L. G., Randall, M., Schwaiger, H., and Denlinger, R. (2013). User’s guide and reference to Ash3d—a three-dimensional model for Eulerian atmospheric tephra transport and deposition. John W. Powell National Center Reston, Virginia, U.S: U.S. Geological Survey Open-File Report 2013–1122. Available at: http://pubs.usgs.gov/of/2013/1122/.
Mastin, L. G., Van Eaton, A. R., and Durant, A. J. (2016). Adjusting particle-size distributions to account for aggregation in tephra-deposit model forecasts. Atmos. Chem. Phys. 16, 9399–9420. doi:10.5194/acp-16-9399-2016
McPhie, J., Doyle, M., and Allen, R. (1993). Volcanic textures: A guide to the interpretation of textures in volcanic rocks. University of Tasmania: Centre for Ore Deposit and Exploration Studies.
Mei, E. T. W., Lavigne, F., Picquout, A., de Bélizal, E., Brunstein, D., Grancher, D., et al. (2013). Lessons learned from the 2010 evacuations at Merapi volcano. J. Volcanol. Geotherm. Res. 261, 348–365. doi:10.1016/j.jvolgeores.2013.03.010
Monzier, M., Robin, C., Samaniego, P., Hall, M. L., Cotten, J., Mothes, P., et al. (1999). Sangay volcano, Ecuador: Structural development, present activity and petrology. J. Volcanol. Geotherm. Res. 90, 49–79. doi:10.1016/S0377-0273(99)00021-9
Mothes, P. A., Yepes, H. A., Hall, M. L., Ramón, P. A., Steele, A. L., and Ruiz, M. C. (2015). The scientific–community interface over the fifteen-year eruptive episode of Tungurahua Volcano, Ecuador. J. Appl. Volcanol. 4, 9. doi:10.1186/s13617-015-0025-y
Newhall, C. G., Pallister, J. S., and Miller, C. D. (2021). “Chapter 13 - a checklist for crisis operations within volcano observatories,” in Forecasting and Planning for volcanic hazards, risks, and disasters hazards and disasters series. Editor P. Papale (Amsterdam, Netherlands: Elsevier), 493–544. doi:10.1016/B978-0-12-818082-2.00013-5
Newhall, C. G., and Self, S. (1982). The volcanic explosivity index (VEI) an estimate of explosive magnitude for historical volcanism. J. Geophys. Res. 87, 1231–1238. doi:10.1029/JC087iC02p01231
Ogburn, S. E., and Calder, E. S. (2017). The relative effectiveness of empirical and physical models for simulating the dense undercurrent of pyroclastic flows under different emplacement conditions. Front. Earth Sci. (Lausanne). 5, 1–26 doi:10.3389/feart.2017.00083https://www.frontiersin.org/articles/10.3389/feart.2017.00083
Pallister, J., Papale, P., Eichelberger, J., Newhall, C., Mandeville, C., Nakada, S., et al. (2019). Volcano observatory best practices (VOBP) workshops - a summary of findings and best-practice recommendations. J. Appl. Volcanol. 8, 2. doi:10.1186/s13617-019-0082-8
Pardini, F., Corradini, S., Costa, A., Esposti Ongaro, T., Merucci, L., Neri, A., et al. (2020). Ensemble-based data assimilation of volcanic ash clouds from satellite observations: Application to the 24 december 2018 Mt. Etna explosive eruption. Atmosphere 11, 359. doi:10.3390/atmos11040359
Parker, C. F. (2015). Complex negative events and the diffusion of crisis: Lessons from the 2010 and 2011 Icelandic volcanic ash cloud events. Geogr. Ann. Ser. A, Phys. Geogr. 97, 97–108. doi:10.1111/geoa.12078
Parra, R., Bernard, B., Narváez, D., Le Pennec, J.-L., Hasselle, N., and Folch, A. (2016). Eruption Source Parameters for forecasting ash dispersion and deposition from vulcanian eruptions at Tungurahua volcano: Insights from field data from the July 2013 eruption. J. Volcanol. Geotherm. Res. 309, 1–13. doi:10.1016/j.jvolgeores.2015.11.001
Parra, R. (2018). Numerical system for forecasting volcanic ash dispersion in Ecuador. 2018 IEEE Third Ecuador Technical Chapters Meeting (ETCM), 15-19 October 2018, Cuenca, Ecuador, 1–5. doi:10.1109/ETCM.2018.8580331
Pioli, L., Erlund, E., Johnson, E., Cashman, K., Wallace, P., Rosi, M., et al. (2008). Explosive dynamics of violent Strombolian eruptions: The eruption of Parícutin Volcano 1943–1952 (Mexico). Earth Planet. Sci. Lett. 271 (1), 359–368. doi:10.1016/j.epsl.2008.04.026
Poland, M. P., Orr, T. R., Kauahikaua, J. P., Brantley, S. R., Babb, J. L., Patrick, M. R., et al. (2016). The 2014-2015 Pāhoa lava flow crisis at Kīlauea Volcano, Hawai‘i: Disaster avoided and lessons learned. GSA Today 26, 4–10. doi:10.1130/GSATG262A.1
Pritchard, M. E., Biggs, J., Wauthier, C., Sansosti, E., Arnold, D. W. D., Delgado, F., et al. (2018). Towards coordinated regional multi-satellite InSAR volcano observations: Results from the Latin America pilot project. J. Appl. Volcanol. 7, 5. doi:10.1186/s13617-018-0074-0
Pyle, D. M. (2000). “Sizes of volcanic eruptions,” in Encyclopedia of volcanoes. Editors En H. Sigurdsson, B. F. Houghton, S. R. McNutt, H. Rymer, and J. Stix (Cambridge, Massachusetts, United States: Academic Press), 263–270.
Pyle, D. M. (1989). The thickness, volume and grainsize of tephra fall deposits. Bull. Volcanol. 51, 1–15. doi:10.1007/BF01086757
Ramon, P., Vallejo, S., Mothes, P., Andrade, D., Vásconez, F., Yepes, H., et al. (2021). Instituto Geofísico – Escuela Politécnica nacional, the Ecuadorian seismology and Volcanology Service. Volcanica 4 (S1), 93–112. doi:10.30909/vol.04.S1.93112
Reckziegel, F., Bustos, E., Mingari, L., Báez, W., Villarosa, G., Folch, A., et al. (2016). Forecasting volcanic ash dispersal and coeval resuspension during the April–May 2015 Calbuco eruption. J. Volcanol. Geotherm. Res. 321, 44–57. doi:10.1016/j.jvolgeores.2016.04.033
Risica, G., Rosi, M., Pistolesi, M., Speranza, F., and Branney, M. J. (2022). Deposit-derived block-and-ash flows: The hazard posed by perched temporary tephra accumulations on volcanoes; 2018 Fuego disaster, Guatemala. JGR. Solid Earth 127 (6), e2021JB023699. doi:10.1029/2021JB023699
Rodríguez-Sedano, L. A., Sarocchi, D., Caballero, L., Borselli, L., Ortiz-Rodríguez, A. J., Cerca-Ruiz, M. F., et al. (2022). Post-eruptive lahars related to the 1913 eruption in La Lumbre Ravine, Volcán de Colima, Mexico: The influence of ravine morphometry on flow dynamics. J. Volcanol. Geotherm. Res. 421, 107423. doi:10.1016/j.jvolgeores.2021.107423
Ruiz, M. C., Ortiz, H. D., Hernandez, S., Palacios, P., and Anzieta, J. C. (2017). “Infrasound as a long standing tool for monitoring continental ecuadorean volcanoes,” in American Geophysical Union, Fall Meeting 2017, New Orleans, United States. abstract #S51B-0596. Available at: https://ui.adsabs.harvard.edu/abs/2017AGUFM.S51B0596R (Accessed March 16, 2022).
Ruiz, M., Guillier, B., Chatelain, J.-L., Yepes, H., Hall, M., and Ramon, P. (1998). Possible causes for the seismic activity observed in Cotopaxi Volcano, Ecuador. Geophys. Res. Lett. 25, 2305–2308. doi:10.1029/98GL01689
Schwaiger, H. F., Denlinger, R. P., and Mastin, L. G. (2012). Ash3d: A finite-volume, conservative numerical model for ash transport and tephra deposition. J. Geophys. Res. 117, 1–20. doi:10.1029/2011JB008968
Siebert, L., Simkin, T., and Kimberly, P. (2010). Volcanoes of the world. Third Edition. University of California Press. Berkeley, California, United States.
Sorem, R. K. (1982). Volcanic ash clusters: Tephra rafts and scavengers. J. Volcanol. Geotherm. Res. 13 (1), 63–71. doi:10.1016/0377-0273(82)90019-1
Taddeucci, J., Edmonds, M., Houghton, B., James, M. R., and Vergniolle, S. (2015). “Chapter 27—Hawaiian and strombolian eruptions A2—sigurdsson, haraldur,” in En the encyclopedia of volcanoes. Second Edition (Cambridge, Massachusetts, United States: Academic Press), 485–503. Available at: http://www.sciencedirect.com/science/article/pii/B9780123859389000274.
Tadini, A., Roche, O., Samaniego, P., Guillin, A., Azzaoui, N., Gouhier, M., et al. (2020). Quantifying the uncertainty of a coupled plume and tephra dispersal model: PLUME-MOM/HYSPLIT simulations applied to andean volcanoes. J. Geophys. Res. Solid Earth 125. doi:10.1029/2019JB018390
Valverde, V., Mothes, P., Beate, B., and Bernard, J. (2021). Enormous and far-reaching debris avalanche deposits from Sangay volcano (Ecuador): Multidisciplinary study and modeling the 30 ka sector collapse. J. Volcanol. Geotherm. Res. 411, 107172. doi:10.1016/j.jvolgeores.2021.107172
Vasconez, F. J., Hidalgo, S., Battaglia, J., Hernandez, S., Bernard, B., Coppola, D., et al. (2022). Linking ground-based data and satellite monitoring to understand the last two decades of eruptive activity at Sangay volcano, Ecuador. Bull. Volcanol. 84 (5), 49. doi:10.1007/s00445-022-01560-w
Vogel, A., Diplas, S., Durant, A. J., Azar, A. S., Sunding, M. F., Rose, W. I., et al. (2017). Reference data set of volcanic ash physicochemical and optical properties. J. Geophys. Res. Atmos. 122, 9485–9514. doi:10.1002/2016JD026328
Volentik, A. C. M., Bonadonna, C., Connor, C. B., Connor, L. J., and Rosi, M. (2010). Modeling tephra dispersal in absence of wind: Insights from the climactic phase of the 2450BP Plinian eruption of Pululagua volcano (Ecuador). J. Volcanol. Geotherm. Res. 193 (1), 117–136. doi:10.1016/j.jvolgeores.2010.03.011
Webley, P., and Mastin, L. (2009). Improved prediction and tracking of volcanic ash clouds. J. Volcanol. Geotherm. Res. 186, 1–9. doi:10.1016/j.jvolgeores.2008.10.022
Wolf, T. (1904). Crónica de los fenómenos volcánicos y terremotos en el Ecuador con algunas noticias sobre otros países de la América Central y Meridional desde 1535 hasta 1797. Available at: http://www.dspace.uce.edu.ec/handle/25000/14200 (Accessed March 16, 2022).
Wright, H. M. N., Pallister, J. S., McCausland, W. A., Griswold, J. P., Andreastuti, S., Budianto, A., et al. (2019). Construction of probabilistic event trees for eruption forecasting at Sinabung volcano, Indonesia 2013–14. J. Volcanol. Geotherm. Res. 382, 233–252. doi:10.1016/j.jvolgeores.2018.02.003
Keywords: Sangay, forecasting, communication, Ash3d, eruption source parameters, violent Strombolian, grain-size distribution
Citation: Bernard B, Samaniego P, Mastin L, Hernandez S, Pino G, Kibler J, Encalada M, Hidalgo S and Vizuete N (2022) Forecasting and communicating the dispersion and fallout of ash during volcanic eruptions: lessons from the September 20, 2020 eruptive pulse at Sangay volcano, Ecuador. Front. Earth Sci. 10:912835. doi: 10.3389/feart.2022.912835
Received: 04 April 2022; Accepted: 28 July 2022;
Published: 24 August 2022.
Edited by:
Karen Fontijn, Université libre de Bruxelles, BelgiumReviewed by:
Jorge Eduardo Romero, Universidad de Atacama, ChileCopyright © 2022 Bernard, Samaniego, Mastin, Hernandez, Pino, Kibler, Encalada, Hidalgo and Vizuete. This is an open-access article distributed under the terms of the Creative Commons Attribution License (CC BY). The use, distribution or reproduction in other forums is permitted, provided the original author(s) and the copyright owner(s) are credited and that the original publication in this journal is cited, in accordance with accepted academic practice. No use, distribution or reproduction is permitted which does not comply with these terms.
*Correspondence: Benjamin Bernard, YmJlcm5hcmRAaWdlcG4uZWR1LmVj
Disclaimer: All claims expressed in this article are solely those of the authors and do not necessarily represent those of their affiliated organizations, or those of the publisher, the editors and the reviewers. Any product that may be evaluated in this article or claim that may be made by its manufacturer is not guaranteed or endorsed by the publisher.
Research integrity at Frontiers
Learn more about the work of our research integrity team to safeguard the quality of each article we publish.