 Bo Li1,2
 Gang Wang
95% of researchers rate our articles as excellent or good
Learn more about the work of our research integrity team to safeguard the quality of each article we publish.
Find out more
ORIGINAL RESEARCH article
Front. Earth Sci. , 04 May 2022
Sec. Geohazards and Georisks
Volume 10 - 2022 | https://doi.org/10.3389/feart.2022.912356
This article is part of the Research Topic Rock Landslide Risk Assessment, Stability Analysis and Monitoring for The Development of Early Warning Systems and Reinforcement Measures View all 24 articles
Freeze-thaw damage of rocks is one of significant natural causes for geo-hazards such as collapse and rockfall in alpine areas. To explore damage evolution in granite in a freeze-thaw environment, specimens of granite in Nyingchi Prefecture, Tibet, China were collected as research objects. Saturated and dry rock specimens were subjected to cyclic freeze-thaw tests of 0, 36, 72, and 144 cycles and freeze-thaw damage of the rock was analyzed by combining computed tomography (CT) scanning and three-dimensional (3D) visualization. Results show that the peak stress of granite decreases to different extents with the increasing number of freeze-thaw cycles; compared with dry rock specimens, saturated granite deteriorates more significantly and shows obviously different stress–strain curves under loading. The moisture condition exerts significant influences on the degree of freeze-thaw damage to granite: after 144 freeze-thaw cycles, the mass loss rates of dry and saturated rock specimens are 0.06% and 0.44% and their loss rates of uniaxial compressive strength (UCS) reach 4.08% and 26.2%, respectively. Under freeze-thaw cycles, the frost heave of pore water causes initiation and development of micro-defects and new micro-cracks mainly develop along relatively weak areas such as inherent defects (pores and fractures) and boundaries between different mineral crystals, resulting in intergranular and transgranular cracking. For dry rock specimens, the non-uniform contraction and expansion of minerals therein are main causes for deterioration inside the rock. The freeze-thaw damage of rocks is calculated using the improved elastic modulus loss method. The damage development trend conforms to the strength deterioration trend and the pore development in the rock, reflecting the evolution of freeze-thaw damage to granite.
With the implementation of the Belt and Road Initiative, more engineering works are under construction in the alpine area of the Tibet Plateau, including a Sichuan–Tibet railway and China–Nepal railway. In these regions, rocks can be severely damaged under the effect of large day/night and seasonal temperature difference, affecting normal engineering operations (Qi et al., 2017; Peng et al., 2020). Therefore, studying the freeze-thaw damage of rocks and the mechanism of such damage is of important theoretical and practical significance for engineering construction and maintenance therein.
To ascertain the damage mechanism to rocks under freeze-thaw actions, scholars have investigated the physico-mechanical properties of rocks subject to freeze-thaw cycling. Nicholson et al. (2000) conducted cyclic freeze-thaw tests on several types of rocks to compare influences of lithology on damage and fracture of rocks. Based on cyclic freeze-thaw tests on rock specimens at different moisture contents, Kodama et al. (2013) studied influences of saturation on the strength loss and failure mode of rocks. Park et al. (2015) performed cyclic freeze-thaw tests on basalt and tuff and considered that frost heave of water inside rocks is the main cause for rock weathering, manifest mainly as increased porosity, crack initiation, and particle falling induced by volume expansion after the water-ice phase change. Jiang et al. (2017) assessed the influences of saturation and the number of freeze-thaw cycles on the uniaxial compressive strength of sandstone and identified the number of freeze-thaw cycles as an important factor affecting the strength loss. Bayram (2012) evaluated the impact strength, elastic modulus, and water absorption of frozen-thawed limestone and established a statistical model for the rate of loss of the UCS. Luo et al. (2014) and Khanlari et al. (2015) conducted cyclic freeze-thaw tests on sandstone and limestone and found the decrease of P-wave velocity in rocks. By studying the freeze-thaw properties of several types of rocks at −45 to 15°C, Aoki et al. (1990) found that the P-wave velocity of rocks decreases significantly, and the tensile strength is decreased by as much as 15% after freeze-thaw cycling. Zou et al. (2017) stated that the initiation of new cracks is caused by temperature change and mainly occurs in the cooling stage of the freeze-thaw cycles, which is macroscopically shown as strength reduction in rocks induced by freeze-thaw damage. In summary, numerous scholars have discussed influences of freeze-thaw action on the physico-mechanical parameters (strength, porosity, and wave velocity) of rocks under conditions of different freeze-thaw environments, lithology, fracture characteristics and saturations, and analyzed the damage mechanism and evolution model of rocks (Yamabe and Neaupane, 2001; Park et al., 2004; Zhang et al., 2008; Tan et al., 2011; Yavuz, 2011; Martinez-Martinez et al., 2013; Ghobadi and Babazadeh, 2015; Momeni et al., 2016). However, changes in macroscopic physical and mechanical properties of rocks are caused by the superposition and evolution of mesoscopic mechanical properties and it is difficult to expound the failure mechanism of rocks from the macroscopic perspective solely.
In recent years, many scholars have found that microscopic and mesoscopic quantitative and qualitative analysis of rocks can reveal the deterioration characteristics and failure mechanisms of rocks. For example, some scholars explored micro and mesoscopic damage evolution in rocks using techniques such as scanning electron microscopy (SEM) and computed tomography (CT). By using SEM, Liu et al. (2005) and Fang et al. (2014) observed that freeze-thaw damage of rocks starts from locations of pre-existing defects, and damage of cement between particles and extrusion and dislocation of local particles facilitate initiation and development of microcracks. Tian et al. (2021) used SEM to study red sandstone subjected to freeze-thaw cycles and found that micropores and microcracks increase significantly in frozen-thawed red sandstone. Based on SEM, Qin et al. (2017) investigated pore structures in coal after different numbers of freeze-thaw cycles and calculated the sizes of defects therein. With the development of new techniques, research on damage is no longer limited to analysis of surface cracks or bonding characteristics of particles. Researchers have used CT visualization technology to study the fracture propagation on the entire cross section of rocks from the mesoscopic perspective. Yang et al. (2002) used CT to conduct cyclic freeze-thaw tests on soft rocks and discussed the constitutive relationship pertaining to damage propagation in rocks. In addition, they adopted the CT number as a variable to define freeze-thaw damage of rocks. Song et al. (2019) studied two-dimensional (2D) CT scanning images of rocks by virtue of programming software and described the development of new pores and the evolution mechanism of freeze-thaw damage. Based on CT, Bubeck et al. (2017) performed quantitative and visual processing on data including the size, volume, and spatial orientation of pores, which compensated for the limitation of traditional 2D image analysis. By means of the non-destructive testing approach of CT scanning, Maji et al. (2019) conducted 3D visualization analysis on sandstone and chalk under freeze-thaw cycles and explored the deterioration of mesoscopic structures under the cyclic freeze-thaw effect. They proposed three probability functions for describing freeze-thaw damage to rocks.
Meso-scale observation results indicate that freeze-thaw cycles can heavily damage the internal structures of rocks, which is the primary cause for changes in the macroscopic mechanical properties of rocks. However, the resolution of images acquired in freeze-thaw cycles is generally above 20 μm, taking CT techniques, with their favorable visualization effect, as an example (Promentilla and Sugiyama, 2010; Kock et al., 2015; Deprez et al., 2020; Fan et al., 2021; Yang et al., 2021). They cannot readily reveal the characteristics of rocks in the initiation, development, and coalescence of micro-cracks. Considering this, the spatial resolution of the CT scanner used in this study is significantly improved to explore internal freeze-thaw damage of rocks and the limit crack width that the CT scanner can measure is 0.2 μm. The CT scanning results are analyzed and linked to uniaxial compression testing results to establish a damage index that can effectively quantify the strength deterioration of rocks subject to freeze-thaw actions.
Moderately weathered fine- and medium-grained granite (Figure 1) collected at Binghu (Cuomujiri Lake) Hydropower Station in Nyingchi Prefecture, south-eastern Tibet, China was used in the cyclic freeze-thaw tests. Selection of the specimens met requirements for the same location, same batch, and similar mechanical properties. Minerals were detected using a polarizing microscope, revealing compositions of the granite (Table 1).
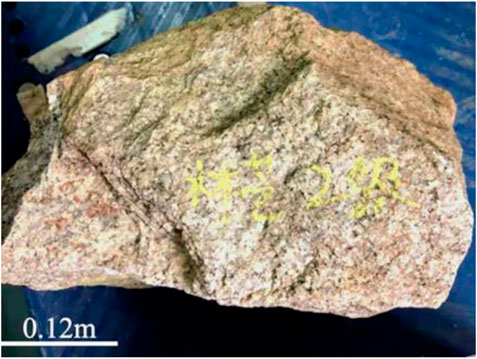
FIGURE 1. Medium weathered granite collected in the Tibet Plateau.

TABLE 1. Constituents of the tested granite.
The specimens in the cyclic freeze-thaw tests were prepared as follows: 1) a core drilling machine was used to drill rock cores at a low speed; 2) the top and bottom of each specimen were slowly cut and ground using a manual grinding tool to avoid damage at the edges; 3) cylindrical granite specimens with a diameter of 10 mm and height of 25 mm (Figure 2) were obtained. Cylindrical specimens were selected to avoid production of artefacts in the CT scanning process and specimens were machined to maximize the spatial resolution possible during CT scanning. During the imaging process, the artifacts on CT images refer to abnormal images unrelated to the scanned tissue structure.
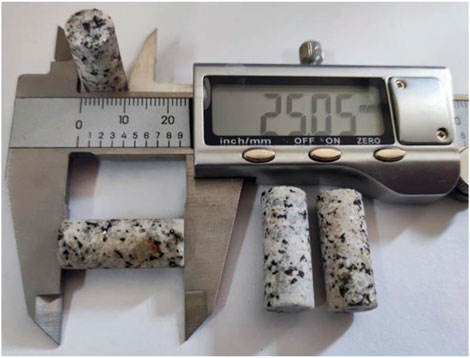
FIGURE 2. Granite specimens.
A Phoenix v|tome|x m micro-focus CT scanning system was used in the test, which comprised two ray tubes (micron- and nanometer-sized ones), a rotating stage, and an X-ray detector. The resolution of the detector reached 4048 × 4048 pixels that can detect a feature as small as 0.8 μm. During CT scanning, high-energy electrons bombard a metal target to produce conical X-ray beams, which were focused on the rock specimen placed on the stage. Then, the detection panel automatically acquired the omnidirectional ray images of the specimen, thus realizing 3D measurement and non-destructive analysis of internal structures of rocks, such as spatial distribution of cracks, porosity distribution, and density changes of rocks. For the nondestructive probing technology, the CT scanning will not affect the subsequent freeze-thaw test. Figure 3 shows the CT scanning system.
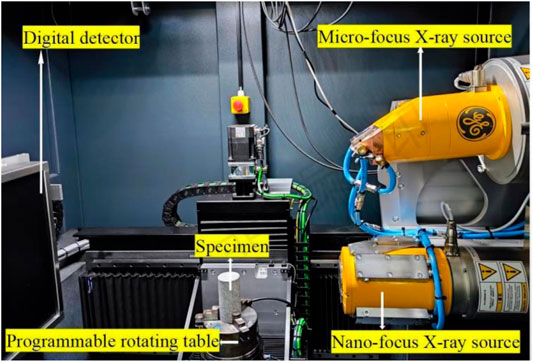
FIGURE 3. Configuration of the CT scanning system.
In the test process, specimens were wrapped in thin foam to avoid artefacts caused by shaking in the scanning process. The specimens were scanned for 45 min in each time and the acquisition parameters during scanning are listed in Table 2. Among the CT scanning parameters provided, the current and voltage separately determine the number and penetration intensity of X-rays.

TABLE 2. CT scan parameters.
A high and low alternating temperature and humidity test chamber (Figure 4) was used in the cyclic freeze-thaw tests (internal dimensions: 500 mm × 600 mm × 750 mm). The test chamber could operate across the temperature range of -40–150°C with a tolerance of ± 0.5 °C. The test chamber has the programming control function, through which the temperature and humidity can be switched automatically.
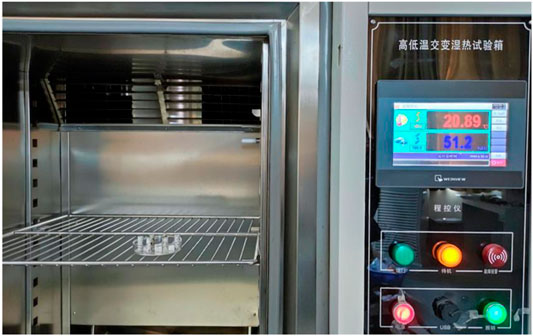
FIGURE 4. High-low temperature alternating test chamber.
The rock specimens were tested under two moisture conditions: dry and saturated. The dry specimens were obtained by drying the rock at 60°C for 48 h in a thermostat, while the saturated specimens were prepared by placing the rock in a water container which was then immersed for 72 h under a vacuum pressure. The freeze-thaw temperature range was set as (−20 °C, 20°C) and freezing and thawing both took 6 h, in a complete cycle. 144 freeze-thaw cycles were designed and the humidity in the freeze-thaw chamber was maintained at around 100% throughout.
After 0, 36, 72, and 144 freeze-thaw cycles, CT scanning and uniaxial compression tests were conducted on saturated and dry specimens. It is worth noting that to reveal the development of fractures in rocks under freeze-thaw cycles, the same rock specimen was selected for CT scanning after different numbers of freeze-thaw cycles.
Figures 5, 6 present comparisons of CT cross-sectional images of dry and saturated specimens after different numbers of freeze-thaw cycles. The lower and upper parts of the figures illustrate the grey-scale map and porosity diagram of granite on the same cross section. The numbers at the lower right corner of the porosity diagram represent the proportion of pore area within the total cross sectional area.
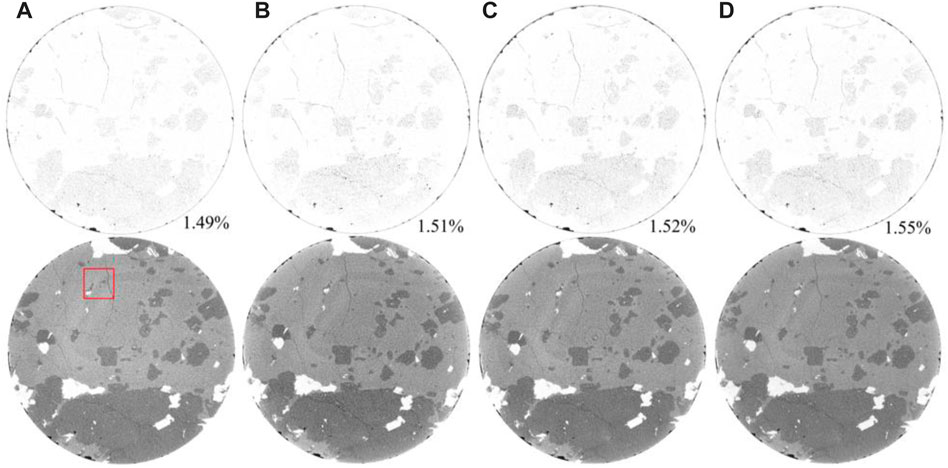
FIGURE 5. 2D cross-sectional CT images of a dry granite sample (a∼d) scanned after different freeze-thaw cycles: (A) 0 cycle, (B) 36 cycles, (C) 72 cycles, and (D) 144 cycles. The lower half shows the original grayscale CT images and the upper half shows the extracted pores and micro-cracks in each figure. The number indicates the fractional number of defect pixels over the total pixel number.
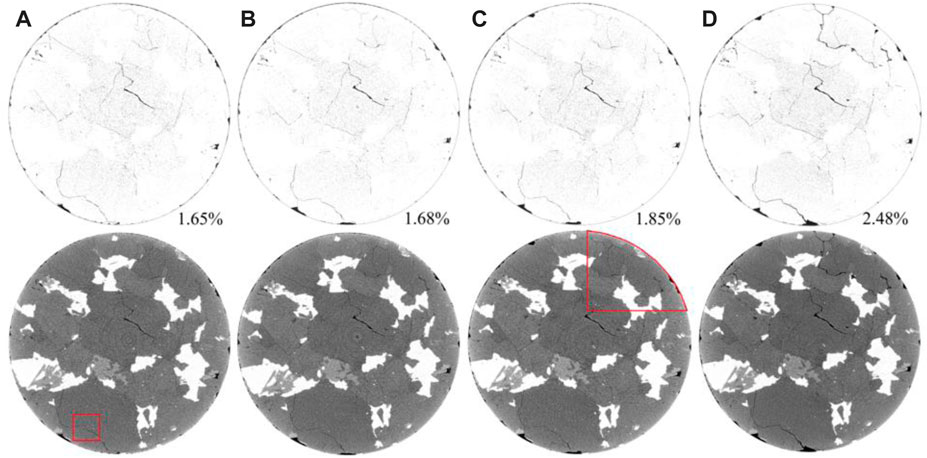
FIGURE 6. 2D cross-sectional CT images of a saturated granite sample (a∼d) scanned after different freeze-thaw cycles: (A) 0 cycle, (B) 36 cycles, (C) 72 cycles, and (D) 144 cycles.
As shown in Figure 5, there are a few cracks on the cross section of dry granite specimens before freeze-thaw cycles, and many micro-defects measuring 5–10 μm are distributed within the rock cores. Over all freeze-thaw cycles, the defects on the cross-section change little and no obvious crack initiation and pore expansion are observed. Only slight debris falling on side edges is observed after 72 freeze-thaw cycles. Such falling is shown as the increased dark and black area around the circumference in the porosity diagrams. After 0, 36, 72, and 144 freeze-thaw cycles, the proportions of pores on cross sections demonstrated are 1.49%, 1.51%, 1.52%, and 1.55%, respectively, showing slow growth.
Figure 6 demonstrates that there are a few cracks on the cross section of saturated granite specimens before freeze-thaw cycles and the proportions of pores are 1.65%, 1.68%, 1.85% and 2.48% after 0, 36, 72, and 144 freeze-thaw cycles, respectively. This indicates that the debris spalling from the sides of saturated granite specimens is more obvious in the freeze-thaw process compared with dry specimens and significant fracture development is observed on the circular cross-section after 144 cycles.
To explore the development of defects in dry granite, the area marked by the red rectangular box on the cross-sectional image of the dry granite specimen (Figure 5) was studied, and the amplified image is shown in Figure 7. Figures 7A–D show the grey-scale images of the same selected area after 0, 36, 72, and 144 freeze-thaw cycles, respectively. Microcracks at k1, k2, k3, and k4 are selected for analysis, wherein the widths of cracks are 13.4, 13.4, 13.8, and 15.8 μm, respectively. That is, the crack width only increases by 2.4 μm after 144 cycles, proving that dry granite shows favorable freeze-thaw resistance.
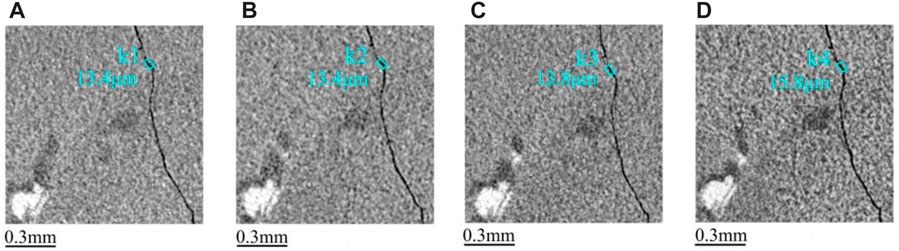
FIGURE 7. Evolution trend of defect in the rectangle areas of dry granite sample scanned after different freeze-thaw cycles. (A) 0 cycle, (B) 36 cycles, (C)72 cycles, and (D) 144 cycles.
The area indicated by the red rectangular box in the saturated granite specimen (Figure 6) was selected to investigate the development of defects in saturated granite, as shown in Figure 8. Figures 8A–D indicate grey-scale images of the same selected area after 0, 36, 72, and 144 freeze-thaw cycles, respectively. Microcracks at m and n on the cross section are selected for analysis, where crack widths at m1, m2, m3, and m4 are 12.6, 12.6, 12.8, and 17.2 μm; while those at n1, n2, n3, and n4 are 17.6, 17.6, 18.0, and 24.8 μm, respectively. The result indicates that the cracks develop slowly in saturated granite in the first 72 freeze-thaw cycles and crack development mainly takes place between 72 and 144 freeze-thaw cycles.
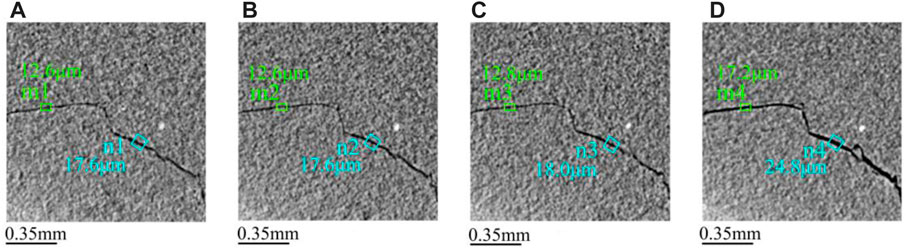
FIGURE 8. Evolution trend of defect in rectangle areas of saturated granite sample scanned after different freeze-thaw cycles. (A) 0 cycle, (B) 36 cycles, (C)72 cycles, and (D) 144 cycles.
Furthermore, the red fan-shaped area marked in Figure 6 (showing a saturated granite specimen) was selected for analysis. Differences in pores on the cross sections of saturated granite after 72 and 144 freeze-thaw cycles are illustrated in Figure 9. Cross-sections in Figures 9A,B represent grey-scale images of the selected cross section after 72 and 144 freeze-thaw cycles, respectively. Areas L and P marked by red boxes show representative debris falling at side edges of saturated granite. Large defects appear in area L in Figure 9A after 144 freeze-thaw cycles, that is, falling of local debris particles. Compared with Figure 9B, water accumulates and expands after being frozen and microcracks initiate in area L after the occurrence of defects. The microcracks develop rapidly along the inherent defects (microcracks at y1) beneath the area because the frost-heave stress generated by the water-ice phase-change in a new cycle exceeds the ultimate tensile strength of the rock. The microcracks propagate to area Q and develop intergranular cracks at the boundary between mica and plagioclase in the area. Here, y1 and y2 represent the width of microcracks and are 9.8 and 17.4 μm respectively, indicative of apparent crack development. Then, cracks further develop along the direction of inherent defects (cracks) marked in area V, which are shown as local transgranular cracks in mica in areas T and U and obvious intergranular fractures in areas R and S. The transgranular cracks occur over small areas because their occurrence calls for more energy, that is, a greater frost-heave force. Dimensions x1 and x2 denote the widths of inherent cracks after 72 and 144 freeze-thaw cycles and are 22.0 and 31.8 μm, respectively; z1 and z2 represent widths of new cracks, which are 17.0 and 12.2 μm, respectively. Under these conditions, cracks in areas L, Q, V, T, R, U, and S (Figure 9A) have been coalesced, where the granite is at a higher risk of damage and spalling. A comparison of CT images and data indicates that damage of saturated granite generally develops from defects at edges to the interior of the rock core. The interior of the rock core is not obviously damaged after a small number of freeze-thaw cycles, which is highly consistent with the development of defects shown in Figure 9.
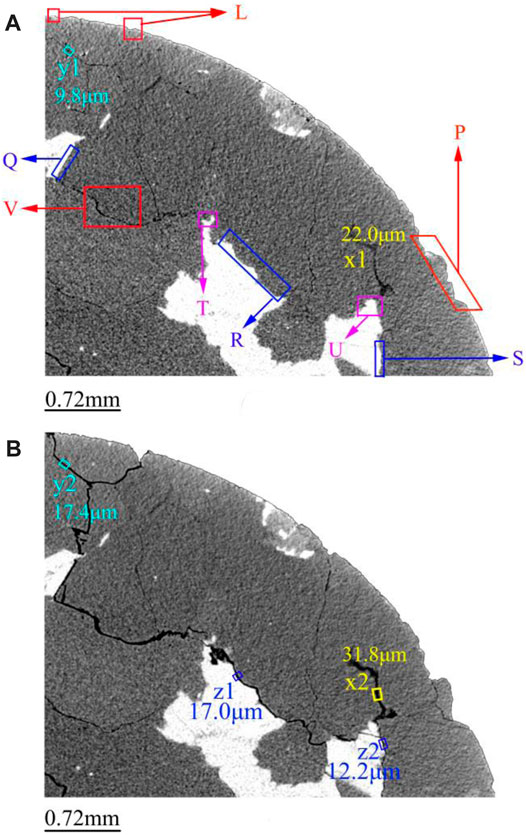
FIGURE 9. Defect evolution in fan-shaped area of a saturated granite sample scanned after different freeze-thaw cycles: (A) 72 cycles, (B) 144 cycles.
In summary, debris falling on external surface occurs to both the saturated and dry rock specimens after 72 freeze-thaw cycles; whereas, new microcracks only initiate at defects on external surfaces of saturated rock specimens in the process from 72 to 144 cycles and they develop along directions of two weak areas, that is, inherent cracks and defects inside specimens and boundaries between different mineral compositions. These microcracks develop to wide coalesced cracks after repeated freeze-thaw cycles. Defects on the cross section displayed in the dry rock specimen do not change to any significant extent after 144 cycles because of the absence of frost-heave force generated by the water-ice phase change as the driving force for development of defects. Apparently, occurrence of new cracks is the essential cause of the accelerated development of defects in these saturated rock specimens.
CT scan slices were imported in VG Studio and Avizo for image processing and the reconstruction method based on superposition was used to attain the 3D reconstructed model of the granite. To reveal the nature and extent of the damage caused by freeze-thaw cycling, internal defects such as pores and cracks were taken as research objects. The 3D visualization software was used to analyze grey values of the CT images and calculate the porosity. Figure 10 shows the change trends of porosity of saturated and dry specimens, as well as fitted curves and goodness of fit R2 of corresponding data. P in the fitting formula represents the porosity of the rock. It can be seen that as the number of freeze-thaw cycles increases, the porosity of saturated and dry specimens increases in a quasi-linear manner and the saturated specimen is more sensitive to the freeze-thaw cycles with a change rate of porosity being 7.2 times that of dry granite.
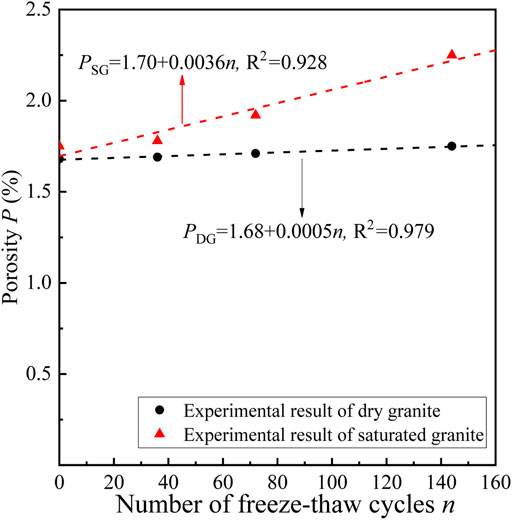
FIGURE 10. Porosity evolutions of granite samples after different freeze-thaw cycles.
Figure 11 shows renderings of cracks and relatively large pores in saturated granite after different numbers of freeze-thaw cycles. Pores with a volume of less than 0.001 mm3 are ignored to improve the visualization effect in 3D reconstruction. Figures 11A–D display results after 0, 36, 72, and 144 freeze-thaw cycles, respectively. It can be seen from the figure that the volume of inherent defects in the saturated specimen is between 0.001 and 0.594 mm3 before freeze-thaw actions. After 36 freeze-thaw cycles, the isolated crack with the largest volume (0.600 mm3) appears in the red area at the bottom of the specimen in Figure 11B and the crack only expands slightly compared with the initial state. After 72 cycles, the volume of the defect in the red area at the bottom of the granite in Figure 11C changes to 0.630 mm3, remaining the largest defect. After 144 cycles, the spatial form of 3D defects in the saturated specimen begins to change significantly. The volume of the crack (green area) at the bottom of the rock in Figure 11D increases to 1.0 mm3, while the crack of the largest volume (1.450 mm3) appears at the top of the rock. The rate of crack development at the ends of the saturated specimen is apparently larger than that of the interior because granite is an intrusive magmatic rock in plutonitic masses, in which mineral crystals are highly compact. However, cracks inside the granite are not highly coalesced after 144 freeze-thaw cycles but remain as isolated segments. The volume of defects is larger at the two ends while smaller in the middle. Because defects change insignificantly in the dry granite after 144 freeze-thaw cycles, they are not analyzed in detail herein.
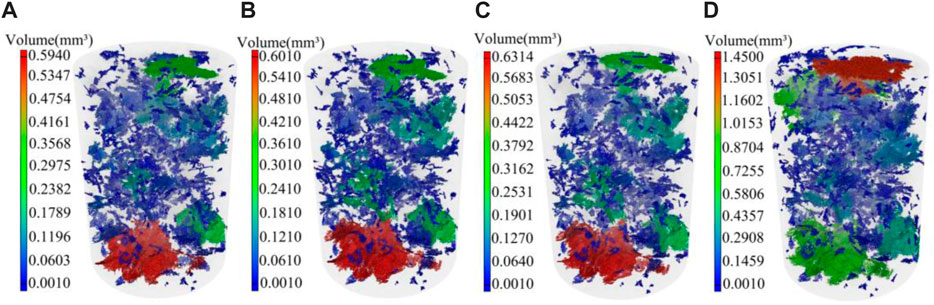
FIGURE 11. Evolutions of defect volume in 3D reconstructed models of a saturated granite sample (a∼d) after different freeze-thaw cycles: (A) 0 cycle, (B) 36 cycles, (C) 72 cycles, and (D) 144 cycles.
An MTS 815 testing system was used to conduct uniaxial compression tests on frozen-thawed granite specimens to reveal their mechanical properties. Figure 12 shows the compression test results on cylindrical granite specimens, which were obtained by with a static resistance strain gauge. To ensure the accuracy of strain measurement, the test followed recommendations of the International Society for Rock Mechanics (Fairhurst and Hudson, 2000). The displacement-controlled mode was selected to apply load to the rock specimens at a cross-head displacement rate of 0.001 mm/s. At room temperature, uniaxial compression tests were conducted on saturated and dry granite specimens after different numbers of freeze-thaw cycles.
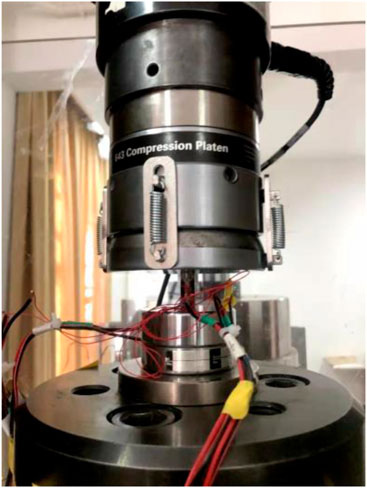
FIGURE 12. Uniaxial compression test of a granite specimen on a MTS 815 system.
Figures 13A,B illustrate the stress–strain curves of dry and saturated specimens after different freeze-thaw cycles. The strength of dry granite specimens decreases to the least extent after freeze-thaw cycles, and the stress–strain curves tend to stretch rightward and descend with the increasing number n of freeze-thaw cycles, resulting in a longer compaction stage and slight loss of elastic modulus of the granite. In the process of 0–72 freeze-thaw cycles, stress–strain curves of saturated granite show a small difference; while the elastic modulus and UCS of saturated granite decrease significantly with increasing axial strain after 144 freeze-thaw cycles. Observation of test curves after 144 freeze-thaw cycles in Figure 13B shows that, after reaching the peak strength, the curves descend slowly at first and then rapidly. This is because defects on two ends of saturated granite develop at a rate faster than those in the core of the rock specimens, so that local compressive failure occurs at the ends of the specimen in the uniaxial compression test.
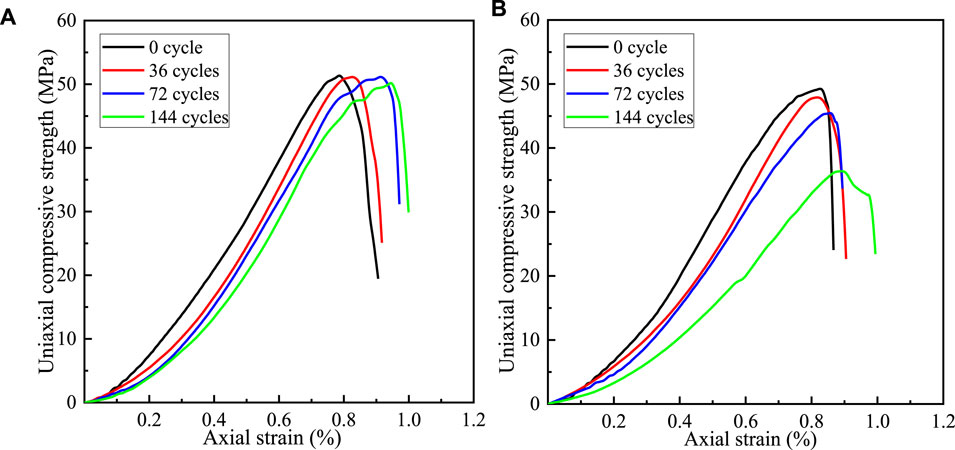
FIGURE 13. Representative stress-strain curves of (A) dry granite and (B) saturated granite samples subject to different freeze-thaw cycles.
To quantify the strength deterioration trend of granite in the freeze-thaw process, Figure 14 displays UCS of the granite after different freeze-thaw cycles. In the figure, R2 represents the fitting degree (subscripts SG and DG to the dependent variables represent saturated and dry granite, respectively).
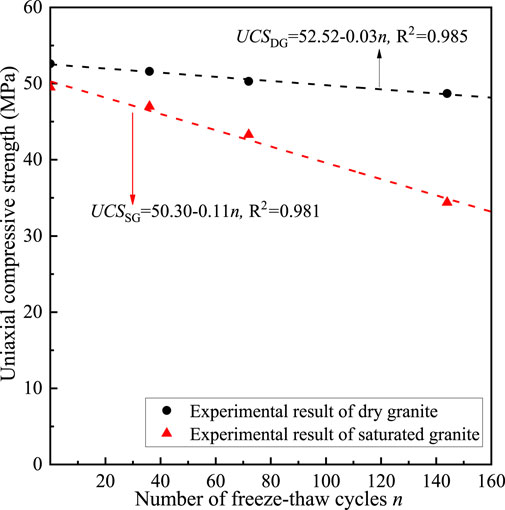
FIGURE 14. Evolutions of the uniaxial compressive strength of dry and saturated samples subject to cyclic freeze-thaw actions.
It can be seen from Figure 14 that the strength of both saturated and dry granite decreases linearly and the absolute values of slopes of their fitted curves are 0.11 and 0.03, respectively; after 144 freeze-thaw cycles, strength losses of dry and saturated granite reach 4.08% and 26.2%, respectively, which indicates that the strength deterioration rate of the saturated granite is significantly higher than that of the dry granite. Because strength deterioration of dry granite is mainly attributed to differences in the coefficients of thermal expansion and cold contraction of mineral compositions, incompatible deformation occurs in the cyclic cold contraction and reheating that impairs rock structures. This is supported by falling of debris from the external surface and occurrence of microcracks inside. In comparison, the complex water-ice phase change also occurs in the saturated granite, exerting extra damages to the rock.
Surface spalling of rocks during freeze-thaw cycles resembles rockfall of frozen rocks in cold-region engineering. To comprehensively explore the evolution of rock appearance in freeze-thaw cycles, saturated granite with greater debris falling was taken as an example. It shows that visible (yet tiny) fragments of debris begin to appear on the external surface after 72 freeze-thaw cycles. After 144 cycles, obvious small-scale defects are seen on ends of multiple cylindrical granite specimens. Changes in the appearance of granite match the CT visualization results.
The mass loss rate of rocks subject to freeze-thaw actions is defined as the proportion of lost mass of a dry specimen at the end of freeze-thaw cycles in the total mass of the dry specimen before freeze-thaw cycles, and saturated rock specimens need to be dried before calculating their mass loss rate. Figure 15 shows the mass loss rates of saturated and dry granite after n freeze-thaw cycles. The fitted curves and R2 of corresponding data are also provided. In the fitting formula, MLSG and MLDG represent the mass loss rates of saturated and dry granite, respectively. Tests results are statistical means of data from multiple test specimens.
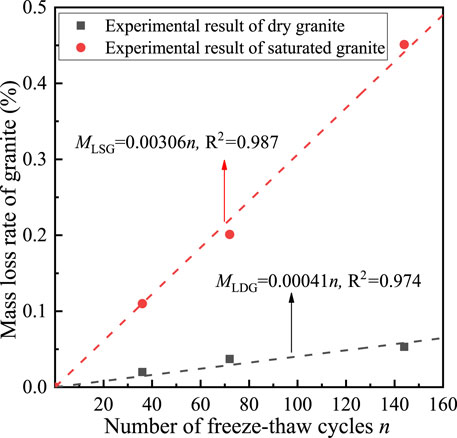
FIGURE 15. Evolutions of the mass loss rates of granite samples during freeze-thaw cycles.
With the increase in the number n of freeze-thaw cycles, the fitted curves for mass loss rates of dry and saturated granite are both shown as the first-order function model, whose slope reflects the difficulty with which the rock sheds mass under freeze-thaw cycling: the greater the slope, the easier the mass is lost from the rock in the freeze-thaw process. It is worth noting that changes in the appearance and mass loss rate of the rock only mirror the resistance of the surface and local areas of the rock to freeze-thaw damage but fail to comprehensively describe freeze-thaw damage to the rock.
To quantify the damage evolution in granite after different numbers of freeze-thaw cycles, it is considered that responses of the macroscopic mechanical properties of the rock can reflect deterioration within the rock from the perspective of the macroscopic damage mechanics. The damage variable is expressed as follows based on the degree of loss of elastic modulus:
where D represents the damage index of granite due to freeze-thaw cycles, and En represents the elastic modulus of the rock after n freeze-thaw cycles and Eo denotes the initial elastic modulus of the rock before freeze-thaw cycling.
Considering the random distribution of defects inside the rock, the pore content and degree of fracture coalescence both significantly influence the failure process, hence, changes in the effective load-bearing area of the rock in the freeze-thaw process are considered and used as an improvement coefficient Z, as shown below:
where Ve and V represent the effective load-bearing volume and apparent load-bearing volume of the rock (mm3), respectively, and Vpo is the initial pore volume in the rock (mm3). Here, V is composed of two parts: one is the matrix volume Ve, that is, the effective load-bearing volume; another is the volume of pores and cracks Vp (mm3), which is also termed the initial damage considering various defects in the rock itself. To eliminate influences of this initial damage, the initial pore volume VP0 in the rock is subtracted from V. Combining Eqs 1, 2, the damage variable is given by
According to mechanical tests on the rock and analysis results of the 3D visualization software, the freeze-thaw damage index D of the rock could be calculated using Eq. 3. To date, many scholars have proposed the mathematical model for the relationship between the freeze-thaw damage index and the number of freeze-thaw cycles (Altindag et al., 2004; Oezbek, 2014; Liu et al., 2015). Based on properties and test data of the studied rock, the first-order function model of D(n) = kn could be used to describe the damage evolution. In this model, parameter k represents the sensitivity of the rock to the freeze-thaw action, and the larger the value is, the faster the damage accumulates. According to the equation, the damage-evolution models (Eqs 4, 5 were obtained for the saturated and dry granite:
where DSG and DDG represent the freeze-thaw damage index of saturated granite and dry granite, respectively.
Figure 16 illustrates comparison of the predicted curve and measured value of the damage index of granite: the predicted values are a good fit to the measured data. The slope of the fitted curve reflects the rate of change in the damage. The growth rate of damage of saturated granite is about four times that of dry granite.
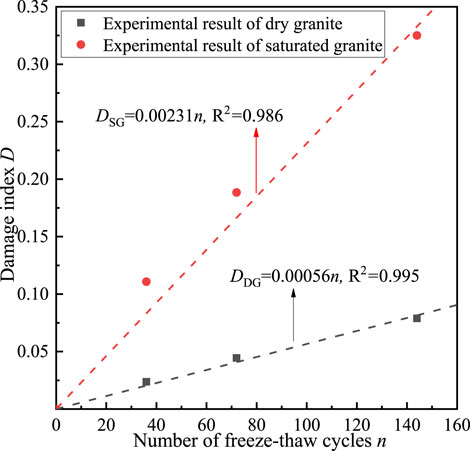
FIGURE 16. Relations between the damage index D and the number of freeze-thaw cycles n of granite.
To test the reasonability of calculation of the freeze-thaw damage index D, the relationship between the freeze-thaw damage index D and UCS was drawn, as shown in Figure 17, in which the fitted curve agrees well with the measured strength. This finding can verify the feasibility of the improved elastic modulus loss method. The UCS linearly decreases as the damage index D changes. When D = 0, there is no loss of UCS; when D = 1, the UCSs of the saturated and dry granite both approximate 0 on the fitted curve, that is, the rock has completely lost its bearing capacity.
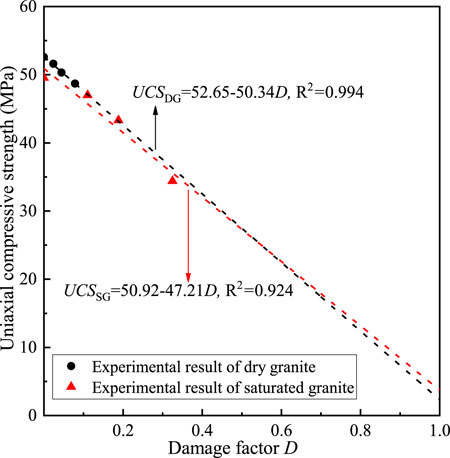
FIGURE 17. Relations between the uniaxial compressive strength UCS and the damage index D of granite.
To explore damage evolution in granite under cyclic freeze-thaw actions, characteristics of microcracks and evolution of macroscopic mechanical parameters in the freeze-thaw process were quantitatively analyzed. In the process, cyclic freeze-thaw tests, high-resolution CT scanning, and uniaxial compression tests were carried out. The main concluding remarks are
1) The number of freeze-thaw cycles and the moisture condition significantly influence the mechanical properties of granite. As the number of freeze-thaw cycles increases, the peak stress of granite decreases to different extents. Compared with dry rock specimens, saturated granite shows more significant deterioration. After 144 freeze-thaw cycles, the strength losses of dry and saturated granite are 4.08% and 26.2%, respectively.
2) High-resolution CT scanning allowed visualization of the freeze-thaw processes underway in the rock, which intuitively shows the evolution of damage and deterioration of granite. Under freeze-thaw cycles, the frost heave of pore water in saturated granite causes new micro-defects to initiate and develop and new cracks mainly develop from surface defects to the interior of the rock cores, accompanied by non-uniform deformation of different mineral compositions. This facilitates pores and cracks in the rock to constantly propagate and coalesce. For dry rock specimens, the non-uniform contraction and expansion of minerals therein are main causes for internal deterioration of the rock, and its rate of structural deterioration is much lower than that of saturated granite specimens.
3) The elastic modulus loss method introduced with the correction coefficient of effective load-bearing volume deliver a high accuracy when calculating freeze-thaw damage to granite. The damage index D increases linearly with the increase in the number of freeze-thaw cycles and it matches the strength deterioration trend and pore development of the granite, thus reflecting the evolution of freeze-thaw damage in granite.
The original contributions presented in the study are included in the article/Supplementary Material, further inquiries can be directed to the corresponding author.
BL: Formal analysis, Investigation, Visualization, Funding acquisition. GZ: Conceptualization, Methodology, Writing-original draft, Supervision. GW: Writing- review andediting, Funding acquisition. JQ: Writing—review and editing.
Natural Science Foundation of Zhejiang Province (Grant No.LR19E090001), Natural Science Foundation of China (Grant Nos. 42077252, 41831290), Hubei Key Laboratory of Roadway Bridge and Structure Engineering (Wuhan University of Technology) (Grant No.DQJJ202104)
The authors declare that the research was conducted in the absence of any commercial or financial relationships that could be construed as a potential conflict of interest.
All claims expressed in this article are solely those of the authors and do not necessarily represent those of their affiliated organizations, or those of the publisher, the editors and the reviewers. Any product that may be evaluated in this article, or claim that may be made by its manufacturer, is not guaranteed or endorsed by the publisher.
CT, computed tomography; D, freeze-thaw damage index; UCS, uniaxial compressive strength; SEM, scanning electron microscopy.
Altindag, R., Alyildiz, I. S., and Onargan, T. (2004). Mechanical Property Degradation of Ignimbrite Subjected to Recurrent Freeze-Thaw Cycles. Int. J. Rock Mech. Min. Sci. 41 (6), 1023–1028. doi:10.1016/j.ijrmms.2004.03.005
Aoki, K., Hibiya, K., and Yoshida, T. (1990). Storage of Refrigerated Liquefied Gases in Rock Caverns: Characteristics of Rock under Very Low Temperatures. Tunn. Undergr. Space Technol. 5 (4), 319–325. doi:10.1016/0886-7798(90)90126-5
Bayram, F. (2012). Predicting Mechanical Strength Loss of Natural Stones after Freeze-Thaw in Cold Regions. Cold Regions Sci. Technol. 83-84, 98–102. doi:10.1016/j.coldregions.2012.07.003
Bubeck, A., Walker, R. J., Healy, D., Dobbs, M., and Holwell, D. A. (2017). Pore Geometry as a Control on Rock Strength. Earth Planet. Sci. Lett. 457, 38–48. doi:10.1016/j.epsl.2016.09.050
De Kock, T., Boone, M. A., De Schryver, T., Van Stappen, J., Derluyn, H., Masschaele, B., et al. (2015). A Pore-Scale Study of Fracture Dynamics in Rock Using X-Ray Micro-CT under Ambient Freeze-Thaw Cycling. Environ. Sci. Technol. 49 (5), 2867–2874. doi:10.1021/es505738d
Deprez, M., De Kock, T., De Schutter, G., and Cnudde, V. (2020). A Review on Freeze-Thaw Action and Weathering of Rocks. Earth-Science Rev. 203, 103143. doi:10.1016/j.earscirev.2020.103143
Fairhurst, C. E., and Hudson, J. A. (2000). Draft ISRM Suggested Method for the Complete Stress-Strain Curve for Intact Rock in Uniaxial Compression. Chin. J. Rock Mech. Eng. 19 (06), 802–808. doi:10.3321/j.issn:1000-6915.2000.06.025
Fan, W., Yang, P., and Yang, Z. (2021). Freeze-Thaw Impact on Macropore Structure of Clay by 3D X-Ray Computed Tomography. Eng. Geol. 280, 105921. doi:10.1016/j.enggeo.2020.105921
Fang, Y., Qiao, L., Chen, X., Yan, S.-j., Zhai, G.-l., and Liang, Y.-w. (2014). Experimental Study of Freezing-Thawing Cycles on Sandstone in Yungang Grottos. Rock Soil Mech. 35 (09), 2433–2442. doi:10.16285/j.rsm.2014.09.003
Ghobadi, M. H., and Babazadeh, R. (2015). Experimental Studies on the Effects of Cyclic Freezing-Thawing, Salt Crystallization, and Thermal Shock on the Physical and Mechanical Characteristics of Selected Sandstones. Rock Mech. Rock Eng. 48 (3), 1001–1016. doi:10.1007/s00603-014-0609-6
Jiang, Z.-h., Yao, Z.-m., and Chen, J.-h. (2017). The Effect of Freezing-Thaw Cycle and Water Content on Uniaxial Compressive Strength of Sandstone. Min. Res. Dev. 37 (1), 85–88. doi:10.13827/j.cnki.kyyk.2017.01.020
Khanlari, G., Sahamieh, R. Z., and Abdilor, Y. (2015). The Effect of Freeze-Thaw Cycles on Physical and Mechanical Properties of Upper Red Formation Sandstones, Central Part of Iran. Arab. J. Geosci. 8 (08), 5991–6001. doi:10.1007/s12517-014-1653-y
Kodama, J., Goto, T., Fujii, Y., and Hagan, P. (2013). The Effects of Water Content, Temperature and Loading Rate on Strength and Failure Process of Frozen Rocks. Int. J. Rock Mech. Min. Sci. 62, 1–13. doi:10.1016/j.ijrmms.2013.03.006
Liu, C.-y., He, M.-c., Wang, S.-r., and Hu, J.-c. (2005). Experimental Investigation Freeze Thawing Damage Characteristics of Granite at Low Temperature. J. Hunan Univ. Sci. Technol. Nat. Sci. Ed. 20 (01), 37–40. doi:10.3969/j.issn.1672-9102.2005.01.010
Liu, Q. S., Huang, S. B., and Kang, Y. S. (2015). Fatigue Damage Model and Evaluation Index for Rock Mass under Freezing-Thawing Cycles. Chin. J. Rock Mech. Eng. 34 (6), 1116–1127. doi:10.13722/j.cnki.jrme.2014.1189
Luo, X., Jiang, N., Zuo, C., Dai, Z., and Yan, S. (2014). Damage Characteristics of Altered and Unaltered Diabases Subjected to Extremely Cold Freeze-Thaw Cycles. Rock Mech. Rock Eng. 47 (04), 1997–2004. doi:10.1007/s00603-013-0516-2
Maji, V., and Murton, J. B. (2020). Micro‐computed Tomography Imaging and Probabilistic Modelling of Rock Fracture by Freeze-Thaw. Earth Surf. Process. Landforms 45 (3), 666–680. doi:10.1002/esp.4764
Martínez-Martínez, J., Benavente, D., Gomez-Heras, M., Marco-Castaño, L., and García-del-Cura, M. Á. (2013). Non-linear Decay of Building Stones during Freeze-Thaw Weathering Processes. Constr. Build. Mater. 38, 443–454. doi:10.1016/j.conbuildmat.2012.07.059
Momeni, A., Abdilor, Y., Khanlari, G. R., Heidari, M., and Sepahi, A. A. (2016). The Effect of Freeze-Thaw Cycles on Physical and Mechanical Properties of Granitoid Hard Rocks. Bull. Eng. Geol. Environ. 75 (4), 1649–1656. doi:10.1007/s10064-015-0787-9
Nicholson, D. T., and Nicholson, F. H. (2000). Physical Deterioration of Sedimentary Rocks Subjected to Experimental Freeze-Thaw Weathering. Earth Surf. Process. Landforms 25 (12), 1295–1307. doi:10.1002/1096-9837(200011)25:12<1295::AID-ESP138>3.0.CO;2-E
Özbek, A. (2014). Investigation of the Effects of Wetting-Drying and Freezing-Thawing Cycles on Some Physical and Mechanical Properties of Selected Ignimbrites. Bull. Eng. Geol. Environ. 73 (2), 595–609. doi:10.1007/s10064-013-0519-y
Park, C., Synn, J. H., Shin, H. S., Cheon, D. S., Lim, H. D., and Jeon, S. W. (2004). Experimental Study on the Thermal Characteristics of Rock at Low Temperatures. Int. J. Rock Mech. Min. Sci. 41 (s1), 81–86. doi:10.1016/j.ijrmms.2003.12.08410.1016/j.ijrmms.2004.03.023
Park, J., Hyun, C.-U., and Park, H.-D. (2015). Changes in Microstructure and Physical Properties of Rocks Caused by Artificial Freeze-Thaw Action. Bull. Eng. Geol. Environ. 74 (2), 555–565. doi:10.1007/s10064-014-0630-8
Peng, J.-b., Cui, P., and Zhuang, J.-q. (2020). Challenges to Engineering Geology of Sichuan-Tibet Railway. Chin. J. Rock Mech. Eng. 39 (12), 2377–2389. doi:10.13722/j.cnki.jrme.2020.0446
Promentilla, M. A. B., and Sugiyama, T. (2010). X-Ray Microtomography of Mortars Exposed to Freezing-Thawing Action. Act 8 (2), 97–111. doi:10.3151/jact.8.97
Qi, L.-r., Wang, J.-d., Zhang, D.-f., Zhang, Y.-s., Li, Z.-x., Sun, J.-x., et al. (2017). A Study of Granite Damage in the Macro and Microscopic Scales under Freezing-Thawing Cycles. Hydrogeol. Eng. Geol. 48 (05), 65–73. doi:10.16030/j.cnki.issn.1000-3665.202103073
Qin, L., Zhai, C., Liu, S., Xu, J., Yu, G., and Sun, Y. (2017). Changes in the Petrophysical Properties of Coal Subjected to Liquid Nitrogen Freeze-Thaw - A Nuclear Magnetic Resonance Investigation. Fuel 194, 102–114. doi:10.1016/j.fuel.2017.01.005
Song, Y.-j., Yang, H.-m., Zhang, L.-t., and Ren, J.-x. (2019). CT Real-Time Monitoring on Uniaxial Damage of Frozen Red Sandstone. Rock Soil Mech. 40 (S1), 152–160. doi:10.16285/j.rsm.2018.2371
Tan, X., Chen, W., Yang, J., and Cao, J. (2011). Laboratory Investigations on the Mechanical Properties Degradation of Granite under Freeze-Thaw Cycles. Cold Regions Sci. Technol. 68 (3), 130–138. doi:10.1016/j.coldregions.2011.05.007
Tian, Z., Zhang, J.-y., Wang, G.-b., and Tang, M.-h. (2021). Experimental Study on Microstructure Damage of Freeze-Thaw Red Sandstone. Min. Res. Dev. 41 (10), 61–66. doi:10.13827/j.cnki.kyyk.2021.10.011
Yamabe, T., and Neaupane, K. M. (2001). Determination of Some Thermo-Mechanical Properties of Sirahama Sandstone under Subzero Temperature Condition. Int. J. Rock Mech. Min. Sci. 38 (7), 1029–1034. doi:10.1016/s1365-1609(01)00067-3
Yang, G.-s., Pu, Y.-b., and Ma, W. (2002). Discussion on the Damage Propagation for the Rock under the Frost and Thaw Condition of Frigid Zone. J. Exp. Mech. 17 (2), 220–226. doi:10.3969/j.issn.1001-4888.2002.02.015
Yang, H.-r., Liu, P., Sun, B., Yi, Z.-y., Wang, J.-j., and Yue, Y.-q. (2021). Study on Damage Mechanisms of the Microstructure of Sandy Conglomerate at Maijishan Grottoes under Freeze-Thaw Cycles. Chin. J. Rock Mech. Eng. 40 (03), 545–555. doi:10.13722/j.cnki.jrme.2020.0767
Yavuz, H. (2011). Effect of Freeze-Thaw and Thermal Shock Weathering on the Physical and Mechanical Properties of an Andesite Stone. Bull. Eng. Geol. Environ. 70 (2), 187–192. doi:10.1007/s10064-010-0302-2
Zhang, J.-z., Miu, L.-c., and Yang, Z.-f. (2008). Research on Rock Degradation and Deterioration Mechanisms and Mechanical Characteristics under Cyclic Freezing-Thawing. Chin. J. Rock Mech. Eng. 27 (8), 1688–1694. doi:10.3321/j.issn:1000-6915.2008.08.020
Keywords: rock mechanics, freeze-thaw action, computed tomographic scanning, pore development, uniaxial compressive strength, damage index
Citation: Li B, Zhang G, Wang G and Qiao J (2022) Damage Evolution of Frozen-Thawed Granite Based on High-Resolution Computed Tomographic Scanning. Front. Earth Sci. 10:912356. doi: 10.3389/feart.2022.912356
Received: 05 April 2022; Accepted: 20 April 2022;
Published: 04 May 2022.
Edited by:
Yan Du, University of Science and Technology Beijing, ChinaReviewed by:
Lin Ni, The University of Newcastle, AustraliaCopyright © 2022 Li, Zhang, Wang and Qiao. This is an open-access article distributed under the terms of the Creative Commons Attribution License (CC BY). The use, distribution or reproduction in other forums is permitted, provided the original author(s) and the copyright owner(s) are credited and that the original publication in this journal is cited, in accordance with accepted academic practice. No use, distribution or reproduction is permitted which does not comply with these terms.
*Correspondence: Gang Wang, Z2FuZ3cyNzc4NDJAd2h1dC5lZHUuY24=
Disclaimer: All claims expressed in this article are solely those of the authors and do not necessarily represent those of their affiliated organizations, or those of the publisher, the editors and the reviewers. Any product that may be evaluated in this article or claim that may be made by its manufacturer is not guaranteed or endorsed by the publisher.
Research integrity at Frontiers
Learn more about the work of our research integrity team to safeguard the quality of each article we publish.