- 1China Meteorological Administration Training Center, Beijing, China
- 2Beijing Goldwind Smart Energy Technology Co., Ltd., Beijing, China
- 3Yunnan Research Institute of Meteorology, Yunnan Meteorological Bureau, Kunming, China
- 4Emergency Management Center, State Grid Shandong Electric Power Company, Jinan, China
From 17 to 22 July 2021, a series of disastrous rainstorms appeared within Henan Province and its surroundings, which rendered 398 dead/missing and a direct economic loss of up to ∼114 billion Yuan. This event was named as the “21.7” Henan torrential rainfall event (TRE), and it could be divided roughly into three stages according to the precipitation features and dominant weather systems. This study mainly focused on the development and maintenance mechanisms of a long-lived (72 h) quasi-stationary mesoscale vortex that governed the earlier stage of the “21.7” TRE. Main results are as follows: 1) the mesoscale vortex formed/maintained in a favorable environment which was characterized by the South-Asia-high associated divergence in the upper troposphere, and the relay transport of relatively cold air by the trough and high-pressure system in the middle troposphere. 2) the vertical stretching due to lower-level convergence and the upward transport of cyclonic vorticity by ascending motions served as the first and second dominant factors for the mesoscale vortex’s rapid development and long-time maintenance, whereas, the import/export transport of anticyclonic/cyclonic vorticity into/from the vortex’s central region and the tilting effects were mainly detrimental for the vortex’s development/maintenance. 3) the air particles that formed the mesoscale vortex mainly came from the levels below 1,500 m, within the regions in lower latitudes. The air particles experienced notable precipitation before the formation of the mesoscale vortex, which contributed to the vortex’s formation through latent heat release.
1 Introduction
Torrential rainfall events (TREs) are one of the most severe natural disasters worldwide (IPCC, 2014). Every year, China suffers a series of TREs, which resulted in huge property losses and heavy casualties (Song, 2018). According to statistic, there are three major rainfall regions in China: North China, the middle reaches of the Yangtze River Basin and South China (Tao, 1980). Of these, North China has the smallest warm-season (May–September) accumulated precipitation (Zhao, 2004), whereas, the intensity of torrential rainfall within this region is overall stronger than that of the middle reaches of the Yangtze River Basin, and comparable to that of South China (Sun et al., 2019). As a result, torrential-rainfall-related disasters are serious in North China, for instance, the famous “58.7” (14–19 July 1958; the middle reaches of the Yellow River Basin) TRE, “63.8” TRE (1–9 August 1963; Hebei Province), “75.8” TRE (5–7 August 1975; Henan Province), and “7.21” TRE (21–22 July 2012; Beijing and Hebei Province) all caused catastrophic damages (Luo et al., 2020).
Most recently, a TRE occurred in Henan province, during which a total of 398 people was killed/missing, and a direct economic loss of up to ∼114 billion Yuan was caused (Yin et al., 2022). This event was named as the “21.7” TRE, since it began on 17 July 2021, lasted for 6 days, and ended in 22 July 2021 (Figure 1). During this event, a maximum 6-days accumulated precipitation of 1,122.6 mm appeared in Hebi City (in the northern section of Henan) and a maximum hourly precipitation of 201.9 mm occurred in Zhengzhou City. The “21.7” TRE is worthy of a thorough study as 1) the strongest hourly precipitation in the mainland of China since there are meteorological observations appeared in this event, and 2) the largest accumulated precipitation in North China since 1975 also appeared in this event. For 1), Yin et al. (2022) had supposed a possible formation mechanism: an arc-shaped convergence zone, which was associated with a strong meso-γ-scale convective system, transported precipitation from surrounding regions into Zhengzhou, and thus produced the extreme hourly rainfall. For 2), Nie and Sun (2022) had determined the moisture sources and transport for the “21.7” TRE (during 19–22 July 2021). They found that the typhoon In-Fa made the largest contribution in transporting moisture and the southern China acted as the most important moisture source. As the “21.7” TRE lasted for 6 days (Figure 1B), during which the main systems accounting for rainfall varied with time, therefore, it is necessary to conducted more in-depth analyses on each stage of the event to reach a more comprehensive understanding of the “21.7” TRE.
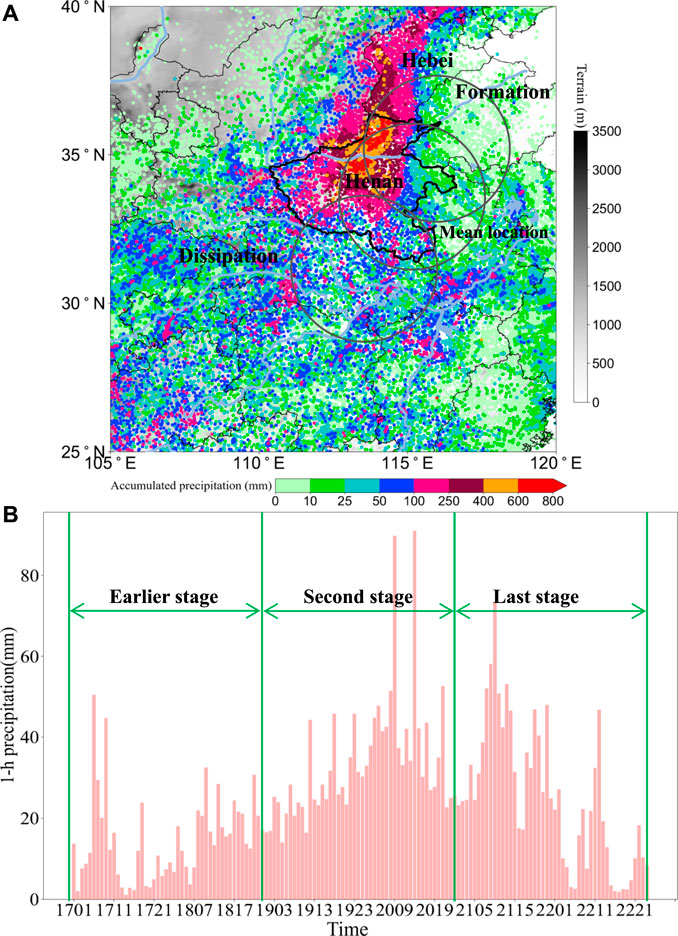
FIGURE 1. Panel (A) shows the accumulated precipitation (from 1700 UTC to 2300 UTC July 2021) during the “21.7” Henan heavy rainfall event (shading dots, units: mm), where the gray shading is terrain, and the big gray circles outline the main body of the vortex at different stages. Panel (B) shows the averaged (within Henan) hourly precipitation during the “21.7” Henan heavy rainfall event (mm).
A mesoscale vortex (Fu et al., 2020) dominated the earlier stage of the “21.7” TRE (i.e., 0000 UTC 17–0000 UTC 19 July 2021) (Section 3; Yin et al., 2022), which formed in the northeastern section of Henan Province, moved very slowly southward, and dissipated in the southern section of Henan Province. The mesoscale vortex acted as the most important system for the heavy precipitation in this stage, as its quasi-stationary behavior and longevity had maintained favorable conditions for precipitation in/around Henan Province. It has been a long time that the mesoscale vortices are found to act as a crucial condition for heavy rainfall (James and Johnson, 2010; Zhang et al., 2015; Fu et al., 2016; Ni et al., 2017). Through decomposing the vertical motion equation, Nielsen and Schumacher (2018) found that, strong rotation was associated with a negative pressure perturbation. Therefore, the influence of rotation and the induced pressure perturbation denoted the physical mechanism by which rotation could enhance the rainfall. As mentioned above, the primary purpose of this study was to clarify the mechanisms governing the mesoscale vortex’s development and long-time maintenance, which was helpful to deepen the understanding of the “21.7” TRE. The reminder of this study is as follow: Data and methods were shown in Section 2, overview of the “21.7” TRE was presented in Section 3, variation of the vortex and mechanisms governing its formation/maintenance were provided in Sections 4, 5, respectively, and finally a conclusion was reached in Section 6.
2 Data and Methods
2.1 Data
A total of three types of data was used in this study: 1) the hourly, 0.25° × 0.25° ERA5 reanalysis dataset from the European Centre for Medium-Range Weather Forecasts (Hersbach et al., 2020) was utilized for synoptic analyses, budget calculations, and backward trajectory analyses, as this dataset represents the precipitation (the threat score for the precipitation during the earlier stage of the “21.7” TRE was above 0.6) and meteorological fields (e.g., wind, temperature, height, etc.) reasonably; 2) the temperature of black body (TBB) from the Fengyun (FY)-IV satellite (http://satellite.nsmc.org.cn/PortalSite/Data/Satellite.aspx), which had a temporal resolution of hourly and a spatial resolution of 0.05° × 0.05° was employed for analyzing the convective activities during the event; 3) the station observed hourly precipitation from the China Meteorological Administration (CMA) was used to analyze the variation of the rainfall during the “21.7” TRE.
2.2 Vorticity Budget
As previous studies (Zhang, 1992; Fu et al., 2013, 2017; Feng et al., 2019; Zhang et al., 2019) show, vorticity budget is effective to determine the key mechanisms underlying vortices’ variation. In this study, we calculated the area (within the central region of the vortex) averaged vorticity budget, which can represent the variation of the velocity circulation of the vortex (i.e., the vortex’s intensity) effectively according to the Green’s theorem (Fu et al., 2017; Fu et al., 2019). The equation (Kirk, 2003) is as follow:
where
Term
2.3 Backward Trajectory Analysis
In this study, we used the HYSPLIT model (Stein et al., 2015) to track the air particles that formed the mesoscale vortex during the earlier stage of the “21.7” TRE. A total of 529 air particles at 850 hPa (the mesoscale vortex was at 850 hPa) was used in the backward tracking. These particles were distributed evenly within the central region of the mesoscale vortex (with a 0.25° × 0.25° spatial resolution). The backward tracking was initiated at 0200 UTC 16 July 2021 when the mesoscale vortex formed, and was ended at 0000 UTC 15 July 2021 (i.e., 26 h before the vortex’s formation). It should be noted that: 1) we regarded a closed counterclockwise circulation in the stream field coupled with a cyclonic vorticity center ≥10−5 s−1 as a vortex structure in this study (Fu et al., 2016; Fu et al., 2020); 2) the central region of the mesoscale vortex was determined by the mean size of the vortex during its whole life span (i.e., 5.5° × 5.5° for the mesoscale vortex in this study); 3) the selection of the central region was representative, as the features (including vorticity budget) averaged within it were insensitive to relatively small changes (i.e., increased/decreased each boundary line of the central region by ±0.25o).
3 Overview of the “21.7” Torrential Rainfall Event
3.1 Features of Precipitation
The “21.7” TRE maintained from 0000 UTC 17 July 2021 to 2300 UTC 22 July 2021 (i.e., ∼6 days). Its heavy precipitation area (i.e., 6-days accumulated precipitation ≥250 mm) mainly appeared in the central and northern section of Henan Province and the southern section of Hebei Province (Figure 1A). The heavy precipitation area was mainly orientated in the South-North direction, with two rainfall centers of above 600 mm embedded in it. Temporal variation of the area (within Henan Province) averaged hourly precipitation (Figure 1B) showed that, the “21.7” TRE could be divided into three stages roughly: 1) the earlier stage (0000 UTC 17–0000 UTC 19 July 2021), 2) the second stage (0000 UTC 19–0000 UTC 21 July 2021), and 3) the last stage (0000 UTC 21–2300 UTC 22 July 2021). Yin et al. (2022) had investigated the rainfall during the second and last stages, and thus the present study mainly focused on the earlier stage.
During the earlier stage of the “21.7” TRE, rainfall within Henan Province changed notably in intensity (Figure 1B), with an hourly precipitation of ∼70 mm appeared in 0600 UTC 17 July (Supplementary Figure S1A) and an hourly precipitation of ∼75 mm appeared in 1100 UTC 18 July (Supplementary Figure S1B). As the gray circles in Figure 1A show, the mesoscale vortex was closely related to the heavy precipitation in Henan Province. According to CMA, the rainfall with an intensity of no less than 20 mm h−1 is referred to as the short-duration heavy precipitation. Regarding this criterion, even if we used the area averaged hourly precipitation within Henan, a total of 14 h during the earlier stage (∼29.2% in proportion) was found to satisfy the standard of short-duration heavy precipitation. This means the rainfall was intense within the whole Henan Province in this stage.
3.2 Synoptical Analysis
From Figure 2, in the earlier stage of the “21.7” TRE, at 200 hPa, Henan Province was mainly located East of the South Asia high, where was dominated by divergence. The upper-level divergence was conducive to ascending motions, which favored the occurrence and maintenance of heavy rainfall. During this stage, East of Henan Province, there was a strong extratropical cyclone. As the cyclone moved northwestward with time, it began to directly affect Henan Province from 0000 UTC 17 July 2021 on (Figure 2C). Strong northerly wind in the western section of the cyclone steered relatively cold air from regions of higher latitudes to the upper troposphere over Henan Province, which increased the instability of the atmosphere. This was another favorable condition for the heavy rainfall within/around Henan Province. In addition, during the earlier stage, the upper-level jet mainly appeared in the regions North and northeast of Henan Province, which exerted slight effects on the heavy rainfall within this region.
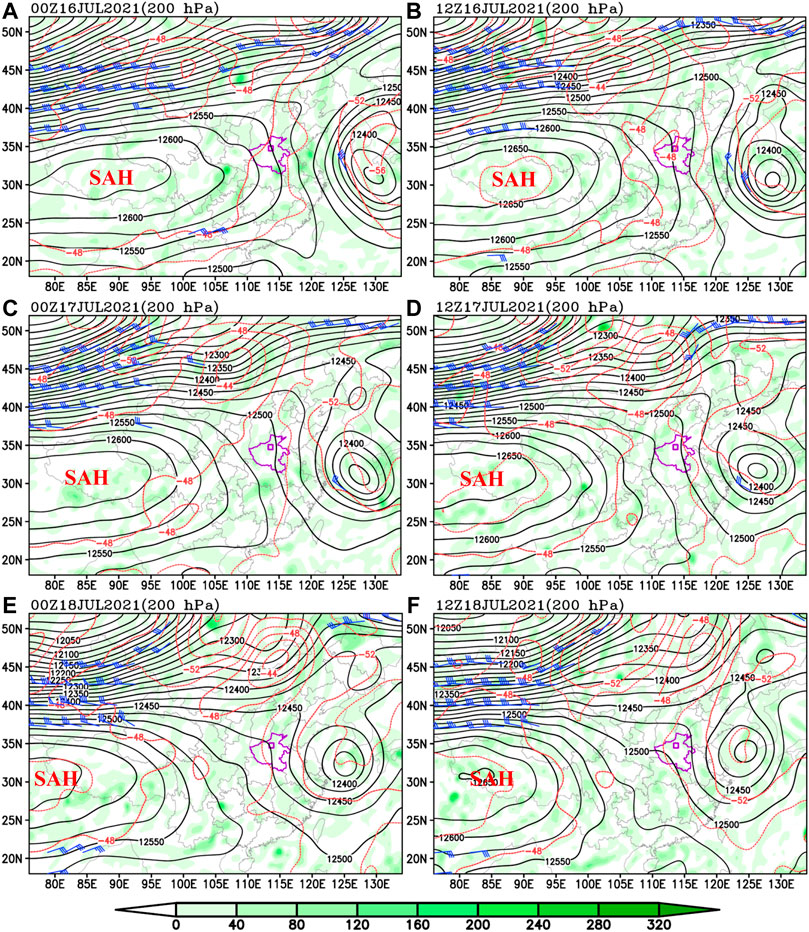
FIGURE 2. Divergence (shading, units: 10−6 s−1), geopotential height (black solid lines, units: gpm), temperature (red lines, units: °C), and strong winds (above 30 m s−1; a full bar represents 10 m s−1) at 200 hPa, where the small purple box marks the location of Zhengzhou. SAH, South Asia high.
As Figure 3 shows, in the zonal band of 35–50ʺN, a shortwave trough moved eastward with time and enhanced in intensity. Southwest of this trough, there was a high-pressure system, which first increased in size from 0000 UTC 16 to 0000 UTC 17 July 2021, and then kept a large range in the reminder of the earlier stage. A relay transport of relatively cold air (from the higher latitudes to lower latitudes) by the northwesterly wind in the western section of the trough and the southerly wind in the eastern section of the high-pressure system was favorable for the heavy rainfall in Henan Province. A low-pressure center with warm advection controlled Henan Province from 0000 UTC 16 to 0000 UTC 18 July 2021, which provided favorable dynamical (the low-pressure center favored ascending motions) and thermodynamical conditions (warm advection contributed to pressure lowering in the lower troposphere) for heavy rainfall. Corresponding to the 200-hPa northwestward moving cyclone (Figure 2), a 500-hPa closed low center East of Henan Province also moved northwestward (Figures 3A–D). It contributed to moisture transport to Henan Province (not shown), which acted as another favorable condition for precipitation within this region.
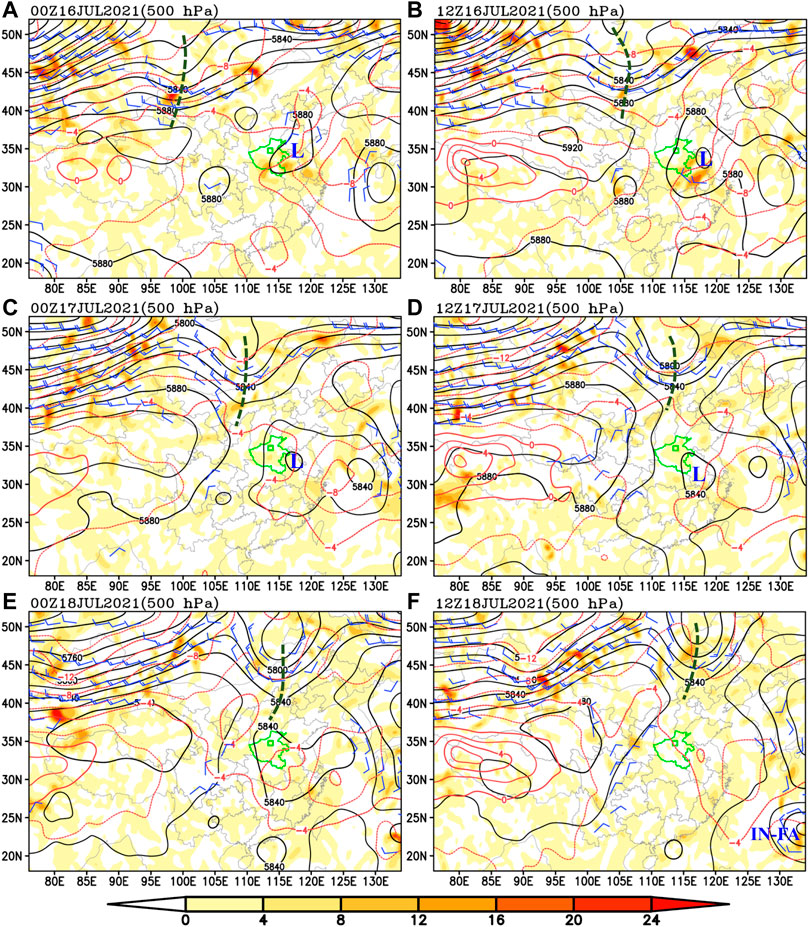
FIGURE 3. Temperature advection (shading, units: 10−5 K s−1), geopotential height (black solid lines, units: gpm), temperature (red lines, units: °C), and strong winds (above 10 m s−1; a full bar represents 10 m s−1) at 500 hPa, where the small purple box marks the location of Zhengzhou, “L” means low-pressure center, and the thick dashed line represents the trough line.
4 Variations of the Mesoscale Vortex
As Figure 4A shows, a mesoscale vortex formed around the northeastern section of Henan Province at 0200 UTC 16 July 2021, with a strong positive vorticity (≥10−4 s−1) center appeared in its central region, and strong winds (≥8 m s−1) appeared in the areas South and East of it. At this time, rainfall within Henan was relatively weak, with intense convective activities mainly occurred in the regions South and southeast of the vortex (Figure 5A). After formation, the mesoscale vortex kept a quasi-stationary behavior and intensified rapidly from 0200 UTC 16 to 0000 UTC 17 July 2021 (Figures 4A–E). This period was defined as the developing period (DVP) of the vortex, during which strong convective activities associated with the mesoscale vortex mainly appeared in its southeastern section and the regions South/East of the vortex (Figures 5A–D). During the DVP, rainfall was heavy in Hubei Province, Jiangsu Province and Anhui Province (Supplementary Figure S2).
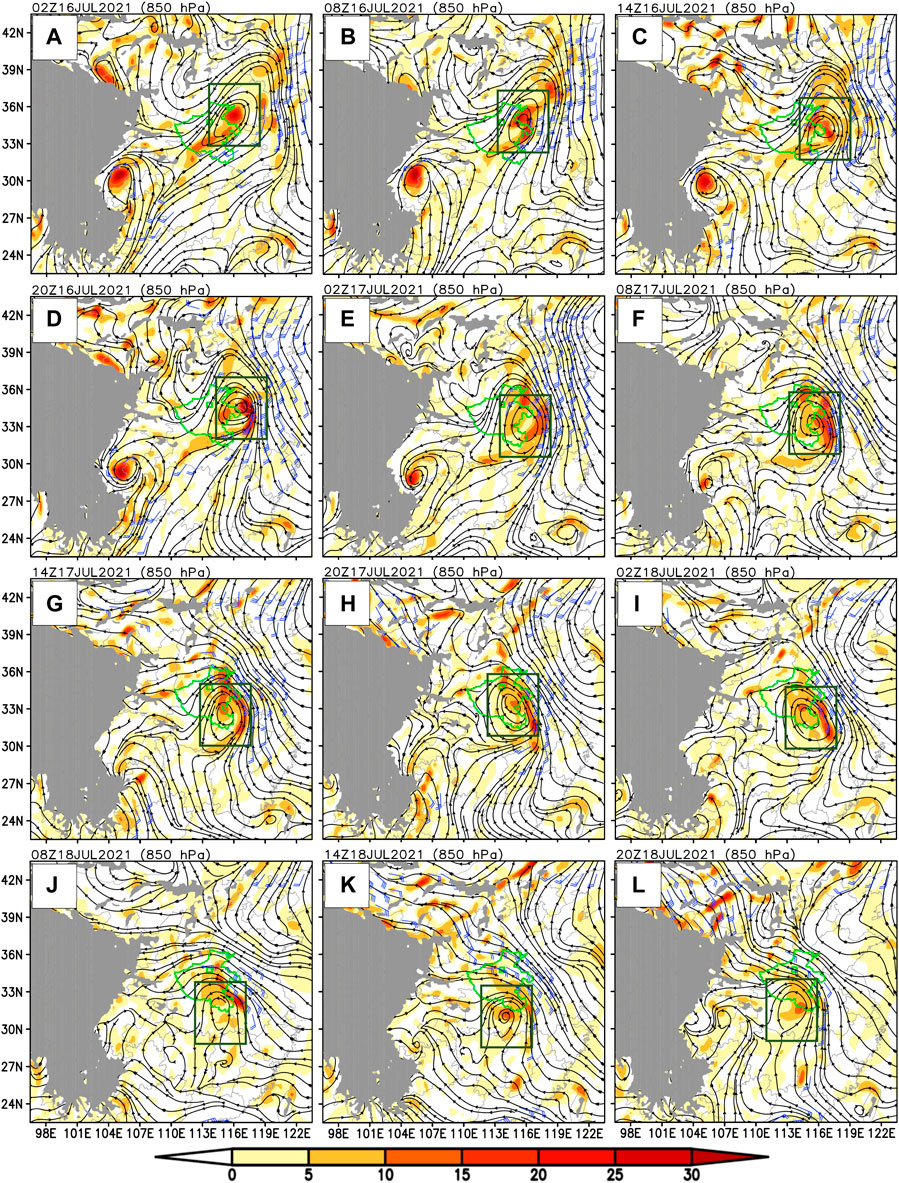
FIGURE 4. Stream field (black lines with arrows), relative vorticity (shading, 10−5 s−1), and wind with speed above 8 m s−1 (a full bar represents 4 m s−1), where gray shading shows terrain above 1,500 m, green map shows the Henan Province, small green box marks the location of Zhengzhou, and the box green boxes outline the main body of the vortex.
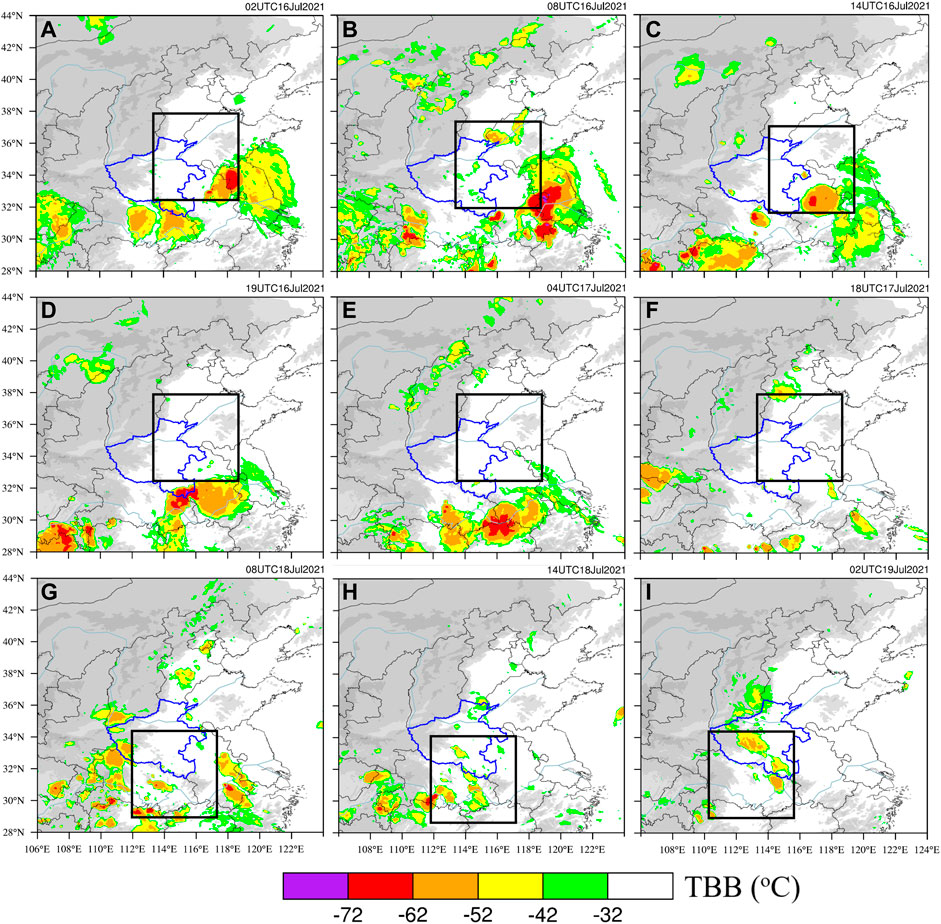
FIGURE 5. TBB (shading, units: °C) during typical stages of the vortex, where the gray shading represents terrain and the black boxes outline the main body of the vortex.
The mesoscale vortex maintained a strong intensity and moved southwestward slowly (Figures 4E–J) in the period from 0000 UTC 17 to 1200 UTC 18 July 2021. This period was defined as the maintaining period (MTP) of the vortex, during which convective activities (Figures 5E–H) and precipitation (Figure 6) enhanced gradually within Henan Province. In the MTP, the most intense hourly precipitation (above 50 mm h−1) occurred at 1100 UTC 18 July 2021 (Figure 6L), which appeared in the spiral rainband North of the mesoscale vortex. The strong southeasterly wind around the northeastern section of the mesoscale vortex (Figures 4J,K) acted as a key factor for the strong hourly precipitation, as it produced strong lower-level convergence (Supplementary Figure S3) when it approached the mountain northwest of Henan Province (Figure 6L).
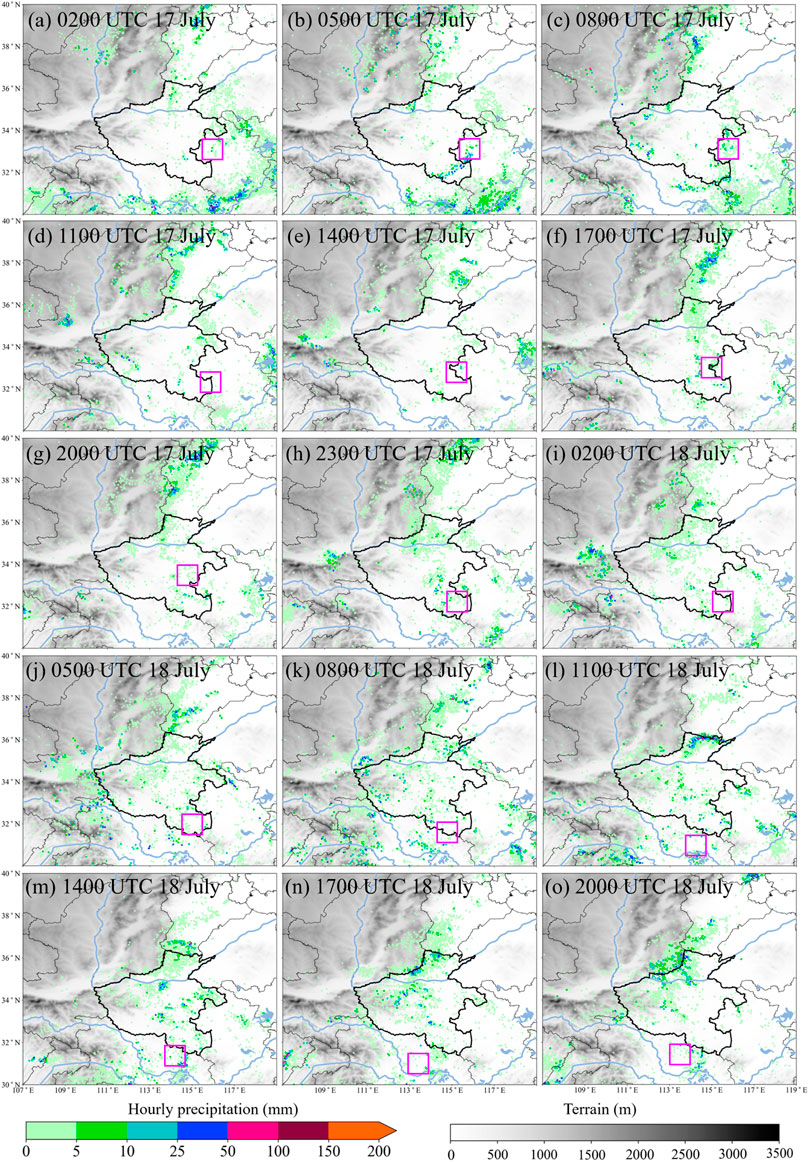
FIGURE 6. Hourly precipitation (shading dots; mm) within/around Henan during the early stage of the “21.7” TRE, where shading is terrain and the small purple boxes mark the mesoscale vortex’s center.
The period from 1200 UTC 18 to 0200 UTC 19 July was defined as the weakening period (WKP) of the mesoscale vortex, as the intensity of the vortex weakened with time (Figures 4K–L) and finally dissipated. During the WKP, the vortex maintained a quasi-stationary behavior. Convective activities associated with the vortex weakened (Figures 5H,I), with relatively strong convection mainly appeared in its central region. Precipitation in Henan Province also weakened (Figures 6N,O), with strong precipitation mainly occurred in its northern section. In the WKP, strong southeasterly wind associated with the mesoscale vortex controlled the northern section of Henan Province (Figures 4K–L), which produced intense lower-level convergence as it approached the mountain. This was a favorable condition for the maintenance of rainfall.
5 Mechanisms Governing the Variation of the Mesoscale Vortex
In order to explore the mechanisms governing the rapid development and long-time maintenance of the mesoscale vortex, Eq. 1 was first calculated by using the hourly 0.25° × 0.25° ERA5 reanalysis data, and then averaged within the central region of the vortex (i.e., the 5.5° × 5.5° green box shown in Figure 4). The results are shown in Figure 7. Before detailed analysis, we first compared term TOT with term LTD (Figures 7A,B). It is shown that, the two terms show notably similar features in intensity, temporal variation, and vertical distribution. This means that, after neglecting the friction, the balance of the vorticity budget equation was generally good, and thus the budget results can be used for further analyses.
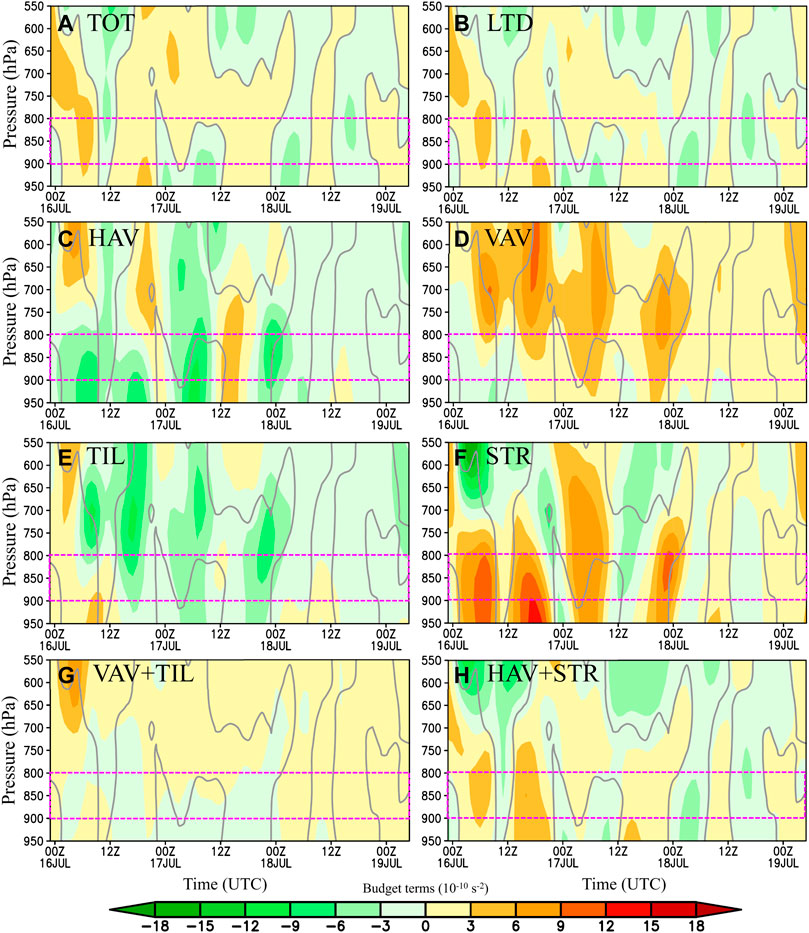
FIGURE 7. Area-averaged (within the main body of the vortex) vorticity budget terms: TOT (A), LTD (B), HAV (C), VAV (D), TIL (E), STR (F), VAV + TIL (G), and HAV + STR (H), where the purple dashed lines outline the central level of the vortex and the thick gray contour is the zero contour of term TOT. LTD, local time derivative.
5.1 Mechanisms Governing the Vortex’s Development
During the DVP (from 0200 UTC 16 to 0000 UTC 17 July 2021), the mesoscale vortex intensified rapidly, which can be reflected by the increasing cyclonic vorticity within its central region (Figure 8A). The rapid enhancement can also be confirmed by the notable positive TOT in this period (Figure 7A). The comparison among all five budget terms of Eq. 1 shows that, term STR was the dominant term for the vortex’s rapid development (Figure 7F). This was mainly due to the strong convergence around 850 hPa (Figure 8B), which produced cyclonic vorticity through vertical stretching (Fu et al., 2017). Term VAV acted as the second dominant factor (Figure 7D), particularly for the upper layer of the vortex. As cyclonic vorticity (Figure 8A) and ascending motions (Figure 8C) controlled the central region of the mesoscale vortex, positive VAV means that upward transport of cyclonic vorticity.
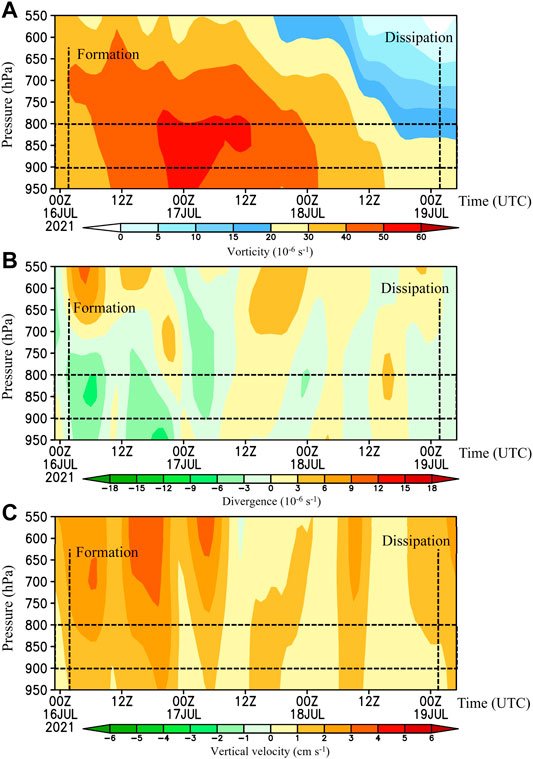
FIGURE 8. Area-averaged (within the main body of the vortex) vorticity (A), divergence (B), and vertical velocity (C), where the black dashed lines outline the central level of the vortex and its formation and dissipation time.
Term TIL exerted an overall negative effect that decelerated the mesoscale-vortex’s development during the DVP (Figure 7E), although it acted as a favorable factor for the development before 1400 UTC 16 July. The change of the TIL’s effect was mainly due to the notable changes in convection activities (which can reflect vertical motions; Figures 5A–D), as the horizontal vorticity vector (which can be reflected by vertical shear) changed slowly during this period (not show). Term HAV, which denotes the effect of horizontal transport of vorticity, was the most detrimental factor for the mesoscale-vortex’s development. As Figure 7C shows, except for the short period of 2200 UTC 16–0000 UTC 17 July, this term kept a strong negative value around 850 hPa. This was mainly due to the export transport of cyclonic vorticity from the central region of the mesoscale vortex and the import transport of anticyclonic vorticity into the central region. The former was mainly accomplished by the northeasterly wind in the northwestern section of the vortex and the southwesterly wind in the southeastern section (Figure 9A), and the latter was mainly due to the northwesterly wind around the southwestern section.
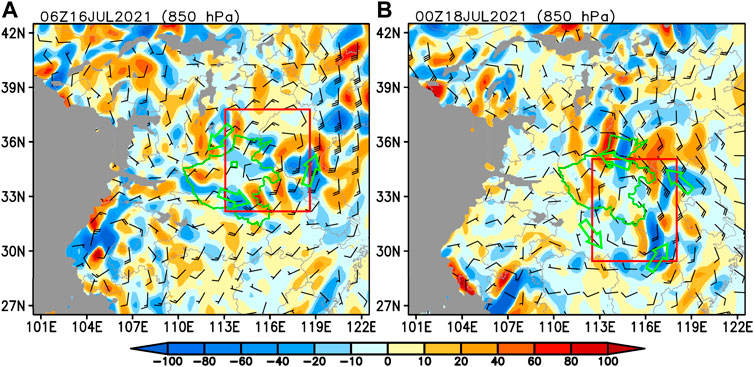
FIGURE 9. Term HAV (shading, units: 10−10 s−2) and wind field at 850 hPa (a full bar represents 4 m s−1), where the red box outlines the main body of the vortex, and the big open green vector mark the key transport of vorticity that resulted in a negative HAV.
The sum of terms VAV and TIL represents the total effect of vertical factors, and the sum of terms HAV and STR denotes the overall effect of horizontal factors. Comparison between VAV + TIL and HAV + STR shows that, during the DVP, the vertical factors mainly exerted a neutral effect on the mesoscale-vortex’s development (Figure 7G), whereas the horizontal factors acted as a dominant factor for the development. In contrast, for the levels above 800 hPa (over the mesoscale vortex), the vertical factors mainly showed a positive effect for enhancing cyclonic vorticity, whereas the horizontal factors mainly acted in an opposite way.
5.2 Mechanisms Governing the Vortex’s Maintenance
During the MTP (from 0000 UTC 17 to 1200 UTC 18 July 2021), the mesoscale vortex moved slowly southwestward (Figures 4E–K), and weakened gradually in intensity (Figure 8A). From Figure 7A, around 850 hPa, positive and negative TOT alternatively dominated the central region of the mesoscale vortex, with the negative TOT showing a stronger intensity (this explained the vortex’s slow weakening). Term STR was a dominant factor for maintaining the mesoscale-vortex’s intensity (Figure 7F), as convergence was overall notable around 850 hPa (Figure 8B), which produced cyclonic vorticity through vertical stretching. Term VAV was another dominant factor for sustaining the vortex, as ascending motions (Figure 8C) consistently transported cyclonic vorticity upward to the layer of the vortex (i.e., 900–850 hPa). Terms HAV and TIL exerted negative effects (of similar intensity) on the maintenance of the mesoscale vortex (Figures 7C,E). The former was mainly due to the export transport of cyclonic vorticity across the western section of the northern boundary line of the central region (Figure 9B), and import transport of anticyclonic vorticity across the southern section of the western boundary line, the eastern section of the southern boundary line and the northern section of the eastern boundary line. The latter was mainly due to the tilting from horizontal vorticity vector to anticyclonic vorticity (Figure 7E).
Overall, during the MTS, the vertical factors were detrimental for the mesoscale-vortex’s sustainment from 0000 UTC 17 to 0000 UTC 18 July (Figure 7G), and then they acted in an opposite manner. This change was mainly due to the changes in ascending motions (not shown), which both affects the vertical transport and tilting effect. The horizontal factors changed their effects alternatively during the MTS, which resulted in a net negative effect (Figure 7H). Compared to those in the DVP, the vertical factors changed little in intensity, whereas the horizontal factors weakened notably in intensity. This corresponded to the slow weakening of the vortex.
5.3 Backward Trajectory Analysis
As described in Section 2.3, a backward trajectory analysis was conducted to explore key features during the formation of the mesoscale vortex. A total of 529 air particles (at 850 hPa) within the central region of the vortex was used in the backward tracking, which was initiated at 0200 UTC 16 July 2021 when the mesoscale vortex formed, and was ended at 0000 UTC 15 July 2021. From Figure 10A, it is clear that, all the air particles that formed the mesoscale vortex came from the height below 3,000 m. This means that the processes in the lower troposphere were of great importance for the vortex’s formation. We calculated the proportion of the air particles that sourced from the levels below 1,500 m (i.e., the mean height of 850 hPa), and found that these air particles accounted for ∼81.5%. The reminding ∼18.5% of the air particles came from levels above 1,500 m. As shown in Figure 10B, most of the air particles that formed the mesoscale vortex came from the regions South of its central region (∼63.7%). The air particles sourced from the central region accounted for the smallest proportion (∼14.9%) and those came from the regions North of the central region ranked second (21.4%). This means that the processes in the lower latitudes were of great importance for the vortex’s formation.
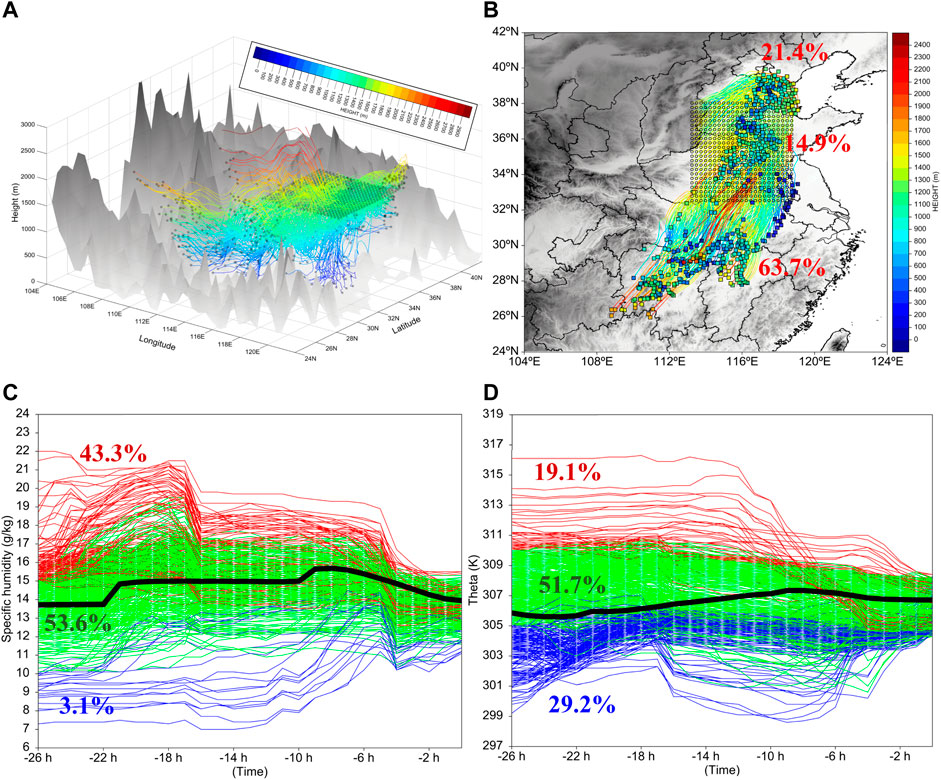
FIGURE 10. Panel (A) shows the three-dimensional backward trajectories associated with the 529 dots within the main body of the vortex. Panel (B) shows the height variations along the 529 backward trajectories, where the percentage represents the proportion of the air particles sourced from the regions South of, within and North of the vortex’s main body. Panel (C) shows the variations of specific humidity along the 529 backward trajectories, where blue means the initial specific humidity was below 10 g kg−1, green means the initial value was between 10 and 15 g kg−1, and red means the initial value was above 15 g kg−1, with corresponding colored values showing its contribution. The thick black line shows the mean of all 529 trajectories. Panel (D) shows the variations of potential temperature along the 529 backward trajectories, where blue means the initial potential temperature was below 305 K, green means the initial value was between 305 and 310 K, and red means the initial value was above 310 K, with corresponding colored values showing its contribution. The thick black line shows the mean of all 529 trajectories.
According to the value of specific humidity at 0000 UTC 15 July 2021, we divided the air particles into three groups: the dry group (initial specific humidity was below 10 g kg−1), the moderate group (initial specific humidity was between 10 and 15 g kg−1), and the moist group (initial specific humidity was above 15 g kg−1). For the dry group (∼3.1% in proportion), it mainly gained moisture (as specific humidity increased) from −26 to −5 h (Figure 10C), and then its specific humidity reduced rapidly from −5 to −4 h due to rainfall. After that, its specific humidity increased gradually due to evaporation of precipitation. For the moderate group (∼53.6% in proportion), it first increased in specific humidity from −26 to −17 h (Figure 10C), and then from −17 to −16 h it decreased in specific humidity rapidly due to precipitation. From −16 to −5 h, its specific humidity changed little, then from −5 to −4 h rainfall appeared again which reduced the specific humidity rapidly, and after that, specific humidity changed little from −4 to 0 h. For the moist group (∼43.3% in proportion), it experienced similar changes to those of the moderate group from −26 to −4 h (Figure 10C), whereas, during the period from −4 to 0 h, it mainly decreased in specific humidity. Overall, the dry group mainly experienced one heavy rainfall event (i.e., from −5 to −4 h), whereas the other two groups experienced two heavy rainfall events (i.e., from −17 to −16 h and from −5 to −4 h). The sum of all three groups of air particles mainly gained moisture (due to evaporation) from −26 to −8 h (black thick line in Figure 10C), and lose moisture (due to precipitation) from −8 to 0 h. The precipitation from −8 to 0 h was conducive to the formation of the mesoscale vortex, as the associated latent heat release enhanced the lower-level convergence and ascending motions, which increased the cyclonic vorticity within the central region through vertical stretching and vertical transport.
Similar as the above, according to potential temperature at 0000 UTC 15 July 2021, we divided the air particles into three groups: the cold group (initial potential temperature was below 305 K), the middle group (initial potential temperature was between 305 and 310 K), and the warm group (initial potential temperature was above 310 K). From Figure 10D, it is clear that, the three groups of air particles showed notably different changes from −26 to 0 h. Overall, the middle group (51.7% in proportion) changed little in potential temperature, the warm group (19.1% in proportion) decreased in potential temperature, and the cold group (29.2% in proportion) increased in potential temperature. At 0 h, the differences of potential temperature of all three groups of air particles reduced sharply compared to those at the initial time (i.e., −26 h), which means the mesoscale vortex showed a relatively homogeneous thermodynamical structure. As the black thick line in Figure 10D shows, from −26 to −8 h, the sum of all three groups of air particles mainly increased in potential temperature, whereas after that, it decreased in potential temperature slowly.
6 Conclusion and Discussion
From 17 to 22 July 2021, the “21.7” Henan TRE lasted for 6 days and broke a series of historical records, which rendered serious economic losses and heavy casualties. The “21.7” TRE could be roughly divided into three different stages, during which the precipitation features and dominant weather systems were notably different. This study mainly focused on the development and maintenance mechanisms of a long-lived (72 h) quasi-stationary mesoscale vortex that governed the earlier stage of the “21.7” TRE. Synoptic analysis indicates that the mesoscale vortex formed and maintained in a favorable environment: in the upper troposphere, the divergence associated with the South Asia high contributed to ascending motions, and the cold temperature advection due to the northerly wind West of a northwestward moving extratropical cyclone increased the instability of the atmosphere, both of which contributed to the mesoscale-vortex’s formation/sustainment. In the middle troposphere, the relay transport of relatively cold air from the higher latitudes to lower latitudes, as well as the low-pressure center with warm advection over Henan Province provided favorable dynamical and thermodynamical conditions for heavy rainfall, which released notable latent heat that contributed to the mesoscale-vortex’s formation/sustainment. Vorticity budget within the mesoscale-vortex’s central region shows that, term STR was the dominant term for the vortex’s rapid development and long-time maintenance. This was mainly due to the strong lower-level convergence, which produced cyclonic vorticity through vertical stretching. Term VAV acted as the second dominant factor, particularly for the upper layer of the vortex. This was mainly due to the upward transport (from lower to higher levels) of cyclonic vorticity by ascending motions. In contrast, Terms HAV and TIL mainly decelerated the mesoscale-vortex’s development/maintenance through importing/exporting anticyclonic/cyclonic vorticity into/from its central region and tilting effects. Overall, the horizontal factors dominated the mesoscale-vortex’s development/maintenance, whereas, the vertical factors mainly exerted a neutral effect. Backward trajectory analysis denoted that the air particles which formed the mesoscale vortex mainly came from the levels below 1,500 m, within the regions in lower latitudes. The air particles that formed the mesoscale vortex experienced notable precipitation before the vortex’s formation. This was conducive to its formation, as the associated latent heat release enhanced the lower-level convergence and ascending motions, which increased the cyclonic vorticity within the central region through vertical stretching and vertical transport. Moreover, the air particles that formed the mesoscale vortex first showed notable difference in potential temperature, and then this difference reduced sharply when the mesoscale vortex formed, implying that the vortex showed a relatively homogeneous thermodynamical structure.
Mesoscale vortices are one of the most important types of systems that induce TREs not only in China but also in the whole world (Menard and Fritsch, 1989; Neu et al., 2013; Evans et al., 2014; Fu et al., 2020; Fu et al., 2021). Through analyzing the long-lived mesoscale vortex during the earlier stage of the “21.7” TRE, this study had added a typical case to this research field. Although the results had shown some key features of the vortex, the present study did not directly investigate how the vortex interact with the heavy rainfall. Therefore, in order to render a more thorough understanding of the “21.7” TRE, numerical simulations, terrain-related analyses, and latent-heat-related sensitivity experiments should be conducted in a future work.
Data Availability Statement
The datasets presented in this study can be found in online repositories. The names of the repository/repositories and accession number(s) can be found below: https://www.ecmwf.int/en/forecasts/datasets/reanalysis-datasets/era5, http://satellite.nsmc.org.cn/PortalSite/Data/Satellite.aspx.
Author Contributions
WL and HH designed the research. WL, HM, RF, HH, and XW performed the research. WL, HM, and RF wrote the manuscript. All the authors contributed to the article and approved the submitted version.
Funding
This research was supported by the National Natural Science Foundation of China (Grant No. 42075002), and Key scientific research project of China Meteorological Administration Training Center (Grant No. 2021-011).
Conflict of Interest
Author HM is employed by the Beijing Goldwind Smart Energy Technology Co., Ltd. author HH is employed by the Emergency Management Center, State Grid Shandong Electric Power Company.
The remaining authors declare that the research was conducted in the absence of any commercial or financial relationships that could be construed as a potential conflict of interest.
Publisher’s Note
All claims expressed in this article are solely those of the authors and do not necessarily represent those of their affiliated organizations, or those of the publisher, the editors and the reviewers. Any product that may be evaluated in this article, or claim that may be made by its manufacturer, is not guaranteed or endorsed by the publisher.
Supplementary Material
The Supplementary Material for this article can be found online at: https://www.frontiersin.org/articles/10.3389/feart.2022.909662/full#supplementary-material
References
Evans, C., Weisman, M. L., and Bosart, L. F. (2014). Development of an Intense, Warm-Core Mesoscale Vortex Associated with the 8 May 2009 "Super Derecho" Convective Event*. J. Atmos. Sci. 71, 1218–1240. doi:10.1175/jas-d-13-0167.1
Feng, S.-L., Jin, S.-L., Fu, S.-M., Sun, J.-H., and Zhang, Y.-C. (2019). Formation of a Kind of Heavy-Rain-Producing Mesoscale Vortex Around the Sichuan Basin: an Along-Track Vorticity Budget Analysis. Atmos. Sci. Lett. 2019, e949. doi:10.1002/asl2.949
Fu, S.-M., Mai, Z., Sun, J.-H., Li, W.-L., Ding, Y., and Wang, Y.-Q. (2019). Impacts of Convective Activity over the Tibetan Plateau on Plateau Vortex, Southwest Vortex, and Downstream Precipitation. J. Atmos. Sci. 76, 3803–3830. doi:10.1175/jas-d-18-0331.1
Fu, S.-M., Sun, J.-H., Luo, Y.-L., and Zhang, Y.-C. (2017). Formation of Long-Lived Summertime Mesoscale Vortices over Central East China:Semi-Idealized Simulations Based on a 14-Year Vortex Statistic. J. Atmos. Sci. 74, 3955–3979. doi:10.1175/jas-d-16-0328.1
Fu, S.-M., Tang, H., Sun, J.-H., Zhao, T.-B., and Li, W.-L. (2021). Historical Rankings and Vortices’ Activities of the Extreme Mei-Yu Seasons: Contrast 2020 to Previous Mei-Yu Seasons. Geophys. Res. Lett. 49, e2021GL096590. doi:10.1029/2021gl096590
Fu, S.-M., Zhang, J.-P., Sun, J.-H., and Zhao, T.-B. (2016). Composite Analysis of Long-Lived Mesoscale Vortices over the Middle Reaches of the Yangtze River Valley: Octant Features and Evolution Mechanisms. J. Clim. 29, 761–781. doi:10.1175/jcli-d-15-0175.1
Fu, S.-M., Zhang, J.-P., Tang, H., Jiang, L.-Z., and Sun, J.-H. (2020). A New Mesoscale-Vortex Identification Metric: Restricted Vorticity and its Application. Environ. Res. Lett. 15, 124053. doi:10.1088/1748-9326/abcac6
Fu, S., Li, W., Sun, J., Zhang, J., and Zhang, Y. (2015). Universal Evolution Mechanisms and Energy Conversion Characteristics of Long-Lived Mesoscale Vortices over the Sichuan Basin. Atmos. Sci. Lett. 16, 127–134. doi:10.1002/asl2.533
Fu, S., Yu, F., Wang, D., and Xia, R. (2013). A Comparison of Two Kinds of Eastward-Moving Mesoscale Vortices during the Mei-Yu Period of 2010. Sci. China Earth Sci. 56, 282–300. doi:10.1007/s11430-012-4420-5
Hersbach, H., Bell, B., Berrisford, P., Hirahara, S., Horányi, A., Muñoz-Sabater, J., et al. (2020). The ERA5 Global Reanalysis. Quart. J. Roy. Meteor. Soc. 146, 1999–2049. doi:10.1002/qj.3803
IPCC (2014). Climate Change 2014: Synthesis Report. Contribution of Working Groups I, II and III to the Fifth Assessment Report of the Intergovernmental Panel on Climate Change. Geneva, Switzerland, 151.
James, E. P., and Johnson, R. H. (2010). Patterns of Precipitation and Mesolow Evolution in Midlatitude Mesoscale Convective Vortices. Mon. Wea. Rev. 138, 909–931. doi:10.1175/2009mwr3076.1
Kirk, J. R. (2003). Comparing the Dynamical Development of Two Mesoscale Convective Vortices. Mon. Wea. Rev. 131, 862–890. doi:10.1175/1520-0493(2003)131<0862:ctddot>2.0.co;2
Luo, Y., Sun, J., Li, Y., Xia, R., Du, Y., Yang, S., et al. (2020). Science and Prediction of Heavy Rainfall over China: Research Progress since the Reform and Opening-Up of New China. J. Meteorol. Res. 34, 427–459. doi:10.1007/s13351-020-0006-x
Menard, R. D., and Fritsch, J. M. (1989). A Mesoscale Convective Complex-Generated Inertially Stable Warm Core Vortex. Mon. Wea. Rev. 117, 1237–1261. doi:10.1175/1520-0493(1989)117<1237:amccgi>2.0.co;2
Neu, U., Akperov, M. G., Bellenbaum, N., Benestad, R., Blender, R., Caballero, R., et al. (2013). IMILAST: A Community Effort to Intercompare Extratropical Cyclone Detection and Tracking Algorithms. Bull. Amer. Meteor. Soc. 94, 529–547. doi:10.1175/bams-d-11-00154.1
Ni, C., Li, G., and Xiong, X. (2017). Analysis of a Vortex Precipitation Event over Southwest China Using AIRS and In Situ Measurements. Adv. Atmos. Sci. 34, 559–570. doi:10.1007/s00376-016-5262-4
Nie, Y., and Sun, J. (2022). Moisture Sources and Transport for Extreme Precipitation over Henan in July 2021. Geophys. Res. Lett. 49, e2021GL097446. doi:10.1029/2021gl097446
Nielsen, E. R., and Schumacher, R. S. (2018). Dynamical Insights into Extreme Short-Term Precipitation Associated with Supercells and Mesovortices. J. Atmos. Sci. 75 (9), 2983–3009. doi:10.1175/jas-d-17-0385.1
Song, L. C. (2018). Yearbook of Meteorological Disasters in China. Beijing: China Meteorological Press, 229.
Stein, A. F., Draxler, R. R., Rolph, G. D., Stunder, B. J. B., Cohen, M. D., and Ngan, F. (2015). NOAA's HYSPLIT Atmospheric Transport and Dispersion Modeling System. Bull. Amer. Meteor. Soc. 96, 2059–2077. doi:10.1175/bams-d-14-00110.1
Sun, J., Zhang, Y., Liu, R., Fu, S., and Tian, F. (2019). A Review of Research on Warm-Sector Heavy Rainfall in China. Adv. Atmos. Sci. 36, 1299–1307. doi:10.1007/s00376-019-9021-1
Yin, J., Gu, H., Liang, X., Yu, M., Sun, J., Xie, Y., et al. (2022). A Possible Dynamic Mechanism for Rapid Production of the Extreme Hourly Rainfall in Zhengzhou City on 20 July 2021. J. Meteorol. Res. 36, 6–25. doi:10.1007/s13351-022-1166-7
Zhang, D.-L. (1992). The Formation of a Cooling-Induced Mesovortex in the Trailing Stratiform Region of a Midlatitude Squall Line. Mon. Wea. Rev. 120, 2763–2785. doi:10.1175/1520-0493(1992)120<2763:tfoaci>2.0.co;2
Zhang, J.-P., Fu, S.-M., Sun, J.-H., Shen, X.-Y., and Zhang, Y.-C. (2015). A Statistical and Compositional Study on the Two Types of Mesoscale Vortices over the Yangtze River Basin. Clim. Environ. Res. 20, 319–336. doi:10.3878/j.issn.1006-9585.2015.14164
Zhang, Y. C., Fu, S. M., Sun, J. H., Fu, R., Jin, S. L., and Ji, D. S. (20192019). A 14‐year Statistics‐based Semi‐idealized Modeling Study on the Formation of a Type of Heavy Rain-Producing Southwest Vortex. Atmos. Sci. Lett. 20, e894. doi:10.1002/asl.894
Keywords: torrential rainfall, mesoscale vortex, vorticity budget, Henan Province, extratropical cyclone
Citation: Li W, Ma H, Fu R, Han H and Wang X (2022) Development and Maintenance Mechanisms of a Long-Lived Mesoscale Vortex Which Governed the Earlier Stage of the “21.7” Henan Torrential Rainfall Event. Front. Earth Sci. 10:909662. doi: 10.3389/feart.2022.909662
Received: 31 March 2022; Accepted: 16 May 2022;
Published: 09 June 2022.
Edited by:
Wei Zhang, Utah State University, United StatesReviewed by:
Tao Gao, Institute of Atmospheric Physics (CAS), ChinaChenghai Wang, Lanzhou University, China
Copyright © 2022 Li, Ma, Fu, Han and Wang. This is an open-access article distributed under the terms of the Creative Commons Attribution License (CC BY). The use, distribution or reproduction in other forums is permitted, provided the original author(s) and the copyright owner(s) are credited and that the original publication in this journal is cited, in accordance with accepted academic practice. No use, distribution or reproduction is permitted which does not comply with these terms.
*Correspondence: Wanli Li, bGl3bEBjbWEuZ292LmNu; Hong Han, aGhkaDI2MDhAMTYzLmNvbQ==
 Wanli Li
 Hui Ma2