 Heyu Yu
 Xiaolei Liu
 Yang Lu1,2
- 1Shandong Provincial Key Laboratory of Marine Environment and Geological Engineering, Ocean University of China, Qingdao, China
- 2Key Laboratory of Marine Environment and Ecology, Ministry of Education, Qingdao, China
- 3Laboratory for Marine Geology, Qingdao National Laboratory for Marine Science and Technology, Qingdao, China
The sloping silty sediments in estuarine deltas are frequently affected by extreme storms, and they are prone to liquefaction instability. The unstable liquefied sediments of the slopes can subsequently form a sediment gravity flow (SGF), which can seriously endanger offshore engineering facilities. To better understand the characteristics and mechanism of wave-induced liquefied sediment gravity flow (WILSGF), a flume experiment was conducted to reproduce the formation, movement, and deposition processes of the WILSGF and analyze their controlling factors using natural silty sediment samples collected from the Yellow River Delta in China. The results show that the mass of the WILSGF comes from the sediment in the liquefied layer, and the movement of the WILSGF in these experiments was significantly affected by the wave orbital velocity and the relative outflow position. At the initial stage of the formation of the WILSGF, the phase and amplitude of the WILSGF were the same as those of waves, and the maximum velocity of the WILSGF reached 2.39 cm/s. The velocity of the WILSGF decreased continuously with the downward evolution of the liquefaction interface. When the liquefaction depth reached its maximum value, there was no WILSGF. We also found that the median particle size of the WILSGF was greater than that of the original seabed due to wave-induced seabed coarsening and the intrusion of ambient water. This study has guiding significance for in-depth understanding and prediction of the geological hazards caused by WILSGF.
Introduction
Sediment gravity flow (SGF) is a flow type of sediments or sediment-fluid mixtures under the action of gravity (Middleton and Hampton, 1973). As one of the main dynamic processes of the seaward transport of sediment, the SGF has a profound impact on the morphological evolution of continental shelves (Traykovski et al., 2000; Wright et al., 2001; Jaramillo et al., 2009; Macquaker et al., 2010; Plint, 2014; Harazim and Mcilroy, 2015), and it has led to great threats to marine engineering facilities (e.g., platforms, oil and gas pipelines, power and telecommunications cables) (Carter et al., 2014; Guo et al., 2022). The dynamic characteristics (propagation, velocity, distance, etc.) of different types of gravity flow vary considerably, as do their depositional characteristics, making this topic a complex and cutting-edge problem of multidisciplinary interests.
The triggering factors of SGF are complex, and they include earthquakes, storm waves, rapid accumulation of sediment, and submarine volcanoes (Heezen and Ewing 1952; Ma et al., 2010; Prior et al., 1989; Bailey et al., 2021; Anfinson et al., 2016). Among these factors, storm-wave-induced liquefaction could be a special trigger mechanism for the formation of SGF, especially in shallow shelf areas. During frequent extreme storm events, slope sediments are prone to bottom cyclic pressures during the passage of surface waves (Maa and Mehta, 1987), resulting in the formation of excess pore-water pressure inside the seabed sediments (Foda and Tzang, 1994); the effective stress of the sediment will decrease with the increasing excess pore-water pressure (Atigh and Byrne, 2004). When the excess pore-water pressure exceeds the effective stress of the sediment, it will liquefy (Sumer et al., 2006). Such liquefied sediments lose their original strength (Kessel and Kranenburg, 1998), and the liquefied sediments may slide or move under the action of gravity to form SGF (Puig et al., 2004; Piper and Normark, 2009; Wang et al., 2020).
SGF formed by wave-induced liquefaction of slope sediments has been preliminarily recognized in previous studies. For instance, Prior et al. (1989) first observed the phenomenon of submarine landslides during extreme storms on the slope of the subaqueous Yellow River Delta. Through analysis of pore-water pressure data, these submarine landslides were found to be related to wave-induced liquefaction. Kessel et al. (1997) studied the problem of wave-induced liquefaction of sloping seabed sediments through laboratory experiments and measured the rheological properties of the liquefied mud using independent rheological experiments. They considered that if the fluid mud layer produced by liquefaction flowed under the influence of a net force, there would be a very high sediment transportation rate in a short time. Subsequently, using experiments and mathematical flow-model calculations, Kessel and Kranenburg (1998) revealed that the sediment on the slope begins to flow under combined wave and gravity action after liquefaction and that the velocity could reach the cm/s order of magnitude. Xu et al. (2016) studied the formation process of silty bed liquefaction and the subsequent wave-induced liquefied SGF (WILSGF) using physical model experiments, pointing out that such a WILSGF moves along the slope by bed-load transport. In these studies, the formation mechanisms and outflow characteristics of WILSGF have mostly been explained from the perspective of geotechnics. However, the hydrodynamic effects during WILSGF have not been considered, leading to a lack of comprehensive description of their movement processes.
Noticeably, wave action not only causes the liquefaction of a sloping seabed to form SGF but also affects the movement and depositional characteristics of the SGF. It has been demonstrated that cyclic oscillatory currents generated by surface waves determine the movement behavior of highly concentrated SGF (Ng and Fu, 2002). Such cyclic wave oscillations increase the transport and erosion capacity of SGF (Musumeci et al., 2017). The amplitude and phase of SGF are also related to the wave orbital velocity (Robinson et al., 2013). These studies have quantified the effect of wave action on SGF movement from a hydrodynamic perspective. However, the nature of the liquefied sediments that form an SGF (e.g., the dynamics of pore pressure accumulation and dissipation) have been ignored. Evidently, the physical properties of the sources that form the SGF directly influence the movement and depositional characteristics of that SGF. In addition, due to the WILSGF process involving complex physical mechanisms such as seabed sediment phase transformation and large deformation, the numerical simulation method based on soil or fluid constitutive model is difficult to accurately describe the complete WILSGF movement behavior (Wang et al., 2015; Yue et al., 2020). In contrast, the flume experiment has become an effective method to study the WILSGF problem because it can better reproduce the interaction process between real sediments and hydrodynamic forces.
This study aimed to reveal the movement and depositional characteristics of WILSGF by integrating the effects of the properties of the liquefied sediment and wave-generated cyclic oscillatory currents on WILSGF movement and deposition. The whole processes of slope sediment liquefaction, outflow, movement, and deposition were simulated and observed using flume experiments. The relationship between wave orbital velocity and WILSGF velocity, the movement characteristics of the WIFSGF, and the physical properties of the deposits of WILSGF were examined.
Materials and Methods
Experimental Setup and Procedure
The experiments were conducted in a wave flume with a length of 4 m, a width of 0.4 m, and a height of 1 m. Regular waves were generated by a piston-type wave maker at one end of the flume and a wave-dissipating slope was placed at the opposite end (Figure 1). Regular waves with different frequencies and wave heights were obtained by changing the amplitude and frequency of the piston. In the experiments, the wave height was 0.12 m and the wave frequency was 0.5 Hz. A model sediment slop was established in the middle of the flume. This was 1.2 m long, 0.4 m wide, 0.5 m high at the top, and 0.3 m high near the toe. The slope gradient was approximately 9°. The sediment used in the experiments was sampled from the subaqueous Yellow River Delta. The median size (d50) of sediment was 34 μm, and it contained 87.4% silt, and 12.6% clay. This type of sediment, which is composed of a high silt content and a low clay content, is more prone to liquefaction (Kirca et al., 2014; Liu et al., 2017). The water content of the sediment was 25.0%.
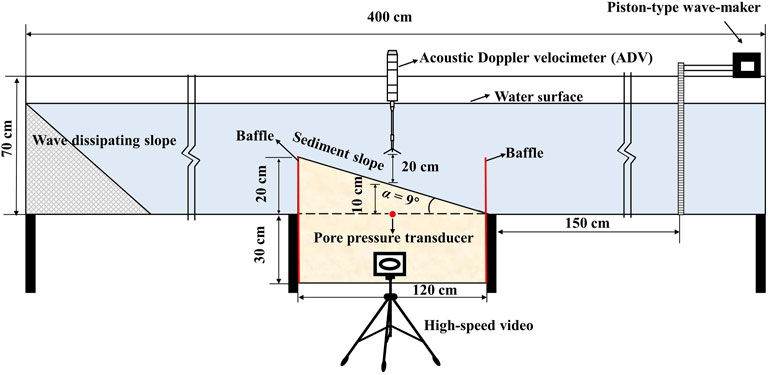
FIGURE 1. Schematic of the experimental setup.
To reproduce the water content and homogeneity of the field-derived sediments of the Yellow River Delta, the obtained sediments were firstly air-dried. Secondly, the sediment clusters were pulverized into individual particles and sieved to remove the larger gravels. The dry sediments were mixed with water according to a constant weight proportion of 3:1 to prepare a slurry with a saturated water content of 25.0%. Thirdly, this slurry was then slowly poured along the flume walls into the soil tank up to about 50 cm thick (Figure 1). As the mud settled during natural consolidation, it was necessary to replenish it after 24 h of consolidation to bring the sediment height to a predetermined level. After the consolidation process, the right-hand baffle of the flume was removed, and the sediment was trimmed to a slope of 9° using a geotechnical knife. Subsequently, water was gradually added to the wave flume to a depth of 45 cm above the soil surface. The flume test was started after 24 h of soil bed consolidation under hydrostatic pressure. A small-amplitude wave was applied to the seabed sediment for 5 min to expel any gas that may be present within the sediment and to stabilize the sloping seabed. Finally, wave-making experiments were carried out.
Instrumentation and Measurements
As shown in Figure 1, a pore-water pressure transducer (CYY4, Xi’an Weizheng Electronic Technology Co. Xi’an) was deployed at 10 cm below the sediment surface and along the central axis of the soil tank, with a collection frequency of 5 Hz. The measuring range of the pore water pressure sensor is ±50 kPa, the resolution is 0.02% FS, the diameter is 5 mm and the height is 12 mm, which can minimize the disturbance of the pore water pressure sensor to the seabed. Before the pore pressure transducers were embedded in the soil bed, they were soaked in water for 24 h with continuous shaking to ensure gas removal. To obtain the variation of pore-water pressure within the sloping seabed sediment under wave action, the measured pore-water pressure data were low-pass filtered using the fast Fourier transform to remove the pressure-variation values generated by waves and wave reflections. Velocity was measured using a down-looking 6 MHz acoustic Doppler velocimeter (ADV). This ADV was placed 20 cm above the sediment bed (the blanking distance was 15 cm) to measure the three-dimensional velocities and to calculate the wave orbital velocity (Figure 1), and the collection frequency was 16 Hz. Doppler signal aliasing, Doppler noising, and boundary layer interference can lead to the presence of spikes, which can affect the quality of the data obtained by the ADV (Voulgaris and Trowbridge, 1998; Nikora and Goring, 1998). The modified phase-space threshold method proposed by Parsheh et al. (2010) was used for quality control of the ADV data, while a polynomial fit interpolation, also proposed by Parsheh et al. (2010), was used for spikes substitution.
A high-speed video camera was placed along the sidewall of the flume to record the formation of the slope-sediment liquefaction interface and its evolution, and this was also used to characterize the movement of the WILSGF and the morphological changes in the sloping seabed (Figure 1). The high-speed video camera has previously been successfully used for particle tracking of sand grains (Ilstad et al., 2004), and to describe the flow behavior of subaqueous debris flow. At the end of the experiment, the water column inside the flume was removed, and some photographs were taken from above and through one sidewall to characterize the structure of the WILSGF deposit. In addition, water-content tests and particle-size analyses of the deposits were carried out on samples from different areas of the sloping seabed. The median particle sizes of the deposits were measured using a Beckman Coulter laser particle sizer from (model LS-12-320).
Flow Dynamics Calculation
In this study, the ADV data was influenced by the flume size and slope topography, and its direct measurement results included velocity components such as wave orbital velocity and turbulent fluctuations. To accurately obtain the wave orbital velocity
where
The EMD method was used to decompose the observed
Each IMF represents a stationary stochastic process. Through spectral analysis of the IMF components (Figure 2), if the peak frequency of an IMF is within the range of the wave frequency, the IMF is classified as a wave component:
where
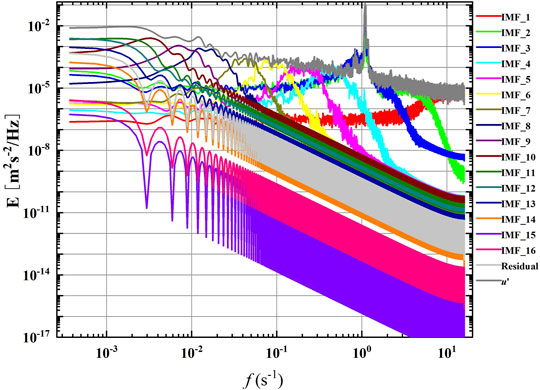
FIGURE 2. Power spectra of velocity fluctuation
Results
Pore Pressure Response of Seabed
We filtered the data measured by the pore-water pressure transducer at 10 cm below the seabed surface and obtained the periodic-average pore-water pressure change within 70 min (Figure 3). Then, the experimental process was divided into three stages (“A”, “C”, and “E” in Figure 3) and two critical points (“B” and “D” in Figure 3) according to the change in the pore-water pressure. To understand the changes of these stages and critical points more intuitively, we extracted the changes in the seabed surface and liquefaction interface at 0, 34, 42, and 70 min from the high-speed video camera (Figure 4). In the “A” stage, the pore pressure remains stable in the initial period under wave action, and then a sharp increase is observed after a certain number of wave cycles; the excess pore pressure then begins to build up, and the seabed surface of the sediment is lower than the initial seabed surface due to wave compaction (Figure 4A). At critical point “B” in Figure 3, the pore-water pressure reaches a peak of 5.64 kPa, and the excess pore pressure
where:
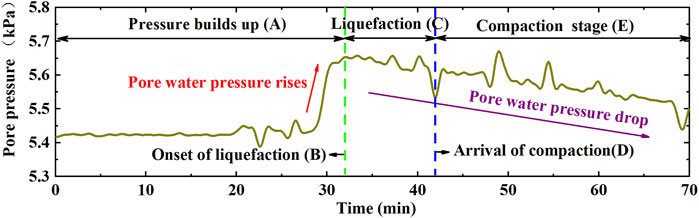
FIGURE 3. Variation of periodic-average pore-water pressure with time at 10 cm depth.
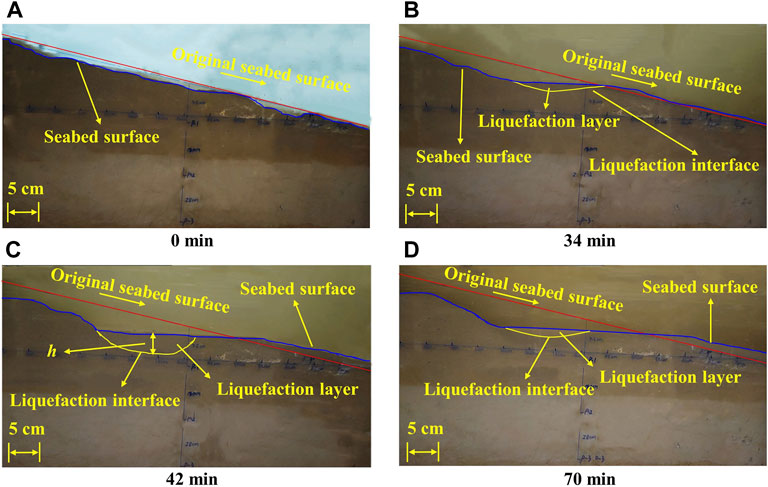
FIGURE 4. Changes of seabed surface and evolution of liquefaction interface at different times. (A‐D) are the positions of seabed surface and liquefaction interface at 0, 34, 42 and 70 min, respectively, where h is the liquefaction depth.
According to the criteria proposed by Jia et al. (2014), the sediment liquefaction index at 10 cm depth is approximately 45.6%, which is less than the liquefaction threshold (100%). This indicates that the sediment at 10 cm is not liquefied, but the sediment above it is partially liquefied. After the peak value of pore pressure is reached, it then gradually decreases (“C” in Figure 3). At this stage, the liquefaction interface continues to evolve downward (Figures 4B,C), and the liquefaction depth continues to increase. At critical point “D” in Figure 3, the liquefaction interface extends downward to the deepest position, the sediment begins to be compressed, and the maximum liquefaction depth can reach 4.5 cm (Figure 4C). Compared with the results of Jia et al. (2014), which were conducted under similar experimental conditions, this lower liquefaction depth is caused by the loss of sediment flow in the liquefaction layer. These lost liquefied sediments are moved to the bottom of the sloping seabed by gravity flow, and some are suspended in the ambient water by the shear action of waves, resulting in high turbidity in the water column (Figures 4A–D). As the wave load continues to be applied, the pore-water pressure continues to decrease steadily and the sediment is gradually compressed (“E” in Figure 3, and Figures 4C,D). The liquefaction interface then begins to move upward until it reaches the sediment surface.
Wave Orbital Velocity and WILSGF Velocity
The decomposition results of the flow fluctuations by the EMD method demonstrated that the peak frequencies of IMF_2 and IMF_3 are within the wave frequency range (Figure 2), from which the root mean square (RMS) wave orbital velocity is calculated (Figure 5A). During the period 0–5 min of the experiment, the RMS wave orbital velocity is small and fluctuates due to the small wave load compacting the slope sediment. After 5 min, the RMS orbital velocity becomes more stable, with an average RMS orbital velocity of 5.67 cm/s.
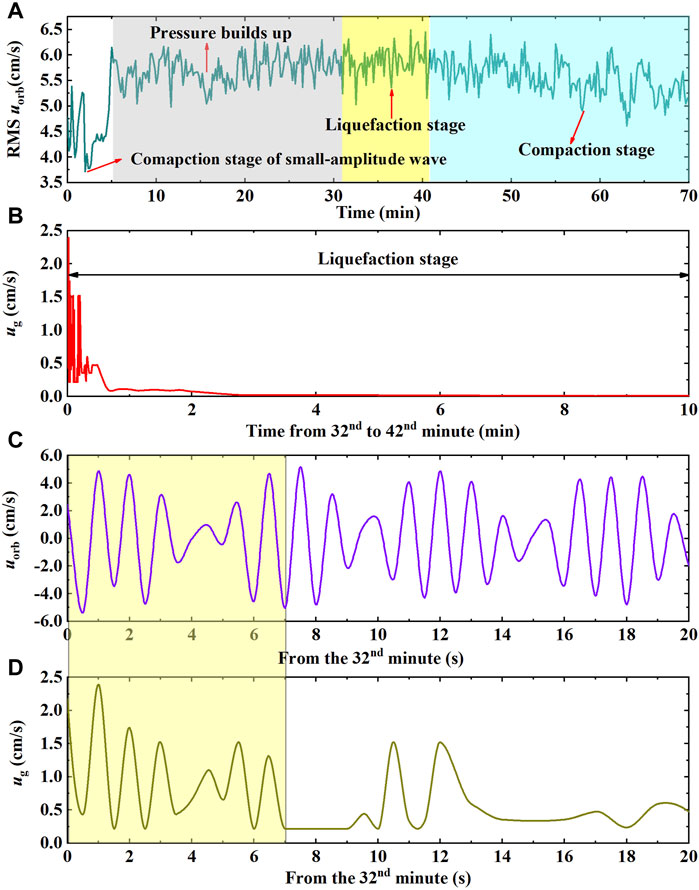
FIGURE 5. Time series records of wave orbital velocity and the WILSGF velocity. (A) RMS wave orbital velocity (RMS
The WILSGF is mainly formed in the “C” stage in Figure 3; this moves slowly downward in the form of a laminar flow (Figure 6). The thickness of the head of the WILSGF is small, and its body is thick. Deposition along the sloping seabed will occur during the movement of WILSGF along the slope. Due to the “paving” effect of WILSGF, the original uneven sloping seabed becomes smooth. A plot of the velocity of the WILSGF is shown in Figure 5B, in the incipient stage, the velocity is high, reaching a peak of 2.39 cm/s. With the downward evolution of the liquefaction interface, the liquefaction depth (h) of the sediments continuously increases (Figure 4C), while the WILSGF velocity decreases rapidly.
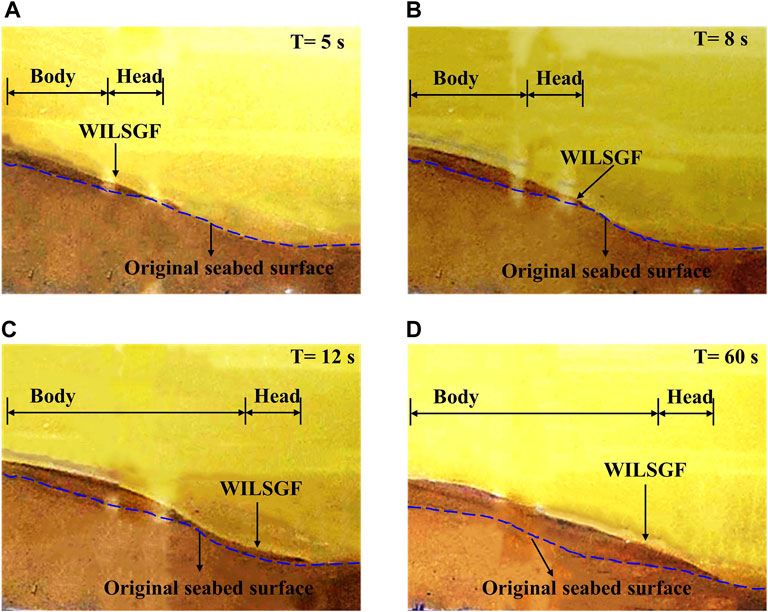
FIGURE 6. Ongoing process of the WILSGF and the resulting morphological changes at 5, 8, 12, and 60 s in panels (A–D), respectively.
To better study the movement characteristics of the WILSGF at the initial stage of its formation, the velocity data of the first 20 s and the wave orbital velocity data after the formation of WILSGF were extracted (as shown in Figures 5C,D. During the first 7 s of the formation of the WILSGF, its velocity is affected by wave orbital velocity, and the direction of the wave orbital velocity determines the WILSGF velocity. When the direction of the wave orbital velocity is the same as that of the WILSGF, the wave orbital velocity will promote the movement of the WILSGF. The fluctuation of the phase and amplitude of the WILSGF is the same as that of the cyclic oscillating flow generated by the waves.
Particle Size, Water Content, and Bedforms
To study the depositional characteristics of the WILSGF, the experiment was artificially stopped when the liquefaction interface evolved upward and came near to the sloping seabed surface. The ambient water was slowly drained from the tank, and the different types of deposits on the sloping seabed were then divided into four zones (Figure 7A). Zone Ⅰ is the central deposition zone of the WILSGF, which was formed by the accumulation of sediments deposited on the sloping seabed after the movement of the WILSGF along the slope. Zone Ⅱ is the WILSGF head deposition zone, which consists of sediment deposited after the head of the WILSGF had stopped moving. Zone Ⅲ is the liquefaction zone and zone Ⅳ is the non-liquefaction zone.

FIGURE 7. Seabed morphological changes. (A) Top view of the sloping seabed. (B) Side view of the sloping seabed, where dL is the distance between the rightmost end of the liquefaction interface and the outflow location of the WILSGF, and α1 and α2 are the slope angle of the step trailing edge and step leading edge, respectively. (C) Slope change at the step trailing edge (α1) and step leading edge (α2).
The variation of the water content in the four zones is presented in Figure 8. It can be seen that the water content of the sediments in the deposition area of the WILSGF head deposition zone was the greatest (28.01%), while that in the liquefaction zone was low (23.90%). The median particle sizes of the sediments in the four regions were quite different from that of the original seabed sediments. Zone Ⅰ and Ⅱ showed a coarsening phenomenon, and the median particle size of sediments in these two zones was approximately 50% higher than that of the original seabed. Grain refinement occurred in the sediments in zone Ⅲ and Ⅳ.
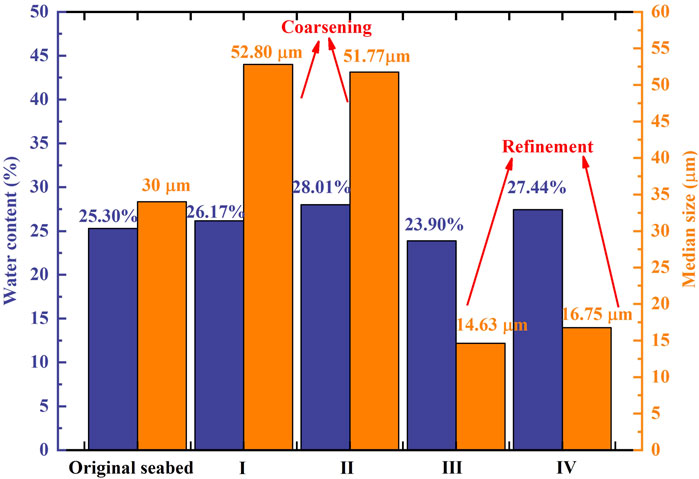
FIGURE 8. Water content (bluish violet) and median particle size (orange) of sediments in the four areas as compared to their original values. Zone Ⅰ and Ⅱ present the particle coarsening, and zone Ⅲ and Ⅳ present the particle refinement.
The formation and movement of the WILSGF changed the sloping bedform. Figure 9 shows the seabed outlines (taken from photographs) at 0, 28, 32, 42, and 70 min. The intersection of the outline at 0 min with the subsequent seabed-surface outline obtained at each time point was defined as the critical erosion boundary. The sediments in the seabed area on the left-hand side of the critical erosion boundary are eroded by waves, and sediment deposition mainly occurs on the right-hand side of the critical erosion boundary. In the “A” stage, the sloping bedform changes little. The phenomenon of slope-sediment erosion is not obvious, and the slope sediment settles due to wave compaction. After liquefaction of the slope sediments, the position of the critical erosion point shifts to the right until the end of the experiment, by which point the original sloping seabed had changed into a stepped topography due to sediment liquefaction and deposition by the WILSGF (Figures 7A,B).
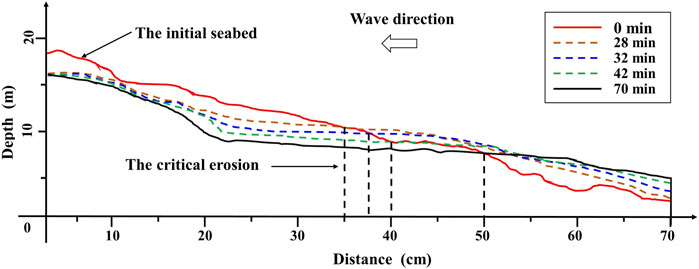
FIGURE 9. Evolution of the surface morphology of the sediment seabed with time.
The angle of the step trailing edge changed with the position of the liquefaction interface. This angle also reached its maximum near the deepest position of the liquefaction interface. The angle of the trailing edge of the step decreased slowly in the compaction stage, and it reached 31° (α1) at the 70th minute (Figure 7C). The angle of the leading edge of the step decreased continuously in the liquefaction stage. However, after the liquefaction interface had reached its deepest position, the angle of the step leading edge was almost unchanged, forming a gentle slope of 6° (α2).
Discussion
This study found that the velocity of the WILSGF was highest in the first 7 s after its formation, reaching 2.39 cm/s, which is similar to the findings of Kessel and Kranenburg (1998). However, the velocity of the WILSGF decreased rapidly with the downward evolution of the liquefaction interface. This rapid decrease can be attributed to the expansion rate of the liquefaction layer being less than the evolution speed of the outflow position along the slope.
Figure 10 shows the variation of the distance (dL, as shown in Figure 7B) between the rightmost end of the liquefaction layer and the outflow position of the WILSGF with time. It can be seen that dL increased continuously with the downward evolution of the liquefaction interface, and the liquefaction layer area moved farther from the sediment outflow position of the WILSGF. The increase of dL led to the liquefied sediment particles not being able to move directly along the slope to form a WILSGF. During wave entrainment, these sediment particles could be transported to the outflow position of the WILSGF, and they could then form a WILSGF under the action of gravity. However, during the movement of these sediment particles to the outflow position, the fine particles were resuspended under the action of waves; only a few particles could reach the outflow position of the WILSGF, resulting in the decrease of the mass source of the WILSGF and the decrease of its WILSGF velocity.
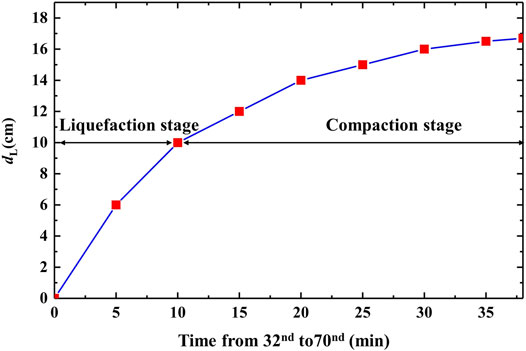
FIGURE 10. Distance between the rightmost end of the liquefaction interface and the outflow location of the WILSGF.
The rapid decrease of the WILSGF velocity was also due to the decrease of the step leading edge slope (α2) and the consequent decrease of the gravity component of the WILSGF. When the liquefaction reached its maximum depth, the WILSGF could no longer form. Evidently, this is related to the area in which the liquefaction layer expanded. Xu et al. (2016) suggested that the sediments on the slope will be eroded by the expansion of the liquefaction layer area and evolve downward along the slope direction to form a WILSGF. Subsequently, due to the change of physical properties of the sediments, the liquefaction interface evolved upward, and the liquefied sediments no longer formed a WILSGF.
The cyclic oscillatory currents generated by the wave had a significant impact on the movement of the WILSGF that was initially formed (Figures 5C,D). The velocity of a WILSGF is related to the direction of the wave orbital velocity. In a wave period, when the direction of the wave orbital velocity is the same as that of the WILSGF, the waves will promote the movement of the WILSGF. When the direction of the wave orbital velocity is opposite to that of the WILSGF, the waves will hinder the movement of the WILSGF. Musumeci et al. (2017) and Smith et al. (2019) both found that cyclic oscillatory currents have a significant impact on the movement of an SGF. Similarly, Smith et al. (2019) also found that the transport and erosivity of an SGF were enhanced due to wave front oscillation. However, the WILSGF in this study was a type of high concentration sediment flow, which can reach hundreds of kg/m3, similar to that in the research of Kessel and Kranenburg (1998). This type of extremely high concentration WILSGF moves downward at a low speed and in the form of a laminar flow on the sloping seabed surface. Unlike the high Reynolds number SGF studied by Smith et al. (2019), the WILSGF is not supported by turbulence and has a short moving distance. Observations on the prodelta have revealed that SGF of high -concentration mud suspensions could be supported by wave-induced turbulence during cross-shelf transport (Traykovski et al., 2007). This wave-supported gravity flow (WSGF) is also related to the liquefaction of sloping sediments (Jaramillo et al., 2009). Additional modeling work to examine the exchange of matter and energy between WILSGF and WSGF would be interesting to investigate the dynamics and kinematics of SGF under actual storm waves.
Wave action not only affects the movement behavior of a WILSGF but also changes the physical properties of WILSGF deposits. Among the four regions, it can be seen that the water content and median particle sizes of sediments in zones Ⅰ and Ⅱ are higher than those in zone Ⅲ and the initial sediments (Figure 7); the water content and median particle size of sediments in zone Ⅲ are also lower than those in the other three zones and the initial sediments. The decrease of the water content in the sediment liquefaction area and the refinement of sediment particles are due to compaction under liquefaction (Sumer et al., 2006) and particle classification (Liu et al., 2013).
There are two possible reasons for the coarsening of sediment particles in zone Ⅰ and Ⅱ (Figure 11). The first of these is coarsening of the mass source of the WILSGF. Liquefied sediment is the source of the WILSGF’s mass. Under the action of a pressure gradient, some fine particles are carried out from the solid skeleton of the soil by seepage. These migrate upward along the seepage flow channel in the liquefied sediment and are resuspended by wave shear (Liu et al., 2013). With the loss of fine-grained sediments in the liquefied sediment layer, the sediments in the liquefaction layer are gradually coarsened (Figure 11), that is, the mass source of the WILSGF is coarsened. The second reason is that ambient water intrusion exists in the process of the movement of the WILSGF. In this experiment, the velocity of the WILSGF was low. When a WILSGF moves downward along the slope, it will be strongly affected by wave shear. This shear action will carry the fine particles in the WILSGF into the ambient water (Figure 11), further amplifying the coarsening phenomenon of the WILSGF deposited particles.
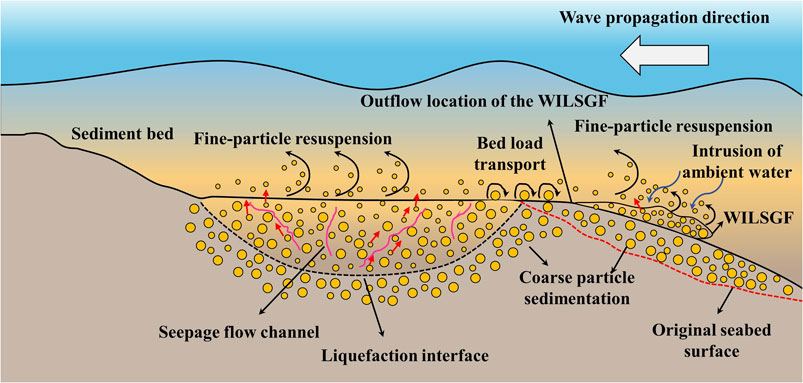
FIGURE 11. Mechanism of WILSGF forming coarse-grained depositional characteristics.
Conclusion
In this study, we reproduced the formation, movement, and deposition of an SGF influenced by wave-induced liquefaction using flume experiments. In this paper, we examined and discussed the movement and deposition characteristics of the WILSGF. The conclusions can be summarized as follows.
1) At the initial stage of WILSGF formation in our experiments, the peak velocity of the WILSGF reached 2.39 cm/s. This velocity is affected by the slope angle of the step leading edge and the relative outflow position. With the downward evolution of the liquefaction interface, the slope angle of the step leading edge decreases and dL increases, and the velocity of the WILSGF decreases rapidly. When the liquefaction depth reached its maximum value of 4.5 cm, the WILSGF did not continue.
2) In the incipient stage, 7 s after the formation of the WILSGF, the direction of the wave orbital velocity significantly affected the WILSGF velocity. The direction of the wave orbital velocity was the same as that of the WILSGF, and the waves promoted the movement of the WILSGF. The phase and amplitude fluctuations of the WILSGF were the same as those of the wave orbital velocity.
3) The particles of the WILSGF deposits were coarsened due to wave-induced seabed coarsening and the intrusion of ambient water. The median particle size of the WILSGF deposits was approximately 50% greater than that of the original seabed. The water content of WILSGF deposits was higher than that of the original seabed and liquefaction zone (Pyles et al., 2013; Clare et al., 2016; Gan et al., 2020).
Data Availability Statement
The raw data supporting the conclusion of this article will be made available by the authors, without undue reservation.
Author Contributions
HY: Methodology, Experiments, Writing- Original draft preparation. XaL: Supervision, Writing- Reviewing and Editing, Guidance. YL: Experiments, Visualization. WL: Experiments, Editing, Validation. HG: Experiments, Writing- Reviewing and Editing. RW: Experiments, Editing. XnL: Experiments, Writing- Reviewing.
Funding
This study was financially supported by funding from the National Natural Science Foundation of China (Grants 42022052 and 41877221), the Shandong Provincial Natural Science Foundation (ZR2020YQ29) and the Laboratory for Marine Geology, Qingdao National Laboratory for Marine Science and Technology (No. MGQNLM-TD201808).
Conflict of Interest
The authors declare that the research was conducted in the absence of any commercial or financial relationships that could be construed as a potential conflict of interest.
Publisher’s Note
All claims expressed in this article are solely those of the authors and do not necessarily represent those of their affiliated organizations, or those of the publisher, the editors and the reviewers. Any product that may be evaluated in this article, or claim that may be made by its manufacturer, is not guaranteed or endorsed by the publisher.
Acknowledgments
The authors would like to thank Shuyu Zhang, Junkai Sun, Xiaotian Xie,Yueying Wang, and Yujun Tian for their technical support during the experimental process. The authors are also grateful to Xingsen Guo for his review and help in the writing and presentation of the manuscript.
References
Anfinson, O. A., Malusà, M. G., Ottria, G., Dafov, L. N., and Stockli, D. F. (2016). Tracking Coarse-Grained Gravity Flows by LASS-ICP-MS Depth-Profiling of Detrital Zircon (Aveto Formation, Adriatic Foredeep, Italy). Mar. Petroleum Geol. 77, 1163–1176. doi:10.1016/j.marpetgeo.2016.07.014
Atigh, E., and Byrne, P. M. (2004). Liquefaction Flow of Submarine Slopes under Partially Undrained Conditions: an Effective Stress Approach. Can. Geotech. J. 41, 154–165. doi:10.1139/t03-079
Bailey, L. P., Clare, M. A., Rosenberger, K. J., Cartigny, M. J. B., Talling, P. J., Paull, C. K., et al. (2021). Preconditioning by Sediment Accumulation Can Produce Powerful Turbidity Currents without Major External Triggers. Earth Planet. Sci. Lett. 562, 116845. doi:10.1016/j.epsl.2021.116845
Bian, C., Liu, X., Zhou, Z., Chen, Z., Wang, T., and Gu, Y. (2020). Calculation of Winds Induced Bottom Wave Orbital Velocity Using the Empirical Mode Decomposition Method. J. Atmos. Ocean. Technol. 37 (5), 889–900. doi:10.1175/JTECH-D-19-0185.1
Carter, L., Gavey, R., Talling, P., and Liu, J. (2014). Insights into Submarine Geohazards from Breaks in Subsea Telecommunication Cables. oceanog 27, 58–67. doi:10.5670/oceanog.2014.40
Clare, M. A., Hughes Clarke, J. E., Talling, P. J., Cartigny, M. J. B., and Pratomo, D. G. (2016). Preconditioning and Triggering of Offshore Slope Failures and Turbidity Currents Revealed by Most Detailed Monitoring yet at a Fjord-Head Delta. Earth Planet. Sci. Lett. 450, 208–220. doi:10.1016/j.epsl.2016.06.021
Foda, M. A., and Tzang, S.-Y. (1994). Resonant Fluidization of Silty Soil by Water Waves. J. Geophys. Res. 99 (C10), 20463–20475. doi:10.1029/94JC02040
Gan, Y., Steel, R. J., Olariu, C., and De Almeida, F. (2020). Facies and Architectural Variability of Sub‐seismic Slope‐channel Fills in Prograding Clinoforms, Mid‐Jurassic Neuquén Basin, Argentina. Basin Res. 32, 348–362. doi:10.1111/bre.12409
Guo, X. S., Stoesser, T., Nian, T. K., Jia, Y. G., and Liu, X. L. (2022). Effect of Pipeline Surface Roughness on Peak Impact Forces Caused by Submarine Mudflow. Ocean. Eng. 243, 110184. doi:10.1016/j.oceaneng.2021.110184
Guy Plint, A. (2014). Mud Dispersal across a Cretaceous Prodelta: Storm-Generated, Wave-Enhanced Sediment Gravity Flows Inferred from Mudstone Microtexture and Microfacies. Sedimentology 61 (3), 609–647. doi:10.1111/sed.12068
Harazim, D., and Mcilroy, D. (2015). Mud-Rich Density-Driven Flows along an Early Ordovician Storm-Dominated Shoreline: Implications for Shallow-Marine Facies Models. J. Sediment. Res. 85 (5), 509–528. doi:10.2110/jsr.2015.38
Heezen, B. C., and Ewing, W. M. (1952). Turbidity Currents and Submarine Slumps, and the 1929 Grand Banks [Newfoundland] Earthquake. Am. J. Sci. 250 (12), 849–873. doi:10.2475/ajs.250.12.849
Huang, N. E., Shen, Z., Long, S. R., Wu, M. C., Shih, H. H., Zheng, Q., et al. (1998). The Empirical Mode Decomposition and the Hilbert Spectrum for Nonlinear and Non-stationary Time Series Analysis. Proc. R. Soc. Lond. A 454, 903–995. doi:10.1098/rspa.1998.0193
Ilstad, T., Elverhøi, A., Issler, D., and Marr, J. G. (2004). Subaqueous Debris Flow Behaviour and its Dependence on the Sand/clay Ratio: a Laboratory Study Using Particle Tracking. Mar. Geol. 213, 415–438. doi:10.1016/j.margeo.2004.10.017
Jaramillo, S., Sheremet, A., Allison, M. A., Reed, A. H., and Holland, K. T. (2009). Wave‐mud Interactions over the Muddy Atchafalaya Subaqueous Clinoform, Louisiana, United States: Wave‐supported Sediment Transport. J. Geophys. Res. 114, C04002. doi:10.1029/2008JC004821
Jia, Y., Zhang, L., Zheng, J., Liu, X., Jeng, D.-S., and Shan, H. (2014). Effects of Wave-Induced Seabed Liquefaction on Sediment Re-suspension in the Yellow River Delta. Ocean. Eng. 89, 146–156. doi:10.1016/j.oceaneng.2014.08.004
Kessel, T., and Kranenburg, C. (1998). Wave-induced Liquefaction and Flow of Subaqueous Mud Layers. Coast. Eng. 34, 109–127. doi:10.1016/S0378-3839(98)00016-7
Kessel, T. V., Kranenburg, C., and Battjes, J. A. (1997). “Transport of Fluid Mud Generated by Waves on Inclined Beds,” in Proceeding of the 25th International Conference on Coastal Engineering, Orlando, September 1997, 3337–3348. doi:10.1061/9780784402429.258
Kirca, V. S. O., Sumer, B. M., and Fredsøe, J. (2014). Influence of Clay Content on Wave-Induced Liquefaction. J. Waterw. Port. Coast. Ocean. Eng. 140 (6), 04014024. doi:10.1061/(asce)ww.1943-5460.0000249
Liu, X.-L., Jia, Y.-G., Zheng, J.-W., Hou, W., Zhang, L., Zhang, L.-P., et al. (2013). Experimental Evidence of Wave-Induced Inhomogeneity in the Strength of Silty Seabed Sediments: Yellow River Delta, China. Ocean. Eng. 59, 120–128. doi:10.1016/j.oceaneng.2012.12.003
Liu, X., Jia, Y., Zheng, J., Wen, M., and Shan, H. (2017). An Experimental Investigation of Wave-Induced Sediment Responses in a Natural Silty Seabed: New Insights into Seabed Stratification. Sedimentology 64, 508–529. doi:10.1111/sed.12312
Liu, X., Zhang, H., Zheng, J., Guo, L., Jia, Y., Bian, C., et al. (2020). Critical Role of Wave-Seabed Interactions in the Extensive Erosion of Yellow River Estuarine Sediments. Mar. Geol. 426, 106208. doi:10.1016/j.margeo.2020.106208
Ma, Y., Friedrichs, C. T., Harris, C. K., and Wright, L. D. (2010). Deposition by Seasonal Wave- and Current-Supported Sediment Gravity Flows Interacting with Spatially Varying Bathymetry: Waiapu Shelf, New Zealand. Mar. Geol. 275, 199–211. doi:10.1016/j.margeo.2010.06.001
Maa, P.-Y., and Mehta, A. J. (1987). Mud Erosion by Waves: a Laboratory Study. Cont. Shelf Res. 7, 1269–1284. doi:10.1016/0278-4343(87)90030-6
Macquaker, J. H. S., Bentley, S. J., and Bohacs, K. M. (2010). Wave-enhanced Sediment-Gravity Flows and Mud Dispersal across Continental Shelves: Reappraising Sediment Transport Processes Operating in Ancient Mudstone Successions. Geology 38 (10), 947–950. doi:10.1130/G31093.1
Middleton, G. V., and Hampton, M. A. (1973). “Sediment Gravity Flows: Mechanics of Flow and Deposition,” in Turbidites and Deep-Water Sedimentation. Soc. Econ. Paleont. Miner. (Pacific Sect.) Short Course Lect. Notes, 1–38.
Musumeci, R. E., Viviano, A., and Foti, E. (2017). Influence of Regular Surface Waves on the Propagation of Gravity Currents: Experimental and Numerical Modeling. J. Hydraul. Eng. 143 (8), 04017022. doi:10.1061/(asce)HY.1943-7900.0001308
Mutlu Sumer, B., Hatipoglu, F., Fredsøe, J., and Kaan Sumer, S. (2006). The Sequence of Sediment Behaviour during Wave-Induced Liquefaction. Sedimentology 53 (3), 611–629. doi:10.1111/j.1365-3091.2006.00763.x
Ng, C.-O., and Fu, S.-C. (2002). On the Propagation of a Two-Dimensional Viscous Density Current under Surface Waves. Phys. Fluids 14 (3), 970–984. doi:10.1063/1.1448348
Nikora, V. I., and Goring, D. G. (1998). ADV Measurements of Turbulence: Can We Improve Their Interpretation? J. Hydraulic Eng. 124 (6), 630–634. doi:10.1061/(asce)0733-9429(1998)124:6(630)
Parsheh, M., Sotiropoulos, F., and Porté-Agel, F. (2010). Estimation of Power Spectra of Acoustic-Doppler Velocimetry Data Contaminated with Intermittent Spikes. J. Hydraul. Eng. 136 (6), 368–378. doi:10.1061/(ASCE)HY.1943-7900.0000202
Piper, D. J. W., and Normark, W. R. (2009). Processes that Initiate Turbidity Currents and Their Influence on Turbidites: a Marine Geology Perspective. J. Sediment. Res. 79 (6), 347–362. doi:10.2110/jsr.2009.046
Prior, D. B., Suhayda, J. N., Lu, N.-Z., Bornhold, B. D., Keller, G. H., Wiseman, W. J., et al. (1989). Storm Wave Reactivation of a Submarine Landslide. Nature 341 (6237), 47–50. doi:10.1038/341047a0
Puig, P., Ogston, A. S., Mullenbach, B. L., Nittrouer, C. A., Parsons, J. D., and Sternberg, R. W. (2004). Storm-induced Sediment Gravity Flows at the Head of the Eel Submarine Canyon, Northern California Margin. J. Geophys. Res. 109, C03019. doi:10.1029/2003JC001918
Pyles, D. R., Straub, K. M., and Stammer, J. G. (2013). Spatial Variations in the Composition of Turbidites Due to Hydrodynamic Fractionation. Geophys. Res. Lett. 40, 3919–3923. doi:10.1002/grl.50767
Robinson, T. O., Eames, I., and Simons, R. (2013). Dense Gravity Currents Moving beneath Progressive Free-Surface Water Waves. J. Fluid Mech. 725, 588–610. doi:10.1017/jfm.2013.112
Smith, E., Daniller-Varghese, M. S., Myrow, P. M., and Mohrig, D. (2019). Experimental Investigations of Combined Flow Sediment Transport. J. Sediment. Res. 89 (8), 808–814. doi:10.2110/jsr.2019.43
Traykovski, P., Geyer, W. R., Irish, J. D., and Lynch, J. F. (2000). The Role of Wave-Induced Density-Driven Fluid Mud Flows for Cross-Shelf Transport on the Eel River Continental Shelf. Cont. Shelf Res. 20, 2113–2140. doi:10.1016/S0278-4343(00)00071-6
Traykovski, P., Wiberg, P. L., and Geyer, W. R. (2007). Observations and Modeling of Wave-Supported Sediment Gravity Flows on the Po Prodelta and Comparison to Prior Observations from the Eel Shelf. Cont. Shelf Res. 27 (3), 375–399. doi:10.1016/j.csr.2005.07.008
Voulgaris, G., and Trowbridge, J. H. (1998). Evaluation of the Acoustic Doppler Velocimeter (ADV) for Turbulence Measurements*. J. Atmos. Ocean. Technol. 15 (1), 272–289. doi:10.1175/1520-0426(1998)015<0272:eotadv>2.0.co;2
Wang, L. M., Ye, J. H., and Zhu, C. Q. (2015). Investigation on the Wave-Induced Progressive Liquefaction of Offshore Loosely Deposited Sandy Seabed. Rock Soil Mech. 36 (12), 3583–3588. doi:10.16285/j.rsm.2015.12.031
Wang, Z., Sun, Y., Jia, Y., Shan, Z., Shan, H., Zhang, S., et al. (2020). Wave-induced Seafloor Instabilities in the Subaqueous Yellow River Delta-initiation and Process of Sediment Failure. Landslides 17, 1849–1862. doi:10.1007/s10346-020-01399-2
Wright, L. D., Friedrichs, C. T., Kim, S. C., and Scully, M. E. (2001). Effects of Ambient Currents and Waves on Gravity-Driven Sediment Transport on Continental Shelves. Mar. Geol. 175, 25–45. doi:10.1016/S0025-3227(01)00140-2
Xu, G. H., Wang, G., Lv, C. X., and Sun, Z. H. (2016). Experimental Study on the Motion Froms of Outflowed Sediments from Wave-Induced Liquefied Seabed. Periodical Ocean Univ. China 46 (10), 98–105.
Keywords: wave-induced liquefaction, sediment gravity flow, movement characteristics, depositional characteristics, sloping seabed
Citation: Yu H, Liu X, Lu Y, Li W, Gao H, Wu R and Li X (2022) Characteristics of the Sediment Gravity Flow Triggered by Wave-Induced Liquefaction on a Sloping Silty Seabed: An Experimental Investigation. Front. Earth Sci. 10:909605. doi: 10.3389/feart.2022.909605
Received: 31 March 2022; Accepted: 19 April 2022;
Published: 02 May 2022.
Edited by:
Chong Xu, Ministry of Emergency Management, ChinaReviewed by:
Aiguo Xing, Shanghai Jiao Tong University, ChinaSiyuan Ma, China Earthquake Administration, China
Copyright © 2022 Yu, Liu, Lu, Li, Gao, Wu and Li. This is an open-access article distributed under the terms of the Creative Commons Attribution License (CC BY). The use, distribution or reproduction in other forums is permitted, provided the original author(s) and the copyright owner(s) are credited and that the original publication in this journal is cited, in accordance with accepted academic practice. No use, distribution or reproduction is permitted which does not comply with these terms.
*Correspondence: Xiaolei Liu, eGlhb2xlaUBvdWMuZWR1LmNu