 Xin-Yuan Wang
 Yan-Chun Yin
 Ming-Lu Xing
 Dong-Dong Zhang2
 En-Chao Wang
- 1College of Energy and Mining Engineering, Shandong University of Science and Technology, Qingdao, China
- 2Shandong Energy Group Co., Ltd., Jinan Shandong, China
- 3Jining Energy Bureau, Jining Shandong, China
Rock burst is one typical dynamic disaster caused by excavation in deep underground engineering. High-stress unloading test is a common research method for rock bursts. Due to the limitation of laboratory test conditions, it is difficult to monitor the energy release and dissipation information during rock bursts in the unloading test. But the study of energy evolution law is more helpful to reveal the essential characteristics of rock burst. Therefore, the energy evolution process and ejection failure characteristics of granite after unloading were analyzed through the unloading simulation test in this paper, and the influence of unloading velocity, lateral stress, and axial stress were researched. The microstructure numerical model of the granite was established by using digital image processing technology and PFC2D software, aiming to match the real granite. The energy evolution process of unloading granite can be divided into three stages, namely the whole energy rapid release stage, sidewall energy slow-release stage, and rock block ejection stage. The area near the unloading sidewall is the main energy release and rock block ejection area. In the whole energy rapid release stage, the energy release velocity and dissipation velocity show similar law, i.e., a positive power function correlation with unloading velocity, a negative power function correlation with lateral stress, and a positive linear function correlation with axial stress. In the rock block ejection stage, with increasing the unloading velocity and axial stress, the rock block ejection force increases as a power function, while it decreases with increasing lateral stress. This research is an important supplement to the laboratory unloading test. It has theoretical guiding significance for rock burst hazard assessment during excavation in deep underground engineering.
Introduction
Rock burst is a common dynamic disaster in the deep hydraulic tunnel, traffic tunnels, and another underground rock engineering. With the expansion of the scale and depth of underground engineering construction, the frequency and intensity of rock burst disasters increase (Li et al., 2008; Feng et al., 2012; Zhao et al., 2018; Yin et al., 2019; Guo et al., 2019). Rock burst disaster has become a research focus in the field of deep rock engineering.
Rock burst mechanism and key disaster-causing factors identifications are the premise and foundation for prevention and control of rock burst. Many experts and scholars have carried out a lot of research work on rock burst mechanisms from the aspects of external stress load, mechanical properties of the rock, and dynamic load (Zhao et al., 2015; Xiao et al., 2016). He et al. (2012; 2018) divided the rock burst into two categories, namely, strain rock burst and impact-induced rock burst, and obtained their criteria. In order to understand the mechanism of rock burst and simulate the conditions of rock burst, Jiang et al. (2010) proposed a new energy index, namely local energy release rate, which can better evaluate the rock burst phenomenon in deep underground excavation. Li (2020) researched the principle of rock support to control rock bursts, and explained the energy source and conversion during rock burst in the conceptual model. Li et al. (2014) studied the influence of rock excavation unloading in the deep tunnel, and analyzed the influence of stress path and other factors on rock excavation unloading. Excavation unloading is an important cause of rock burst (Wu et al., 2009). True triaxial unloading test is often used to simulate rock burst process. For example, He et al. (2009) carried out one-side dynamic unloading test under true triaxial condition, analyzed the spectrum of full-wave acoustic emission data, obtained the frequency-amplitude relationship of acoustic emission signal in rock burst stage, and summarized the dynamic damage process and characteristics of rock under test conditions. Li et al. (2014) carried out true triaxial rock burst tests at different unloading velocities, and studied the damage evolution law of rock burst. Si and Gong (2020) carried out triaxial compression and biaxial compression tests under the same confining stress, and the effects of three-dimensional stress state and unloading velocity on rock burst mechanism was studied. Zhai et al. (2020) researched on rock burst process by using high-speed camera, acoustic emission system, and scanning electron microscope. Existing studies provide a lot of research basis for revealing rock burst mechanisms.
Rock burst is a dynamic failure phenomenon driven by energy. Studying the energy evolution law in the process of rock burst is more helpful to reveal the essential characteristics of rock burst (Wang et al., 2012). However, limited to the laboratory test conditions, the energy evolution process is less studied in the true triaxial unloading test, and more attention is paid to the study of disaster-causing stress conditions, acoustic emission characteristics, rock block fractal dimension, and ejection velocity, et al. Compared with laboratory tests, numerical simulation is an effective method to study rock burst energy (Sun et al., 2007). Therefore, this studytakes the granite which is commonly used in rock burst tests as the research object. Based on the micronumerical model of the granite, the energy evolution law and rock block ejection failure characteristics of granite during unloading were researched. The influences of unloading velocity and stress level on rock burst were studied.
Microsimulation Unloading Test of Granite
Microstructure Characterization of Granite
Rock is a typical heterogeneous material, and its heterogeneity mainly includes two aspects. One is the heterogeneity of microparameters, and the other is the heterogeneity of minerals distribution. The weibull function is often used to characterize the heterogeneity of microparameters for rock materials with relatively homogeneous mineral structures, such as the sandstone. For the granite, its minerals distribution is very obvious, and the color difference between different minerals is also relatively large. Therefore, the microscopic structure is often extracted and characterized according to the color difference of rock minerals to establish the heterogeneous model for the granite (Chen et al., 2003; Chen et al., 2004; Zhu et al., 2008; Tan et al., 2016; Meng et al., 2018). The digital image processing technology is an effective method to obtain the microstructure of the rock. Its basic principle is to re-segment the digital image of rock into some groups according to the color of different minerals. The granite used in this simulation test (as shown in Figure 1A) is composed of black mica, transparent quartz (appearing gray), and white feldspar. The key to the characterization of the microstructure is to obtain the color segmentation thresholds among the three minerals. In this paper, the Otsu multi-thresholds segmentation method is used to obtain the segmentation thresholds of granite microstructures. The thresholds (t1, t2) that satisfy the maximum gray variance S2 among the minerals are taken as the optimal segmentation thresholds, and the formula is:
where u is the whole gray value of the granite image,
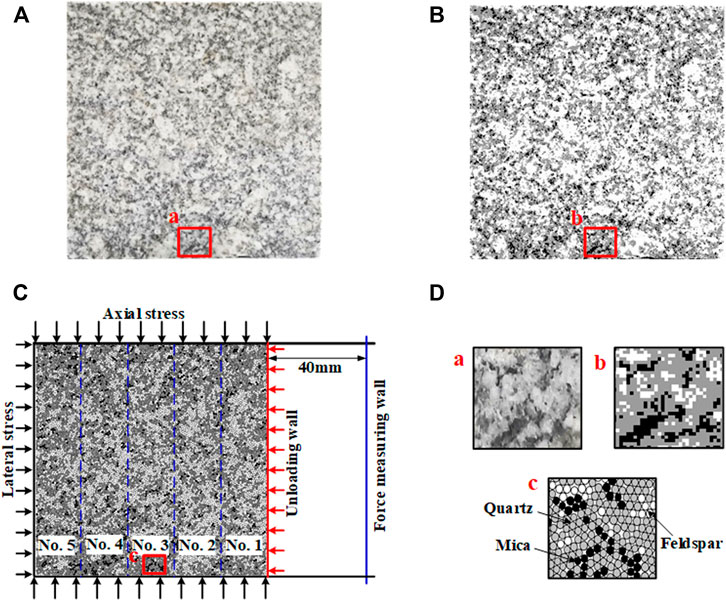
FIGURE 1. Image of the granite. (A) True digital image; (B) characterization image; (C) layout of model grouping and ejection force monitoring; (D) local image comparison.
The microstructure characterization image of the granite with a size of 100 × 100 mm obtained by the Otsu multi-thresholds segmentation method was shown in Figure 1B. The distribution and shapes of the three minerals in the characterization image are highly consistent with the real granite image.
Building of Microstructure Numerical Model
There are many numerical methods to simulate rocks’ mechanical properties and behavior. The finite element method (FEM) and fast Lagrangian analysis of continue (FLAC) are continuum analysis methods. They can simulate the yield, plastic flow, softening, and large deformation of materials, especially in the field of elastic-plastic analysis, large deformation analysis, and simulation of the construction process. Peridynamics (PD) (Wang et al., 2016; Wang et al. 2017; Wang et al., 2018), field enriched finite element method (Zhou et al., 2021), and general particle dynamics (GPD) (Zhou et al., 2015; Bi et al., 2016) can simulate the initiation, propagation, and coalescence of microcracks as well as formation of macro-scale cracks. Particle flow code (PFC) (Potyondy and Cundall, 2014) is one discrete element method, and it can simulate rock macro mechanical behavior by analyzing the movement and interaction of particles. It is not limited by the amount of deformation and is convenient to deal with the problem of the discontinuous medium. These numerical methods above are very helpful for studying rock fractures.
In this simulation, not only the energy evolution law in the process of rock fracture was studied, but also the rock block ejection characteristics after rock burst. Compared with other numerical methods, PFC can intuitively obtain the rock block motion behavior of rock failure (Yoon, 2007). Therefore, this paper used PFC2D to build the microstructure model of granite and study the mechanical behavior during unloading. In the modeling process, firstly one granite specimen model with a size of 100 × 100 mm was generated by using PFC. In order to reduce the size effect (Zhao et al., 2012), the radius of the particles was set to 0.4–0.5 mm, and the average ratio of specimen size to particle radius was 220. Then, the coordinates and gray information of each pixel in the characterization image were imported into PFC through the FISH function. According to the gray information of pixels, the color codes of particles with the closest coordinates were assigned respectively (Zhang et al., 2019). The microstructure numerical model of the granite specimen as shown in Figure 1C. The black particles are mica, the gray particles are quartz, and the white ones are feldspar, as shown in Figure 1D. The three mineral particles were assigned with corresponding material parameters respectively, and the parameters of the cementation surface between minerals were set according to the parameters of low strength minerals. A parallel bond model was chosen to simulate the mechanical properties of rock materials. In the parallel bond model, the microparameters including the friction coefficient μ, contact stiffness kn and ks, parallel bonded stiffness
where
Using Eqs 2, 3, the microparameters of the model can be estimated, but there are often some errors. Therefore, a trial-and-error method should be used to calibrate the suitable microscopic parameters (Peng et al., 2018). In the paper, the microstructure model parameters of the granite were selected from Zhang et al. (2019), as shown in Table 1.
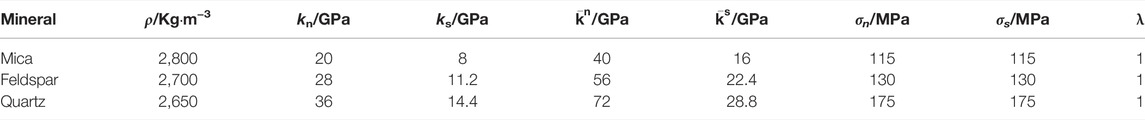
TABLE 1. Microstructure model parameters of granite minerals (Zhang et al., 2019).
Simulation Scheme
In thisarticle, numerical simulation test was carried out based on true triaxial loading and single-side unloading laboratory test of granite. In the loading stage, the axial stress and lateral stress were applied to the granite specimen by the loading wall. When the stress was loading to the predetermined value, the displacement of the upper and the left wall was fixed, avoiding unreasonable loading displacement of the wall under stress constraint, which is different from the laboratory test. In the unloading stage, the right wall was applied with a certain velocity to unload the lateral stress. The simulation variables are unloading velocity, lateral stress, and axial stress, respectively. The specific schemes were shown in Table 2.
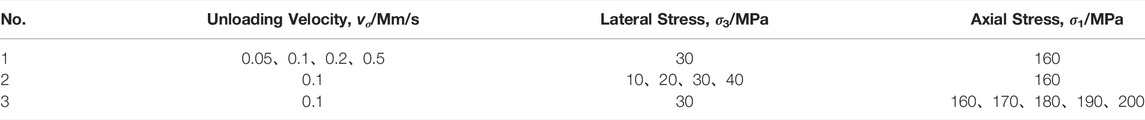
TABLE 2. Unloading simulation schemes of the granite.
Energy Calculation and Monitoring Schemes
In PFC2D, the work done by the external load on the granite specimen is the input energy, which can be calculated by the load and displacement of the loading wall, as follows:
where
The input energy of granite under external load is divided into two parts, namely, strain energy and dissipation energy. The strain energy includes two parts, one is the contact strain energy between particles, and the other is the parallel bond strain energy. The calculation formula of strain energy is as follows:
where
where
The calculation formula of dissipation energy
In the simulation process, in addition to monitoring the energy and crack of the model, the model was divided into five groups, and the energy data in different groups of the model were monitored too. Each group was 20 mm wide, and group No.1 was close to the unloading wall, as shown in Figure 1C.
The rock burst area and rock block ejection force are also important indicators for evaluating the rock burst intensity. A force measuring wall was arranged at 40 mm far away from the unloading wall to monitor the rock block ejection force.
In order to clearly and reasonably describe the process of energy release, the parameters need to be defined as follows:
vrel energy release velocity—equals the ratio of released strain energy to time; vdis energy dissipation velocity—equals the ratio of dissipation energy to time
rdis energy dissipation ratio—equals the ratio of dissipation energy to released strain energy;
F rock block ejection force—represents rock block ejection force on the force measuring wall;
A rock burst area—represents the size of the rock burst pit.
Energy Release Law of Unloading Granite
Energy Release Process and Stage Division
Taking the test results of the granite with lateral stress of 30MPa, axial stress of 160 MPa, and unloading velocity of 0.1 mm/s as an example, the energy and stress evolution curves after unloading were shown in Figure 2. According to the energy release and dissipation law of the whole granite and each group, the energy release process can be divided into three stages: I- whole energy rapid release stage, II- side wall energy slow-release stage, and rock block ejection stage.
1) Step I: whole energy rapid release stage. During the initial unloading stage, with decreasing lateral stress, the lateral deformation of the specimen is beginning to recover, and part of the strain energy accumulated in the specimen is released in the form of elastic energy, as shown in Figures 2A,B. The deformation recovery of the specimen gradually reduces from the unloading sidewall to the internal part (Figure 3A), and the corresponding released energy is also gradually reduced, as shown in Figure 2C. According to the Mohr-Coulomb criterion, when the lateral stress decreases, the ultimate bearing strength of the specimen decreases. During unloading, the crack gradually generates, and part of strain energy is released in the form of dissipation energy. With increasing crack number, the energy dissipation ratio increases gradually. Because cracks are mainly generated near the unloading sidewall of the granite, the energy release in this region is more obvious.
2) Step II: sidewall energy slow-release stage. After the lateral stress is reduced to zero and the lateral deformation of the specimen is recovered, the crack near the unloading side wall gradually connects, as shown in Figure 3B. Only the strain energy near the side wall still keeps releasing, and the energy release velocity is slower than that in Step I. The energy dissipation ratio gradually reduces due to the decrease of crack generating velocity.
3) Step III: rock block ejection stage. After the crack near the side wall coalesced into the fracture zone, the rock block begins to eject from the specimen, and part of the strain energy is released in the form of kinetic energy, as shown in Figure 2D and Figure 3C. After the ejection of large size blocks, the bearing capacity of the specimen decreases sharply, and the fracture zone expands rapidly. A large number of small size blocks generate and eject in a short time. After rock blocks eject, there appears a triangular rock burst pit, which is similar to the engineering field example in Li (2020). The size of the rock burst pit equals the rock burst area.
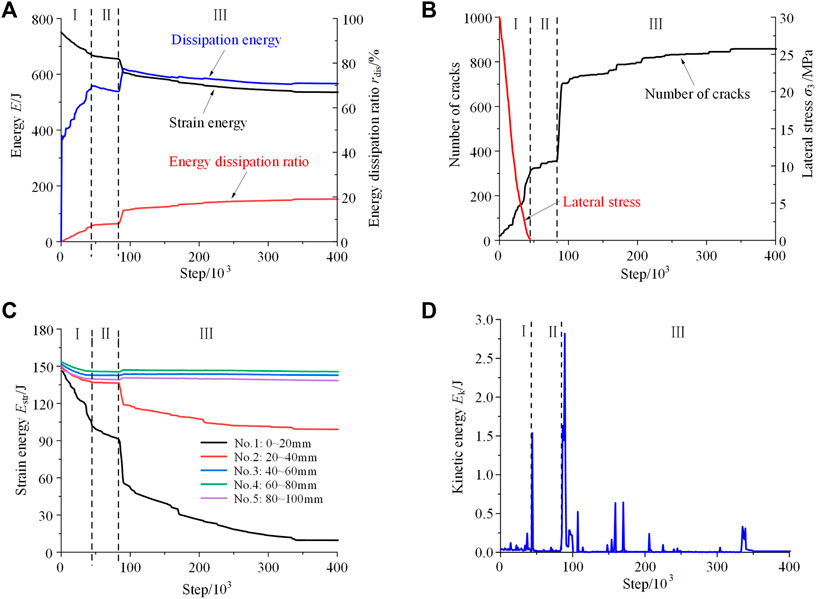
FIGURE 2. Energy release process of unloading granite. (A) Energy of the whole specimen; (B) crack and lateral stress; (C) energy released in different groups; (D) kinetic energy.
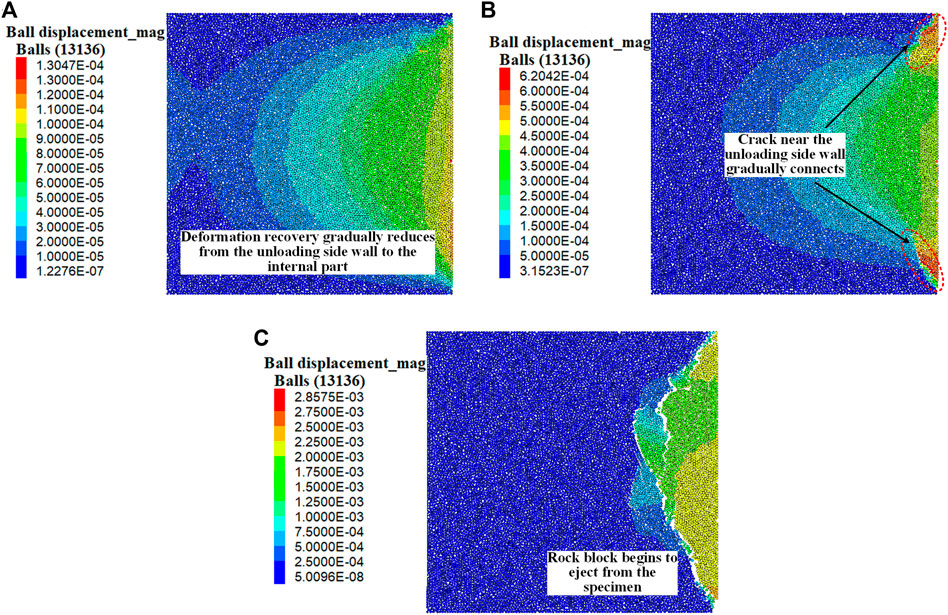
FIGURE 3. Displacement field of the specimen at step. (A) 1e4; (B) 6e4; (C) 2e5.
Influence of Unloading Velocity on Energy Release
With the same lateral stress and axial stress, the energy evolution curves of granite under different unloading velocities were shown in Figure 4. With increasing unloading velocity, the duration time of energy release is significantly shortened, while the total energy release amount changes little. The farther away from the sidewall, the smaller the strain energy released. Both the energy dissipation ratio and total amount increase with increasing unloading velocity. In the whole energy rapid release stage, the strain energy release velocity and dissipation velocity increase with the unloading velocity in a power function relationship, as shown in Figure 5.
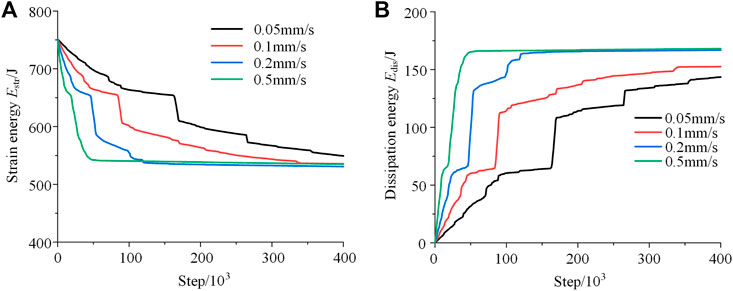
FIGURE 4. (A) Energy release and (B) energy dissipation process of granite under different unloading velocities.
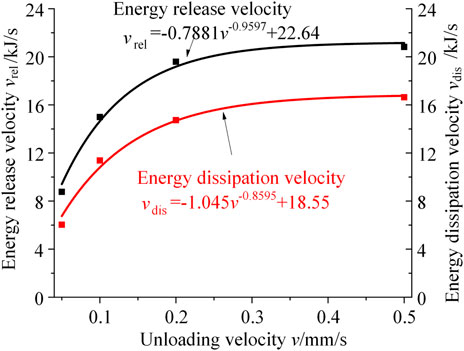
FIGURE 5. Relationship between unloading velocity, energy release velocity, and energy dissipation velocity.
Influence of Lateral Stress on Energy Release
The energy evolution curves of granite under different lateral stress were shown in Figure 6. Under the same axial stress, with increasing lateral stress, the accumulated strain energy in granite before unloading decreases. This is because when the axial stress does positive work on the specimen, the lateral stress does negative work. The greater the lateral stress is, the greater the negative work is done, which causes smaller accumulated strain energy. The result is consistent with that of Huang and Li (2014).
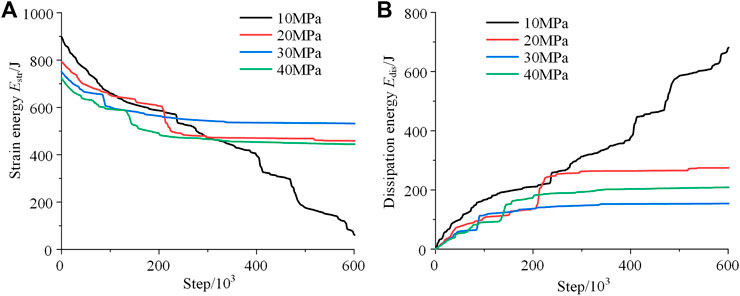
FIGURE 6. (A) Energy release and (B) energy dissipation process of granite under different lateral stress.
When the lateral stress is 10 MPa, the energy is continuous released at a high velocity, and the specimen fractures whole in a short time after unloading. When the lateral stress exceeds 20 MPa, the three-stage characteristics of energy release of granite are relatively obvious. With the increase of lateral stress, the total amount and velocity of energy release and energy dissipation decrease gradually, which all show a power function relationship with lateral stress, as shown in Figures 7A,B. Also, the main area of energy release gradually decreases when the lateral stress increases. When the lateral stress is 30 MPa or 40 MPa, the energy release body is only within the area of 40 mm from the side wall, as shown in Figure 7C.
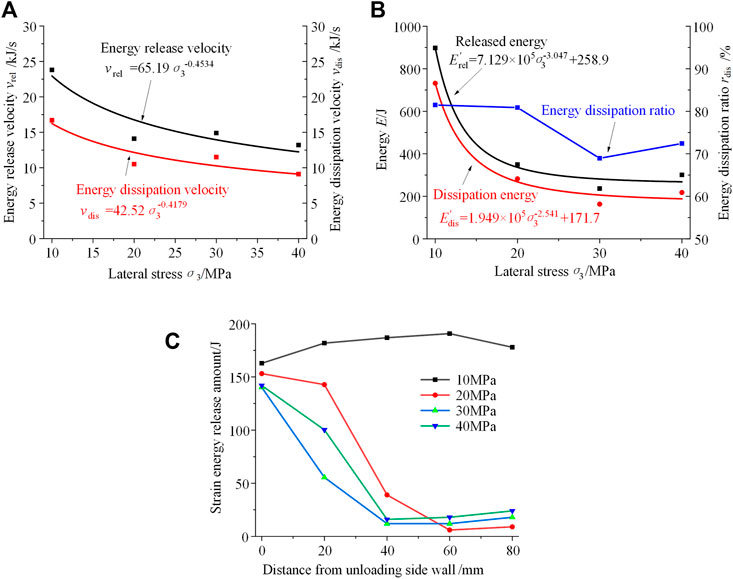
FIGURE 7. (A) Velocity and (B) amount of energy release and energy dissipation, and (C) energy released amount in different groups of granite under different lateral stress.
Influence of Axial Stress on Energy Release
The energy evolution curves of granite under different axial stress were shown in Figure 8. With the increase of axial stress, the total energy accumulated in the granite increases gradually before unloading and the duration of energy release after unloading increases too. The energy release velocity and dissipation velocity are linearly correlated with the axial stress, as shown in Figure 9A. After rock burst, the total amount of energy release and energy dissipation, and the energy dissipation ratio increase with the increase of axial stress, as shown in Figure 9B. Under low axial stress, such as 160 and 170 MPa, the main energy release area locates at the 40 mm range from the side wall. When the axial stress exceeds 180 MPa, the whole body is the main energy release area, as shown in Figure 9C.
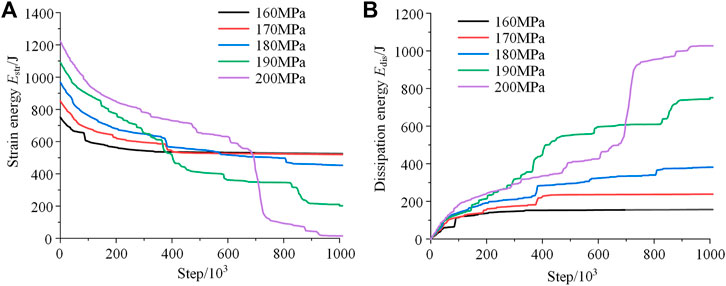
FIGURE 8. (A) Energy release and (B) energy dissipation process of granite under different axial stress.
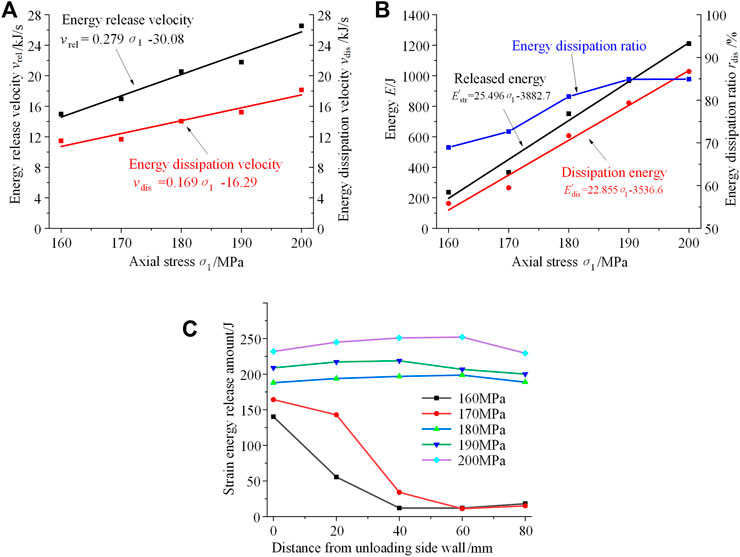
FIGURE 9. (A) Velocity and (B) amount of energy release and energy dissipation, and (C) energy released amount in different groups of granite under different axial stress.
Rock Block Ejection Characteristics
Influence of Unloading Velocity
The unloading velocity has little effect on the rock burst area. However, due to the rapid release of energy at high unloading velocity, more energy is released in the form of kinetic energy, and the rock block ejection force is significantly increased, which shows one power function relationship with the unloading velocity, as shown in Figure 10.
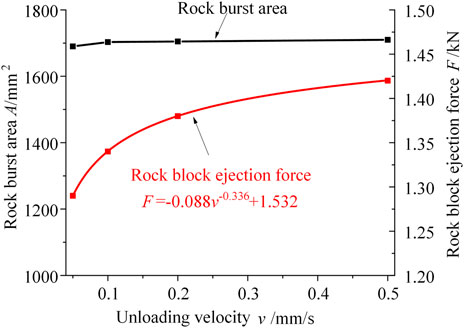
FIGURE 10. Relationship among the rock burst area, rock block ejection force, and unloading velocity.
Influence of Lateral Stress
Rock burst forms and rock block ejection force of the granites under different lateral stress were shown in Figure 11. When the lateral stress is 10 MPa, the rock burst area is about 3,000 mm2, and the rock block ejection force is about 3.21 kN. With increasing lateral stress, rock burst area, and rock block ejection force decrease, which shows one exponential function with lateral stress. When the lateral stress is 40 MPa, rock burst area reduces to 60%, and the rock block ejection force decreases to 44.6%, compared to that at 10 MPa.
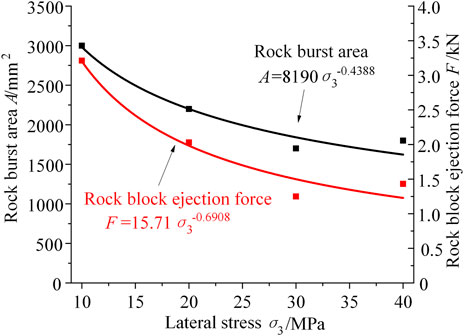
FIGURE 11. Relationship among the rock burst area, rock block ejection force, and lateral stress.
Influence of Axial Stress
Rock burst forms and rock block ejection force of the granites under different axial stress were shown in Figure 12. When the axial stress is 160 MPa, rock burst area is about 1700 mm2, and the rock block ejection force is about 1.25 kN. When the axial stress is 200 MPa, rock burst area extends to 2.82 times, and rock block ejection force increases to 5.2 times, compared to that at 160 MPa. The rock burst area has one linear relation with axial stress, and the rock block ejection force has one power function relation with axial stress.
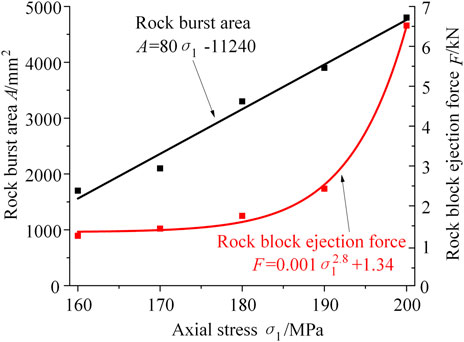
FIGURE 12. Relationship among the rock burst area, rock block ejection force, and axial stress.
Conclusion
1) Unloading process of the granite can be divided into three stages: I- whole energy rapid release stage, II- side wall energy slow-release stage, and III- rock block ejection stage. The release and dissipation of strain energy decrease with the increase of distance from side wall, and the main energy-releasing body and ejection body are near the side wall.
2) The unloading velocity mainly affects the duration of the three stages of energy release, the energy release velocity and the dissipation velocity. It has little effect on the total amount of strain energy released and rock burst area. The strain energy release velocity and the energy dissipation velocity are positively correlated with the unloading velocity by one power function, and the rock block ejection force is also positively correlated with the unloading velocity by one power function.
3) Under the same axial stress, with the increase of lateral stress, the released energy amount, dissipation energy amount, and the energy dissipation ratio of unloading granite gradually decrease. Moreover, the strain energy release velocity and the energy dissipation velocity are negatively correlated with lateral stress in a power function, and the rock block ejection force and rock burst area are also negatively correlated with lateral stress in a power function.
4) Under the same lateral stress, with the increase of axial stress, the released energy amount, dissipation energy amount, and the energy dissipation ratio of unloading granite gradually increase. Moreover, the strain energy release velocity and the energy dissipation velocity are positively correlated with the axial stress in a linear function. The rock burst area has one linear relation with axial stress, and the rock block ejection force has one power function relation with axial stress.
Data Availability Statement
The original contributions presented in the study are included in the article/Supplementary Material; further inquiries can be directed to the corresponding author.
Author Contributions
X-YW carried out numerical simulation tests. Y-CY wrote the manuscript. M-LX analyzed the simulation results. D-DZ proposed research ideas. YC and E-CW designed the simulation test schemes.
Funding
The study was financially supported by the Major Scientific and Technological Innovation Project of Shandong Provincial Key Research Development Program (2019SDZY02), National Natural Science Foundation of China (52074167), and China Postdoctoral Science Foundation-funded project (2019M660024).
Conflict of Interest
D-DZ and YC were employed by Shandong Energy Group Co., Ltd.
The remaining authors declare that the research was conducted in the absence of any commercial or financial relationships that could be construed as a potential conflict of interest.
Publisher’s Note
All claims expressed in this article are solely those of the authors and do not necessarily represent those of their affiliated organizations, or those of the publisher, the editors, and the reviewers. Any product that may be evaluated in this article, or claim that may be made by its manufacturer, is not guaranteed or endorsed by the publisher.
References
Bi, J., Zhou, X. P., and Qian, Q. H. (2016). The 3D Numerical Simulation for the Propagation Process of Multiple Pre-existing Flaws in Rock-like Materials Subjected to Biaxial Compressive Loads. Rock Mech. Rock Eng. 49 (5), 1611–1627. doi:10.1007/s00603-015-0867-y
Chen, S., Yue, Z. Q., and Tham, L. G. (2004). Digital Image-Based Numerical Modeling Method for Prediction of Inhomogeneous Rock Failure. Int. J. Rock Mech. Min. Sci. 41 (6), 939–957. doi:10.1016/j.ijrmms.2004.03.002
Chen, S., Yue, Z. Q., Tham, L. G., and Lee, P. K. K. (2003). Modeling of the Indirect Tensile Test for Inhomogeneous Granite Using a Digital Image-Based Numerical Method. Int. J. Rock Mech. Min. Sci. 41 (3), 447. doi:10.1016/j.ijrmms.2003.12.106
Feng, X., Chen, B., Li, S., Zhang, C., Xiao, Y., Feng, G., et al. (2012). Studies on the Evolution Process of Rockbursts in Deep Tunnels. J. Rock Mech. Geotechnical Eng. 4 (4), 289–295. doi:10.3724/sp.j.1235.2012.00289
Guo, W., Gu, Q., Tan, Y., and Hu, S. (2019). Case Studies of Rock Bursts in Tectonic Areas with Facies Change. Energies 12 (7), 1330. doi:10.3390/en12071330
He, M. C., Miao, J. L., and Feng, J. L. (2009). Rock Burst Process of Limestone and its Acoustic Emission Characteristics under True-Triaxial Unloading Conditions. Int. J. Rock Mech. Min. Sci. 47 (2), 286–298. doi:10.1016/j.ijrmms.2009.09.003
He, M., Ren, F., and Liu, D. (2018). Rockburst Mechanism Research and its Control. Int. J. Min. Sci. Technol. 28 (5), 829–837. doi:10.1016/j.ijmst.2018.09.002
He, M., Xia, H., Jia, X., Gong, W., Zhao, F., and Liang, K. (2012). Studies on Classification, Criteria and Control of Rockbursts. J. Rock Mech. Geotechnical Eng. 4 (2), 97–114. doi:10.3724/sp.j.1235.2012.00097
Huang, D., and Li, Y. (2014). Conversion of Strain Energy in Triaxial Unloading Tests on Marble. Int. J. Rock Mech. Min. Sci. 66, 160–168. doi:10.1016/j.ijrmms.2013.12.001
Jiang, Q., Feng, X.-T., Xiang, T.-B., and Su, G.-S. (2010). Rockburst Characteristics and Numerical Simulation Based on a New Energy Index: a Case Study of a Tunnel at 2,500 M Depth. Bull. Eng. Geol. Environ. 69 (3), 381–388. doi:10.1007/s10064-010-0275-1
Li, C. L. (2020). Principles and Methods of Rock Support for Rockburst Control. J. Rock Mech. Geotechnical Eng. 13 (01), 46–59. doi:10.1016/J.JRMGE.2020.11.001
Li, D., Zhao, F., and Zheng, M. (2014a). Fractal Characteristics of Cracks and Fragments Generated in Unloading Rockburst Tests. Int. J. Min. Sci. Technol. 24 (6), 819–823. doi:10.1016/j.ijmst.2014.10.014
Li, X., Cao, W., Zhou, Z., and Zou, Y. (2014b). Influence of Stress Path on Excavation Unloading Response. Tunn. Undergr. Space Technol. 42, 237–246. doi:10.1016/j.tust.2014.03.002
Li, Z.-H., Dou, L. M., Lu, C.P., Mu, Z. L., and Cao, A. Y. (2008). Study on Fault Induced Rock Bursts. J. China Univ. Min. Technol. 18 (3), 321–326. doi:10.1016/s1006-1266(08)60068-1
Meng, Q. X., Wang, H. L., Xu, W. Y., and Cai, M. (2018). A Numerical Homogenization Study of the Elastic Property of a Soil-Rock Mixture Using Random Mesostructure Generation. Comput. Geotechnics 98, 48–57. doi:10.1016/j.compgeo.2018.01.015
Peng, J., Wong, L. N. Y., Teh, C. I., and Li, Z. (2018). Modeling Micro-cracking Behavior of Bukit Timah Granite Using Grain-Based Model. Rock Mech. Rock Eng. 51 (1), 135–154. doi:10.1007/s00603-017-1316-x
Potyondy, D. O., and Cundall, P. A. (2004). A Bonded-Particle Model for Rock. Int. J. Rock Mech. Min. Sci. 41 (8), 1329–1364. doi:10.1016/j.ijrmms.2004.09.011
Si, X., and Gong, F. (2020). Strength-weakening Effect and Shear-Tension Failure Mode Transformation Mechanism of Rockburst for Fine-Grained Granite under Triaxial Unloading Compression. Int. J. Rock Mech. Min. Sci. 131, 104347. doi:10.1016/j.ijrmms.2020.104347
Sun, J. S., Zhu, Q. H., and Lu, W. B. (2007). Numerical Simulation of Rock Burst in Circular Tunnels under Unloading Conditions. J. China Univ. Min. Technol. 17 (4), 552–556. doi:10.1016/s1006-1266(07)60144-8
Tan, X., Konietzky, H., and Chen, W. (2016). Numerical Simulation of Heterogeneous Rock Using Discrete Element Model Based on Digital Image Processing. Rock Mech. Rock Eng. 49 (12), 4957–4964. doi:10.1007/s00603-016-1030-0
Wang, L., Lu, Z., and Gao, Q. (2012). A Numerical Study of Rock Burst Development and Strain Energy Release. Int. J. Min. Sci. Technol. 22 (5), 675–680. doi:10.1016/j.ijmst.2012.08.014
Wang, Y., Zhou, X., and Shou, Y. (2017). The Modeling of Crack Propagation and Coalescence in Rocks under Uniaxial Compression Using the Novel Conjugated Bond-Based Peridynamics. Int. J. Mech. Sci. 128-129, 614–643. doi:10.1016/j.ijmecsci.2017.05.019
Wang, Y., Zhou, X., Wang, Y., and Shou, Y. (2018). A 3-D Conjugated Bond-Pair-Based Peridynamic Formulation for Initiation and Propagation of Cracks in Brittle Solids. Int. J. Solids Struct. 134, 89–115. doi:10.1016/j.ijsolstr.2017.10.022
Wang, Y., Zhou, X., and Xu, X. (2016). Numerical Simulation of Propagation and Coalescence of Flaws in Rock Materials under Compressive Loads Using the Extended Non-ordinary State-Based Peridynamics. Eng. Fract. Mech. 163, 248–273. doi:10.1016/j.engfracmech.2016.06.013
Wu, F., Liu, T., Liu, J., and Tang, X. (2009). Excavation Unloading Destruction Phenomena in Rock Dam Foundations. Bull. Eng. Geol. Environ. 68 (2), 257–262. doi:10.1007/s10064-009-0202-5
Xiao, Y.-X., Feng, X.-T., Feng, G.-L., Liu, H.-J., Jiang, Q., and Qiu, S.-L. (2016). Mechanism of Evolution of Stress-Structure Controlled Collapse of Surrounding Rock in Caverns: A Case Study from the Baihetan Hydropower Station in China. Tunn. Undergr. space Technol. 51, 56–67. doi:10.1016/j.tust.2015.10.020
Yin, Y. C., Zhao, T. B., Zhang, Y. B., Tan, Y. L., Qiu, Y., Taheri, A., et al. (2019). An Innovative Method for Placement of Gangue Backfilling Material in Steep Underground Coal Mines. Minerals 9 (2), 107. doi:10.3390/min9020107
Yoon, J. (2007). Application of Experimental Design and Optimization to PFC Model Calibration in Uniaxial Compression Simulation. Int. J. Rock Mech. Min. Sci. 44 (6), 871–889. doi:10.1016/j.ijrmms.2007.01.004
Zhai, S., Su, G., Yin, S., Zhao, B., and Yan, L. (2020). Rockburst Characteristics of Several Hard Brittle Rocks: A True Triaxial Experimental Study. J. Rock Mech. Geotechnical Eng. 12 (2), 279–296. doi:10.1016/j.jrmge.2019.07.013
Zhang, Y., Zhao, T., Yin, Y., Tan, Y., and Qiu, Y. (2019). Numerical Research on Energy Evolution in Granite under Different Confining Pressures Using Otsu's Digital Image Processing and PFC2D. Symmetry 11 (2), 131. doi:10.3390/sym11020131
Zhao, G. Y., Dai, B., and Ma, C. (2012). Study of Effect of Microparameters on Macroproperties for Parallel Bonded Model. Chin. J. Rock Mech. Eng. 31 (7), 1491–1498. doi:10.1007/s11783-011-0280-z
Zhao, T. B., Guo, W. Y., Tan, Y. L., Yin, Y. C., Cai, L. S., and Pan, J. F. (2018). Case Studies of Rock Bursts under Complicated Geological Conditions during Multi-Seam Mining at a Depth of 800 M. Rock Mech. Rock Eng. 51 (5), 1539–1564. doi:10.1007/s00603-018-1411-7
Zhao, T., Yin, Y., Tan, Y., and Song, Y. (2015). Deformation Tests and Failure Process Analysis of an Anchorage Structure. Int. J. Min. Sci. Technol. 25 (2), 237–242. doi:10.1016/j.ijmst.2015.02.012
Zhou, X., Jia, Z., and Wang, L. (2021). A Field-Enriched Finite Element Method for Brittle Fracture in Rocks Subjected to Mixed Mode Loading. Eng. Analysis Bound. Elem. 129, 105–124. doi:10.1016/j.enganabound.2021.04.023
Zhou, X. P., Bi, J., and Qian, Q. H. (2015). Numerical Simulation of Crack Growth and Coalescence in Rock-like Materials Containing Multiple Pre-existing Flaws. Rock Mech. Rock Eng. 48 (3), 1097–1114. doi:10.1007/s00603-014-0627-4
Keywords: rock burst, microsimulation, energy evolution, energy release law, rock block ejection characteristics
Citation: Wang X-Y, Yin Y-C, Xing M-L, Zhang D-D, Chen Y and Wang E-C (2022) Microsimulation Study on Energy Release and Rock Block Ejection Force of Granite under Different Unloading Conditions. Front. Earth Sci. 10:909371. doi: 10.3389/feart.2022.909371
Received: 31 March 2022; Accepted: 05 May 2022;
Published: 29 June 2022.
Edited by:
Fengqiang Gong, Southeast University, ChinaReviewed by:
Xiaoping Zhou, Chongqing University, ChinaYong Fan, China Three Gorges University, China
Copyright © 2022 Wang, Yin, Xing, Zhang, Chen and Wang. This is an open-access article distributed under the terms of the Creative Commons Attribution License (CC BY). The use, distribution or reproduction in other forums is permitted, provided the original author(s) and the copyright owner(s) are credited and that the original publication in this journal is cited, in accordance with accepted academic practice. No use, distribution or reproduction is permitted which does not comply with these terms.
*Correspondence: Yan-Chun Yin, eXljcnNkQDE2My5jb20=