 Xiuquan Hu
 Hong Liu
 Xiucheng Tan
 Chi Yi
 Zhipeng Niu
 Jianghan Li
 Jieyi Li
- 1School of Earth Science and Techology, Southwest Petroleum University, Chengdu, China
- 2College of Energy, Chengdu University of Technology, Chengdu, China
Geologists have made several advances in applying multifractal theory in geology; however, some questions such as a large statistical workload and low efficiency remain unanswered. Thus, this study proposes an image recognition–based method for calculating fault multifractality. First, grayscale processing and binarization of the fault distribution map were performed. The image was then gridded, and the grids were numbered. Subsequently, computer image recognition technology was used to count the number of faults in each grid as a replacement for manual counting. Finally, the fractal dimensions of the faults were calculated using a multifractal box-counting algorithm. This method was successfully applied to fracture studies of the Maokou Formation in southeast Sichuan. Compared to the conventional approach, the proposed method demonstrated considerably improved work efficiency and accuracy. The results showed that the faults in the study area exhibited good statistical self-similarity in the scale range, indicating fractal characteristics. The fractal dimensions of faults with different orientations and the planar distribution of the fractal dimension contours indicate tectonic stages and stress magnitude in the study area. The results indicate that the tectonic setting of southeast Sichuan was formed primarily during the Indosinian, Yanshanian, and Himalayan periods. From the Indosinian to the early Yanshanian periods, NE-trending faults with relatively large fractal dimensions developed under NW–SE compressional tectonic stress. From the Late Yanshanian to Early Himalayan, EW-trending faults were formed by relatively weak N–S compressional stress and had the lowest fractal dimensions. The NW-trending faults formed by intense NE–SW compressional tectonic stress in the Late Himalayan region had the highest fractal dimensions. To promote oil and gas migration and ensure that faults do not destroy the caprock, oil and gas reservoirs must be in a relatively mild tectonic environment. Thus, the fractal dimensions of faults in favorable areas should be neither too high nor too low. The relationship between the fractal dimensions of faults and well test results in southeast Sichuan indicates that the region along the wells “ls1–xia14–guan3” (with fractal dimensions of 1.49–1.57) in the study area is a relatively favorable region for oil and gas preservation.
Introduction
Faults play a vital role in the formation of hydrocarbon reservoirs by providing pathways for oil and gas migration (Woods, 1992; Nagy et al., 2012; Kasyanova, 2018; Gong et al., 2019; Gong et al., 2021; Zeng et al., 2022a). Multiple studies on geological structures (particularly fault systems) have revealed that the distribution and geometry of geological structures exhibit fractal characteristics. Fractal theory is a highly effective tool for quantitatively describing irregular and complex natural structures (Mandelbrot, 1983). It has been widely and successfully employed to describe geological features and reveal inherent formation patterns. For example, Boulassel et al. proposed a multifractal analysis–based method for identifying reservoir fluids that can be used to delineate oil and gas layers and detect fluid properties (Boulassel et al., 2021). Flores-Márquez et al. applied multifractal theory to study the earthquake magnitude series of the Mexican South Pacific region, and Agterberg constructed multifractal and geostatistical models of geochemical element concentrations in rocks and deposits (Agterberg, 2012; Flores-Márquez et al., 2015). Tan et al. analyzed the multifractality of ore-controlling faults in Altay, Xinjiang, China (Tan et al., 2010). Xu et al. performed a multifractal analysis of the fault system in the Nanpu Sag, Jidong Oilfield, China, and identified hydrocarbon accumulation areas (Xu et al., 2019). However, in conventional multifractal studies, the faults in each grid are typically counted manually, and a constantly changing grid length results in a very large workload and low efficiency. If the faults in a certain grid are incorrectly counted, the final calculation result is inaccurate. Thus, this approach has become infeasible with the rapid development of the information era, as it cannot be used to process the vast amount of data required for multiple fault analyses.
In recent years, with the rapid development of image recognition methods, computer image processing and analysis have been extensively applied in oil exploration, and a comprehensive system of methods that yields good results has been achieved (Thompson et al., 2001; Izadi et al., 2015; Ashok et al., 2016; Patel et al., 2016; Yathunanthan et al., 2017; Ma et al., 2018; Kuang et al., 2021). For instance, Budennyy et al. proposed an intelligent lithological method for the description of thin-section images of rocks under polarized light (Budennyy et al., 2017). For oil reservoir descriptions, Tyurin et al. applied Ridge filtering to preprocess borehole image logs for more accurate identification of the bedding interface (Tyurin et al., 2016). Additionally, Semukhin et al. used the SUSAN edge detector to binarize images and introduced an algorithm to calculate the geometric parameters of the fractures and thus describe their features (Semukhin et al., 2019). Shape features, which are among the critical features of images, are stable and do not vary with image color. Fault distribution maps are often used in structural geological research as they consist of a collection of lines, image recognition tools can be applied to them. Therefore, fault counting in multifractal analyses of fault structures can be transformed into pattern recognition tasks. The cross-platform computer vision library OpenCV is one of the most widely used image recognition tools (Bradski, 2008; Hongbo et al., 2020). It has overcome the shortcomings of conventional software, namely, large size and slow running speed, and provides high-efficiency, lightweight graphics, and image processing. The OpenCV recognition process primarily consists of image preprocessing, color extraction, filtering, segmentation, grayscaling, binarization, and fitting and can recognize the contours and colors of images that include different shapes (Zhou et al., 2016a; Wei, 2019). In multifractal analysis of fault structures using computer image recognition, the faults in each grid can be counted automatically, replacing manual counting. The fractal dimensions of all faults in the region and faults with different orientations were then calculated by solving the equations of the multifractal box-counting algorithm. Finally, contour maps of the fractal dimensions were plotted. This method improves the efficiency and reliability of research and reduces production and labor costs. In this study, the fractal dimensions of faults in the entire region of the Maokou Formation in southeast Sichuan and the differences in fractal dimensions between faults with different orientations were analyzed. The results were used to explore the relationship between the fractal dimensions and tectonic stages, geodynamics, and hydrocarbon accumulation. We also searched for favorable oil and gas development areas related to faults and associated fractures. This study introduces a concept and method with broad application prospects for oil and gas exploration.
Geological Background
Southeast Sichuan is in the southeastern part of the Sichuan Basin, spanning Guizhou Province, Chongqing Municipality, and parts of Sichuan Province, including the cities and counties of Shuijiang, Qijiang, Fengdu, Xingwen, Gulin, Tongzi, Chishui, and Renhuai. The main tectonic structure in the Sichuan Basin is part of the East Sichuan arc-shaped high-steep fold belt and the southern low-steep fold belt of the South Sichuan broom-shaped fold belt. These regions have the strongest tectonic movements in the basin (Figure 1). This area is a tertiary geotectonic unit of the Yangtze quasi-platform with widely distributed mountains, hills, and complex geological structures. The terrain is high in the south and low in the north, and karst landforms are common (Xu et al., 2019; Wang et al., 2021; Zhong et al., 2021). The Maokou Formation in southeastern Sichuan is in the interior of the craton basin, where marine carbonate rocks have been deposited. The tectonic uplift of the Dongwu Movement resulted in the exposure of the Maokou Formation limestone to the surface for a long time (8–7 Ma). The Maokou Formation experienced an epigenetic weathering stage that was affected by atmospheric water, and its top surface was exposed to corrosion and weak erosion.
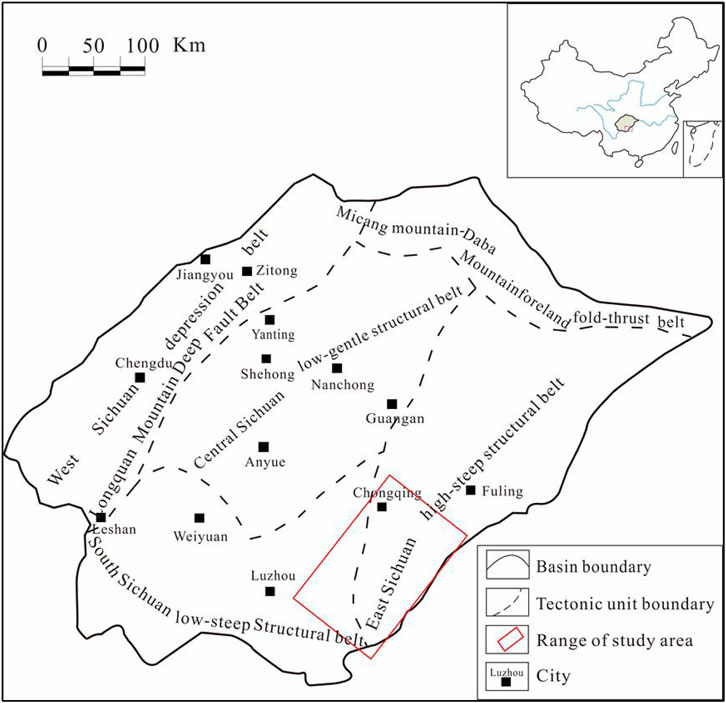
FIGURE 1. Schematic map of geology of southeast Sichuan (modified from Liu et al., 2019)
Concepts and Processes
OpenCV image recognition technology is used in the image recognition–based multifractal analysis of fault structures to automatically count the number of faults in each grid. Multifractal algorithms include box-counting, fixed-radius, and fixed-mass methods (Gao, 2004; Sun et al., 2003; Xie et al., 2002; Xiong et al., 2016; Salat et al., 2017). Because the box-counting method can be applied to images of arbitrary shapes in practical applications with outstanding results, most scholars have used this algorithm to study the fracture fractal dimension value. Therefore, we employed this algorithm in this study. The main steps in the image recognition–based multifractal analysis of fault structures are as follows:
Step 1: The fault distribution map was obtained by a detailed interpretation of seismic cross-sections and seismic attributes.
Step 2: The color fault distribution map is converted into a grayscale image using a color transfer function. The grayscale image was then binarized using the image thresholding function to distinguish the colors representing faults from the background color.
Step 3: The height and width of the fault distribution map were determined, and the initial grid-side length r was set to cover as much of the study area as possible by a mesh using the fewest grids possible. The entire image was divided into N grids numbered 1, 2, 3, … i.
Step 4: The outlines of faults in the grids of the binarized image are detected using the cv2.findContours function in OpenCV, and the number of faults in each grid
Step 5: The number of faults in all grids is summed to obtain the number of faults in the entire region M, and the frequency of fault occurrence in each grid Pi(r) is calculated. The value of parameter q in the multifractal analysis formula was set, and Iq(r) was calculated using this formula (Hu et al., 2014).
M is calculated as follows:
where
Iq(r) is calculated as follows:
where q is the order, which can be any real number in the interval (−∞, +∞).
Step 6: The grid-side length r is gradually reduced to redivide the fault distribution map with continuously finer grids. Steps 2–4 are repeated k times (k ≥ 2) to obtain Iq(r) for different values of r.
Step 7: The Iq(r) values obtained in Steps 1–5 were linearly fitted with different ln(r) values (data for linear fitting should be no less than three groups, five groups, and above best), and the slope of the obtained function was the fractal dimension Dq of the faults in the entire region (Cheng et al., 2020). The regression equation is as follows:
When the correlation coefficient is greater than 0.9, the obtained slope is the fractal dimension Dq of all faults in the region. When q = 0, 1, and 2, Dq corresponds to D0 (the capacity dimension), D1 (the information dimension), and D2 (the correlation dimension), respectively.
Step 8: The values of the fractal dimensions of the faults, Dq, were assigned to the grid center point, and contour maps of Dq were obtained by interpolation.
Step 9: Distribution maps of faults with different orientations are generated, and Steps 2–8 are repeated to obtain the fractal dimensions Dq of faults with different orientations.
Step 10: The differences between the fractal dimensions of all faults in the region and faults with different orientations were obtained from the fractal dimensions of faults with different orientations and a map of fractal dimensions. The relationships between the fractal dimensions of the faults and their distribution density, uniformity, length, bending pattern, tectonic stage, and hydrocarbon accumulation conditions were analyzed.
Specific method flow chart as shown in Figure 2:
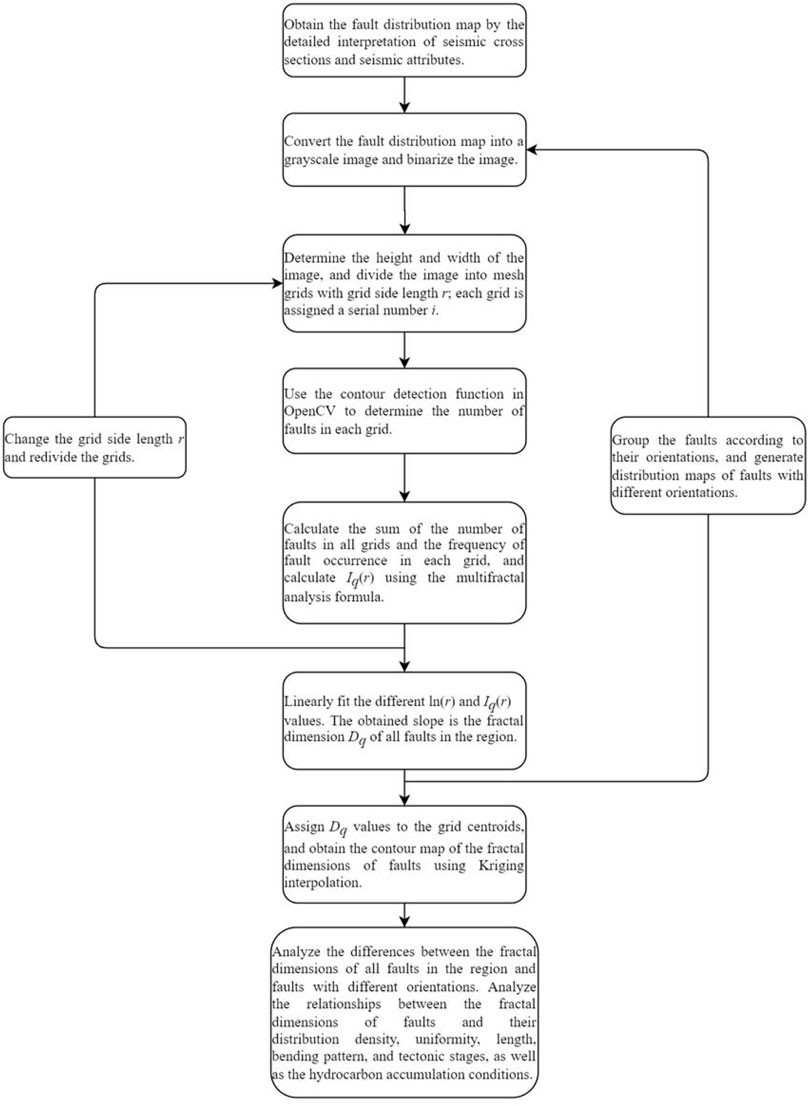
FIGURE 2. Flow chart of image recognition–based multifractal calculation method for fault structures.
Practical Application
Data Processing
Through the collection of two-dimensional seismic line data, we performed detailed horizon tracing and fault interpretation using seismic cross-sections based on synthetic record calibration and then analyzed the planar fault combination patterns and seismic coherence attributes. Next, a fault distribution map of the Maokou Formation in southeast Sichuan was plotted at a scale of 1:250,000 to serve as the base map (Figure 3). This map was converted into a grayscale image using the color transfer function cv2.cvtColor and the grayscale image was binarized using the image thresholding function cv2.threshold. The comparison threshold X was set to 127, that is, pixel points with a grayscale value greater than or equal to 127 were set to 255 (white), and the other pixel points were set to 0 (black). The height and width of the fault distribution map of the Maokou Formation in southeastern Sichuan were determined. To ensure that the initial mesh covered the entire study area with as few grids as possible, we first divided the fault distribution map into 42 square grids with a side length r of 40 km, and the grids were numbered accordingly. The cv2. findContours function in OpenCV was applied to search for fault outlines in the binarized image grids and return the number of faults within each grid, ni, thus completing the fault detection. The number of faults in the entire region M was obtained by summing the number of faults in all grids, and the frequency of fault occurrence in each grid Pi(r) was calculated using ni and M. Parameter q in the multifractal analysis formula was set to −2, −1, 0, 1, and 2, and the corresponding Iq(r) values were calculated by substituting the data into the multifractal analysis formula. The regression curves of ln(r) and Iq(r) were drawn by the linear fitting of five different groups of ln(r) and Iq(r) (Figure 4), and the slope of the regression line was the fractal dimension of the faults, Dq, for each q value. We divided the faults in the study area into three sets according to their orientation: NW-trending-, NE-trending-, and near-EW-trending. When distinguishing NE and NW, we grouped the NNE-trending and ENE-trending faults into NE-trending faults and the NNW-trending and WNW-trending faults into NW-trending faults. In addition, because there were only a few near-NS-trending faults, they were also grouped with NW-trending faults for convenience of analysis. Distribution maps of faults with different orientations were then generated, and the above steps were repeated to obtain the fractal dimensions Dq of these sets of faults.
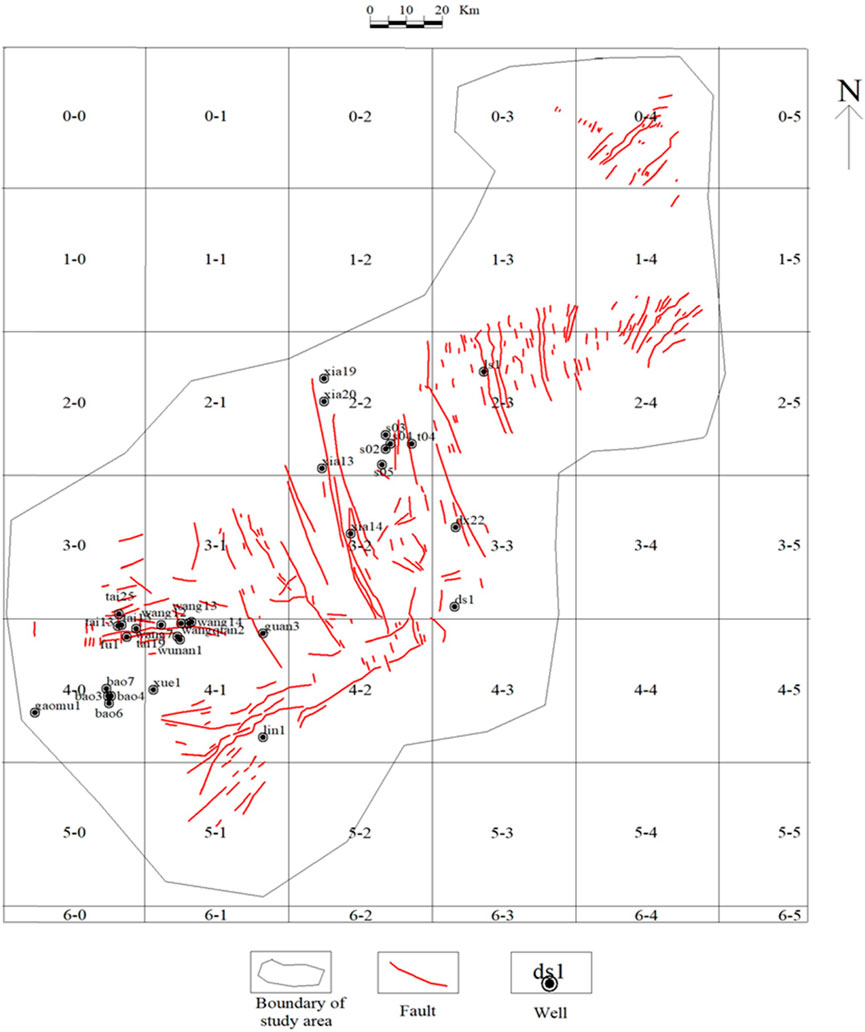
FIGURE 3. Fault distribution map of Maokou Formation in southeast Sichuan (modified from Hu et al., 2014).
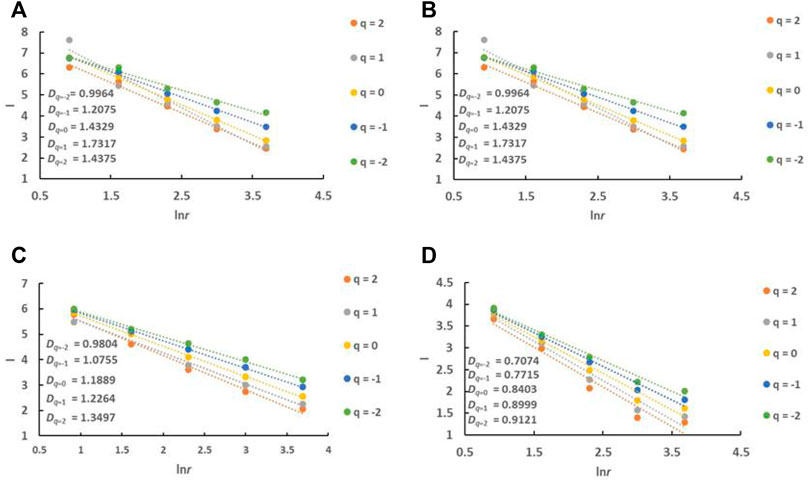
FIGURE 4. ln(r)-Iq(r) curves of fault distribution in Maokou Formation in southeast Sichuan (A) all faults in study area; (B) NW-trending faults; (C) NE-trending faults; (D) EW-trending faults.
Characteristics and Distribution of Fractal Dimensions
The ln(r)–Iq(r) regression curves (Figure 4) display linearity between the Iq(r) and ln(r) values of the faults with different orientations in the Maokou Formation. The absolute values of the regression slopes are the fractal dimensions Dq of the fault structures. The correlation coefficient R2 is > 0.9, indicating that, at a scale of 40–2.5 km, the spatial pattern of fault distribution shows a good statistical match and apparent fractal features. The fractal dimensions of all faults in the region and faults with different orientations both increase as q increases. The fractal dimension of all faults in the Maokou Formation ranges between 0.9964 and 1.7317, with the NW-trending faults ranging between 0.8848 and 1.4196, the NE-trending faults ranging between 0.9804 and 1.3497, and the EW-trending faults ranging between 0.7074 and 0.9121.
The calculated fractal dimensions corresponding to different q values were assigned to the center point of each grid, and contour maps of the fractal dimensions of faults in the Maokou Formation in southeast Sichuan were obtained by planar interpolation (Figures 5–7). Contour maps have the following characteristics. 1) The contour lines of the fractal dimensions generally trend NE–SW. 2) The planar distribution of the fractal dimensions of the faults in the study area shows zonal characteristics, and three regions can be identified. The high-value region lies along with wells, “ls1–xia14–guan3,” whereas the low-value regions are distributed to the northwest and southeast of the high-value region. 3) Overall, the fractal dimension increased gradually with increasing q; however, the distribution range of the high- and low-value regions varied slightly.
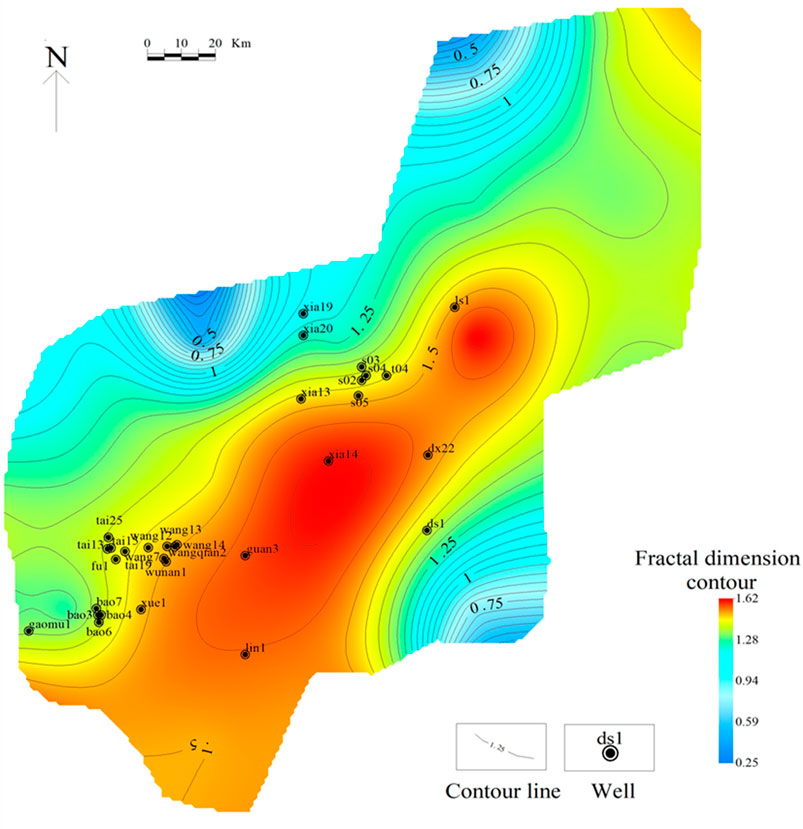
FIGURE 5. Contour map of fractal dimensions of faults in Maokou Formation in southeast Sichuan (q = 0)
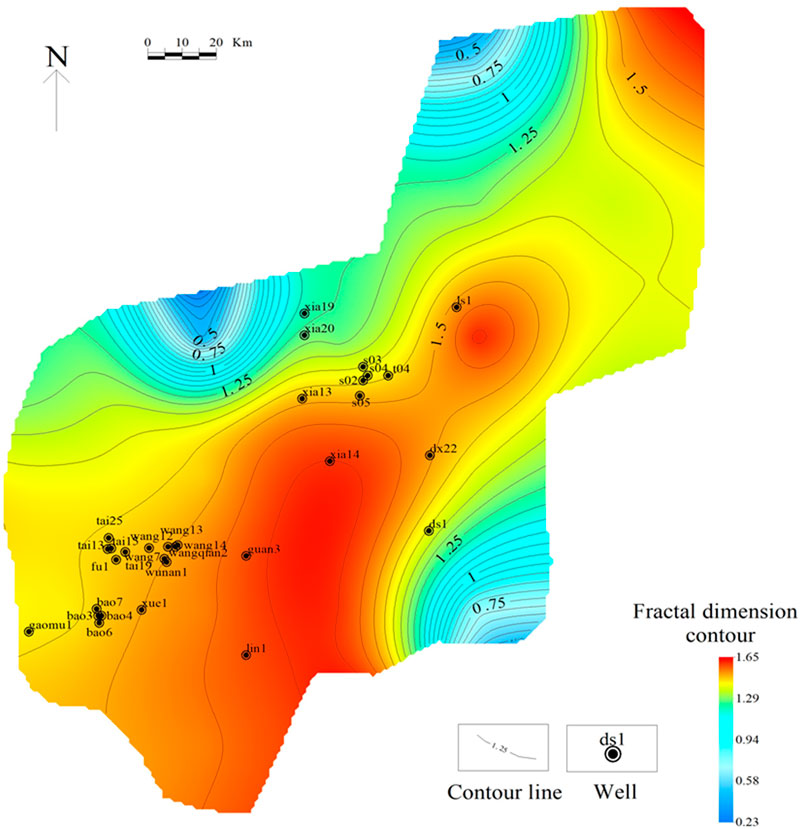
FIGURE 6. Contour map of fractal dimensions of faults in Maokou Formation in southeast Sichuan (q = 1)
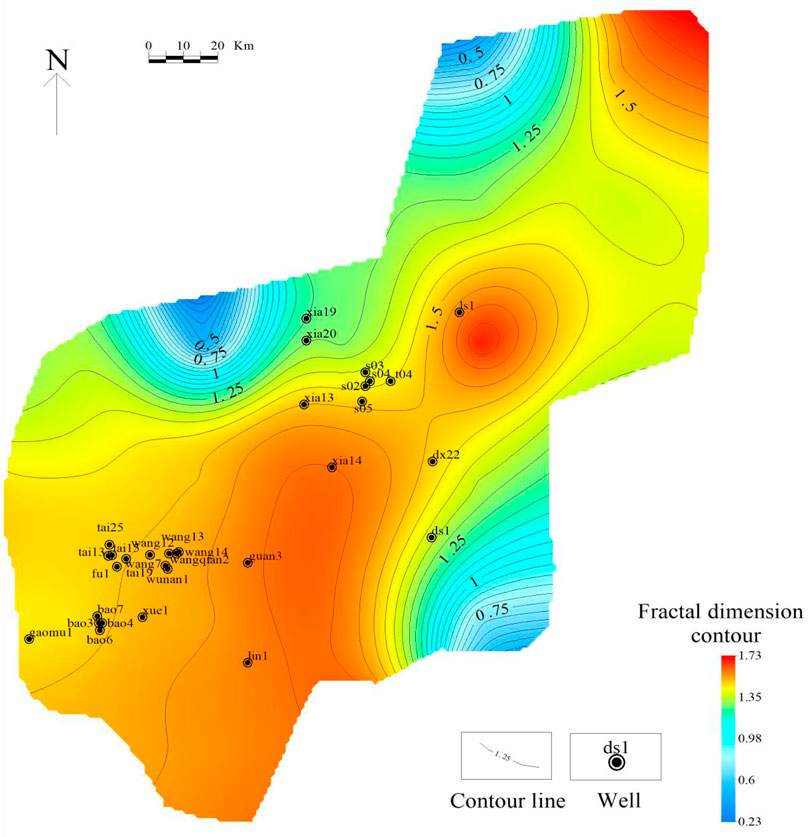
FIGURE 7. Contour map of fractal dimensions of faults in Maokou Formation in southeast Sichuan (q = 2)
Discussion
Comparison With a Conventional Method
In conventional multifractal studies of fault structures, faults are typically counted manually, which is time-consuming, labor-intensive, and inefficient. As the grid-side length decreases, the number of grids increases, and the counting workload increases exponentially. If the faults in a grid are incorrectly counted, the final calculation result will be inaccurate, thereby reducing the reliability of the research. For oil and gas exploration in the big data era, manual counting is not suitable for processing the vast amounts of data used in the multifractal analysis of faults. In this study, we applied image recognition–based multifractal analysis to identify fault structures. We divided the grayscale and binarized fault distribution maps into numbered grids. Next, the faults in each grid were automatically counted using computer image recognition. A comparison of the conventional and image recognition–based methods showed that for a single researcher working 10 h per day, counting would take five days, whereas the proposed method shortened the entire counting time to 5 h and increased the efficiency by a factor of 10, thus solving the problems of low efficiency of manual counting. Moreover, automatic counting increases the accuracy of fault identification; therefore, the results are more reliable. In some cases, the two faults were completely adjacent to each other on the plane map. This method, based on image recognition, cannot effectively distinguish between these two faults, and it is judged as the same fault. To reduce the influence of this situation on the recognition accuracy, the relative positions of the two faults can be manually adjusted to separate them when drawing the fault distribution map in the early stage, which lays a solid foundation for subsequent image recognition. Although it takes a certain amount of time to manually adjust the relative positions of the two faults, the number of faults adjacent to the plane is generally not too large. Therefore, compared with that of the traditional manual counting method, the efficiency of multifractal research based on image recognition faults was significantly improved.
Diversity of Fractal Dimensions of Faults With Different Orientations
We analyzed the relationship between q and the fractal dimensions Dq of all faults in the Maokou Formation in southeast Sichuan and faults with different orientations (Figure 8). Overall, the fractal dimension increased gradually with increasing q. The variation trend of the fractal dimension of the NW-trending faults was almost the same as that of all faults in the region. The fractal dimension of all faults in the region ranged between 0.9964 and 1.7317, with an extreme difference of 0.7353 and a mean value of 1.3612. The NW-trending faults range between 0.8848 and 1.4196, with an extreme difference of 0.869 and a mean value of 1.28974. The NE-trending faults range between 0.9804 and 1.3497, with an extreme difference of 0.3693 and a mean value of 1.16418. The EW-trending faults range between 0.7074 and 0.9121, with an extreme difference of 0.2047 and a mean value of 0.82624. The NW-trending faults have the highest fractal dimensions, and the extreme difference and mean values are closest to those of the fractal dimension of all faults in the region. These results indicate that the NW-trending faults are more complex and active than the NE- and EW-trending faults, with the NW-trending faults being the dominant faults in southeast Sichuan. The differences in the variation trends of the fractal dimensions of faults with different orientations reflect the different mechanisms of fault genesis in the study area.
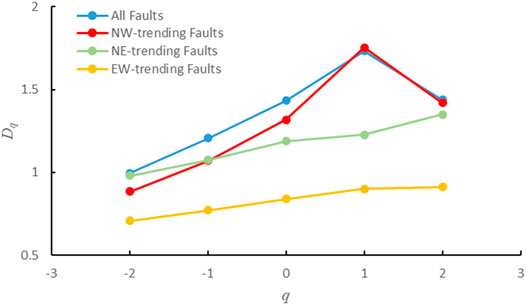
FIGURE 8. Relationship between Dq and q.
Relationships Between Fractal Dimensions and Tectonic Stages and Geodynamics
Southeast Sichuan is in the Tethys-Himalayan and marginal-Pacific tectonic domains. Its tectonic framework is controlled by both the Xuefeng intracontinental tectonic system to the east and the Tibetan Plateau to the southwest and exhibits the characteristics of multistage tectonic superposition (Lv, 2005; Zhao, 2005; Deng et al., 2013; Tang et al., 2021). The geodynamics of the tectonic stages in southeast Sichuan have been extensively analyzed, and the accepted view has shifted from one-stage to multistage tectonic superposition. However, there is still disagreement regarding whether the tectonic setting was shaped in two, three, or four stages (Guo et al., 2016; Jia, 2016; Zeng et al., 2022b; Wang et al., 2022). In addition, there are three main types of in-situ stresses in southeast Sichuan, each with different magnitudes in different geological periods. Based on previous studies of tectonic stages in southeast Sichuan, we investigated the relationship between the fractal dimensions of faults and tectonic stages. We suggest that the magnitude of the fractal dimensions of faults with different orientations and the planar distribution of fractal dimension contours reflect the tectonic stages and in-situ stress magnitudes in the study area. We believe that the tectonic setting of southeast Sichuan formed primarily during the Indosinian, Yanshanian, and Himalayan periods.
Tectonic movements in southeast Sichuan were not complex during the Caledonian-Hercynian primarily tensile environment, which is characterized by lifting movement. Since the Indosinian period, the extensional regime of the Caledonian-Hercynian has gradually transitioned to a NW–SE compressional environment. This regime affected the formation of the tectonic setting of southeast Sichuan (Tan et al., 2013; Tang et al., 2021; Zeng et al., 2022a) and caused NE-trending faults to appear. Since the Early Yanshanian, compressional stress from SE to NW within the Xuefeng tectonic system has been transmitted to southeast Sichuan. However, the thrust faulting effect gradually weakened with increasing distance, and the SE–NW compression was blocked and deflected to some extent (Tang et al., 2021), resulting in a compression–torsion effect in the study area. NE-trending faults continued to develop, and their fractal dimensions are generally large. In addition, the tectonic settings of the central and southern parts of southeast Sichuan differ because the kinematic mechanisms differ. The central part of southeast Sichuan experienced primarily progressive compressional stress, and the high-steep structural belt showed a NW-trending en-echelon pattern. The southern part was dominated by compressional–torsional stress, which resulted in a broom-shaped rotational structure. Therefore, the fault system in the southern Sichuan region became highly developed under compressional–torsional stress. There were more faults, and the southern part of the contour map showed a wider region with high fractal dimensions (Figure 5).
From the Late Yanshanian to the Early Himalayan, the southward thrust of the Qinling orogenic belt was transmitted to southeast Sichuan and blocked by the inherited Luzhou paleo-uplift. In addition, the EW-trending Lushan fault zone was compressed northward, forming near-EW-trending structures in southeast Sichuan (Zhou et al., 2016b; Hu, 2018). During this period, the impact of the tectonic activity was relatively weak. The scale of the EW-trending structural faults is small; thus, their fractal dimensions are low.
From the Late Himalayan period to the present, the East Sichuan arc- and broom-shaped structural belts acquired their current shapes. Under the continuous effect of the collision between the Indian and Eurasian plates, the deformation of the Daliangshan structural belt gradually became more intense and expanded into the basin, forming a NE–SW compressional regime that resulted in the development of NW-trending faults in the study area. This stress regime has persisted to date (Li et al., 2014; Tang et al., 2018). During this period, intense NE–SW-trending forces were superimposed on pre-existing tectonic features, forming NW-trending faults. This set of faults has the highest fractal dimensions, indicating that they were under the greatest tectonic stress. This indicates that the Himalayan period had the strongest influence on the current tectonic setting of southeast Sichuan. After the tectonic stresses in the Indosinian, Yanshanian, and Himalayan periods, a composite pattern consisting of NE-trending, NW-trending, and near-EW-trending structures was formed.
Relationship Between Fractal Dimensions and Hydrocarbon Accumulation
Fractal dimensions of the faults indicate the strength of tectonic movements and the patterns of superposition and neogenesis during fault development in the hydrocarbon basin during different periods. In addition, faults significantly affect hydrocarbon accumulation. Therefore, the fractal dimensions of faults may be related to oil and gas distributions, and thus can serve as an essential parameter for predicting and evaluating hydrocarbon distribution and accumulation patterns. The lateral variation in the fractal dimensions of faults in the study area reflects the spatiotemporal heterogeneity of fault development processes, as well as differences in the geometry of the fault systems. These differences in tectonic evolution directly affect the area of the hydrocarbon-bearing zones and the production of fluid (Zhou et al., 1997). It is generally believed that the fractal dimension comprehensively reflects the scale, distribution density, spatial pattern, and formation mechanism of faults. We defined the wells with test gas production of more than 1 × 10⁴ m3/d in the Maokou Formation in southeast Sichuan as high-producing wells, those with test gas production of (0.1–1) × 104 m3/d as medium-producing wells, and those with production less than or equal to 0.1 × 10⁴ m3/d as low-producing wells. The relationship between the fractal dimensions and oil and gas production during well testing in southeast Sichuan was explored using the capacity dimension (q = 0) as an example (Table 1). Generally, faults are densely distributed in areas containing faults with high fractal dimensions, and their tectonic structures are complex. These faults serve as favorable channels for upward fluid migration. Most of the wells in the relatively high-value region (with fractal dimensions of 1.49–1.57) were medium- to high-producing wells. For example, the test gas production of wells “ls1” and “dx22” are 20.6 × 10⁴ and 16.4 × 10⁴ m3/d, respectively; the test production of well “wang14” is as high as 100 × 104 m3/d, with a good showing of oil and gas. However, faults generated by excessively intense tectonic movements can destroy the hydrocarbon preservation environment and cause the escape or migration of oil and gas. For instance, the fractal dimension of well “xia14” in the core of the high-value area is 1.606, but the presence of oil and gas is poor, appearing as a micro-gas layer in gas testing. The level of fault development is generally low in fault regions with low fractal dimensions. There are too few channels for fluid movement, which is not conducive to the migration and accumulation of oil and gas. For example, the well test results of wells “bao3” and “tai15” in the low-value area reveal gas production of 0.1 × 10⁴ m3/d and a water layer, respectively. In summary, oil and gas reservoirs are expected to appear in relatively mild tectonic environments with low structural relief, facilitating oil and gas migration and ensuring that the faults do not destroy the caprock. Thus, the fractal dimensions of faults in a favorable area should be neither too high nor too low. Considering these factors, we selected two contours with fractal dimensions of 1.49 and 1.57 as boundary lines to divide the study area into three zones. The zone lying roughly along the wells “ls1–xia14–guan3” (with fractal dimensions of 1.49–1.57) is considered relatively favorable for oil and gas perservation in the Maokou Formation in southeast Sichuan (Figure 9).
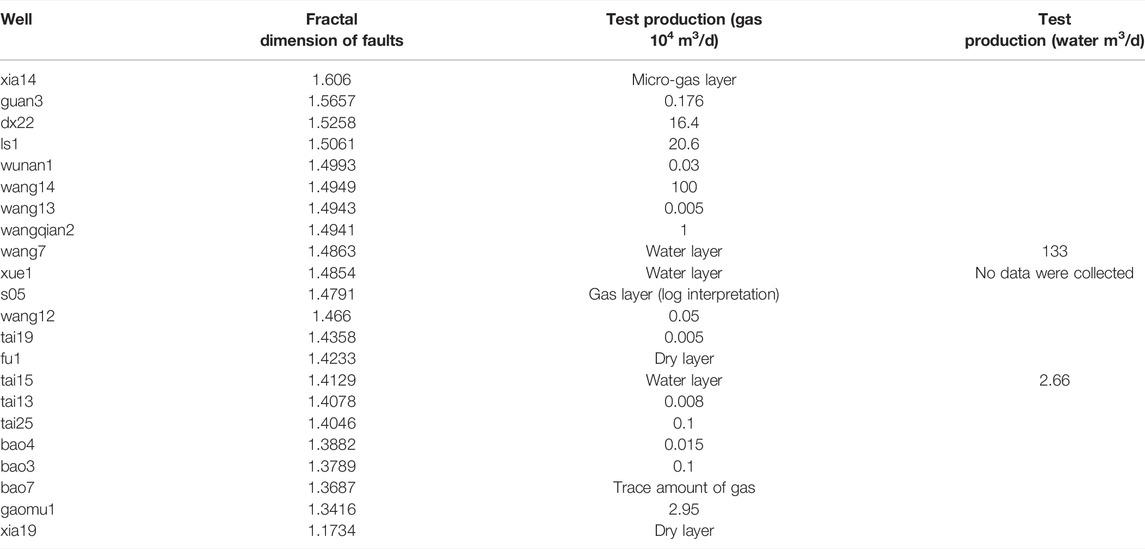
TABLE 1. Fractal dimensions of faults and well test results.
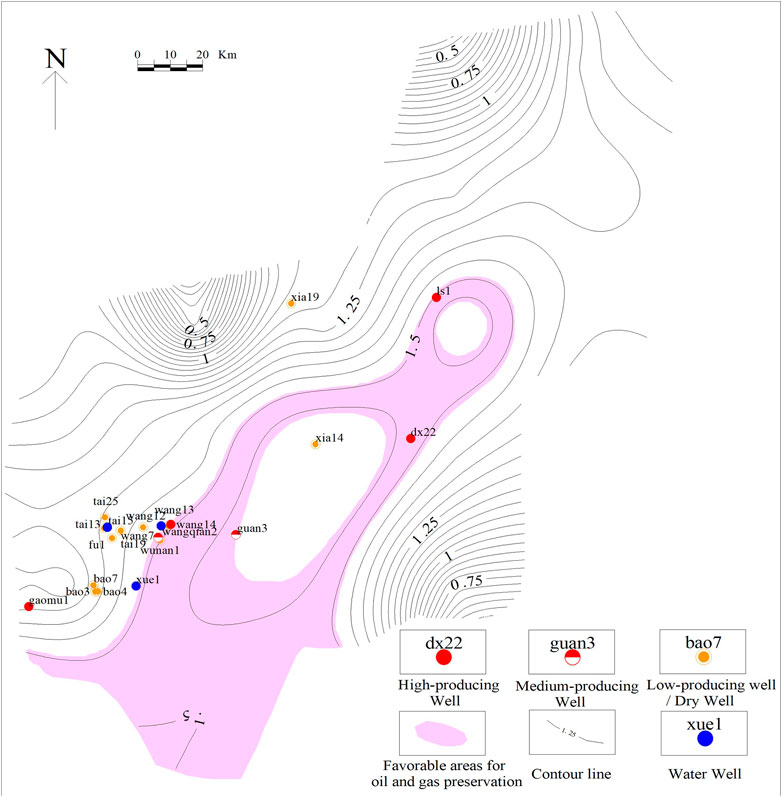
FIGURE 9. Relatively favorable areas for oil and gas preservation in southeast Sichuan (labeled with fractal dimensions of faults).
Conclusion
We analyzed the multifractal characteristics of faults in the Maokou Formation in southeast Sichuan by applying an image recognition–based multifractal calculation method to identify fault structures. The conclusions and insights obtained are as follows:
1. In contrast to the conventional approach, the proposed method uses automatic fault counting with image recognition technology. Consequently, the data processing time and research and labor costs are greatly reduced, and the efficiency is as much as 10 times higher. Moreover, the accuracy of fault counting can be significantly improved, making the results more reliable.
2. The fractal dimensions of faults with different orientations and the planar distribution pattern of fractal dimension contours indicate tectonic stages and stress magnitudes in the study area. The tectonic setting of southeast Sichuan was formed primarily during the Indosinian, Yanshanian, and Himalayan periods. From the Indosinian to the early Yanshanian, NE-trending faults with relatively large fractal dimensions developed under NW–SE compressional tectonic stress. From the Late Yanshanian to the Early Himalayan, EW-trending faults with low fractal dimensions were formed by relatively weak N–S compressional stress. The NW-trending faults formed by intense NE–SW compressional tectonic stress in the Late Himalayan are the dominant faults of the Maokou Formation in southeast Sichuan and have the largest fractal dimensions.
3. Oil and gas reservoirs are expected to appear in relatively mild tectonic environments with low structural relief, which facilitates oil and gas migration and ensures that the faults do not destroy the caprock. Thus, the fractal dimensions of faults in favorable areas should be neither too high nor too low. According to the relationship between the fractal dimensions of faults and the well test results in southeast Sichuan, the region along the wells “ls1–xia14–guan3” (with fractal dimensions of 1.49–1.57) in the study area is recognized as relatively favorable for oil and gas preservation in the Maokou Formation.
Data Availability Statement
The raw data supporting the conclusion of this article will be made available by the authors, without undue reservation.
Author Contributions
XH and HL contributed to the conception and design of the study. XH and XT wrote the first draft of this manuscript. ZN and CY conducted the investigations and data collation. JeL and JiL reviewed and edited the manuscript. All authors contributed to the revision of the manuscript and read and approved the version submitted.
Funding
This study was supported financially by the National Natural Science Foundation of China (Grant No. 42172175).
Conflict of Interest
The authors declare that the research was conducted in the absence of any commercial or financial relationships that could be construed as a potential conflict of interest.
Publisher’s Note
All claims expressed in this article are solely those of the authors and do not necessarily represent those of their affiliated organizations, or those of the publisher, the editors and the reviewers. Any product that may be evaluated in this article, or claim that may be made by its manufacturer, is not guaranteed or endorsed by the publisher.
Acknowledgments
We would like to thank the Sinopec Exploration Company for providing the data and allowing the publication of this article.
References
Agterberg, F. P. (2012). Multifractals and Geostatistics. J. Geochem. Explor. 122, 113–122. doi:10.1016/j.gexplo.2012.04.001
Boulassel, A., Zaourar, N., Gaci, S., and Boudella, A. (2021). A New Multifractal Analysis-Based for Identifying the Reservoir Fluid Nature. J. Appl. Geophys. 185. doi:10.1016/j.jappgeo.2020.104185
Bradski, G., and Kaehler, A. (2008). Learning OpenCV: Computer Vision with the OpenCV Library. M.Sebastopol:" O'Reilly Media, Inc.
Budennyy, S., Pachezhertsev, A., Bukharev, A., Erofeev, A., Mitrushkin, D., and Belozerov, B. (2017). Image Processing and Machine Learning Approaches for Petrographic Thin Section analysisSPE Russian Petroleum Technology Conference Richardson. Society of Petroleum Engineers. doi:10.2118/187885-MS
Deng, B., Liu, S. G., Wang, G. Z., Li, Z. W., Liu, S., and Cao, J. X. (2013). Cenozoic Uplift and Exhumation in Southern Sichuan Basin - Evidence from Low-Temperature Thermochronology. Chin. J. Geophys. 56, 1958–1973.doi:10.6038/cjg20130618
Flores-Márquez, E. L., Ramírez-Rojas, A., and Telesca, L. (2015). Multifractal Detrended Fluctuation Analysis of Earthquake Magnitude Series of Mexican South Pacific Region. Appl. Math. Comput. 265, 1106–1114.
Gao, H. X. (2004). Research and Application of Multifractal Algorithm D. Chengdu: Chengdu University of Technology.
Gong, L., Fu, X., Wang, Z., Gao, S., Jabbari, H., Yue, W., et al. (2019). A New Approach for Characterization and Prediction of Natural Fracture Occurrence in Tight Oil Sandstones with Intense Anisotropy. Bulletin 103 (6), 1383–1400. doi:10.1306/12131818054
Gong, L., Gao, S., Liu, B., Yang, J. G., Fu, X. F., Xiao, F., et al. (2021). Quantitative Prediction of Natural Fractures in Shale Oil Reservoirs. Geofluids 2021. Article ID 5571855, 15 pages. doi:10.1155/2021/5571855
Guo, W. X., Liang, X., and Wei, L. M. (2016). Structure Deformation of Southeast Sichuan and its Influences on Preservation of Shale Gas. Coal Geol. Explor. 44, 21–26. doi:10.3969/j.issn.1001-1986.2016.06.004
Cheng, G. X., Jiang, B., Li, M., Li, F. L., and Xu, S. C. (2020). Quantitative Characterization of Fracture Structure in Coal Based on Image Processing and Multifractal Theory. International Journal of Coal Geology 228.
Hu, J. M. (2018). Research of Structural Characteristics and Genetic Mechanism of the Changyuanba Structural Belt in Southern Sichuan D. Chengdu: Chengdu University of Technology 38, 538–551. Available at: https://kns.cnki.net/kcms/detail/detail.aspx?FileName=1018264988.nhandDbName=CMFD2019.
Hu, X. Q., Shi, Z. J., Tian, Y. M., Wang, C. C., and Cao, J. F. (2014). Multifractal Feature and Significance of Maokou Formation Faults in the Southeast of Sichuan. J. Chengdu Univ. Technol. Sci. Technol. Ed. 41, 476–482. doi:10.3969/j.issn.1671-9727.2015.04.10
Izadi, H., Sadri, J., and Mehran, N.-A. (2015). A New Intelligent Method for Minerals Segmentation in Thin Sections Based on a Novel Incremental Color Clustering. Comput. Geosciences 81, 38–52. doi:10.1016/j.cageo.2015.04.008
Jia, X. L. (2016). Structural Geometry and Kinematics of Southeast Sichuan Basin:Insights into Tectonic Relationship with the Western Segment of Xue Feng Mountain Orogenic Belt D. (Beijing: China University of Geosciences.
Kasyanova, N. A. (2018). The Role of Young Fracturing in the Formation and Spatial Distribution of Hydrocarbon Deposits in the North-Western Caspian Sea. Oij 5, 36–39. doi:10.24887/0028-2448-2018-5-36-39
Kuang, L., Liu, H., Ren, Y., Luo, K., Shi, M., Su, J., et al. (2021). Application and Development Trend of Artificial Intelligence in Petroleum Exploration and Development. Petroleum Explor. Dev. 48, 1–14. doi:10.1016/s1876-3804(21)60001-0
Li, J. Y., Zhang, J., and Liu, J. F. (2014). Major Deformation Systems in the Mainland of China. Earth Sci. Front. 21, 226–245.doi:10.13745/j.esf.2014.03.025
Lv, B. F. (2005). The Tectonization and Petroleum Accumulation in Southeast Sichuan Basin D. Guangzhou Institute of Geoehemistry Chinese Aeademy of Sciences 41, 338–415. Available at: https://kns.cnki.net/kcms/detail/detail.aspx?FileName=2005128952.nhandDbName=CDFD2005.
Ma, W. L., Li, Z. P., and Lu, T. (2018). Application of Machine Vision in Oil & Gas Exploration and Exploitation: A Review. Sci. Technol. Eng. 18, 112–119. Available at: https://kns.cnki.net/kcms/detail/detail.aspx?FileName=TZCZ201902003andDbName=CJFQ2019.
Mandelbrot, B. B., and Wheeler, J. A. (1983). The Fractal Geometry of Nature. Am. J. Phys. 51, 286–287. doi:10.1119/1.13295
Nagy, A., and Tóth, M. T. (2012). Petrology and Tectonic Evolution of the Kiskunhalas-NE Fractured Hydrocarbon Reservoir, South Hungary. Cent. Eur. Geol. 55. doi:10.1556/ceugeol.55.2012.1.1
Patel, A. K., and Chatterjee, S. (2016). Computer Vision-Based Limestone Rock-type Classification Using Probabilistic Neural Network. Geosci. Front. 7, 53–60. doi:10.1016/j.gsf.2014.10.005
Salat, H., Murcio, R., and Arcaute, E. (2017). Multifractal Methodology. Phys. A Stat. Mech. its Appl. 473, 467–487. doi:10.1016/j.physa.2017.01.041
Semukhin, M. V., Yadryshnikova, O. A., Yadryshnikova, O. A., Serkin, M. F., and Chertina, K. N. (2017). Development of a Fracture Recognition System to Read off Experimental Data from Petrographic Thin Section Images. OIJ 05, 27–31. doi:10.24887/0028-2448-2017-5-27-31
Tan, Z. P., Liu, S. G., Deng, B., Li, Z. W., and Sun, W. (2013). Multiphase Structural Features and Evolution of the Southeast Sichuan Tectonic Belt in China [J]. Chengdu Univ. Technol. (Sci. Technol. Ed.) 40 (6), 703–711.doi:10.3969/j.issn.1671-9727.2013.06.10
Tan, K. X., and Xie, Y. S. (2010). Multifractal Mechanism of Faults Control Hydrothermal Deposits in Altay, Xinjiang, China [J]. Geotectonica et Metallogenia 34 (1), 32–39.doi:10.16539/j.ddgzyckx.2010.01.013
Tang, J. G., Wang, K. M., and Qin, D. C. (2021). Tectonic Deformation and its Constraints to Shale Gas Accumulation in Nanchuan Area, Southeastern Sichuan Basin. Bull. Geol. Sci. Technol. 40, 11–21.doi:10.19509/j.cnki.dzkq.2021.0502
Tang, Y., Zhou, L. F., Chen, K. Q., Dong, X. X., and Tang, W. J. (2018). Analysis of Tectonic Stress Field of Southeastern Sichuan and Formation Mechanism of Tectonic Deformation, Scholarly J 64, 15–28. doi:10.16509/j.georeview.2018.01.002
Thompson, S., Fueten, F., and Bockus, D. (2001). Mineral Identification Using Artificial Neural Networks and the Rotating Polarizer Stage. Comput. Geosciences 27, 1081–1089. doi:10.1016/s0098-3004(00)00153-9
Tyurin, E., and Kusov, A. (2016). Quantitative Characterization of River Depositional System Employing Detailed Automated Dip Picking Based on Optimized Ridge filteringSPE Russian Petroleum Technology Conference. Richardson: Society of Petroleum Engineers.
Wang, P. W., Zhang, D. W., Liu, Z. B., Chen, X., Li, P., and Cai, B. (2022). Shale Gas Enrichment Conditions and Primary Controllers of Upper Permian Longtan Transitional Shale in Southeast Sichuan to Northwest Guizhou. Nat. Gas. Geosci. 33, 431–440. doi:10.11764/j.issn.1672-1926.2021.10.005
Wang, Z. F. (2021). Understandings of Maokou Formation-Qixia Formation Gas Reservoirs in Nanchuan Area. Coal Technol., 43–45. doi:10.13301/j.cnki.ct.2021.01.012
Wei, J. (2019). Design of Graphics Recognition System Based on OpenCV. J.Electronic Technol. Softw. Eng. (21), 60–62. Available at: https://kns.cnki.net/kcms/detail/detail.aspx?FileName=DZRU201921037andDbName=CJFQ2019.
Woods, E. P. (1992). Vulcan Sub-basin Fault Styles - Implications for Hydrocarbon Migration and Entrapment. APPEA J. 32 (Papers). doi:10.1071/aj91012
Xie, Y. S., and Tan, K. X. (2002). Fractal Research on Fracture Structures and Application in Geology. Geol. Geochem., 71–77. Available at: https://kns.cnki.net/kcms/detail/detail.aspx?FileName=DZDQ200201011andDbName=CJFQ2002.
Xiong, G., Yu, W., Xia, W., and Zhang, S. (2016). Multifractal Signal Reconstruction Based on Singularity Power Spectrum. Chaos, Solit. Fractals 91, 25–32. doi:10.1016/j.chaos.2016.04.021
Xu, Z. X. (2019). Genesis and Source of Gas in Middle Permian Maokou Formation of Eastern Sichuan Basin. Spec. Oil Gas. Reserv. 16–22. doi:10.3969/j.issn.1006-6535.2019.02.003
Zeng, L. B., Gong, L., Guan, C., Zhang, B. J., Wang, Q. Q., Zeng, Q., et al. (2022). Natural Fractures and Their Contribution to Tight Gas Conglomerate Reservoirs: A Case Study in the Northwestern Sichuan Basin, China [J]. J. Petroleum Sci. Eng. 210. 110028. doi:10.1016/j.petrol.2021.110028
Zeng, Y., Hou, Y. G., Hu, D. F., Hu, S., Liu, R. B., Dong, T., et al. (2022). Characteristics of Shale Fracture Veins and Paleopressure Evolution in Normal Pressure Shale Gas Zone, Southeast Margin of Sichuan Basin. Earth Sci., 1–16. doi:10.3799/dqkx.2022.011
Zhao, Z. W. (2005). The Regional Tectonic Characteristic of Southeast Sichuan Basin and its Control to Oil and Gas Reservoir. Beijing: China University of Geosciences.
Zhong, Y., Yang, Y. M., Wen, L., Luo, B., Xiao, D., Li, M. L., et al. (2021). Reconstruction and Petroleum Geological Significance of Lithofacies Paleogeography and Paleokarst Geomorphology of the Middle Permian Maokou Formation in Northwestern Sichuan Basin, SW China. Pet. explor. Dev. 48, 95–109. doi:10.1016/s1876-3804(21)60007-1
Zhou, L. F., Chen, K. Q., Tang, Y., and Tang, J. G. (2016a). Tectonic Deformation in Qijiang-Chishui Area of South Sichuan since Late Yanshanian. J. Geol., 66–73. Available at: https://kns.cnki.net/kcms/detail/detail.aspx?FileName=DZKQ201604011andDbName=CJFQ2016
Zhou, Q., Wang, J., and Wang, L. L. (2016b). Android Simple Graphics Recognition Based on OpenCV Contour Approximation. Fujian Comput. 32, 122–123.doi:10.16707/j.cnki.fjpc.2016.02.064
Zhou, X. G., Sun, B. S., and Liu, J. H. (1997). Fractal Characteristics of Fault Systems and its Relation to Oil-Gas Traps in Kerkang Oil Field of Liaohe Basin. J. Geomech., 83–89. Available at: https://kns.cnki.net/kcms/detail/detail.aspx?FileName=DZLX701.010andDbName=CJFQ1997
Keywords: image recognition, multifractal, faults, tectonic stages, fractal dimensions of faults
Citation: Hu X, Liu H, Tan X, Yi C, Niu Z, Li J and Li J (2022) Image Recognition–Based Identification of Multifractal Features of Faults. Front. Earth Sci. 10:909166. doi: 10.3389/feart.2022.909166
Received: 31 March 2022; Accepted: 29 April 2022;
Published: 17 May 2022.
Edited by:
Gillian Foulger, Durham University, United KingdomReviewed by:
Fei Ning, SINOPEC Petroleum Exploration and Production Research Institute, ChinaLei Gong, Northeast Petroleum University, China
Copyright © 2022 Hu, Liu, Tan, Yi, Niu, Li and Li. This is an open-access article distributed under the terms of the Creative Commons Attribution License (CC BY). The use, distribution or reproduction in other forums is permitted, provided the original author(s) and the copyright owner(s) are credited and that the original publication in this journal is cited, in accordance with accepted academic practice. No use, distribution or reproduction is permitted which does not comply with these terms.
*Correspondence: Hong Liu, bmQxMjNAMTYzLmNvbQ==