 Hongxing Wang
 Shangwei Wu
 Xiaofei Jing
- Chongqing Key Laboratory of Oil-Gas Production Safety and Risk Control, Chongqing University of Science and Technology, Chongqing, China
Strength and stiffness of stabilized/solidified (S/S) sediments are supposed to be degraded by freeze–thaw cycles (FTs) when applied in constructions in cold regions. In order to reveal the degradation mechanisms, FTs were first simulated on S/S sediments in the laboratory. Then, macrotests including unconfined compression strength (UCS) tests and direct shear tests were conducted on S/S sediments at different FTs to investigate the strength and stiffness changes and microanalyses including scanning electron microscope analysis (SEM), mercury intrusion porosimetry (MIP), and nitrogen adsorption porosimetry (NAP) to investigate the microstructure changes. Macrotests show that strength indexes decrease gradually, stiffness parameters and brittleness increase first and then decrease, the compaction stage of stress–strain curves diminishes first and then increases, the decrease rate of friction angle decelerates first and then accelerates, and the decrease rate of cohesion decelerates first and then keeps stable, for S/S sediments in FTs. Microanalyses have precisely captured the damage chain of S/S sediments: meso and macropores inside sediment aggregates expand gradually during FTs; as a result, sediment aggregates are fractured and stripped off from the solidification skeleton gradually; losing support of sediment aggregates, solidification skeletons are adjusted first and then collapsed when sediment aggregate fracture reaches a limit value. Based on macro and microfindings, a damage model to explain strength and stiffness degradations by microstructure damage is successfully established. Based on the established damage model, a reasonable idea is proposed for promoting the resistance of S/S sediments to FTs.
1 Introduction
A big amount of dredged sediments from oceans, lakes, rivers, and ditches for navigation and environmental purposes have been disposed in oceans or on land annually (Pinto et al., 2011; Park et al., 2016). These disposed sediments have brought environmental pollutions and been limited or prohibited by many countries and regions gradually (Pinto et al., 2011; Zentar et al., 2012; Fu et al., 2022). Meanwhile, solidification/stabilization technology used worldwide to improve weak soils by mixing solidification additives into weak soils is effectively applied for large-scale resource utilization of dredged sediments (Chiang et al., 2016; Cerny et al., 2017; Wu et al., 2018; Zentar et al., 2021; Guo et al., 2022; Han et al., 2022). In production process of stabilized/solidified (S/S) sediments, additives such as cement, lime, fly ash, epoxy resin, MgO-bearing binder, and geopolymer ,etc. are added into and mixed with sediments (Zentar et al., 2012; Wang et al., 2013, 2021; Anagnostopoulos, 2015; Chen et al., 2021; Zhu et al., 2021). Stable structures including solidification skeletons and sediment aggregates are produced by solidification reactions between solidification additives and sediments (Zentar et al., 2012; Lemaire et al., 2013). Compared with traditional filling materials, S/S sediments present higher strength, higher stiffness, and lower cost (Park et al., 2016), and are widely applied in land reclamations, dikes, and embankments (Zentar et al., 2012).
However, S/S sediments will suffer erosions from freeze–thaw cycles (FTs) when they are applied in construction in cold regions (Kamali et al., 2008; Boz and Sezer, 2018). Macro performance of S/S sediments will be degraded by freeze–thaw cycles (FTs) (Boz and Sezer, 2018; Wang et al., 2018). For example, Lake et al. (2017) have successfully produced S/S sediments with high-quality performances by adding cement as solidification agents, but test results showed that hydraulic conductivity increased by 4.5 times and UCS decreased by 40%, when sediments solidified by 3% cement only were exposed to 3 FTs. Boz and Sezer (2018) have effectively applied lime, polypropylene fiber, and basalt fiber to produce S/S sediments with high resistance to FTs, but test results showed that the mass loss of S/S sediments still increased up to 10% by 10 FTs, unconfined compression strength (UCS) decreased 50% at most, and ultra-pulsive velocity decreased nearly 50% at most, when lime is absent. It follows that S/S sediments will suffer hydraulic conductivity increase, strength losses, and mass losses from FTs. However, stiffness change principles under FTs are still not clear enough by now, while stiffness parameters including elastic moduli and deformation moduli are as important as strength parameters in engineering designs and constructions. Zentar et al. (2012) applied siliceous–aluminous fly ash and cement to solidify marine sediments, studied stiffness parameters such as elastic modulus of S/S sediments during curing, and UCS of S/S sediments under FTs, but have not studied elastic modulus changes under FTs. To explore the stiffness changes of S/S sediments in FTs, authors of the present study conducted odometer tests on sediments solidified by cement, lime, and metakaolin under FTs in previous studies (Wang et al., 2019), captured evolution principles of void ratio, compression modulus and consolidation coefficient, and revealed the relative mechanisms by microanalysis. To move forward a single step, the present study is going to explore the evolution principles of stress–strain curves, elastic modulus, and deformation modulus by unconfined compression strength tests.
Moreover, studies have not given enough importance to microstructure evolutions of S/S sediments in FTs, to reveal degradation mechanisms of strength and stiffness. The microstructure of S/S sediments is composed of solidification skeletons, sediment aggregates, and pores, generated by solidification reactions including hydration reactions, ion exchange reactions between hydrates and sediments, pozzolanic reactions between hydrated Ca(OH)2 and sediments, and carbonation reaction between hydrated Ca(OH)2 and CO2 in the air (Bell, 1996; Zentar et al., 2012; Ahmed, 2015; Du et al., 2016; Pu et al., 2019a; Ke et al., 2019). Current studies (Liu et al., 2017; Wu et al., 2017) have indicated that water–ice transformation in the freezing stage of FTs will produce expansion force to damage the inner structure, ice–water transformation in the thawing stage of FTs will produce shrinkage force to damage the inner structure in an inverse direction, and the microstructure of S/S sediments will be destroyed gradually when the two forces work alternatively. But with regard to degradation mechanisms of strength and stiffness by FTs, the following issues remain to need further explorations: 1) Which microstructure components are influenced, the solidification skeletons or sediment aggregates? 2) How are these microstructure components changed, expanded or shrunk? 3) How do microstructure component changes affect the strength and stiffness—what is the damage model?
Studies applied various microanalysis methods such as scanning electron microscopy (SEM), energy-dispersive spectroscopy (EDS), X-ray diffraction (XRD), and mercury intrusion porosimetry (MIP) to reveal the microstructure and substance compositions of S/S sediments (Bell, 1996; Ahmed, 2015; Pu et al., 2019a; Ke et al., 2019). But the most effective methods to analyze the degradation of S/S sediments in FTs are microstructure analyses such as microscopy and porosimetry, rather than material composition analyses such as EDS, XRD, or thermal gravimetric analysis (TGA), since freezing and thawing are physical reactions rather than chemical reactions, no new chemical substances will be produced, but microstructure changed during FTs, (Moon et al., 2009; Wang et al., 2015; Hamidi and Marandi, 2018). For example, Lake et al. (2017) have employed transmitted light optical microscopy and MIP to study the morphology changes and micropore changes of S/S sediments in FTs, to reveal the mechanism of hydraulic conductivity increase, and they captured microcracks generated by FTs, and concluded that hydraulic conductivity increase during FTs was primarily a result of cracking in S/S sediments. Commonly, SEM and MIP are commonly combined to analyze the microstructures of S/S sediments (Wang et al., 2013, 2015). As pointed out by Lake et al. (2017), “significant changes in the damaged areas are not captured via the porosimetry scale” by MIP. The reason is that smaller micropores (˂100 nm) will be damaged by high pressure during the measurement process of MIP (Alderete et al., 2017; Li et al., 2018). Fortunately, nitrogen adsorption porosimetry (NAP) which is maturely used in many industries including shale gas production and air purification can measure smaller pores (˂100 nm) accurately (Pan et al., 2016; Abbaslou et al., 2017). Therefore, NAP is applied in the present study together with SEM and MIP to explore the microstructure of S/S sediments in FTs.
According to the aforementioned analyses, the scope of the present study includes the following: 1) investigate strength and stiffness changes of S/S sediments in FTs by UCS tests and direct shear tests; 2) investigate the microstructure changes of S/S sediments in FTs by SEM, MIP, and NAP; and 3) derive the damage model of S/S sediments in FTs by comprehensive analysis based on the aforementioned test results. These studies will be very conducive to promote the durability of S/S sediments facing the risk of damage from FTs.
2 Materials and Methods
2.1 Materials and Specimen Preparations
Dredged sediments collected from a site in Hubei Province, China, are dark, smelly, muddy, and with delicate texture, as shown in Figure 1A. The initial water content was determined using the oven-drying method, specific gravity was determined using the bottle method, grain size distributions were determined using the sieving method
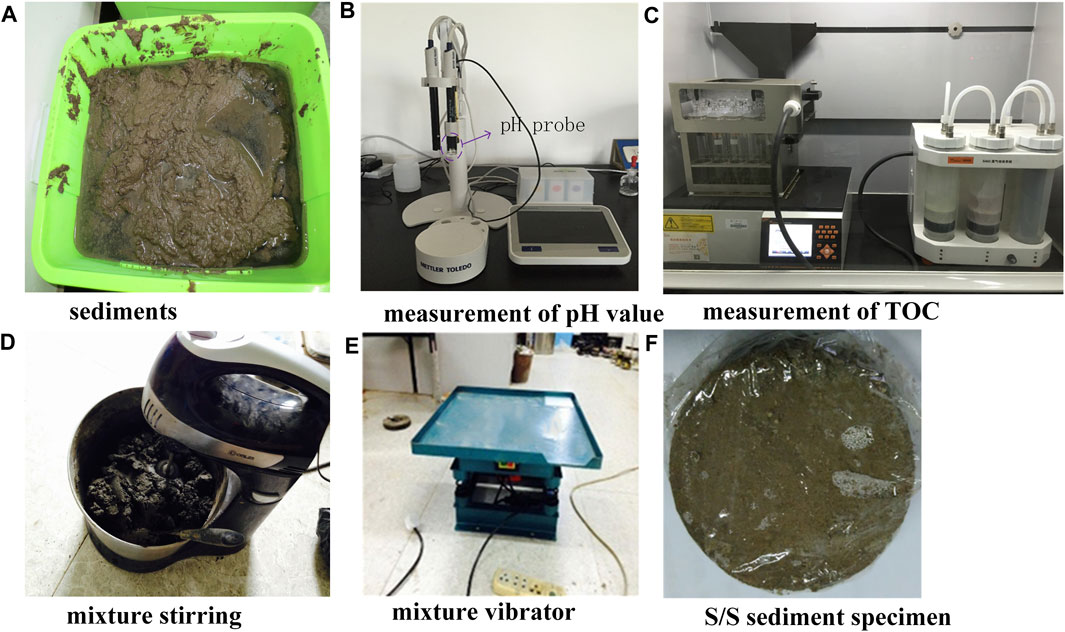
FIGURE 1. Specimen preparations: (A) sediments, (B) measurement of pH value, (C) measurement of TOC, (D) mixture stirring, (E) mixture vibrator, (F) S/S sediment specimen.
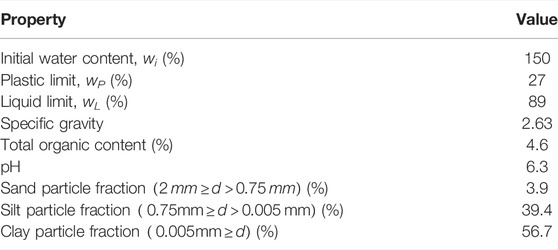
TABLE 1. Physical and chemical indexes of sediments.
Solidification agents including #325 ordinary Portland cement, quick-lime powder with 90% CaO content, and 325 mesh metakaolin were purchased from the market. Cement and lime are commonly used solidification additives for S/S sediments (Lemaire et al., 2013), while metakaolin can quickly react with cement, lime, and other alkaline materials to form a three-dimensional grid solid structure, and is gradually applied in S/S sediments (Ke et al., 2019).
When applied as filling materials in land reclamations, dikes, and embankments, all manufacturing operations of S/S sediments including raw sediment handling, sediments–additive mixing, densifying, and pumping are carried out in the slurry state in a working ship, with the sediment water content larger than the liquid limit (Tang et al., 2001, 2003). Considering this background, the specimen preparations of S/S sediments in the laboratory are also in a slurry state, the water content was first reduced to 100% which is much higher than the liquid limit (Tang et al., 2001, 2003); in a slurry state, the sediments were stirred, mixed with solidification additives (Figure 1D), vibrated for densification inside the mold (Figure 1E), and cured in a constant temperature and humidity chamber (25 ± 2°C, 95 ± 1%) for hardening (Figure 1F).
In order to find the appropriate curing time when samples get “stable,” a series of trial UCS tests were conducted. Typical UCS development of S/S sediments is shown in Figure 2. UCS increased with curing time under standard curing. Before 60 days, strength increased sharply with curing time. After then, the strength increase rate decelerated. For 180 days, the strength increase almost stopped. This means that the strength increase of S/S sediments by solidification reactions stopped at about 180 days, and the strength kept stable after then. This changing rule is in accordance with that of study by Anagnostopoulos (2015), when silty clay soil solidified by resin and cement was cured for 28, 90, and 180 days. In that study by Anagnostopoulos (2015), parameters including UCS, splitting tensile strength, and elastic modulus stopped increasing after 180 days of curing. Therefore, all the samples in the present study were cured for 180 days in the chamber before they were subjected to FTs.
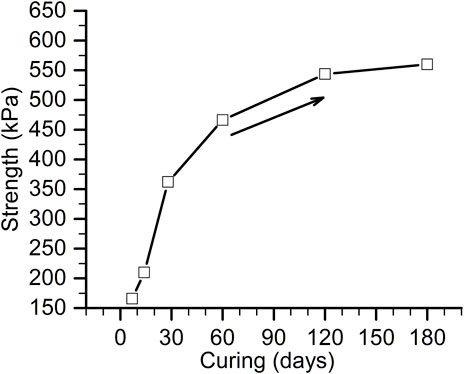
FIGURE 2. Strength development of S/S sediments.
2.2 Test Program
The dosages of additives are different depending on solidified materials (Saride et al., 2013; Du et al., 2014; Zhang et al., 2014; Anagnostopoulos, 2015; Kogbara et al., 2016; Shinsha and Kumagai, 2018; Wu et al., 2019a; Liu et al., 2019). Considering the manufacturing process background of S/S sediment in the slurry state in a working ship as they were applied in an embankment construction, the dosage of additives is supposed to be large in the present study, since the water content and void ratio are high (Anagnostopoulos, 2015; Wu et al., 2019a). In the study by Pu et al. (2019b), river sediments (moisture content = 27%) solidified by 4% cement and 6% lime possessed UCS less than 300 kPa. In the study by Wu et al. (2019a), marine sediments (moisture content = 54.5%) solidified by 20% cement and 5% metakaolin possessed UCS of more than 1,200 kPa. For sediments we collected in the present study (moisture content of the sediments is 100%), UCS of S/S sediments is even smaller than the strength requirements of 600 kPa when 15% of cement is added, suggesting that the amount of solidification additives for these sediments is supposed to be bigger (Wu et al., 2019b). In order to obtain a reasonable mixing proportioning of “sediments: cement: lime: metakaolin,” three different proportions are to be surveyed: proportion A = 100:15:0:0, proportion B = 100:15:5:0, and proportion C = 100:15:5:10. The optimal one will be selected through UCS tests.
When curing of S/S sediments inside constant temperature and humidity chamber is accomplished, they were first saturated using the vacuum saturation method. After then, they were kept in the chamber at −24°C for 24 h for freezing and at 25°C for another 24 h for thawing with a preservative film wrapped to prevent the moisture loss, by referring to ASTM D560-03 (ASTM D560-03, 2015), which made one freeze–thaw cycle. Zero, 3, 6, 12, and 18 FTs were conducted on S/S sediments, respectively (Lake et al., 2017; Boz and Sezer, 2018; Wang et al., 2018). Simultaneously, macro and microanalyses including UCS tests, direct shear tests, SEM, MIP, and NAP were conducted on S/S sediment samples at specified FTs.
2.3 Test Methods
The UCS test was carried out on a strain-controlled universal testing machine with a loading velocity of 0.08 mm/min, by referring to ASTM D4219-02 (ASTM D4219-02, 2003). The specimen was a cylinder with 50 mm in diameter and 100 nm in height.
A direct shear test was conducted on a direct shear apparatus using the consolidation quick shear method. The specimen was a cutting ring specimen with 79.8 mm in diameter and 20 mm in height. When specimen deformation was stable under fixed normal pressure (deformation in 1 h is smaller than 0.01 mm), shearing started with a speed of 0.8 mm/min, by referring to ASTM D3080-04 (ASTM D3080, 2003). Normal pressure was set to be 100, 200, 300, and 400 kPa, respectively.
All S/S sediment specimens for microanalyses were cut from direct shear test samples, before testing. Lyophilization treatment was conducted on every specimen before microanalyses. Lyophilization treatment can remove the moisture inside S/S sediments at liquid-nitrogen temperature (−196°C) in a vacuum, and will not damage the microstructures of S/S sediments as compared with the traditional oven-drying method. Although SEM and MIP are widely used for the microstructure analysis of S/S sediments and tests methods are mature (Wang et al., 2013, 2015), NAP is rarely used for S/S sediments (Pan et al., 2016; Abbaslou et al., 2017). Therefore, only the NAP method is introduced in detail in the present study.
With a 0.5 cm3 cubic sample, NAP analysis was performed on a NOVO Touch LX2 nitrogen adsorption analyzer. According to isothermal adsorption/desorption volume—pressure curves obtained by NAP, pore sizes can be determined using the BJH method (Pan et al., 2016). In the BJH method, measured pores are assumed to be cylinder pores. In the adsorption stage, nitrogen will be adsorbed on the pore surface under liquid-nitrogen temperature. With an increase in the relative pressure (ratio of present pressure to saturation pressure) of nitrogen, the thickness of the adsorbed layer increases. The relationship between the adsorbed-layer thickness and relative pressure can be expressed using the Hauser formula as follows (Abbaslou et al., 2017):
where
Additionally, the capillary condensation of nitrogen will take place when relative pressures reach limit pressures of different sizes of pores. The smaller pores will be filled first by nitrogen capillary condensation, and bigger ones will be filled when the relative pressure increases. When the relative pressure reaches 1, all the pores will be filled. In the desorption stage, the relative pressure decreases gradually from 1 to 0, liquid nitrogen inside bigger pores will evaporate first, and then inside the smaller ones. Based on thermodynamic principles in the capillary, the relationship between the capillary meniscus curvature radius of pores and limit relative pressures can be expressed using the Kelvin formula as follows (Abbaslou et al., 2017):
where
The pore size of S/S sediments is the sum of capillary meniscus curvature radius
3 Results and Discussion
3.1 UCS Test Results
3.1.1 Characters of Strain–Stress Curves
Strain–stress curves of S/S sediments in FTs are all strain-softening curves as shown in Figure 3. In the initial stage, there was a compaction stage with a very small stress increase, standing for the compaction of microcracks or weak pores. After then, the hardening stage began and stress increased monotonously before the peak (UCS). Finally, stress decreased monotonously after the peak, standing for the softening stage.
FIGURE 3. Strain-stress curves S/S sediments in FTs: (A) Proportion A, (B) Proportion B, (C) Proportion C.
There were some differences among the three S/S sediments. The compaction stage was the most obvious in proportion A and the least obvious in proportion C, suggesting that the addition of lime and metakaolin will reduce the existence of original cracks or weak pores in S/S sediments. As analyzed earlier, FTs will produce the expansion force and shrinkage force to damage the original structures of S/S sediments, and produce more cracks or weak pores. Therefore, the compaction stage of S/S sediments is supposed to increase with the increase of FTs. But according to Figure 3, the compaction stage was diminished by 6 FTs and then increased afterward, indicating that FTs will diminish original cracks or weak pores during the first 6 FTs. This is in contrast to conventional knowledge, and supposed to be proved or denied by microstructure analysis.
In the hardening stage, the failure of proportion A was the most brittle, and that of proportion C was the most ductile. The hardening curves of proportion A were composed of two straight stages: one close to the compaction stage with a smaller gradient, and the other one close to the UCS peak with a bigger gradient. In proportion B, when 5% lime was added, the failure character was more ductile, and the second straight line bent. In proportion C, when 10% metakaolin was added, the failure character was completely ductile, and gradients of curves before the peak decreased to 0 gradually. This indicates that lime and metakaolin will decrease the brittleness of S/S sediments, which is beneficial to engineering stability and safety. But with the increase in FTs, the brittleness of all the three S/S sediments increased first and then decreased.
In the softening stage, residual strength was obvious in proportion A, curves dropped sharply before the residual strength, and then stress kept stable with the increase of strain. When additional 5% lime and 10% metakaolin were added in proportion B and proportion C, the residual strengths were very hard to be captured, and S/S sediments lost efficacy fast after the peak. With the increase in FTs, the residual strength of proportion A diminished gradually. Residual strength is very important for avoiding the sudden collapse of the constructed project, when the constructed project such as embankments or dikes lost their stability.
3.1.2 UCSs and Optimal Proportion of Solidification Agents
UCSs of the three S/S sediments in different FTs are shown in Figure 4. UCSs decreased when S/S sediments were exposed to more FTs. The variation trend is similar to that of the study by Boz and Sezer (2018), when sediments solidified by lime, basalt fiber, and polypropylene fiber were exposed to 0–10 FTs. In proportion A, the decrease was much less before 6 FTs as compared with at 12 FTs and 18 FTs, and total 36% of the strength was lost from 569.38 to 364.75 kPa in 18 FTs. In proportion B, UCS was reduced linearly by the increase of FTs, and total 28% of the strength was lost from 801.88 to 573.75 kPa. In proportion C, UCS was diminished linearly and parallel to that of proportion B, and total 28% of the strength was lost from 908.13 to 655.00 kPa. By this token, proportions B and C present better resistance to FTs.
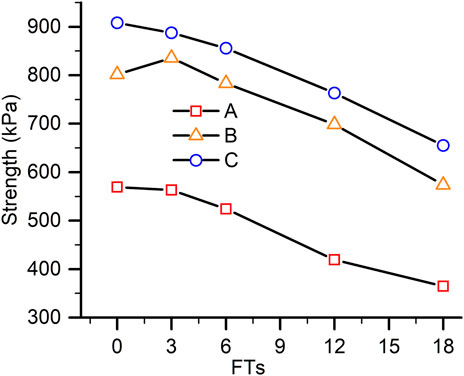
FIGURE 4. UCSs of S/S sediments in FTs.
Notably, UCS in proportion B was enhanced significantly when 5% lime was added, and resistance to FTs was improved, compared with proportion A. UCS in proportion C increased much less when 10% metakaolin was added. Thus, based on this discovery, the following tests including the direct shear test, SEM, MIP, and NAP to explore strength and stiffness degradation principles and mechanisms of S/S sediments by FTs, were all conducted on proportion B only.
3.1.3 Deformation Indexes
Elastic modulus (tangent modulus) and deformation modulus (secant modulus) are indexes to evaluate the deformation resistance of S/S sediments to loading. Elastic moduli of S/S sediments obtained from strain–stress curves in Figure 3 are shown in Table.2. According to the test standard (ASTM D4219-02, 2003), the elastic modulus is the gradient of straight line in the strain–stress curve. However, there are two straight lines between the compaction stage and UCS peak in strain–stress curves in proportion A, as shown in Figure 3. For simplicity, the elastic modulus in proportion A adopted the gradient of the first straight line in strain–stress curves, based on the definition of elastic modulus. In proportions B and C, there was just one straight line and one elastic modulus for each.
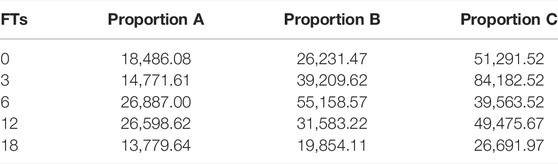
TABLE 2. Elastic modulus of S/S sediments in FTs (kPa).
As shown in Table.2, elastic moduli increased and then decreased in FTs for all the 3 S/S sediments. Moreover, elastic moduli in proportion B increased more in every FTs as compared with proportion A, and elastic moduli in proportion C increased more prominently as compared with proportions A and B. This implies that metakaolin can improve the stiffness remarkably though not effective in strength enhancing.
Deformation moduli obtained from strain–stress curves in Figure 3 are shown in Table 3. Deformation modulus evolution of S/S sediments in different FTs exhibited the same principle as the elastic modulus, which increased with FTs first, and then decreased. The addition of 5% lime and 10% metakaolin improved deformation moduli a lot.
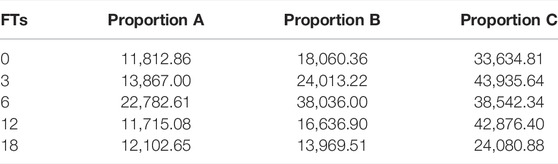
TABLE 3. Deformation modulus of S/S sediments in FTs (kPa).
Since both elastic modulus and deformation modulus of S/S sediments increased first and then decreased during FTs, it is reasonable to infer that the erosion of FTs to S/S sediments is successive, but abrupt changes happened in the successive erosion course. For both elastic modulus and deformation modulus, they started to decrease from 6 FTs in proportions A and B, and started to decrease from 3 FTs in proportion C.
3.2 Direct Shear Test Results
A direct shear test is a basic test to obtain constitutive parameters (cohesion and friction angle) for stability evaluations of S/S sediments constructed projects. Shear strengths and constitutive parameters in different FTs are shown in Figures 5, 6 respectively. Under any specific normal stresses, strengths decreased as FTs increased. Cohesion dropped from 109.65 kPa (0 FTs) to 71.35 kPa (18 FTs) with increase of FTs, 30% of cohesion was lost in total. The friction angle decreased from 30.2 to 22.64° with the increase in FTs, and 25% of the friction angle was lost in total.

FIGURE 5. Shear strengths of S/S sediments in FTs.
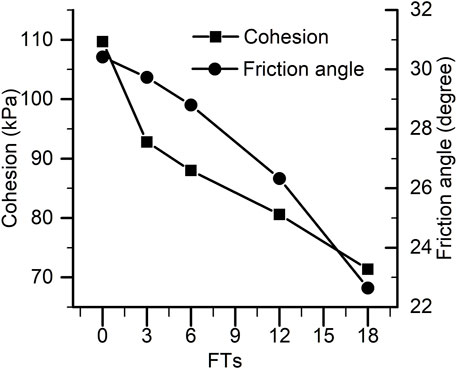
FIGURE 6. Constitutive parameters of S/S sediments in FTs.
The decrease rate of cohesion decelerated from 0 to 6 FTs, and then kept stable. The decreased rate of friction angle decelerated from 0 to 6 FTs, and then started to accelerate until 18 FTs. This indicates that the abrupt change in FT erosion occurred at around 6 FTs, based upon the aforementioned analysis of elastic modulus and deformation modulus. This inference is supposed to be proved or denied by microstructure analysis.
3.3 Microstructure Analysis by SEM
SEM images of S/S sediments in FTs are shown in Figure 7 on the scale of 20 µm. S/S sediments are in a ternary structure composed of solidification skeletons, sediments, and pores distributed randomly as shown in Figure 7B, presenting a similar structure to sediments solidified by cement, lime, and fly ash in the study performed by Wang et al. (2013). Sediments appeared as sediment aggregates all the time. No obvious cracks were observed initially. Smaller sediment particles were adsorbed on the surface, presenting a stable structure. When S/S sediments were exposed to FTs, smaller particles were flushed, microstructures were revealed, and cracks were generated inside the sediment aggregates. With the increase in FTs, pores were destroyed, and cracks inside sediment aggregates developed in size and quantity. At 12 FTs, cracks at the interfaces between solidification skeletons and sediments appeared gradually, and joint cracks occurred. At 18 FTs, cracks were crisscross, some areas were destroyed, and solidification skeletons were almost separated from the sediments. All the cracks were inside sediments, or at the interfaces between solidification skeletons and sediment aggregates. No solidification skeletons were cut off and no cracks inside the skeletons were observed. The occurrence of joint cracks after 6 FTs has explained why evolution tendencies of elastic modulus, deformation modulus, cohesion, and friction angle started to change after 6 FTs.
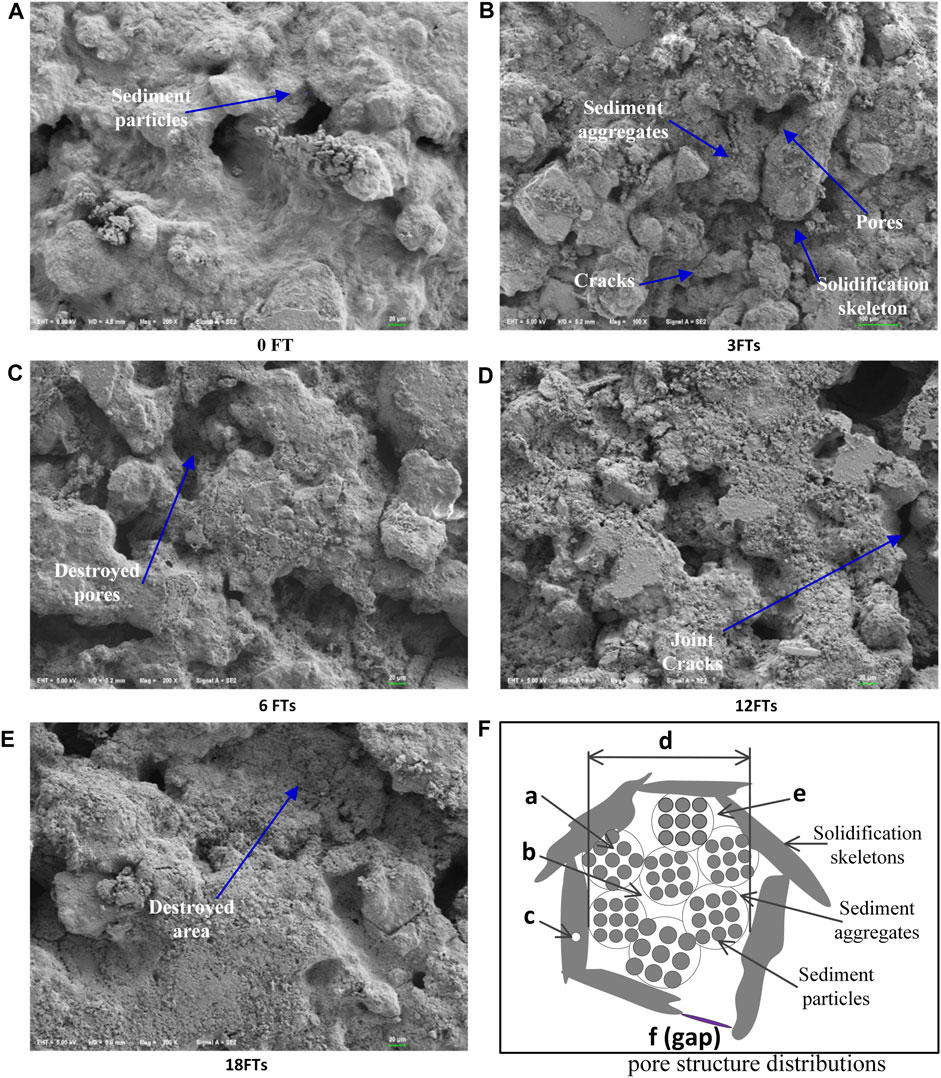
FIGURE 7. Microstructures of S/S sediments in FTs: (A) 0 FT, (B) 3 FTs, (C) 6 FTs, (D) 12 FTs, (E) 18 FTs, (F) pore structure distributions.
According to these SEM images, developments of pores represent the damage course of S/S sediment microstructure. Micropores inside S/S sediments include the following types as shown in Figure 7F: 1) pores among sediment particles inside sediment aggregates, 2) pores among sediment aggregates, 3) pores inside solidification skeletons, 4) pores among solidification skeletons, 5) pores at the interfaces between solidification skeletons and sediment aggregates, and 6) gaps between solidification skeletons. As shown in Figures 6E, 7A, the changes in pores among sediment aggregates and the interfaces between solidification skeletons and sediment aggregates are visible, the changes in pores among solidification skeletons and the gaps between solidification skeletons are not clear, and the changes in pores among sediment particles inside sediment aggregates and those inside solidification skeletons are invisible. Therefore, porosimetry including MIP and NAP is appended for further investigation of the microstructure of S/S/sediments.
3.4 Microstructure Analysis by MIP
Cumulative intrusion—pore size curves of S/S sediments at different FTs are shown in Figure 8. The end of the three intrusion curves moved upward in FTs, suggesting that the total pore volume increased, and pores among solidification skeletons were expanded. As discussed earlier, Lake et al. (2017) have also studied the microstructure of S/S sediments before and after being exposed to 3 FTs by MIP. In their study, for sediments solidified by 3% cement, the pore volume of “dry” samples decreased after being exposed to FTs, while the pore volumes of “wet” samples and “optimum” samples increased after exposed to FTs. For sediments solidified by 6% cement, the pore volume of “dry” samples increased after being exposed to FTs, while the pore volumes of “wet” samples and “optimum” samples decreased after being exposed to FTs. It is summarized that the pore volume changes of samples after being exposed to FTs are different according to the amount of solidification additives and moisture content. In the present study, the moisture content of sediments is 100%, 10% cement and 5% lime are applied to solidify sediments. Also, the pore volume change principle in the present study is accordant with those of “dry” samples solidified by 3% cement and “wet/optimum” samples solidified by 6% cement in the study performed by Lake et al. (2017), suggesting that the pore volume changes in the present study are reliable.
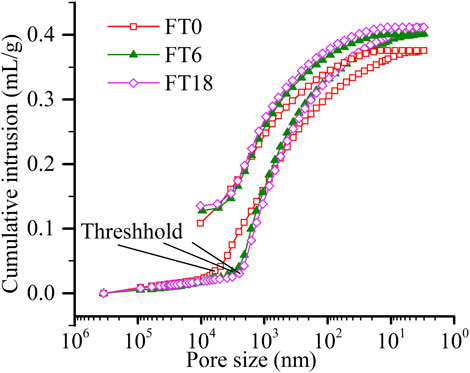
FIGURE 8. Cumulative intrusion curves of S/S sediments in FTs by MIP.
Threshold values representing the initial intrusion of mercury into S/S sediments reduced in FTs as shown in Figure 8. In the intrusion process of mercury, mercury is supposed to intrude into S/S sediments through gaps among solidification skeletons first. In other words, threshold values stand for sizes of the gaps. Therefore, it is concluded that, when solidification skeletons were adjusted under the alternant influence of expansion and shrinkage forces in FTs, the gaps diminished. Correspondingly, the compaction stages reduced first during the first 6 FTs as shown in strain–stress curves in Figure 3, due to the diminishment of gaps (weak pores) among solidification skeletons. But as shown in Figure 7, joint cracks occurred after 6 FTs, so the compaction stages of S/S sediments increased again. In a similar way, elastic modulus, deformation modulus, and brittleness increased first due to the diminishment of gaps and then decreased due to the occurrence of joint cracks, and the friction angle decrease rate decelerated first due to the diminishment of gaps and then accelerated due to the occurrence of joint cracks.
As shown in Figure 9, incremental intrusion—pore size curves of S/S sediments contain two peaks—one close to 105 nm (Peak 1) and the other close to 2 × 10³ nm (Peak 2), which is accordant with the study performed by Lake et al. (2017). In FTs, the position of peak 2 moved toward the smaller size direction while position of peak 1 did not shift, the pore volume near peak 2 increased significantly, presenting similar principles as evolutions of “optimum” sediments solidified by 3% cement in FTs in the study performed by Lake et al. (2017). This indicates that the volume of smaller pores increased in FTs. Additionally, an inversion point in incremental curves existed at about 2 × 10³ nm. Before the inversion point, the curve at 0 FT was always above the others; and after that point, the curve at 0 FT was always below the others. This means that bigger pores (>2 × 10³ nm) were destroyed by FTs, and transformed into smaller ones. The reasons are as follows: 1) water is stored inside sediment aggregates; in FTs, 2) expansion forces in the freezing stage and shrinkage force in the thawing stage directly work inside the sediment aggregates, and then 3) some of the sediment aggregates fractured into smaller aggregates, pores among sediment aggregates transformed into pores among smaller fractured sediment aggregates, or pores among sediment particles. The aforementioned analysis can be proved by the expansion of interfaces between sediments and solidification skeletons as shown in Figure 7, since sediment aggregates fractured and were stripped off from solidification skeletons. Moreover, it is concluded that pores among sediment aggregates are bigger than 2 × 10³ nm.
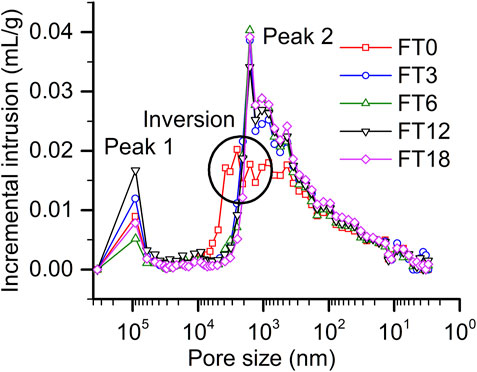
FIGURE 9. Incremental intrusion curves of S/S sediments in FTs by MIP.
When sediment aggregates fractured, they were stripped off from solidification skeletons. As a result, solidification skeletons lost support, and strength of S/S decreased under FTs. With sediment aggregates being stripped off gradually, skeletons adjusted, and gaps between skeletons diminished correspondingly. When more sediment aggregates were fractured, solidification skeletons could not keep stable and collapsed. As a result, pores among skeletons (“d” in Figure 7F) diminished, smaller pores were produced, and joint cracks occurred after 6 FTs.
As shown in Figure 9, pore-size distribution differences in FTs are not clear for those <102 nm. In the study performed by Lake et al. (2017), differences between control samples and samples exposed to FTs cannot be captured by MIP either, for pores smaller than 102 nm in diameter. The reason is that the measurement of smaller pores is not accurate by MIP, since smaller pores are damaged by MIP high pressures. They have proposed this problem, but have not given proper methods to solve it. In the present study, NAP is appended to analyze the smaller pores of S/S sediments (<100 nm). In NAP measurements, pressure is not high enough to damage pore structures.
3.5 Microstructure Analysis by NAP
Cumulative pore volume/incremental pore volume—pore size curves of S/S sediments at different FTs obtained by NAP are shown in Figure 10. For all the cumulative curves, initial parts coincided before 20 nm, indicating that FTs had no significant influence on pores smaller than 20 nm. After 20 nm, the curve moved upward at 0 FT, maintained the gradient at 6 FTs, and moved downward at 12 FTs, indicating that FTs reduced the volume of pores in the measured pore size range.
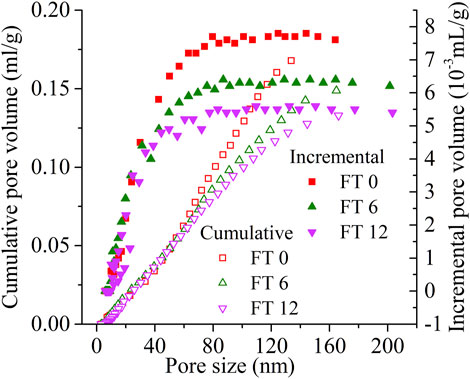
FIGURE 10. Pore size distributions of S/S sediments in FTs by NAP.
For all the incremental curves, curves can be divided into two sections: before pore size of 20 nm, and after that. The difference among the 3 S/S sediments was not very clear before 20 nm. When pore sizes were bigger than 20 nm, the gradient started to decline in every curve, and then trended to be stable. Under the influence of FTs, curves dropped downward correspondingly, implying that FTs reduced the volume of pores bigger than 20 nm, the same as the situation in the cumulative pore volume—pore size curves.
According to IUPAC classification, pores obtained can be classified as micropores, mesopores, and macropores (Sing et al., 2008), as shown in Table 4. The total pore volume decreased with FTs. Micropores have not been detected by NAP. Mesopores accounted for more than 70% of the pore volume, and their volume ratio decreased first and then increased with FTs. Macropores accounted for less than 30%, and their volume ratio increased first and then decreased with FTs. Meanwhile, the macropore volume ratio increased as compared with the mesopore all the time. Combined with the analysis shown in Figure 10, it is concluded that FTs transformed some mesopores into macropores, and transformed some macropores into pores even bigger than 200 nm that cannot be measured in the present NAP analysis. According to the SEM images in Figure 7, these changed pores are those inside sediment aggregates. When pores inside sediment aggregates were expanded, sediment aggregates were destroyed gradually. As a result, solidification skeletons were adjusted and collapsed, and joint cracks occurred.
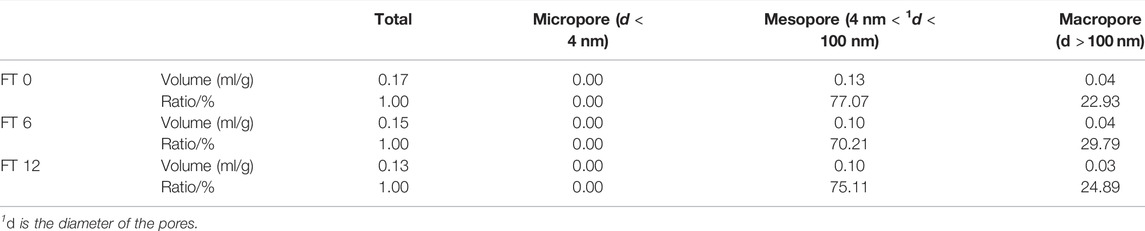
TABLE 4. Pore size distributions of S/S sediments during FTs by NAP.
Before 6 FTs, some mesopores were expanded into macropores, and some macropores were expanded into those bigger than 200 nm; as a result, the mesopore volume decreased while the macropore volume was not changed. After 6 FTs, the mesopore volume was not changed while some macropores decreased, since they were still expanded into those bigger than 200 nm. Combined with the analysis by SEM and MIP, it is concluded that FTs primarily work inside mesopores before 6 FTs, and then inside macropores after 6 FTs, when sediment aggregates fractured and solidification skeletons collapsed, and constraints on sediments from solidification skeletons were partially released. As a result, the decrease rate of cohesion reached a minimum value after 6 FTs, since cohesion of S/S sediments is mainly from those mesopores rather than macro pores.
3.6 Damage Model of S/S Sediments by FTs
By comprehensive analysis of UCS tests, direct shear tests, SEM, MIP, and NAP, a damage model of S/S sediments in FTs is derived as shown in Figure 11.
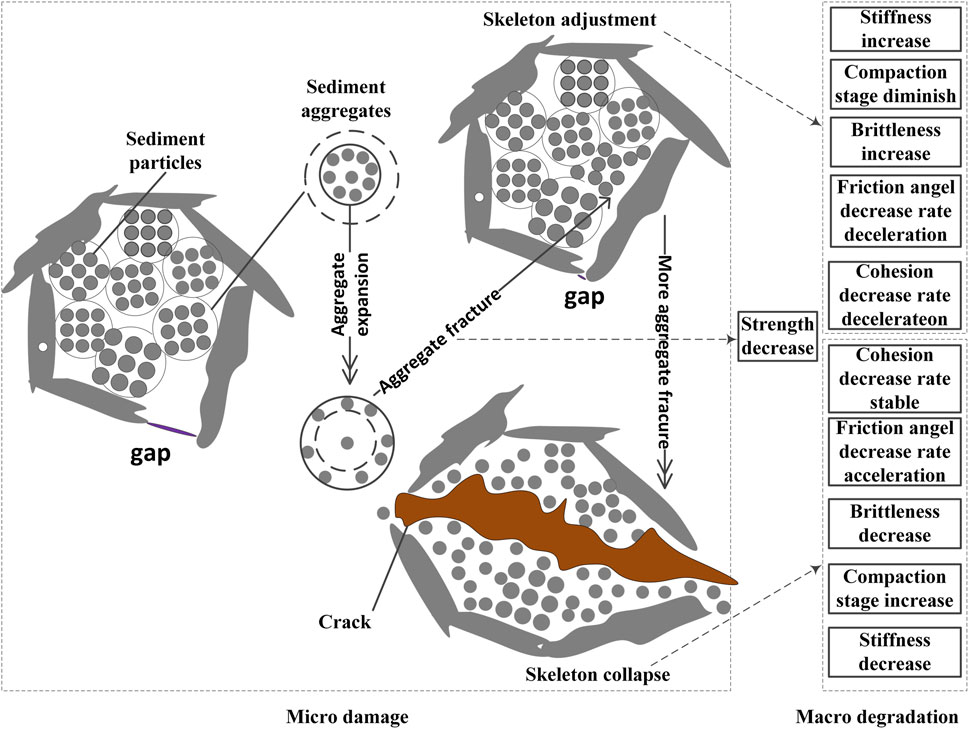
FIGURE 11. Damage model of S/S sediments by FTs.
Mesopores and macropores inside sediment aggregates are expanded by FTs; as a result, sediment aggregates are fractured and stripped off from solidification skeletons gradually; correspondingly, solidification is adjusted and gaps between them diminish gradually. We define this as the “skeleton adjustment” stage. When too many sediment aggregates are stripped off from solidification skeletons, these skeletons lose support from sediments and collapse suddenly. We define this as the “skeleton collapse” stage. Joint cracks occur when the “skeleton collapse” stage starts.
In UCS tests, compaction stages diminish first and then increase in FTs. The primary bearing structure in the initial loading stages inside S/S sediments is solidification skeletons rather than sediment aggregates. The compaction stage represents the unstable structures of solidification skeletons. As analyzed earlier, gaps between solidification skeletons diminish under the influence of FTs, so the compaction stages reduce in FTs due to the “skeleton adjustment” before 6 FTs. In the “skeleton collapse” stage, joint cracks occur, so the compaction stage increases due to these cracks. Similarly, brittleness and stiffness parameters of S/S sediments increase first due to “skeleton adjustment” and decrease due to “skeleton collapse.”
In UCS tests and direct shear tests, all the strength indexes decrease in FTs, since solidification skeletons lose support from sediments due to the gradual damage of sediment aggregates. But the decrease rate of friction angle decelerates first due to “skeleton adjustment,” and then accelerates due to “skeleton collapse.” The decrease rate of cohesion decelerates first due to the damage of mesopores in the “skeleton adjustment” stage, and then keeps stable when mesopores are not damaged anymore since constraints on sediments gets released in the “skeleton collapse” stage.
According to the damage model of S/S sediments by FTs, all the strength and stiffness degradations of S/S sediments derive from the expansion of meso and macropores and damage of sediment aggregates containing those pores. Therefore, the reasonable way to promote the resistance of S/S sediments to FTs, is to reduce meso and macropore volumes or strengthen those pore structures, including but not limited to: 1) apply more compaction or vibrating during the S/S sediment production process, to minimum volume of those meso and macrpores; 2) add nano materials such as nanometer silicon powder to fill those meso and macropores, and strengthen pore structures; 3) add specific additives to enhance the strength of those meso and macropore structures.
4 Conclusion
Macro tests, microanalyses, and theoretical analyses were conducted to analyze the strength and stiffness degradation mechanisms of S/S sediments by freeze–thaw cycles (FTs), and the following conclusions are obtained:
1. Mesopores (4 nm < d < 100 nm) and macropores (d < 100 nm) inside sediment aggregates are expanded by FTs, and sediment aggregates are damaged gradually. As a result, strength indexes including UCS, residual strength, shear strength, cohesion, and friction angle of S/S sediments decrease all the time during FTs.
2. With the damage of sediment aggregates, solidification skeletons are adjusted initially, and gaps between solidification skeletons diminish gradually. We defined this stage as “skeleton adjustment.”
3. Due to skeleton adjustment, stiffness parameters including elastic modulus and deformation modulus increase, brittleness of S/S sediments increase, decrease rate of friction angle decreases, and compaction stage of stress–strain curves diminish.
4. When more and more sediment aggregates were damaged, solidification skeletons lose support from sediments and collapse, joint cracks occur in S/S sediments. We defined this stage as “skeleton collapse.”
5. Due to skeleton collapse, stiffness parameters decrease, brittleness decrease, decrease rate of friction angle increase, and compaction stage increase.
6. The decrease rate of cohesion decelerates due to mesopore damages in “skeleton adjustment,” and then keeps stable in the “skeleton collapse” stage when constraints on sediments get released.
7. All the strength and stiffness degradations of S/S sediments by FTs derive from expansion of meso/macropores and damage of sediment aggregates containing those pores. The reasonable way to promote the resistance of S/S sediments to FTs, is to reduce volumes of those meso and macropores, or strengthen those pore structures.
Data Availability Statement
The original contributions presented in the study are included in the article/supplementary material; further inquiries can be directed to the corresponding author.
Author Contributions
HW contributed to the conception and design of this study and conducted macrotests. SW conducted micromeasurements and wrote the first draft of the manuscript. XJ performed the data analysis and established the damage model. KL conducted part of macrotests. LR conducted part of micromeasurements. All authors contributed to manuscript revision and read and approved the submitted version.
Funding
This research was financially supported by the National Natural Science Foundation of China (Grant Nos. 51709154 and 51974051) to finish the present study, 51709154 for macrotests and 51974051 for micromeasurements, and Research Foundation of Chongqing University of Science and Technology (Grant No. ckrc2022014).
Conflict of Interest
The authors declare that the research was conducted in the absence of any commercial or financial relationships that could be construed as a potential conflict of interest.
Publisher’s Note
All claims expressed in this article are solely those of the authors and do not necessarily represent those of their affiliated organizations, or those of the publisher, the editors, and the reviewers. Any product that may be evaluated in this article, or claim that may be made by its manufacturer, is not guaranteed or endorsed by the publisher.
Abbreviations
S/S, stabilized/solidified; FTs, freeze–thaw cycles; UCS, unconfined compression strength; SEM, scanning electron microscope analysis; MIP, mercury intrusion porosimetry; NAP, nitrogen adsorption porosimetry; EDS:, energy disperse spectroscopy; XRD, X-ray diffraction; TGA, thermal gravimetric analysis; TOC, total organic matter content.
References
Abbaslou, R. M., Vosoughi, V., and Dalai, A. K. (2017). Comparison of Nitrogen Adsorption and Transmission Electron Microscopy Analyses for Structural Characterization of Carbon Nanotubes. Appl. Surf. Sci. 419, 817–825. doi:10.1016/j.apsusc.2017.04.253
Ahmed, A. (2015). Compressive Strength and Microstructure of Soft Clay Soil Stabilized with Recycled Bassanite. Appl. Clay Sci. 104, 27–35. doi:10.1016/j.clay.2014.11.031
Alderete, N., Villagrán, Y., Mignon, A., Snoeck, D., and De Belie, N. (2017). Pore Structure Description of Mortars Containing Ground Granulated Blast-Furnace Slag by Mercury Intrusion Porosimetry and Dynamic Vapour Sorption. Constr. Build. Mater. 145, 157–165. doi:10.1016/j.conbuildmat.2017.03.245
Anagnostopoulos, C. A. (2015). Strength Properties of an Epoxy Resin and Cement-Stabilized Silty Clay Soil. Appl. Clay Sci. 114, 517–529. doi:10.1016/j.clay.2015.07.007
ASTM D3080 (2003). Standard Test Method for Direct Shear Test of Soils Under Consolidated Drained. West Conshohocken: ASTM International. doi:10.1520/D3080
ASTM D4219-02 (2003). Standard Test Method for Unconfined Compressive Strength Index of Chemical-Grouted Soils.
ASTM D560-03 (2015). Standard Test Methods for Freezing and Thawing Compacted Soil-Cement Mixtures. West Conshohocken: ASTM International. doi:10.1520/D0560-03
Bell, F. G. (1996). Lime Stabilization of Clay Minerals and Soils. Eng. Geol. 42, 223–237. doi:10.1016/0013-7952(96)00028-2
Boz, A., and Sezer, A. (2018). Influence of Fiber Type and Content on Freeze-Thaw Resistance of Fiber Reinforced Lime Stabilized Clay. Cold Reg. Sci. Technol. 151, 359–366. doi:10.1016/j.coldregions.2018.03.026
Cerny, V., Kocianova, M., and Diederichs, U. (2017). Modification of Soils for Excavation Work and Underlayer. Procedia Eng. 195, 252–258. doi:10.1016/j.proeng.2017.04.551
Chen, Z., Xu, H., Cheng, M., Lu, H., Wang, Z., and Feng, P. (2021). Dynamic Triaxial Test and Microscopic Study of Solidified Muddy Soil with Different Mixing Ratios and Curing Ages. Front. Mat. 8, 731449. doi:10.3389/fmats.2021.731449
Chiang, P.-N., Tong, O.-Y., Chiou, C.-S., Lin, Y.-A., Wang, M.-K., and Liu, C.-C. (2016). Reclamation of Zinc-Contaminated Soil Using a Dissolved Organic Carbon Solution Prepared Using Liquid Fertilizer from Food-Waste Composting. J. Hazard. Mater. 301, 100–105. doi:10.1016/j.jhazmat.2015.08.015
Du, Y.-J., Wei, M.-L., Reddy, K. R., Liu, Z.-P., and Jin, F. (2014). Effect of Acid Rain pH on Leaching Behavior of Cement Stabilized Lead-Contaminated Soil. J. Hazard. Mater. 271, 131–140. doi:10.1016/j.jhazmat.2014.02.002
Du, Y.-J., Wei, M.-L., Reddy, K. R., and Wu, H.-l. (2016). Effect of Carbonation on Leachability, Strength and Microstructural Characteristics of KMP Binder Stabilized Zn and Pb Contaminated Soils. Chemosphere 144, 1033–1042. doi:10.1016/j.chemosphere.2015.09.082
Fu, X., Hu, L., Zhu, W., Huang, X., Feng, K., and Zhou, Z. (2022). Miocene Provenance Changes in Taiwan Caused by Southward Input of Sediments from East China Sea Basin. Front. Earth Sci. 10, 849181. doi:10.3389/feart.2022.849181
Guo, S., Xu, P., Zhang, P., and Wang, S. (2022). Numerical Investigation of the Anti-infiltration and Anti-erosion Performance of Composite Layers Mixed with Polyacrylamide and Basalt Fibre for the Protection of Silt Subgrade Slopes. Front. Earth Sci. 10, 815602. doi:10.3389/feart.2022.815602
Hamidi, S., and Marandi, S. M. (2018). Clay Concrete and Effect of Clay Minerals Types on Stabilized Soft Clay Soils by Epoxy Resin. Appl. Clay Sci. 151, 92–101. doi:10.1016/j.clay.2017.10.010
Han, L.-J., Li, J.-S., Xue, Q., Guo, M.-Z., Wang, P., and Poon, C. S. (2022). Enzymatically Induced Phosphate Precipitation (EIPP) for Stabilization/solidification (S/S) Treatment of Heavy Metal Tailings. Constr. Build. Mater. 314, 125577. doi:10.1016/j.conbuildmat.2021.125577
Kogbara, R. B., Ayotamuno, J. M., Onuomah, I., Ehio, V., and Damka, T. D. (2016). Stabilisation/solidification and Bioaugmentation Treatment of Petroleum Drill Cuttings. Appl. Geochem. 71, 1–8. doi:10.1016/j.apgeochem.2016.05.010
Lake, C. B., Yousif, M. A.-M., and Jamshidi, R. J. (2017). Examining Freeze/thaw Effects on Performance and Morphology of a Lightly Cemented Soil. Cold Regions Sci. Technol. 134, 33–44. doi:10.1016/j.coldregions.2016.11.006
Lemaire, K., Deneele, D., Bonnet, S., and Legret, M. (2013). Effects of Lime and Cement Treatment on the Physicochemical, Microstructural and Mechanical Characteristics of a Plastic Silt. Eng. Geol. 166, 255–261. doi:10.1016/j.enggeo.2013.09.012
Li, X., Kang, Y., and Haghighi, M. (2018). Investigation of Pore Size Distributions of Coals with Different Structures by Nuclear Magnetic Resonance (NMR) and Mercury Intrusion Porosimetry (MIP). Measurement 116, 122–128. doi:10.1016/j.measurement.2017.10.059
Liu, L., Zhou, A., Deng, Y., Cui, Y., Yu, Z., and Yu, C. (2019). Strength Performance of Cement/slag-Based Stabilized Soft Clays. Constr. Build. Mater. 211, 909–918. doi:10.1016/J.CONBUILDMAT.2019.03.256
Liu, T., Xu, X., and Yang, J. (2017). Experimental Study on the Effect of Freezing-Thawing Cycles on Wind Erosion of Black Soil in Northeast China. Cold Regions Sci. Technol. 136, 1–8. doi:10.1016/J.COLDREGIONS.2017.01.002
Moon, D. H., Grubb, D. G., and Reilly, T. L. (2009). Stabilization/solidification of Selenium-Impacted Soils Using Portland Cement and Cement Kiln Dust. J. Hazard. Mater. 168, 944–951. doi:10.1016/j.jhazmat.2009.02.125
Pan, J., Niu, Q., Wang, K., Shi, X., and Li, M. (2016). The Closed Pores of Tectonically Deformed Coal Studied by Small-Angle X-Ray Scattering and Liquid Nitrogen Adsorption. Microporous Mesoporous Mater. 224, 245–252. doi:10.1016/j.micromeso.2015.11.057
Park, J., Son, Y., Noh, S., and Bong, T. (2016). The Suitability Evaluation of Dredged Soil from Reservoirs as Embankment Material. J. Environ. Manag. 183, 443–452. doi:10.1016/j.jenvman.2016.08.063
Pinto, P. X., Al-Abed, S. R., Barth, E., Loftspring, C., Voit, J., Clark, P., et al. (2011). Environmental Impact of the Use of Contaminated Sediments as Partial Replacement of the Aggregate Used in Road Construction. J. Hazard. Mater. 189, 546–555. doi:10.1016/j.jhazmat.2011.02.074
Pu, S.-Y., Zhu, Z.-D., Song, W.-L., Wang, H.-R., and Wei, R.-J. (2019a). Deformation Properties of Silt Solidified with a New SEU-2 Binder. Constr. Build. Mater. 220, 267–277. doi:10.1016/j.conbuildmat.2019.06.016
Pu, S., Zhu, Z., Wang, H., Song, W., and Wei, R. (2019b). Mechanical Characteristics and Water Stability of Silt Solidified by Incorporating Lime, Lime and Cement Mixture, and SEU-2 Binder. Constr. Build. Mater. 214, 111–120. doi:10.1016/j.conbuildmat.2019.04.103
Rui, K., Hongxing, W., Yunzhi, T., and Lehua, W. (2019). Solidification of High Organic Matter Content Sludge by Cement, Lime and Metakaolin. Period. Polytech. Civ. Eng. 63, 53–62. doi:10.3311/PPci.12293
Saride, S., Puppala, A. J., and Chikyala, S. R. (2013). Swell-shrink and Strength Behaviors of Lime and Cement Stabilized Expansive Organic Clays. Appl. Clay Sci. 85, 39–45. doi:10.1016/j.clay.2013.09.008
Shinsha, H., and Kumagai, T. (2018). Material Properties of Solidified Soil Grains Produced from Dredged Marine Clay. Soils Found. 58, 678–688. doi:10.1016/j.sandf.2018.03.003
Siham, K., Fabrice, B., Edine, A. N., and Patrick, D. (2008). Marine Dredged Sediments as New Materials Resource for Road Construction. Waste Manag. 28, 919–928. doi:10.1016/J.WASMAN.2007.03.027
Sing, K. S. W., Everett, D. H., Haul, R. A. W., Moscou, L., Pierotti, R. A., Rouquerol, J., et al. (2008). Annexes: IUPAC Recommendations: Reporting Physisorption Data for Gas/Solid Systems. Handb. Heterog. Catal. 3–5, 1503–1516. doi:10.1002/9783527619474.ch11
Tang, Y., Miyazaki, Y., and Tsuchida, T. (2003). “Utilization of Cement Treated Soft Dredgings with Special Working Ship,” in Soft Ground Engineering in Coastal Areas (Taylor & Francis), 335–343. doi:10.1201/9781439833919.ch38
Tang, Y. X., Miyazaki, Y., and Tsuchida, T. (2001). Practices of Reused Dredgings by Cement Treatment. Soils Found. 41, 129–143. doi:10.3208/sandf.41.5_129
Wang, D., Abriak, N. E., and Zentar, R. (2013). Strength and Deformation Properties of Dunkirk Marine Sediments Solidified with Cement, Lime and Fly Ash. Eng. Geol. 166, 90–99. doi:10.1016/j.enggeo.2013.09.007
Wang, D., Zentar, R., and Abriak, N. E. (2018). Durability and Swelling of Solidified/stabilized Dredged Marine Soils with Class-F Fly Ash, Cement, and Lime. J. Mat. Civ. Eng. 30, 1–12. doi:10.1061/(ASCE)MT.1943-5533.0002187
Wang, H., Wu, Z., Tan, Y., Cui, X., and Zuo, Q. (2019). Characteristics of the Micro Pore Structures of Stabilized/Solidified Sediments during Freeze-Thaw Cycles. Constr. Build. Mat. 211, 1–22. doi:10.1016/J.CONBUILDMAT.2019.03.256
Wang, L., Tsang, D. C. W., and Poon, C.-S. (2015). Green Remediation and Recycling of Contaminated Sediment by Waste-Incorporated Stabilization/solidification. Chemosphere 122, 257–264. doi:10.1016/j.chemosphere.2014.11.071
Wang, S., Su, J., Wu, Z., Ma, W., Li, Y., and Hui, H. (2021). Silty Clay Stabilization Using Metakaolin-Based Geopolymer Binder. Front. Phys. 9, 769786. doi:10.3389/fphy.2021.769786
Wu, J., Deng, Y., Zheng, X., Cui, Y., Zhao, Z., Chen, Y., et al. (2019a). Hydraulic Conductivity and Strength of Foamed Cement-Stabilized Marine Clay. Constr. Build. Mater. 222, 688–698. doi:10.1016/j.conbuildmat.2019.06.164
Wu, J., Jing, X., and Wang, Z. (2017). Uni-axial Compressive Stress-Strain Relation of Recycled Coarse Aggregate Concrete after Freezing and Thawing Cycles. Constr. Build. Mater. 134, 210–219. doi:10.1016/j.conbuildmat.2016.12.142
Wu, S., Ramandi, H. L., Chen, H., Crosky, A., Hagan, P., and Saydam, S. (2019b). Mineralogically Influenced Stress Corrosion Cracking of Rockbolts and Cable Bolts in Underground Mines. Int. J. Rock Mech. Min. Sci. 119, 109–116. doi:10.1016/J.IJRMMS.2019.04.011
Wu, S., Zhu, W., Lv, Y., Shu, S., Han, T., Wang, F., et al. (2018). Quality Control Indexes and Curing Agent Values for Submerged Poured Solidifying-Silt Island; Case Study of the Artificial Island of Dalian Bay, China. Constr. Build. Mater. 190, 664–671. doi:10.1016/j.conbuildmat.2018.09.144
Zentar, R., Wang, D., Abriak, N. E., Benzerzour, M., and Chen, W. (2012). Utilization of Siliceous-Aluminous Fly Ash and Cement for Solidification of Marine Sediments. Constr. Build. Mater. 35, 856–863. doi:10.1016/j.conbuildmat.2012.04.024
Zentar, R., Wang, H., and Wang, D. (2021). Comparative Study of Stabilization/solidification of Dredged Sediments with Ordinary Portland Cement and Calcium Sulfo-Aluminate Cement in the Framework of Valorization in Road Construction Material. Constr. Build. Mater. 279, 122447. doi:10.1016/j.conbuildmat.2021.122447
Zhang, T., Yue, X., Deng, Y., Zhang, D., and Liu, S. (2014). Mechanical Behaviour and Micro-structure of Cement-Stabilised Marine Clay with a Metakaolin Agent. Constr. Build. Mater. 73, 51–57. doi:10.1016/j.conbuildmat.2014.09.041
Keywords: stabilized/solidified sediments, freeze–thaw cycle, strength and stiffness degradation, microstructure, sediment aggregate fracture, skeleton adjustment, skeleton collapse
Citation: Wang H, Wu S, Jing X, Liu K and Ren L (2022) Strength and Stiffness Degradation Mechanisms of Stabilized/Solidified Sediments by Freeze–Thaw Cycles. Front. Earth Sci. 10:905482. doi: 10.3389/feart.2022.905482
Received: 27 March 2022; Accepted: 16 May 2022;
Published: 24 June 2022.
Edited by:
Guiting Hou, Peking University, ChinaReviewed by:
Liyun Tang, Xi’an University of Science and Technology, ChinaWei Ju, China University of Mining and Technology, China
Copyright © 2022 Wang, Wu, Jing, Liu and Ren. This is an open-access article distributed under the terms of the Creative Commons Attribution License (CC BY). The use, distribution or reproduction in other forums is permitted, provided the original author(s) and the copyright owner(s) are credited and that the original publication in this journal is cited, in accordance with accepted academic practice. No use, distribution or reproduction is permitted which does not comply with these terms.
*Correspondence: Hongxing Wang, d2FuZ2hvbmd4aW5nbGloQDEyNi5jb20=