 Guoqing Yin
 Hui Zhang
 Yi Xin
94% of researchers rate our articles as excellent or good
Learn more about the work of our research integrity team to safeguard the quality of each article we publish.
Find out more
ORIGINAL RESEARCH article
Front. Earth Sci., 23 June 2022
Sec. Structural Geology and Tectonics
Volume 10 - 2022 | https://doi.org/10.3389/feart.2022.904064
This article is part of the Research TopicAdvances in the Study of Natural Fractures in Deep and Unconventional ReservoirsView all 29 articles
Taking the >8,000 m buried Cambrian subsalt dolomite reservoir in the northern uplift of the Tarim Basin as an example, this study used imaging logging, cores, outcrops, and other data to identify natural fractures and obtain parameters of natural fractures, including strike, azimuth, width, length, and apparent porosity, and clarified the characteristics of natural fractures in the well section. Based on the logging data, wellbore rock mechanics, in situ stress, and elastic parameters were established. The analysis of the mechanical characteristics of natural fractures was carried out to find out the shear stress, normal stress, and their ratio of each natural fracture in the reservoir section. Combined with the stress value of each fracture, the quantitative characterization parameter Fractures Geomechanical Activity Index of the mechanical characteristics of natural fractures is established. Combined with the petrophysical parameters of natural fractures, the evaluation model of the quality index of the reservoir containing the natural fractures is established. According to the classification of reservoir quality, combined with the petrophysical properties of the reservoir section, the optimization of the acid-fracturing scheme and injection pressure can be carried out in order to increase the production after acid-fracturing. In this study, the quality of the reservoir with natural fractures is divided into three categories: the QRCF of a Class I reservoir is 0.6∼1, of Class II reservoir is 0.3∼0.6, and of Class III reservoir is less than 0.3. The application of Well L1 and other wells shows that there are great differences in the development of natural fractures at different depths of the Cambrian subsalt dolomite reservoir so as to QRCF. The Class I reservoir is easy for acid-fracturing to achieve high performance. The Class II reservoir needs large-scale acid-fracturing, and the Class III reservoir cannot be acid-fractured under the current methods. The research results provide a reference for the classification of the fracture mechanical activity of an ultra-deep Cambrian subsalt dolomite reservoir and the optimization of acid-fracturing treatment parameters of similar reservoirs.
The main hydrocarbon source rocks of the northern Uplift in the Tarim Basin are ancient and lie in ultra-deep formation, which result in complicated exploration and development of the geological conditions of the ultra-deep formation. The Cambrian subsalt dolomite is the first set of reservoir-cap assemblage above the main hydrocarbon source rocks in the Tarim Basin, which forms the conditions of large-scale oil and gas accumulation (Yang et al., 2020). The high-yield industrial oil and gas flow obtained from the 8,200 m Cambrian subsalt dolomite reservoir in Well L1, the deepest well in Asia, further proves that this area has great potential. Du et al. (2016) consolidated seismic data interpretation, drilling, and geological data of the outcrop on the periphery of the basin to investigate the petroleum and geological conditions such as source, reservoir, and cap of the Cambrian subsalt dolomite in the Tarim Basin. Ni et al. (2017) investigated the characteristics and main controlling factors of the Cambrian subsalt dolomite reservoir in the middle-eastern Tarim Basin and considered that the main reservoir types of Cambrian subsalt dolomite in the middle Tarim Basin included intergranular pores and intergranular solution pores, dissolution pores, intergranular micropores, and natural fractures, and fractures were often combined with other kinds of pore types to form composite fracture-pore-type or fracture-vuggy-type reservoirs. Yin et al. (2015) established the calculation models of elastic modulus, Poisson’s ratio, strength, and fracturing ability of the dolomite reservoir based on rock mechanics experiments and fine determination of rock components, analyzed the influences of rock mechanics parameters of different lithological components, established the in situ stress calculation model, determined detailed in situ stress section, calculated natural fracture cohesion, sliding friction coefficient, normal stress, and shear stress, and determined the opening rate under different injection pressure to optimize the fracturing construction interval, pumping procedure, segmented perforation cluster, construction pressure, etc. Previous research results have laid a rich theoretical foundation and reference for this study; however, they highlight the analysis of the geological characteristics and rarely focus on natural fractures and their mechanical characteristics and do not recognize that natural fractures are the main factor affecting the reservoir quality, resulting in defects in the understanding of reservoir quality.
Taking the Well L1 in the northern uplift as an example, this study uses imaging logging, core, rock, chip, and other data to identify and obtain the occurrence of natural fractures, define the characteristics of natural fractures, analyze the stress characteristics of natural fractures, calculate the natural fracture mechanical activity index, and establish a quality evaluation index for the dolomite reservoir with natural fractures, which consists of a geological mechanical activity index of natural fractures, width, length, and apparent porosity of natural fractures. The results can provide a reference for the optimization of reservoir acid–fracturing reformation parameters in this area and improve the understanding of reservoir quality and well completion reformation under similar geological conditions.
Located in the northern part of the Tarim Basin, the Northern Uplift is a long-term stable marine carbonate residual paleo uplift formed in the Middle Caledonian period on the background of basement paleo uplift. Multi-stage tectonic movement is the key to the formation of the Sinian–Cambrian tectonic pattern in this area. The tectonic background of a low uplift is developed in the Nanhua–Sinian system (Du et al., 2016; Yang et al., 2020). The period from Early Cambrian to Middle Ordovician was the development stage of the platform basin sedimentary transition zone. The period from Middle Caledonian to Middle Hercynian was the formation stage of the Lunnan low uplift. The period of Late Hercynian to the present day is the stable settlement period of the Lunnan low uplift (Figure 1). During the process of tectonic evolution, faults were continuously formed and associated with natural fractures, resulting in the reservoir generally containing natural fractures (Du et al., 2016; Cheng et al., 2020).
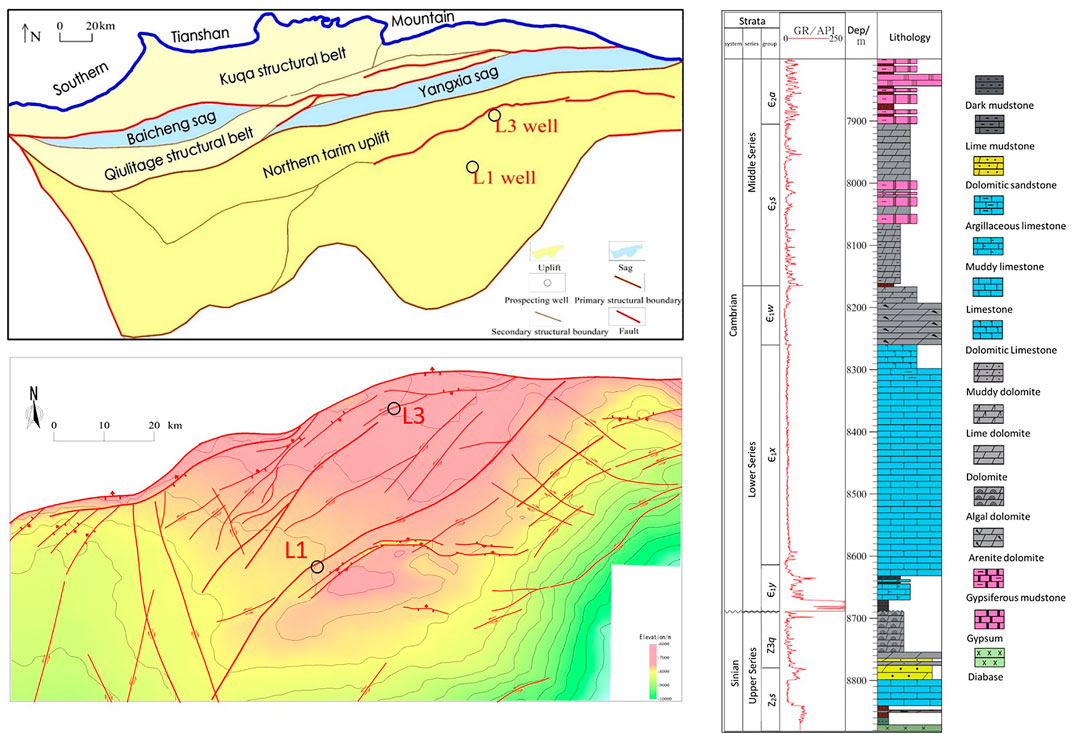
FIGURE 1. Tectonic location and lithology.
From bottom to top, the Cambrian system consists of the Lower Cambrian Yuertusi Formation (Є1y), Xiaoerbulake Formation (Є1x), Wusonggeer Formation (Є1w), Middle Cambrian Shayilike Formation (Є2s), Awatage Formation (Є2a), and Upper Cambrian Lower Qiulitage Formation (Є3xq). The Є1y Formation is a set of marine sediments dominated by black shale, thin-layer siliceous phosphatic nodule––bearing mudstone, and nodular limestone. The Є1x Formation comprises micritic limestone, spheroidal limestone, and a small amount of granular limestone. The Є1w Formation is interbedded with thin-middle argillaceous dolomite, argillaceous silty dolomite, and thin granular dolomite. The Middle Cambrian Є2s formation comprises medium thick dark gray and grayish brown argillaceous silty dolomite and granular dolomite, with a set of stably distributed limestone in the middle and upper part. The Є2a Formation develops in extremely thick evaporating lagoons or limited platform tidal flat faces which contain gypsum salt rock, gypsum mudstone, argillaceous dolomite, etc (Yang et al., 2020).
Taking Wells L1 and L3 as examples, this study explains the natural fracture development characteristics of the Cambrian subsalt dolomite reservoir in the Northern uplift. The Cambrian subsalt formations exposed by Well L1 are Є2s, Є1w, Є1x, Є1y, and Z3q of the Upper Sinian system. The Sinian system and Cambrian system of the Luntan 1 well have a small angle unconformity contact relationship. The L1 well was drilled and exposed a set of source rocks and two sets of reservoir-cap rocks below the Cambrian salt. The first reservoir–cap combination comprises the Є2s–Є1w formation which contains dolomite and overlying awatag formation gypsum. The gypsum layer is 230 m thick, and the thickness of single-layer gypsum is 10∼15 m. The other reservoir–cap combination comprises the dolomite weathering crust karst reservoir of the Sinian Z3q formation and overlying Є1y formation mudstone (Yang et al., 2020), Figure 2.
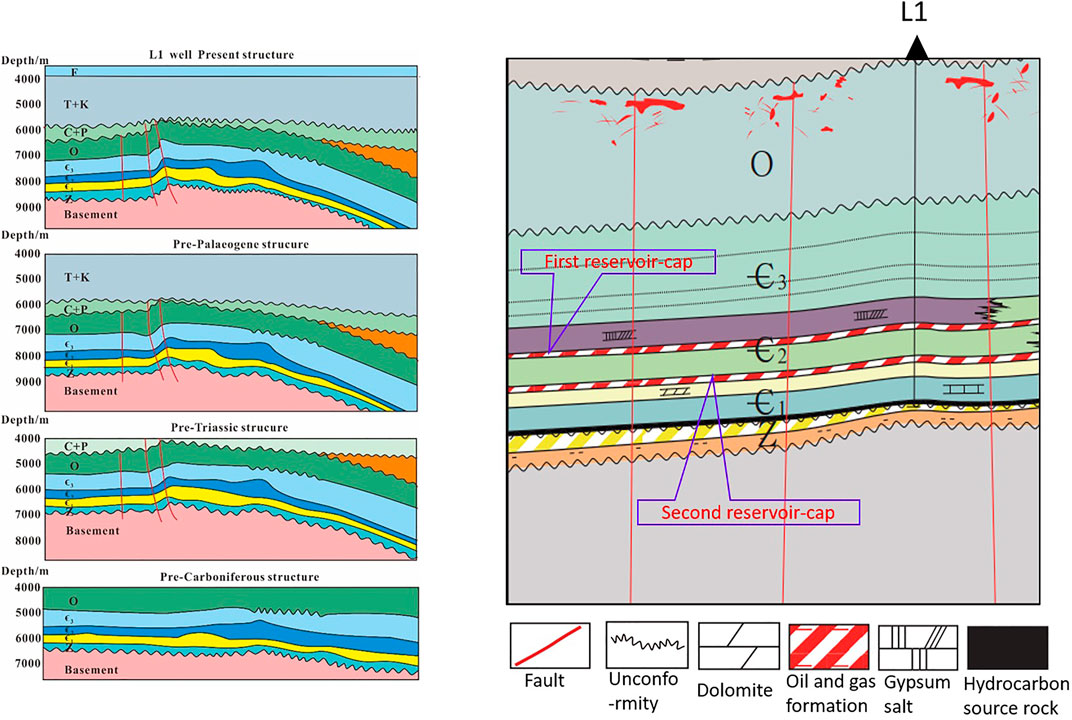
FIGURE 2. Hydrocarbon accumulation mode of Well L1.
The down well cores were taken out from 8,641–8,649.5 m of the well L1 in Є1y formation. The lithology is mainly dolomite, mudstone, calcareous mudstone, and lime-bearing mudstone with the horizontal bedding. Four horizontal micro-fractures fully filled with calcite, 16 horizontal micro-fractures fully filled with argillaceous rock, seven oblique micro-fractures fully filled with argillaceous material, and four vertical micro fractures fully filled with calcite are identified from the cures shown in Figure 3. Based on the systematic processing of the imaging logging data in Well L1, natural fractures were picked up manually, and 18 natural fractures were identified, which were distributed mainly in the Є2s formation of the Middle Cambrian and the Є1w formation of the Lower Cambrian (Figure 3).
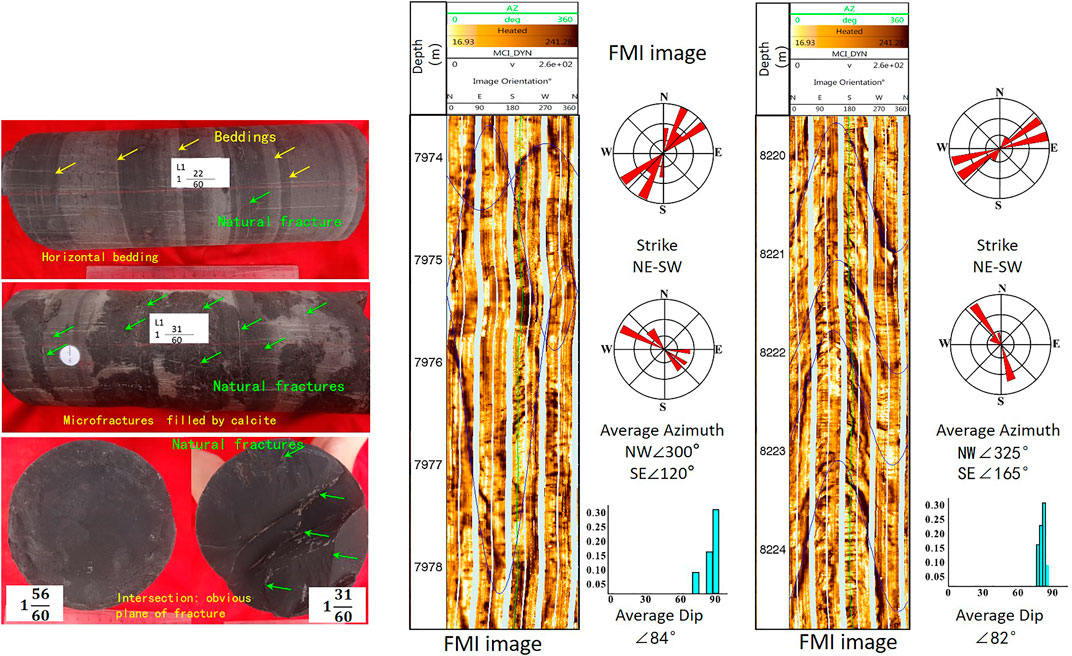
FIGURE 3. Cores, imaging logging photos, and natural fracture orientations in Well L1. This figure contains three parts, the left are core pictures from 8,641–8,649.5 m of well L1, Є1y formation, and the source rock. The right parts are the FMI image and natural fractures picked up from FMI logging in 7,904∼8044 m and 8,195∼8,260.5 m, respectively.
In Figure 3, the left figure shows part core photos in 8,641–8,649.5 m of well L1, and the lithology and depth of the sampling are shown in Figure 1. Horizontal bedding (yellow arrow) and micro-natural fractures (green arrow) can be clearly identified in the figure. The linear density of natural fractures reaches 2.8/m, but these natural fractures are fully filled with calcite, and these natural fractures are not identified in the imaging logging of this section. The middle figure shows the image of some natural fractures in 7,904∼8044 m. Seven natural fractures are picked up in this section. The strike of group 1 is near NS, and the other two groups are NE 22.33° ∼ 54.79°. It can be seen in the FMI image that these natural fractures have not been filled. The right figure shows the image of some natural fractures in 8,195 ∼ 8,260.5 m. Eleven natural fractures are picked up in this section. There are three natural fractures with a strike of NE 26.3° ∼ 4.31 °and eight fractures of NE 50°. From the FMI image, it can be seen that these natural fractures have not been filled too.
Geological research shows that the natural fractures were formed in the middle to late Caledonian movement. At the same time, due to the strong fault activity in the Early Hercynian period, the natural fractures continued to develop and transformed to the current state (Du et al., 2016; Yang et al., 2020).
The stratum drilled in well L3 (35.2 km away from L1) is completely consistent with that in well L1. The hydrocarbon source rock in this region is Cambrian Є1y formation, with good oil and gas display. Through core observation, the stratum in this section is mainly black mudstone and gray dolomite, with micro pores and micro fractures locally, and the overall fractures are not developed. From electrical imaging data, five natural fractures are picked up, with the strike mainly from northeast to southwest, and the dip angle is 35–64°, which are medium and low angles. The angle between the fracture strike and principal stress orientation (NE 60°) is 20–50°, Figure 4.
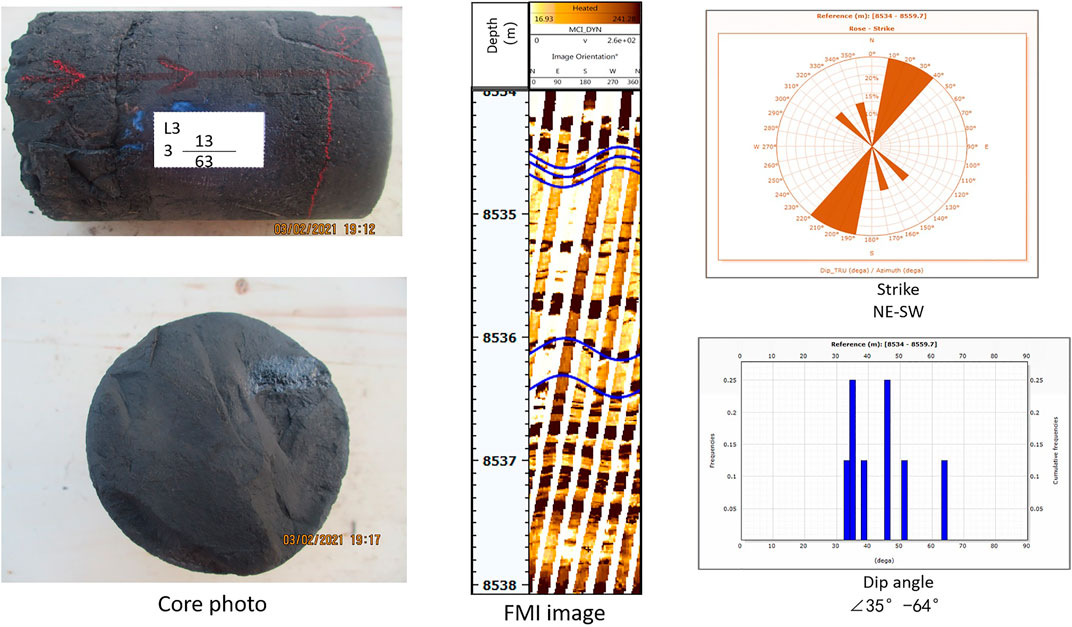
FIGURE 4. Cores, imaging logging photos, and natural fracture orientations in Well L3. The left picture shows part core photos. An open horizontal natural fracture can be seen, which is consistent with the natural fracture picked up by FMI logging in this section (the right picture). These natural fractures have poor transverse continuity and short longitudinal extension distance, with a medium-to-low dip angle. The effectiveness of natural fractures is poor according to these characteristics (Gong et al., 2019; Gong et al., 2021).
From the principle of the likelihood of activation of natural fractures, it can be seen that the smaller the angle between the natural fracture trend and the current horizontal principal stress orientation (NE 54°), the easier it is to be activated and vice versa. The contact relationship between hydraulic fractures and natural fractures depends on in situ stress, natural fracture cohesion, friction coefficient, etc., which is more complex without discussion in this article (Fisher et al., 2001; Potluri et al., 2005; Mohammed et al., 2011; Zeng et al., 2021).
Based on FMI image decomposition, bilateral resistivity, and other technical methods (Luthi and Souhaite, 1990; Xu, 2010), parameters such as fracture length (FraL), mean hydraulic aperture (FraW), and fracture apparent porosity (FraP) were calculated in this study (Table 1).
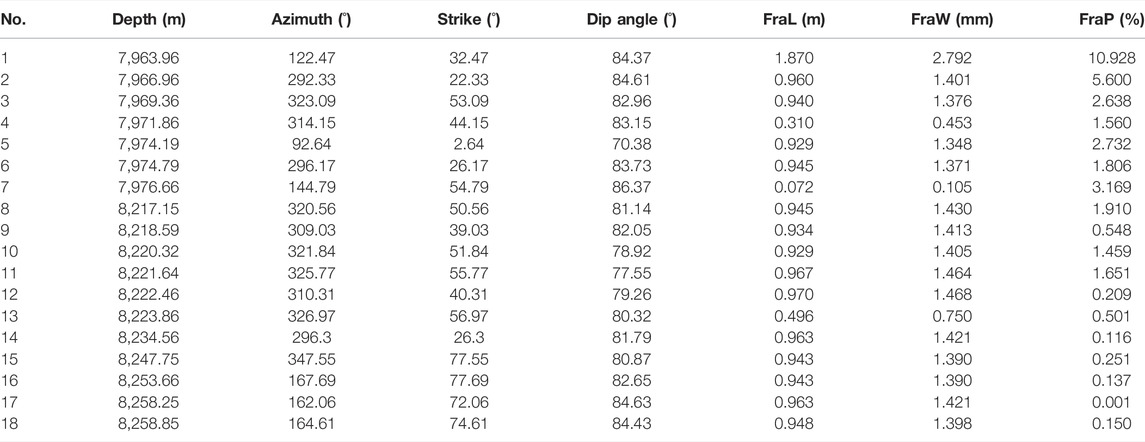
TABLE 1. Calculated natural fracture parameters of well L1.
As for the mechanical parameter calculation of natural fractures, it is necessary to accurately obtain the rock Poisson’s ratio ν, internal friction angle CFA, Young’s modulus E, compressive strength UCS, shear strength USHE, shear modulus G, bulk modulus K, and other parameters. On the basis of the rock mechanics experiments, the dynamic–elastic parameters of rocks by analyzing the longitudinal and transverse wave velocity data measured at the same time in the experiment were obtained, and the calculation model of the rock force field parameters and the dynamic and static conversion models of the rock elastic parameters suitable for the Cambrian subsalt dolomite reservoir were established (Zoback, 2007).
The calculation model of compressive strength is as follows (Eq. 3-1):
where UCS is the uniaxial compressive strength; CFA is the internal friction angle; and USHE is the shear strength.
The internal friction angle can be calculated by Eq. 3-2.
where ν is Poisson’s ratio.
The shear strength (USHE) may be calculated based on Eq. 3-3.
where E is the elastic modulus; K is the bulk modulus; BCC is the inherent strength coefficient of the rock, and the value of the dolomite reservoir is 0.002; Vsh is the volume content of mudstone.
The calculation of Young’s modulus and Poisson’s ratio is based on the conventional calculation model (Zoback, 2007; Chen et al., 2008; Lu et al., 2015). Through the rock mechanics experiment (Yin et al., 2015), the dynamic and static conversion between Young’s modulus and Poisson’s ratio is regressed and fitted as follows (Eq. 3-4, Eq. 3-5):
where
The azimuth of the horizontal maximum principal stress is the important data to calculate the mechanical characteristics of the natural fractures. There are three methods to identify the orientation of the horizontal maximum principal stress: 1) dipole shear wave anisotropy (derive from dipolar shear wave logging). 2) Shear breakout direction statistics of the wellbore (derived from the resistivity imaging logging or dip angle well logging). 3) Drilling-induced fracture strike picked up from the wellbore (derived from resistivity imaging logging) (Cai, et al., 2015; Zoback, 2007).
The in situ stress field in the reservoir is characterized by a third-degree, second-order tensor, which includes three normal stresses and six shear stress components in any Cartesian coordinate system. The shear stress is symmetrical about the diagonal. When the coordinate axis is parallel to the three principal stress directions, the shear stress is zero, and the eigenvalue and eigenvector of the stress tensor correspond to the magnitude and direction of the principal stress, respectively (Eq. 3-6). At this time, the stress state at any point in the deep crust can be described using one vertical stress and two horizontal stresses mutually perpendicular to each other. This view holds true in the range from the Earth’s surface to the depth of 20 km of the crust (Zoback, 2007). Therefore, for the oil and gas reservoirs found in the Kelasu tectonic belt, the stress state at its corresponding position can be fully described with three principal stresses (vertical stress, σV; horizontal maximum principal stress, σH; and horizontal minimum principal stress, σh) and the azimuth of the horizontal principal stress.
The most important significance of the three principal stresses in Eq. 3-6 is that their relationship determines the stress state of the reservoir. When faults within the crust are in a stable state, the ratio of the maximum to minimum principal stress will meet Eq. 3-7 (Jaeger and Cook, 1979).
According to Anderson’s fault and the stress classification model, when the vertical stress is at the maximum, intermediate, and minimum stress, respectively, in situ stress within the reservoir is the stress state of potential normal fault type, strike–slip type, and reverse fault type, correspondingly. The specific in situ stress state controls the mechanical behavior of geological bodies such as fractures and faults in the reservoir and affects the reservoir permeability and fluid-flow characteristics, which is the most direct correlation between the magnitude and direction of in situ stress and oil and gas exploration and development.
Zoback (2007), Liu and Luo (2005), and Chen (2008) had proposed the mathematical model for calculating triaxial stresses using logging data. The vertical stress value is equivalent to the gravity of overlying strata. Therefore, through the rock density integration from the surface to the target depth z, the mean density of the interval above the starting depth of density logging z0 is determined according to the adjacent wells and regional formation lithology, and then σV is calculated according to Eq. 3-8.
Hydraulic acid-fracturing construction data are used to determine the
where ν is Poisson’s ratio, α is Biot pore elasticity coefficient, Pp is pore pressure, and εH and εh are the strain in the direction of maximum and minimum horizontal principal stress, respectively.
For the horizontal maximum principal stress, Barton and Zoback (1988) believed that under the specific horizontal stress state, rock strength, and wellbore pressure, a fracture trace with a certain collapse width will be formed, that is, during the drilling process, the shear collapse may continuously deepen to the radial direction for a certain time, but the collapse width will remain stable. Hence, the calculation method is as shown in Eq. 3-10:
where C0 is the compressive strength of the rock in the stratum and φ is the collapse width of the borehole wall. The method is to obtain the reliable σh and σH at the specific position of the wellbore. Then, the data at these key points are used to realize the continuous calculation of the horizontal maximum and minimum principal stresses in the 1D section based on Eq. 3-11, which will provide the basis for the calculation of the stress characteristic parameters of natural fractures.
When analyzing the stress characteristics of natural fractures, it is also necessary to consider the angle between the horizontal maximum principal stress and natural fractures. In this article, three methods, that is, fast shear wave azimuth, drilling induced fracture, and borehole wall stress collapse imaging are used to obtain the in situ horizontal maximum principal stress direction (Yin et al., 2015).
For the evaluation of the mechanical activity of faults and fractures, Amontons (Otsuki and Matsukawa, 2013) proposed that friction sliding would occur when the ratio of shear stress to normal stress on the structural plane exceeded its friction coefficient based on Da Vinci’s friction experiment. Coulomb (1973) proposed the Coulomb failure function, which succinctly expressed the activity characteristics of the primary fracture surface caused by friction and sliding (Zoback et al., 2012, 2007; Jiang et al., 2021; Gong et al., 2021). The Coulomb failure function (CFF) is shown in Eq. 3-12:
When the CFF is negative, the fracture surface remains stable, and the shear stress is not enough to overcome the sliding resistance. However, when the CFF reaches or exceeds zero, the shear stress overcomes the normal stress on the primary fracture surface, resulting in friction sliding.
From Eq. 3-12, we may see that the ratio of shear stress to normal stress in a fracture plane τ/σn is an important indicator of the mechanical activity of natural fractures. Barton and Zoback (1994), Barton and Zoback (1995) confirmed that faults and fractures with better potential activity have better permeability. Townsend and Zoback (2000) proposed that the hydraulic conductivity of faults did not depend on the effective normal stress acting on the fault plane but on the ratio of shear stress to effective normal stress. When studying the Suban gas field in South Sumatra, Indonesia, Hennings et al. (2012) also mentioned that the ratio of shear stress to normal stress τ/σn is one of the factors affecting the permeability of fractured reservoirs. Through the aforementioned methods, they obtained the occurrence data of natural fractures and the in situ stress value of natural fractures and then analyzed the normal stress and shear stress of natural fracture surfaces as well as their ratios.
The Coulomb friction criterion is used to judge the sliding of a fault unit. Assuming that the change of fluid pressure causes the change of fault activity, we can calculate the critical pore pressure, and any value exceeding this pore pressure may cause activity along the fault surface (Zoback et al., 2012,2007; Jiang et al., 2021). When the change in the pore pressure causes the sliding of the fault, in which, the CFF is zero, Eq. 3-12 will be changed to
If the aforementioned pore pressure is defined as the critical pore pressure of fault activity, Eq. 3-14 will be obtained:
This study normalizes the two attributes with the range transformation method and then puts forward a new fracture geomechanical activity calculation model, namely, the Fractures Geomechanical Activity Index (FGAI) (Cai et al., 2015; Jiang et al., 2021), which is suitable for areas with high stress, high pore pressure, and complex structure:
where Gi is the normalized value of different geological attributes and G1 is the ratio of shear stress to normal stress of the fracture surface τ/σn. G2 is the critical pore pressure of fault sliding. Wi is the weight coefficient of each geological attribute. Therefore, the FGAI is expressed as Eq. 3-16:
where the parameters with subscripts “max” and “min” are the maximum and minimum values of the aforementioned two geological parameters in the region, respectively, and the weight of the two parameters meets W1 + W2 = 1. The value range of the FGAI is 0∼1. When the value is greater, the potential activity of the fault is stronger. The calculation process of this index comprehensively considers the regional in situ stress field, reservoir pore pressure, rock mechanical properties, and fracture geometric occurrence, directly reflecting the potential mechanical activity and behavior of natural fractures under the control of the in situ stress field.
The authors have exploited the method to estimate the quality about the reservoir containing natural fractures. From the aforementioned method, length of natural fracture (FraL), width of fracture (FraW), apparent porosity of fracture (FraP), and mechanical activity index (FGAI) were obtained using logging data. From the significance of the characterization of these parameters, they all indicate a positive impact on reservoir quality. Therefore, the fractured reservoir quality index is defined as Eq. 3-17:
where the parameters with subscripts “max” and “min” in the formula are the maximum and minimum values of the aforementioned four geological parameters in the region, respectively. The parameter weight meets W1+ W2+W3+W4 = 1, and the value range of the reservoir quality index is 0∼1.
In this study, the reservoir quality index
The aforementioned method is used to analyze the Cambrian subsalt dolomite of Well L1, obtain rock strength, Young’s modulus, triaxial stress, and reservoir quality index
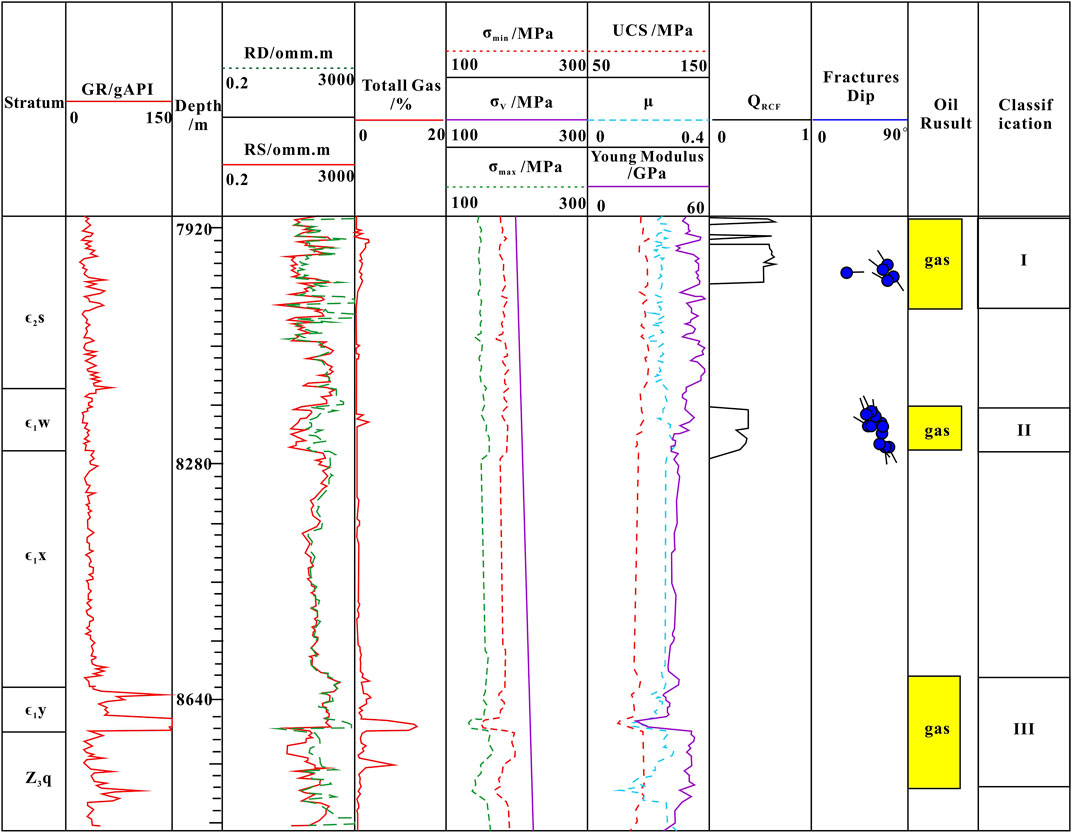
FIGURE 5. Geomechanical interpretation and reservoir classification in Well L1. It can be seen that the logging interpretation of the reservoir of the third section (yellow filled rectangle) is a gas reservoir, but there are great differences in the geomechanical parameters. The first section is defined as Class I with lower in situ stress, five natural fractures, and higher
Based on oil and gas expressions and logging interpretations, three sections are optimized for acid-fracturing reformation. For designing the acid-fracturing reformation scheme, it is necessary to predict the hole–bottom pressure additionally. The critical opening pressure of each natural fracture is calculated using the method described previously. In Figure 6, green dots represent opening natural fractures in the original state, white dots represent some under the current injection pressure, and black dots represent the others which are not stimulated (Zoback, 2007). Figure 6A shows the equivalent mud density of the natural fracture opening pressure in 7,904.5–8044 m, which is 1.61 SG, and Figure 6B shows the equivalent mud density of the natural fracture opening pressure about 8,195.3–8,260.5 m, which is 1.82 SG. Since there is no natural fracture in the third reservoir 8,606.7–8,777.8 m, the matrix hydraulic fracturing pressure is comprehensively affected by pore pressure, in situ stress, and rock mechanical parameters. The fracture initiation pressure equivalent mud density is simulated to 2.21 SG, shown in Figure 6C (Zoback 2007), indicating that the formation in this section is difficult to be fractured. Then, according to the rock mechanics and insitu stress parameters obtained from the wellbore, this study simulated the parameters such as pumping procedure, pumping rate, and acid solution consumption under the optimal capacity conditions and finally designed the acid-fracturing reformation scheme for three sections in Well L1 (Table 2). Generally, the stress shadow needs to be considered in the parameter design of acid-fracturing operation (Chun et al., 2009; Cai et al., 2017; Yu et al., 2017). Due to large reservoir space in the three sections and general construction, the influence of the stress shadow is small and will not be considered.
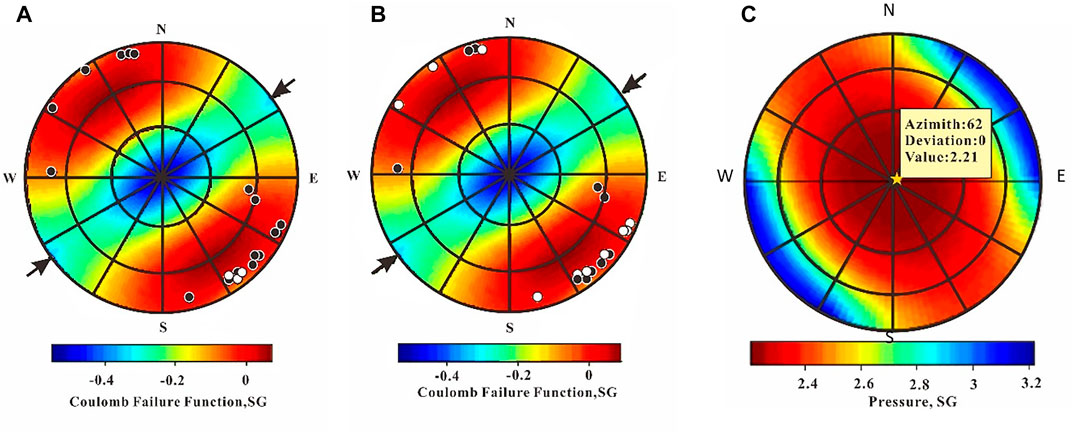
FIGURE 6. Modeling results showing the critical fracture opening pressure in Well L1. This figure is called stereographic (Zoback 2007). The opening pressure of reservoir Section 2 and reservoir Section 3 is simulated together. When the injection pressure is simulated to 1.61 sg, the natural fractures of the first section are activated (A). When the injection pressure is simulated to 1.82 sg, the natural fractures of the second section are activated (B), indicating that the natural fractures of the first section of the reservoir are easier to be stimulated, and the potential mechanical activity is better. There are no natural fractures in the third section in which the critical opening pressure of the matrix reservoir is simulated (C). The results are shown in Table 1.
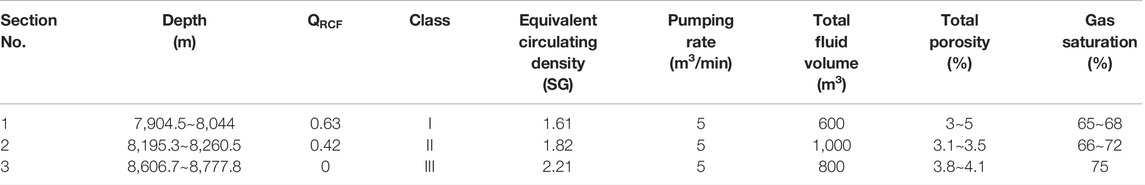
TABLE 2. Acid-fracturing reformation design in Well L1.
The total fluid amount squeezed into the third section is 528 m3, with the pumping rate of 0.41∼3 m3/min and the pump pressure of 12.5∼122.9/115.4 MPa. When the pumping is stopped to measure the pressure drop, the tubing pressure decreased from 96.5 to 86.9MPa, Figure 7. For the second reservoir with hydrochloric acid, the parameters are as follows: acid concentration: 20%, viscosity: 30mPa/s, density: 1.10 SG, acid consumption: 450 m3, consumption of fracturing fluid: 460 m3, pump pressure: 33.6–122.1/111.5 MPa, casing pressure: 36.1–60.7/55.6 MPa, pumping rate of 0.3–6.12/4.54 m3/min, and total fluid amount squeezed into the formation is 1,116.4 m3. The first reservoir adopts the same acid system, with acid consumption of 350 m3, fracturing fluid consumption of 120 m3, pump pressure of 32.1–125/113.1 MPa, casing pressure of 37.2–60.2/55.84 MPa, pumping rate of 0.53–8.16/5.87 m3/min, and the total fluid amount is 660 m3.
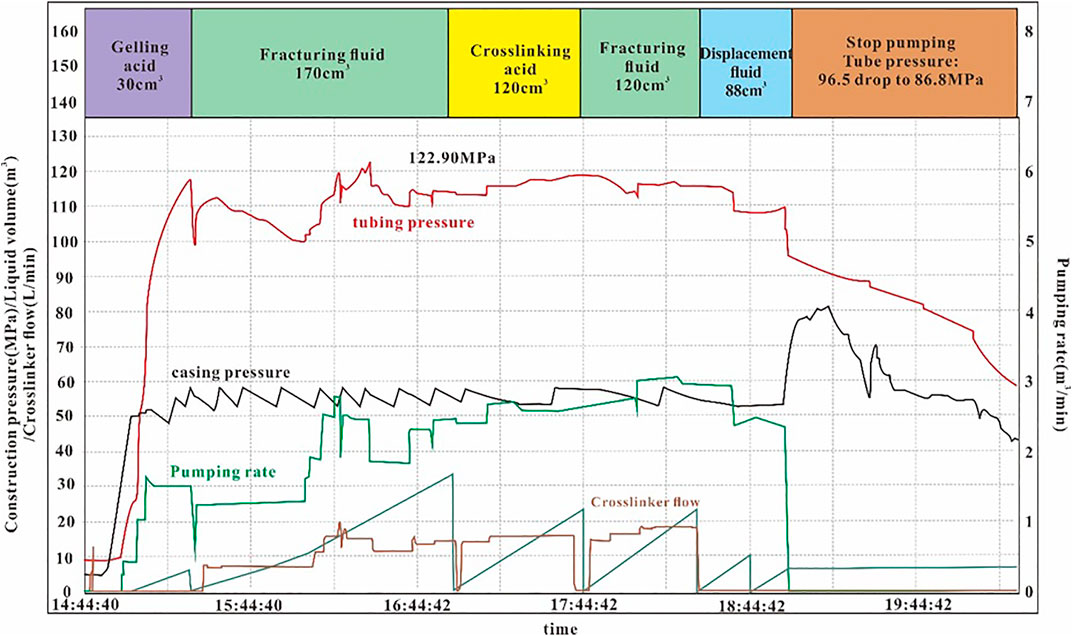
FIGURE 7. Curve of the acid-fracturing stimulation in 8,606.7–8,777.8 m (Section 4), and the relationship between tubing pressure and pumping rate shows that acid-fracturing fluid is constantly squeezed into the formation due to high porosity, but there is no hydraulic fracture newly generated.
It can be determined from the acid-fracturing construction curve (Figure 7) that the third reservoir is far from reaching the designed construction scale, the formation has not been fractured, and the output has not been obtained in the later production. As mentioned previously, the total porosity and gas saturation of this formation are the highest among the three. However, due to the lack of natural fractures and low reservoir quality, high production is not obtained after acid-fracturing, expectantly. The second and first sections are basically constructed according to the design parameters. After the pump is stopped, the tubing pressure decreases from 73.6 to 53.5 MPa (Figure 8), which means a sharp pressure drop and fractured formation. In the later stage, the oil output is calculated by changing the nozzle. Oil extraction in the second and first sections is carried out together, and under a 6-mm nozzle, tubing pressure is kept at 13MPa and the average daily oil output is 90 m3 so as to obtain high-yield industrial oil and gas production.
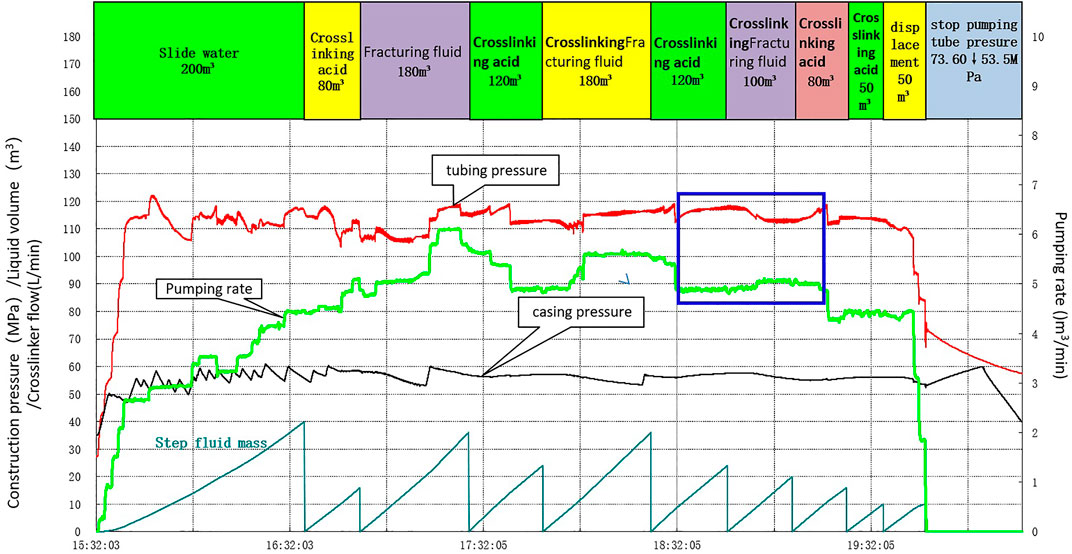
FIGURE 8. Curve of the acid-fracturing stimulation in 8,203.00–8,260.00 m (Section 3), and the relationship between tubing pressure and pumping rate described in the blue rectangular box indicates that when the pumping rate is stable, the tubing pressure increases and then decreases, and when the pumping rate increases, the tubing pressure is lower, indicating that the formation is stimulated to generate new hydraulic fractures or the pre-existing natural fractures are activated.
Based on the analysis of the application results of Well L1, the combination of
1) Natural fractures can continuously develop in the Cambrian subsalt dolomite reservoir with a burial depth of more than 8,000 m in the northern uplift of the Tarim Basin. They are not unevenly distributed, showing the characteristics of segmental development. The strike of natural fractures intersects with the horizontal principal stress azimuth at a small angle.
2) The 1D geomechanics is established based on logging data to analyze mechanical characteristics of natural fractures and define and calculate the mechanical activity index FGAI of natural fractures, which is further used as a key indicator to determine the likelihood of the potential mechanical activity of natural fractures.
3) In combination with the length, hydraulic aperture, apparent porosity, and FGAI of natural fractures, a reservoir quality characterization parameter
4) The practical application shows that the
The original contributions presented in the study are included in the article/Supplementary Material; further inquiries can be directed to the corresponding author.
GY, Conceptualization, Investigation, Writing—Original Draft; HZ, Supervision, Methodology, and Validation; YX, Software and Visualization; WZ, Formal Analysis; XW, Data Curation, Software; JL, Data Curation; SL, Formal Analysis.
This study is funded by the Major National Science and Technology Project (2016ZX05051), Major Science and Technology Project of PetroChina Company Limited (2018E-1803).
Authors GY, HZ, YX, WZ, XW, JL, and SL were employed by PetroChina Tarim Oilfield Company.
The remaining authors declare that the research was conducted in the absence of any commercial or financial relationships that could be construed as a potential conflict of interest.
All claims expressed in this article are solely those of the authors and do not necessarily represent those of their affiliated organizations, or those of the publisher, the editors, and the reviewers. Any product that may be evaluated in this article, or claim that may be made by its manufacturer, is not guaranteed or endorsed by the publisher.
Ameen, M. S., MacPherson, K., Al-Marhoon, M-I., and Rahim, Z (2012). Diverse Fracture Properties and Their Impact on Performance in Conventional and Tight-Gas Reservoirs, Saudi Arabia: The Unayzah, South Haradh Case Study. AAPG Bull. 96 (3), 459–492. doi:10.1306/06011110148
Barton, C. A., Zoback, M. D., and Moos, D. (1995). Fluid Flow along Potentially Active Faults in Crystalline Rock. Geol 23, 683–686. doi:10.1130/0091-7613(1995)023<0683:ffapaf>2.3.co;2
Barton, C. A., and Zoback, M. D. (1994). Stress Perturbations Associated with Active Faults Penetrated by Boreholes: Possible Evidence for Near-Complete Stress Drop and a New Technique for Stress Magnitude Measurement. J. Geophys. Res. 99, 9373–9390. doi:10.1029/93jb03359
Cai, B., Tang, B., and Ding, Y. (2014). Influence of Stress Shadow on Horizontal Well Fracturing[J]. Nat. Gas. Ind. 34 (7), 55–59. doi:10.3787/1000-0976.2014.07.009
Chen, M., Jin, Y., and Zhang, G. (2008). Petroleum Engineering Rock Mechanics. Beijing: Science Press.
Cheng, L., Zhong, L., and Liu, J. (2020). Diagenesis and Physical Properties of Subsalt Dolomite Reservoirs of the Cambrian, Bachu-Tazhong Areas, Tarim Basin [J]. Oil Gas Geol. 41 (2), 316–327. doi:10.11743/20200208
Coulomb, C. A. (1973). Surune application desregles demaximums etminimums a quelques problemes de statistique relatifs a larchitesture. Acad. Roy.” Sci. Mem. Mech. Min. Sci. 7, 343–382.
Du, J., and Pan, W. (2016). Accumulation Conditions and Play Targets of Oil and Gas in the Cambrian Subsalt Dolomite, Tarim Basin, NW China [J]. PETROLEUM Explor. Dev. 43 (3), 327–339. doi:10.11698/PED.2016.03.0210.1016/s1876-3804(16)30043-x
Fisher, Q. J., and Knipe, R. J. (2001). The Permeability of Faults within Siliciclastic Petroleum Reservoirs of the North Sea and Norwegian Continental Shelf. Mar. Petroleum Geol. 18, 1063–1081. doi:10.1016/s0264-8172(01)00042-3
Gong, L., Fu, X., Wang, Z., Gao, S., Jabbari, H., Yue, W., et al. (2019). A New Approach for Characterization and Prediction of Natural Fracture Occurrence in Tight Oil Sandstones with Intense Anisotropy. Bulletin 103 (6), 1383–1400. doi:10.1306/12131818054
Hennings, P., Allwardt, P., Paul, P., Zahm, C., Reid, R., Alley, H., et al. (2012). Relationship between Fractures, Fault Zones, Stress, and Reservoir Productivity in the Suban Gas Field, Sumatra, Indonesia. Bulletin 96 (4), 753–772. doi:10.1306/08161109084
Jaeger, J. C., and Cook, N. G. W. (1979). Fundamentals of Rock Mechanics. first edition. London: Chapman & Hall.
Jiang, T. W., Zhang, H., Xu, K., Yin, G. Q., Wang, H. Y., Wang, Z. M., et al. (2021). Technology and Practice for Quantitative Optimization of Borehole Trajectory in Ultra-deep Fractured Reservoir:a Case Study of Bozi A Gas Reservoir in Kelasu Structural Belt, Tarim Basin. China Pet. Explor. 26 (4), 149–161. doi:10.3969/j.issn.1672-7703.2021.04.001
Gong, L., Wang, J., Gao, S., Fu, X., Liu, B., Miao, F., et al. (2021). Characterization, Controlling Factors and Evolution of Fracture Effectiveness in Shale Oil Reservoirs. J. Petroleum Sci. Eng. 203, Article ID, 108655 pages. doi:10.1016/j.petrol.2021.108655
Liu, X., and Luo, P. Rock Mechanics and Petroleum Engineering. Beijing: Petroleum Industry Press,2004.
Lu, S. K., Wang, D., Li, Y. K., Meng, X. J., Hu, X. Y., and Chen, S. W. (2015). Research on Three-Dimensional Mechanical Parameters’ Distribution of the Tight Sandstone Reservoirs in Daniudi Gasfield[J]. Nat. Gas. Geosci. 26 (10), 1844–1850.
Luthi, S. M., and Souhaite, P. (1990). Fracture Apertures from Electrical Borehole Scans. Geophysics 55 (3), 821–833. doi:10.1190/1.1890143
Ni, X., Huang, L., and Chen, Y. (2017). Characteristics and Main Controlling Factors of the Cambrian Pre-salt Dolomite Reservoirs in Tazhong Block, Tarim Basin[J]. Oil Gas Geol. 2017 (3), 489–498.
Otsuki, M., and Matsukawa, H. (2013). Systematic Breakdown of Amontons' Law of Friction for an Elastic Object Locally Obeying Amontons' Law. Sci. Rep. 3, 1586. doi:10.1038/srep01586
Potluri, N., Zhu, D., and Hill, A. D. (2005). Effect of Natural Fractures on Hydraulic Fracture Propagation, The SPE European Formation Damage Conference held in Scheveningen, The Netherlands, 25-27 May 2005. SPE 94568.
Prats, M. (1981). Effect of Burial History on the Subsuriace Horizontal Stresses of Formation Having Different Material Properties, Society of Petroleum Engineers Journal, 21, SPEJ658–662. doi:10.102118/9017-PA
Townend, J., and Zoback, M. D. (2000). How Faulting Keeps the Crust Strong. Geology 28 (5), 399–402. doi:10.1130/0091-7613(2000)028<0399:hfktcs>2.3.co;2
Xu, B., Li, Y., and Xiang, G. E. (2010). Analysis of Distributing Law and Influencing Factors of Compact Clastic Rock Fracture in Xujiahe Formation in West Sichuan Region [J]. Well logging Tech. nology 34 (5), 437–441.
Yang, H., Chen, Y., and Tian, J. (2020). Great Discovery and its Significance of Ultra-deep Oil and Gas Exploration in Well Luntan-1 of the Tarim Basin [J]. China Pet. Explor. 25 (2), 62–72. doi:10.3969/1672-7703.2020.02.007
Yin, G., Zhang, H., and Yuan, F. (2015). Geomechanical Characteristics of Dolomite Reservoir and its Application in Stimulation Optimization: an Example of East of Tazhong[J]. Nat. Gas. Geosci. 26 (7), 1277–1288. doi:10.11764/1672-1926.2015.07.1277
Yu, Y., Zhu, W., Li, L., Wei, C., Dai, F., Liu, S., et al. (2017). Analysis on Stress Shadow of Mutual Interference of Fractures in Hydraulic Fracturing Engineering[J]. Chin. J. Rock Mech. Eng. 36 (12), 2926–2939. doi:10.13722/j.cnki.jrme.2017.0405
Zeng, L., Gong, L., Guan, C., Zhang, B., Wang, Q., Zeng, Q., et al. (2022). Natural Fractures and Their Contribution to Tight Gas Conglomerate Reservoirs: A Case Study in the Northwestern Sichuan Basin, China. J. Petroleum Sci. Eng. Volume 210, 110028 pages. doi:10.1016/j.petrol.2021.110028
Zhenzhong, C., Hui, Z., Haijun, Y., Guoqing, Y, Yongfeng, Z, Peisi, C, et al. (2015). Investigation of Geomechanical Response of Fault in Carbonate Reservoir and its Application to Well Placement Optimization in YM2 Oilfield in Tarim Basin. In The SPE Annual Technical Conference and Exhibition held in Houston, Texas, USA, 28–30 September 2015. SPE-175017-MS.
Zoback, M. D., Kohli, A., Das, I., and Mcclure, M. (2012). The Importance of Slow Slip on Faults during Hydraulic Fracturing Stimulation of Shale Gas Reservoirs[C], In Society of Petroleum Engineers SPE Americas Unconventional Resources Conference, Pennsylvania, USA Pittsburg, 1–9. doi:10.2118/155476-MS
Keywords: ultra-deep Cambrian subsalt dolomite reservoir, natural fracture activity, reservoir quality classification, northern uplift, acid-fracturing
Citation: Yin G, Zhang H, Xin Y, Zhang W, Wu X, Liang J and Lai S (2022) Ultra-Deep Dolomite Reservoir Quality Classification and its Effect on Acid-Fracturing Based on Natural Fracture Activity Analysis: A Case Study of the Cambrian Subsalt Reservoir in Northern Uplift of Tarim Basin. Front. Earth Sci. 10:904064. doi: 10.3389/feart.2022.904064
Received: 25 March 2022; Accepted: 09 May 2022;
Published: 23 June 2022.
Edited by:
Lei Gong, Northeast Petroleum University, ChinaReviewed by:
Wenlong Ding, China University of Geosciences, ChinaCopyright © 2022 Yin, Zhang, Xin, Zhang, Wu, Liang and Lai. This is an open-access article distributed under the terms of the Creative Commons Attribution License (CC BY). The use, distribution or reproduction in other forums is permitted, provided the original author(s) and the copyright owner(s) are credited and that the original publication in this journal is cited, in accordance with accepted academic practice. No use, distribution or reproduction is permitted which does not comply with these terms.
*Correspondence: Guoqing Yin, eWluZ3VvcWluZy10bG1AcGV0cm9jaGluYS5jb20uY24=
Disclaimer: All claims expressed in this article are solely those of the authors and do not necessarily represent those of their affiliated organizations, or those of the publisher, the editors and the reviewers. Any product that may be evaluated in this article or claim that may be made by its manufacturer is not guaranteed or endorsed by the publisher.
Research integrity at Frontiers
Learn more about the work of our research integrity team to safeguard the quality of each article we publish.