 Muhammad Raiees Amjad
 Muhammad Zafar
 Tausif Ahmad
 Muyyassar Hussain
 Urooj Shakir
- 1Department of Earth and Environmental Sciences, Bahria School of Engineering and Applied Sciences, Bahria University, Islamabad, Pakistan
- 2Advance Reservoir Characterization, LMK Resources, Islamabad, Pakistan
Overpressure conditions in Potwar Basin of Pakistan pose significant drilling and completion problems. Specifically, in eastern Potwar, abnormally high pressures are observed within structural compartments of Murree Formation of Neogene age. Compaction disequilibrium and tectonic stresses are considered as two major factors, controlling pore pressures in this foreland basin. Undercompaction of sediments due to high sediment influx affects the porosity-depth relationship as the rock deviates from the normal compaction trend. Demarcation of structural geometries is critical in understanding abnormal pressure conditions within thick molasse deposits of Murree Formation. Eastern Potwar is divided into three zones on the basis of structural geometries, including duplex thrust sheets, salt-cored anticlines, and triangular zones. Geohistory analysis and pore pressure prediction have been performed for determining the overpressuring mechanism. Log-based pressure prediction in different oil fields of eastern Potwar depicts anomalous pressure conditions in some of the wells. High-sedimentation rate during Miocene times resulted in a low porosity reduction rate due to the inability of fluid to escape out of the pores. Eaton’s method was used to predict the pore pressure, and these pressure curves were calibrated against measured pressure to validate the results. Pressures predicted in Qazian-1X well showed very good correlation with measured pressure data. Most of the wells with overpressure intervals exhibited high porosity values, showing deviation from the normal compaction trend. This pressure prediction revealed that compaction disequilibrium is the primary cause of overpressure conditions within Murree Formation, resulted in response to the rapid rate of sedimentation. The deformation mechanism and presence of different structural geometries also contributed in the development of abnormal pressures.
1 Introduction
Drilling problems caused under the uncontrolled geopressure conditions can lead to well abandonment, which costs billions of dollars to the oil and gas industry (Baouche et al., 2020; Agbasi et al., 2021). Exploration companies are putting great efforts in getting a better pore pressure prognosis for enhanced pre-drill planning to reduce non-productive time owing to geopressure-related problems (Villacastin, 2012). Pore pressure prediction and fluid flow assessment are critically examined during the development of hydrocarbon fields, especially in the well planning phase (Najibi et al., 2017; Abdelghany et al., 2021; Radwan and Sen, 2021). According to a survey of 2520 wells drilled in the Gulf of Mexico, shallow water flow, kicks, lost circulation, and gas flow accounted for more than 24 percent of total drilling time. This was solely due to inaccurate prediction of pore pressure and fracture gradient (Dodson et al., 2004).
Overpressure is generated when the formation fluid is unable to escape out of pores at a rate to maintain equilibrium with the column of formation water (Udo et al., 2015). As a result of this, the formation is overpressured at a particular depth when the fluid pressure in pores is higher than hydrostatic pressure (Figure 1). In impermeable rocks, such as shale, retained pore fluids must support the total overlying rock column and result in the generation of abnormal pressures (Nwankwo and Kalu, 2016). The mechanisms causing overpressures include, compaction disequilibrium, gas cracking/hydrocarbon generation, aquathermal expansion, compression due to tectonics, transformation of clay minerals (e.g., illitization), hydraulic head, and hydrocarbon buoyancy (Yassir et al., 2002; Gutierrez et al., 2006; Zhang, 2013). The majority of abnormal pressure events involving compaction disequilibrium have been observed in geologically younger basins with rapid sedimentation (Satti et al., 2015). Examples for these cases include U.S. Gulf Coast, Beaufort Sea, Niger Delta, Mackenzie Delta, Adriatic Sea, North Sea, Mahakam delta, Malay Basin, Nile Delta, Eastern Venezuelan Basin (Trinidad), and the Potwar Basin of Pakistan (Heppard et al., 1998; Law and Spencer, 1998; Nelson and Bird, 2005; Morley et al., 2011).
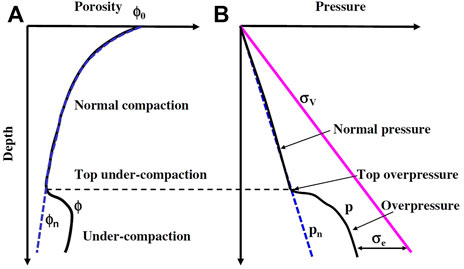
FIGURE 1. Schematic diagram showing the trend of porosity (A) and pore pressure (B) with respect to depth in a sedimentary basin. The blue dash line in (A) represents the normal compaction trend line, and the black solid line represents the measured porosity. Pore pressure curve showed by the black line in (B) deviates from the normal pressure curve (blue dash line), marking the top of the overpressure zone. Vertical effective stress (σe) is represented by the difference between the pore pressure curve and overburden pressure (σv) marked by a pink solid line. Porosity reversal in the overpressure zone marked by black dash line in (A) can be noticed due to undercompaction of sediment (Zhang, 2013).
For many years, abnormally high pressures have posed significant drilling and completion problems in oil and gas wells of Pakistan. The principal areas of abnormally high pressure are located in the Makran basin (offshore) in the south and the Potwar Basin (onshore) in the north-central part (Law et al., 1998). The Potwar Basin (Figure 2) is the principal oil-producing basin of Pakistan where Paleogene and older carbonate and sandstone formations acts as major reservoirs (Kadri, 1995; Craig et al., 2018). Abnormally high formation pressures are reported in Neogene rocks of Potwar Basin, specifically within Murree Formation of Miocene age (Kadri, 1991). Pressures as high as lithostatic are reported, which are difficult to avoid because of the inability to predict overpressure zones (Malick, 1979; Kadri, 1991).
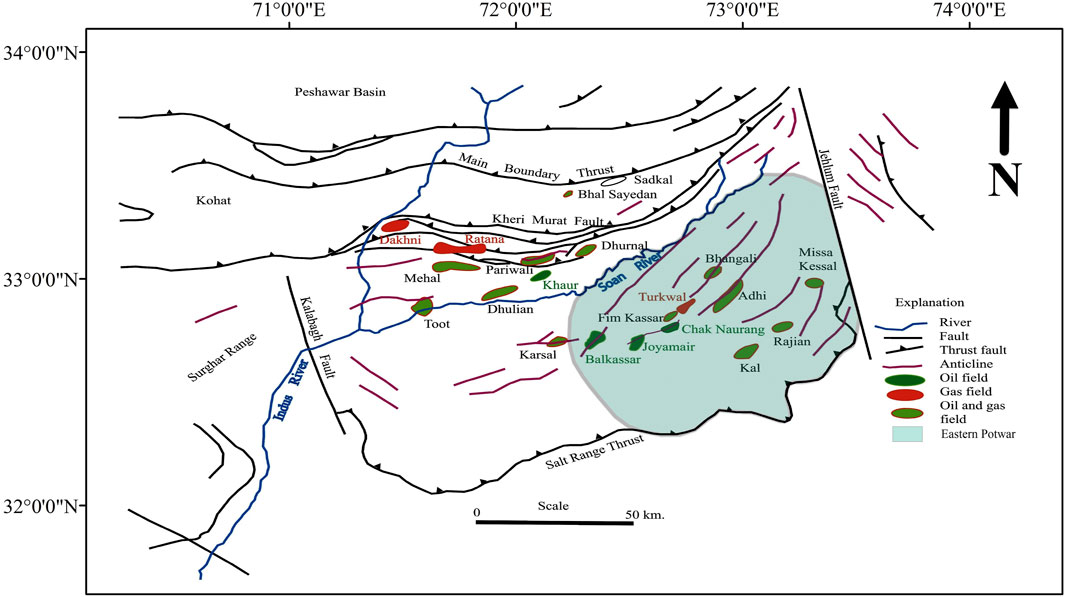
FIGURE 2. Generalized structural map of Potwar and Kohat basins with major oil and gas fields. Study area (eastern Potwar) is highlighted by light blue polygon covering the fields used for investigation of pore pressure predictions. Major faults are running in NE–SW direction in these hydrocarbon producing fields (Wandrey et al., 2004).
The depth of overpressured zones in the eastern Potwar is reported as shallow as 290 m (Malick, 1979). Highest pressures are reported in wells drilled along the crests of anticlines, in the eastern part of the basin (Kadri, 1991). Pressure gradients in the northern and eastern parts of Potwar Basin are as high as 0.9 psi/ft, while southern part showed slightly lower values ranging from 0.7 to 0.8 psi/ft (Malick, 1979). At shallow depths, pressures close to lithostatic are observed, for example, half of the wells in the Adhi Oil Field are prematurely abandoned due to high pressures. In Dhulian oil field, high pressure water sands are encountered at shallow depths of 610–915 m in Chinji Formation. Likewise, Dakhni, Khaur, and Chak Naurang fields possess the same issue; however, Balkassar oil field exhibit relatively lower pressure gradients despite having structural complexity (Afzal and Rasool, 2000).
As most of the wells in Potwar Basin are drilled on the basis of structural geometries, it remains uncertain whether there is a relationship between structural deformation and overpressuring (Law et al., 1998). Therefore, there is a need to identify the overpressuring mechanism and depths of those abnormal pressure zones in order to reduce the number of well abandonment. In this study, prediction of pore pressures in structurally controlled compartments is evaluated using the well log data of multiple oil fields. An attempt is made to highlight the depths of abnormal pressure zones in eastern Potwar and to define a consistent way of predicting pore pressures.
2 Geological Settings
Potwar Basin, part of the Himalayan foreland fold and thrust-belt, is a major foreland basin of Pakistan on the east of Indus River (Kadri, 1995). Its northern boundary is marked by the Main Boundary Thrust (MBT) whereas Salt Range Thrust (SRT) is the southern limit of Potwar Basin (Aamir and Siddiqui, 2006). Eastern and western boundaries of the basin are marked by Jhelum strike slip fault and Kalabagh strike slip fault, respectively. Soan River which is flowing through the middle of the Potwar Basin follows its path along the axis of the Soan syncline (Figure 2).
The complex structural deformations in Potwar, resulted due to the collision of Indian and Eurasian plates, started in early-to-middle Eocene age (Stoneley, 1974). Since the beginning of collision, about 2,000 km of crustal shortening has been occurred within Eurasia (Patriat and Achache, 1984). SRT, a low dipping thrust fault underlying the Potwar Basin, transported the whole sedimentary succession in south direction along a decollement formed in the Salt Range Formation of Precambrian age (Lillie et al., 1987; Jaumé and Lillie, 1988). Disharmonic folding in sedimentary section relative to the underlying basement rocks has created salt-cored anticlines, which are separated by broader synclines. The structural axis of the basin trends in an east-northeast direction, nearly parallel to the Soan syncline (Pennock et al., 1989).
Potwar Basin is comprised of siliciclastic, carbonate, and evaporitic sequences from Precambrian to recent age with an average thickness of about 9000 m. Sedimentary succession of Cenozoic Era (Table 1) includes Paleogene rocks of the marine environment whereas Neogene and Quaternary rocks are of terrestrial molasse deposits (Shah, 2009). Thickness of Paleogene rocks ranges from 240 to 300 m while sediments of Neogene rocks are as thick as 6,400 m (Fatmi et al., 1984). The molasse deposits of Neogene include the Rawalpindi Group of Miocene age and the Siwalik Group of Miocene-to-Pleistocene age (Qayyum et al., 2021). The Murree Formation of Miocene age acts as a regional seal in the basin for the reservoirs of Eocene formations. However, this formation is also reported as the youngest oil-producing reservoir in Khaur oil field of Potwar Basin (Wandrey et al., 2004).
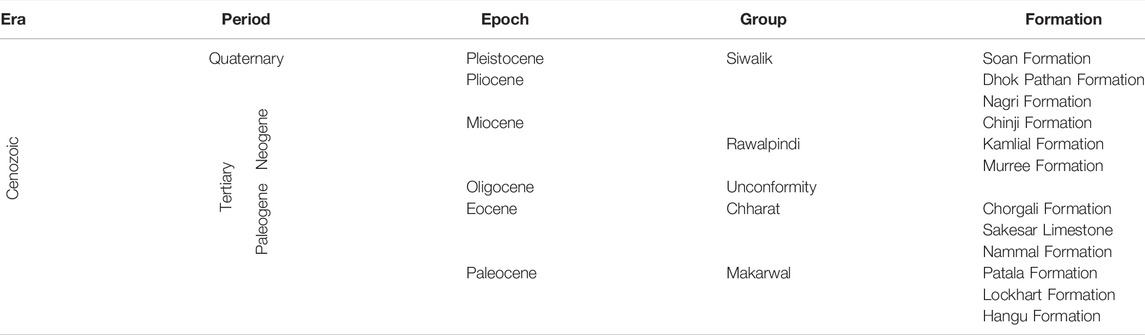
TABLE 1. Generalized stratigraphic column of Cenozoic Era for Potwar Basin. A total of four groups, including Makarwal group of Paleocene age, Chharat group of Eocene age, Rawalpindi group of Miocene age, and Siwalik group of Miocene-Pleistocene age. Murree Formation, included in the Rawalpindi group of Miocene age, is investigated for the determination of abnormal pressure zones (Shah, 2009).
The stratigraphy and sedimentology of the Rawalpindi and Siwalik groups have been studied extensively (Pilbeam et al., 1977; Johnson et al., 1986; Burbank and Raynolds, 1988). These rocks are mainly composed of fluvial deposits including the sand, silt, conglomerate, and shale facies (Amjad et al., 2019). The rocks of Infracambrian age, eroded due to uplifting of Himalayas, are identified as the provenance of these sedimentary units (Khan et al., 1986). Due to the high rate of uplifting, the sediments derived from these thrust sheets, deposited at a very rapid rate along the northern margin of Potwar Basin (Wahid et al., 2021). The rate of sedimentation for the deposition of Siwalik sequence ranges from 50 to 125 in/1,000 yr and each lithological unit within the Rawalpindi and Siwalik groups show variable thicknesses and are highly lenticular (Raynolds and Johnson, 1985).
3 Materials and Methods
Potwar Basin is a major hydrocarbon-producing area, having multiple active oil and gas production fields. Multiple seismic transects and number of wells from nine different oil fields of eastern Potwar are evaluated for the pore pressure prediction in Murree Formation. The seismic data includes 2D migrated lines along with navigation data while log data consisted of gamma ray (GR), sonic (DT), resistivity (RES), and density (RHOB) curves. Subsurface geometries are outlined to map structural compartments, and geohistory analysis is performed to determine the subsidence level and the sediment influx rate in the study area. The abnormal pressure zones are predicted using the log data, and the overpressuring mechanism is proposed by integrating structural compartments and burial history analysis. Methodology workflow adopted for pore pressure prediction in eastern Potwar is given in Figure 3.
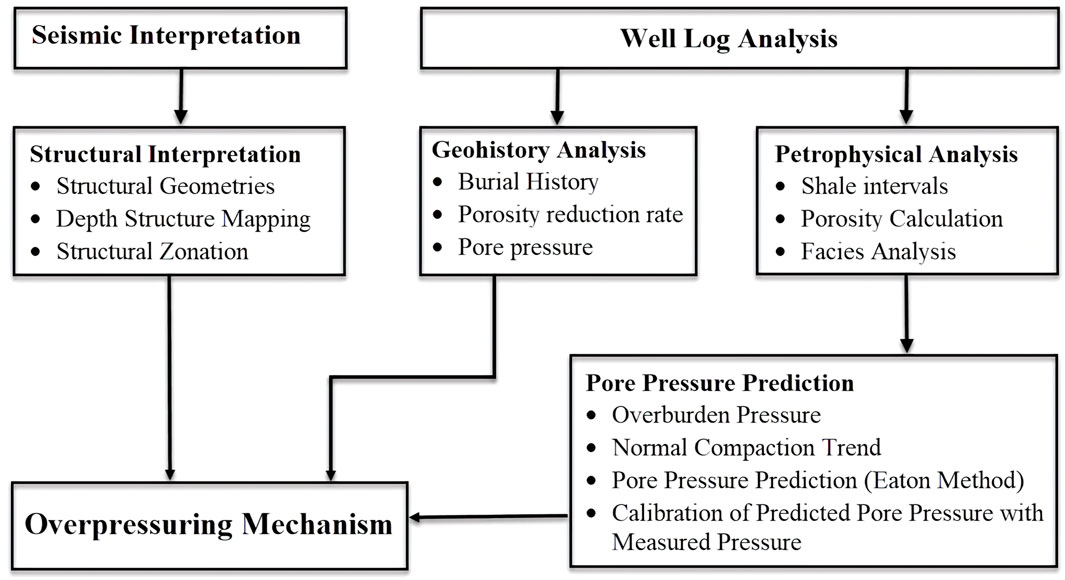
FIGURE 3. Technical roadmap of research study showing adopted methodology workflow for pore pressure prediction in eastern Potwar.
3.1 Subsurface Structural Geometries
The Neogene sediments deposited in Potwar Basin experienced a high rate of sedimentation followed by the uplifting due to tectonic activity. In order to understand the overpressure mechanism, structural geometries of eastern Potwar needs to be delineated. The seismic data are used for demarcating subsurface structure focusing on the Cenozoic tectonic events. A number of 2D seismic transects, covering major oil and gas fields of eastern Potwar are interpreted to mark the structural compartments. The top Murree, top Eocene (base of Murree/top of Chorgali Formation), and basement horizon along with existing faults are marked on seismic profiles. The depth structure map of Murree Formation is generated, and on the basis of major thrust geometries, the area is divided into three zones.
3.2 Geohistory Analysis
Geohistory analysis is the term commonly used for the study of burial history (subsidence and uplift) and related processes including decompaction/compaction. One of the major components which control the pore pressure is the compaction of sediments. The burial history plot is generated and the porosity computed from the logs is used to determine the porosity reduction rate for the lithologies. The pore pressure curve is computed to relate it with the subsidence level, sedimentation rate, and porosity reduction with increase in burial depth. The fundamental input data required for the burial history plot, includes stratigraphic sequence, formation thicknesses, hiatus, formation tops, ages of deposition, lithologies, and petroleum system information.
The data of total seven events, including six formations and a hiatus during Oligocene age, is utilized for geohistory analysis (Table 2). The end age for each event is assigned according to Haq et al. (1987) model, and the lithological information is added on the basis of stratigraphic information and log results. The petroleum system parameters include seal, reservoir, and source. The major focus of the study is to evaluate the pressure conditions within Murree Formation (regional seal); therefore, the burial history plot is generated up to reservoir formations of Eocene age. Measured data including bottom hole temperature (BHT), porosity, pressure, and mud weight information is obtained from the wells.
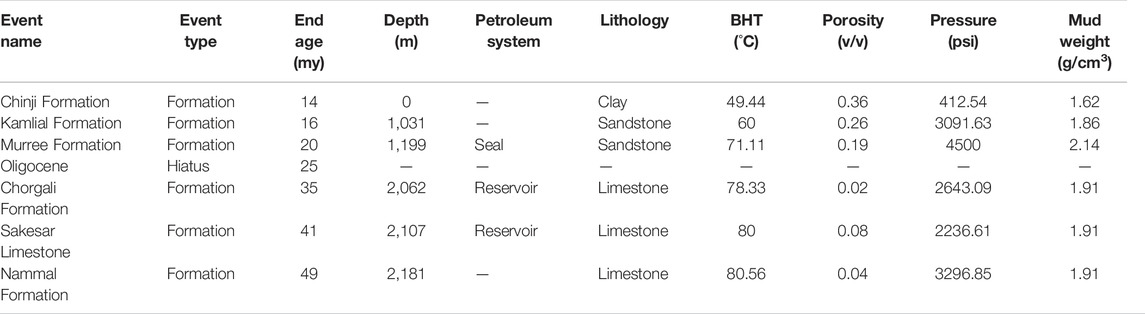
TABLE 2. Input parameters used for the generation of burial history plot and pressure simulation in Qazian-1X well. Geohistory analysis is performed up to Eocene age using data of total seven events (six formations and a hiatus). Lithologies of each formation are mentioned as per stratigraphic information and log results whereas petroleum system components are assigned according to the literature. End age is assigned according to Haq et al. (1987) model. Depth, BHT, porosity, pressure, and mud weight information is obtained from the well data.
In this study, a relationship between the compaction and porosity is generated using BasinMod software. The software uses the porosity-effective stress compaction method for computing the porosity reduction trend with depth. The fluid flow model for the compaction of sedimentary basins relates that porosity is governed by compaction (Wangen et al., 1990). Using the porosity-effective stress compaction method, simulation is performed for pressure prediction and porosity reduction rate of Murree Formation in Qazian-1X well with respect to time during its depositional history.
The transient heat flow method is selected for the generation of thermal data. A total of four boundary parameters are used for the basin modeling, which includes sea level, sea depth, paleo-surface temperature, and heat flow. The sea level history is generated using Haq et al. (1987) model for paleo sea level changes, which indicated a maximum of 230 m increase in the sea level during the Eocene time and followed by the reduction of sea depth up to 0 m at present. Location of the study area with respect to tectonic plates (hemisphere and plate name) is added in the software and well location is given as the latitude for calculation of temperature data. With respect to geological ages, software computes the paleo-surface temperature with values ranging from 18 to 26°C. Heat flow is computed from the BHT data and the temperature curve generated by the software is calibrated with the BHT data to check and verify the results. The present day heat flow value computed is 55.117 (mW/m2).
3.3 Pore Pressure Prediction From Well Log Data
Pore pressure is determined using the well data by calculating the overburden pressure, hydrostatic pressure, and normal compaction trends in the area. The initial concept for deriving pore pressure from the well data using the shale properties was provided by Hottmann and Johnson (1965). Analyzing the DT values in the Neogene shales of southern Louisiana Gulf Coast and upper Texas, they noted that the porosity in the sediments decreases with depth. This decrease in the porosity is considered as a function of burial depth and termed as the “normal compaction trend” whereas the fluid pressure generated under this normal trend is said to be the hydrostatic pressure (Hottmann and Johnson, 1965). In case of presence of any abnormal compaction within the sediments, log curves will deviate from the normal trend line. Within abnormally high pressure zones, values of DT and porosity in shale will become high as compared to the normal compaction trend.
Terzaghi’s and Biot’s effective stress law provides the basis for the pore pressure prediction (Biot, 1941; Terzaghi et al., 1996). According to their theory, the fluid pore pressure is the function of the total stress and vertical effective stress. These terms can be expressed by the following relation:
where p is the pore pressure, σv is the overburden stress, σe is the vertical effective stress, and α is the Biot effective stress coefficient.
Formation density log can be used for calculating the overburden stress whereas vertical effective stress can be correlated by the difference between the pore pressure curve and overburden pressure. Figure 1B provides detail for these parameters including the formation pore pressure, hydrostatic pressure, overburden stress, and the effective stress with respect to the depth. The basic methodology involving the quantification of pore pressure from the variations of rock properties is based on the log response of DT and RES curves (Mouchet and Mitchell, 1989; Bell et al., 2002; Sayers, 2006).
Impermeable clays play a very vital role in generating overpressuring conditions as the fluids have difficulty in escaping from impermeable layers with mechanical compaction. Shale intervals are marked by drawing shale baseline using the GR curve to determine the corresponding shale values in porosity or the DT curve. A gamma ray trend (GRT) line is drawn on the GR log curve to separate the clay points from the non-clay ones. Clay and sand facies evaluation is then carried out using multi-mineral model based on the porosity log data. These clay and sand facies intervals are correlated with the porosity and pressure curves in order to demarcate the abnormal pressure intervals within Murree Formation.
As the density log is not recorded on the non-reservoir intervals, due to which RHOB is not available against the total thickness of the Neogene strata drilled in the wells. Those intervals where density log is unavailable, the bulk density curve is computed using Gardner’s equation (Gardner et al., 1974), which is given as:
where ρb is bulk density of the rock interval, Vp is the compressional wave velocity, A is the coefficient (typically 0.23), and B is the exponent (typically 0.25). Sonic porosity is calculated using the transit time computed by the DT curve. Value of the transit time is directly proportional to porosity which shows that if there is increase in the travel time of wave, the rock will be having high porosity (Rider, 1996). The formula used for calculating sonic porosity is given as follows:
where φS is the sonic porosity, ΔTma is travel time of sound wave in the rock (47.6 μs/ft limestone, 55 μs/ft sandstone, 75 μs/ft shale), ΔTf is the travel time in fluid (185 μs/ft), and ΔT is the value of the DT curve. Once porosity is calculated, overburden pressure is computed using the bulk density values from the density log, which is the overall pressure exerted by the lithostatic column from surface up to the zone of interest (Plumb et al., 1991). Equation used for the calculation of overburden pressure in psi units is as follows:
where OB is the overburden pressure, g is gravity acceleration, and z is the depth. The pressure exerted by the weight of a column of water starting from the surface to the depth z is the hydrostatic pressure (HP) (Batzle and Wang, 1992; Bjorlykke, 2010). Equation used for the calculation of hydrostatic pressure in psi units is as follows:
where ρf is the density of fluid (1.09 g/cm3).
Defining a normal compaction trend is one of the key stages in pore pressure prediction. Sediments subjected to normal compaction would experience a decrease in porosity at the same time as pore fluid is expelled (mechanical compaction). During burial, increasing overburden is the prime cause of porosity reduction and fluid expulsion. If the sedimentation rate is low, fluids within the pore space can escape, resulting in normal compaction. If this is the case, then, porosity decreases at a predictable rate with increasing depth, referred to as the normal compaction trend (NCT) (Bowers, 1995). Eaton’s method is based on empirical methodology, which utilizes the ratio of the recorded value of DT or RES curve to the value of same on the NCT curve (Eaton, 1975). Equation used for the calculation of pore pressure in psi units is as follows:
where PP is the pore pressure (psi) and NCT is the normal compaction trend line.
Log-based pore pressure prediction using Eaton’s method is adopted in this study for the delineation of overpressure zones within Murree Formation. Predicted pore pressure (PPP) values have to be calibrated with the measured pore pressure data (Mahmood et al., 2021). As Murree Formation is considered as a regional seal for the reservoir rocks of Eocene age in the Potwar area, due to which the availability of drill-stem test (DST) or repeat formation test (RFT) data is very rare. In all producing oil fields, companies record DST or RFT data in the reservoir intervals only. The Qazian-1X well is the only well in which DST is recorded in the Murree Formation, which indicates that the pressure gradients in the target formation are as high as 0.81 psi/ft (Law et al., 1998). In rest of the wells, only static pore pressure data are recorded against the drilled thickness of Murree Formation. Pressures recorded during the DST are used for calibrating the PPP values in Qazian-1X well. A total of four DST depths are recorded in Qazian-1X well within Murree Formation. Pressure data of these four depths are given in Table 3.
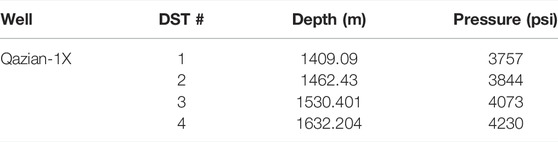
TABLE 3. DST data of Murree Formation recorded in Qazian-1X well. A total of four DSTs are recorded in Murree Formation encountered in Qazian-1X well on the basis of oil shows observed during drilling (Law et al., 1998).
4 Results
4.1 Subsurface Structural Geometries
Interpreted seismic sections of selected profiles passing through the wells are shown in Figures 4–7. Two horizons (top Murree and top Eocene) are marked on the seismic data, and the depth structure map of top Murree is generated (Figure 8). Based upon the dominating geometries and structural style, the study area is categorized into three different zones.
1) Zone-1 (south eastern part) - Duplex based repeated thrust sheets
2) Zone-2 (northern part) - Decoupled salt-cored anticlines
3) Zone-3 (south western part) - Triangular zone dominated region
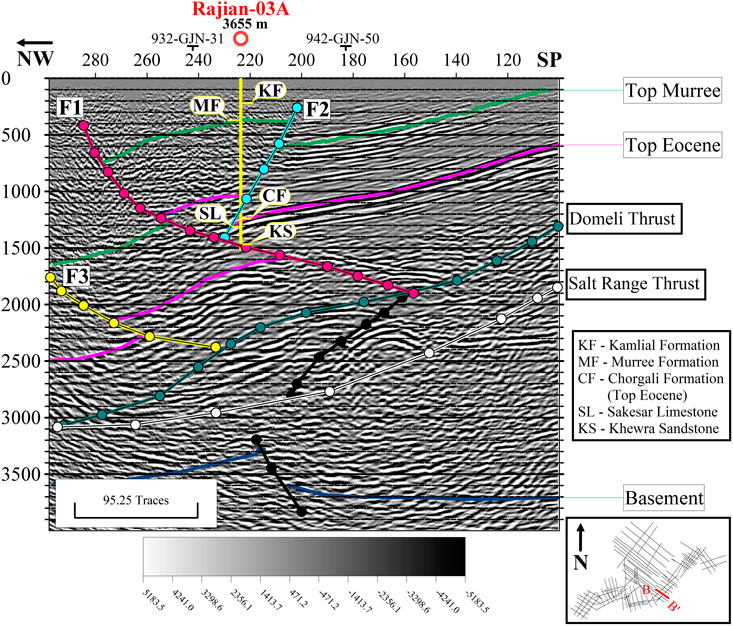
FIGURE 4. Interpreted seismic section of line 925-GJN-10 of Rajian field in zone-1 of the eastern Potwar study area. Marked horizons include top Murree (green) and top Eocene (purple) along with fore thrusts (Salt Range Thrust, Domeli thrust, and F2) and back thrust faults (F1 and F3) in different colors. Duplex based repeated thrust sheets are present in the area and Rajian-03A well has been drilled on the top sheet.
4.1.1 Zone-1 (South Eastern Part)—Duplex Based Repeated Thrust Sheets
The zone-1 comprises of Kal, Rajian, Qazian, and Missa Keswal oil fields (Figure 8). Structural configuration in the Rajian area shows the presence of duplex based repeated thrust sheets formed by Domeli thrust and a basal decollement due to SRT (Shakir et al., 2019; Sajid et al., 2021). The hanging wall in these structures is further deformed by several low angle imbricates and lag faults resulting into a duplex geometry with stacked thrust sheets. Consequently, duplication of Cambrian-to-Miocene sequence with increasing overburden from east to west is observed on the interpreted seismic section (Figure 4).
Toward east, Qazian and Missa Keswal wells are drilled on a pop-up geometry (Abid et al., 2019). This pop-up structure resulted from north dipping splay (F4) of Domeli thrust and a back thrust (F5) termed as Qazian Fault (Figure 5). The nature of Domeli thrust shows a steeply dipping reverse fault at shallow depths, to a gentle and low angle fault at basal level near SRT. This represents a positive flower geometry that could be the result of its proximity with Jhelum Strike Slip Fault to the east. At Rajian 3A well, the north dipping Domeli thrust is bisected by a south dipping F1 back thrust, forming a passive roof duplex.
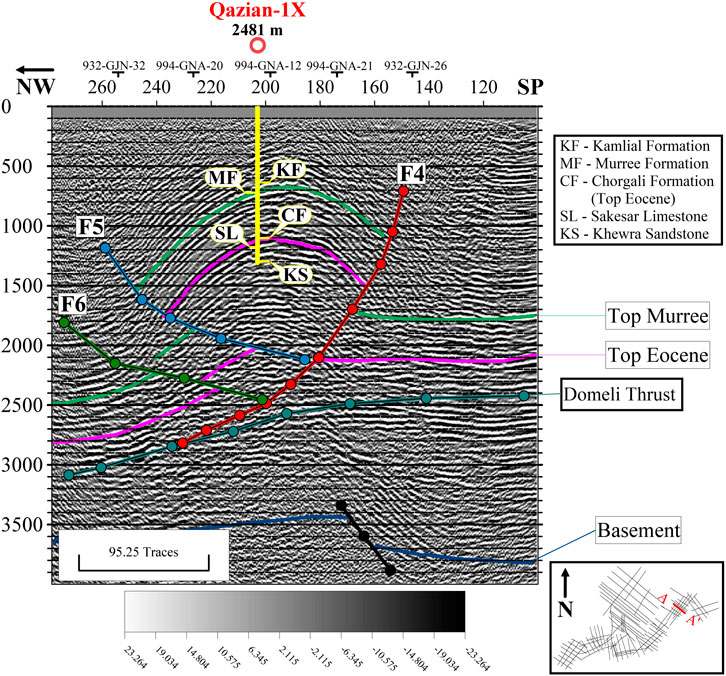
FIGURE 5. Interpreted seismic section of line 994-GNA-09 of Qazian field (zone-1). Structural geometry shows repeated thrust sheets with a pop-up structure bounded by faults F4 and F5 on the top sheet. Qazian-1X well is drilled on the pop-up anticlinal structure formed by F4 and F5 faults.
4.1.2 Zone-2 (Northern Part)—Decoupled Salt-Cored Anticlines
Several pop-up structures bounded by parallel, east–west running reverse faults are interpreted in this zone (Figure 8). The subsurface structural framework is controlled by basement decollement (SRT) characterized by normal faulting ramp structures at the Eocambrian level. These ramps provided base for the propagation of boundary faults (F7, F8, F12, and F15) and their respective opposite dipping faults (F9, F10, F11, F13, and F14) forming pop-up geometry with the salt core. Interpreted seismic section in Figure 6 also represents the subsequent southward shift of deformation creating a synclinal structure with increase in the thickness of Miocene sediments while less overburden at the core of Adhi anticlinal structure.
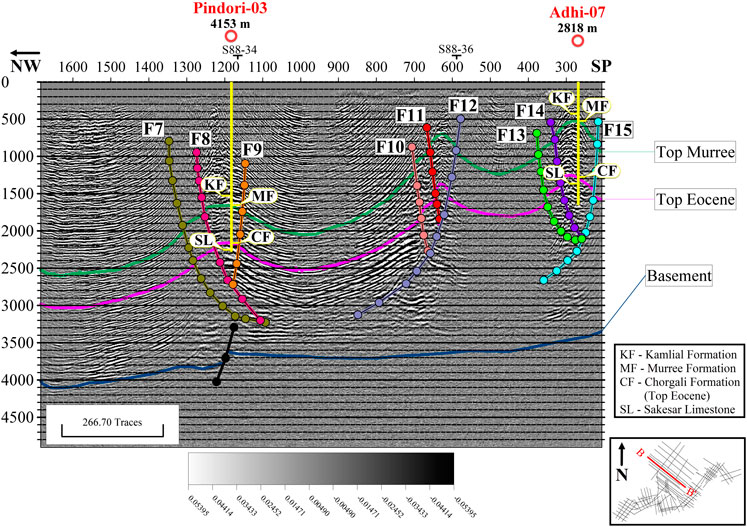
FIGURE 6. Interpreted seismic section of line SOX-S88-08 (zone-2) showing salt-cored anticlinal structures of Pindori (left), Bhangali (middle), and Adhi (right) fields. Murree Formation lies at a greater depth in Pindori-03 well whereas it is encountered at a very shallower depth in Adhi-07 well.
4.1.3 Zone-3 (South Western Part)—Triangular Zone Dominated Region
This region is characterized by triangular zones between a fore thrust and back thrust at a deeper level. Southern hanging wall of F16 is thrusting more relatively to footwall with north verging displacement, indicating comparatively less overburden pressure of Miocene and younger sediments. Minwal/Joyamair oil fields are exploited for the production of hydrocarbons from these triangular zones (Figure 7). Amirpur-01 well is also targeted for the hydrocarbon exploration by drilling a triangular zone on the eastern folded limb of Minwal structure (Ashraf et al., 2016; Shakir et al., 2020).
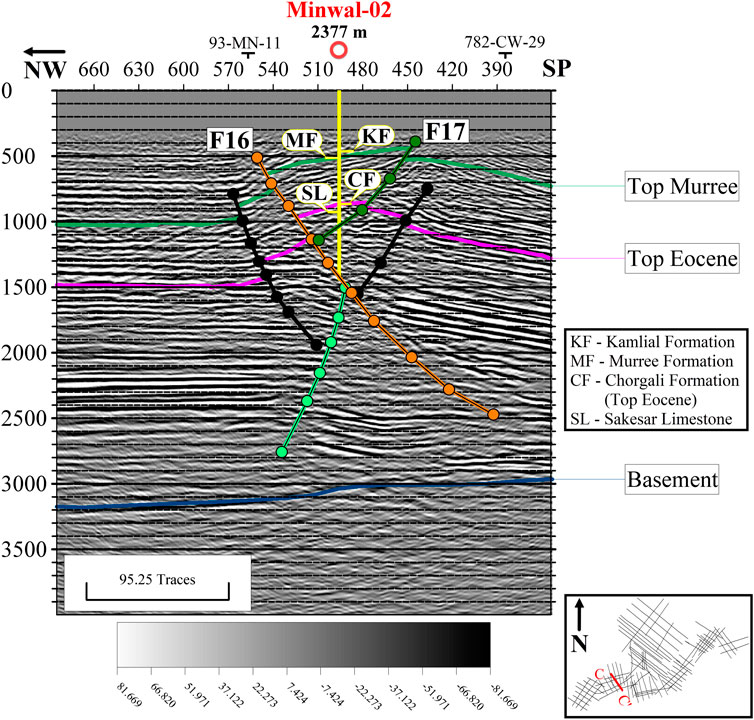
FIGURE 7. Interpreted seismic section of line POL-93-MN-08 of Minwal field in zone-3. Triangular zone is interpreted in the area at a deeper level where Murree Formation forms pop-up geometry at a very shallow depth.
4.2 Geohistory Analysis
The burial history plot of Qazian-1X, including the formations of Eocene-to-Pleistocene ages, is generated to illustrate the burial depth from Nammal Formation to Chinji Formation (Figure 9A). Murree Formation is the first stratigraphic unit deposited in the newly formed basin after the collision of Indian and Eurasian plates and marks the start of the depositional sequence of Neogene sediments. This thick sequence of fluvial sands experienced a very high rate of sedimentation and an abrupt increase in the subsidence rate during Early Miocene times (24–20 my). More than 500 m of sediments subsidence with extreme rate of sediment influx resulted in abrupt increase of pore pressure. The subsidence curve shown in the burial plot depicts that the subsidence event was followed by the normal compaction trend in the Late Miocene time, which continues until recent ages.
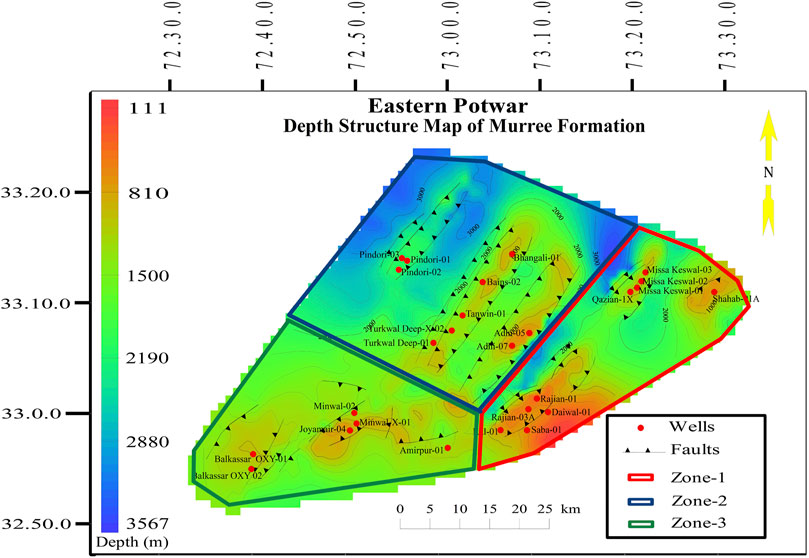
FIGURE 8. Depth structure map of Murree Formation with interpreted faults trending in northeast to southwest direction. The area is divided into three different zones on the basis of structural geometries, that is, duplex thrust sheets in zone-1 (red polygon), salt-cored anticlines in zone-2 (blue polygon), and zone-3 (green polygon) is comprised of triangular zone (Minwal and Joyamair) and broad box fold (Balkassar) geometries. Murree Formation lies at a very shallow depth (red color fill) in zone-1, intermediated depth (green color fill) in zone-3 and deepest depth (blue color fill) in zone-2.
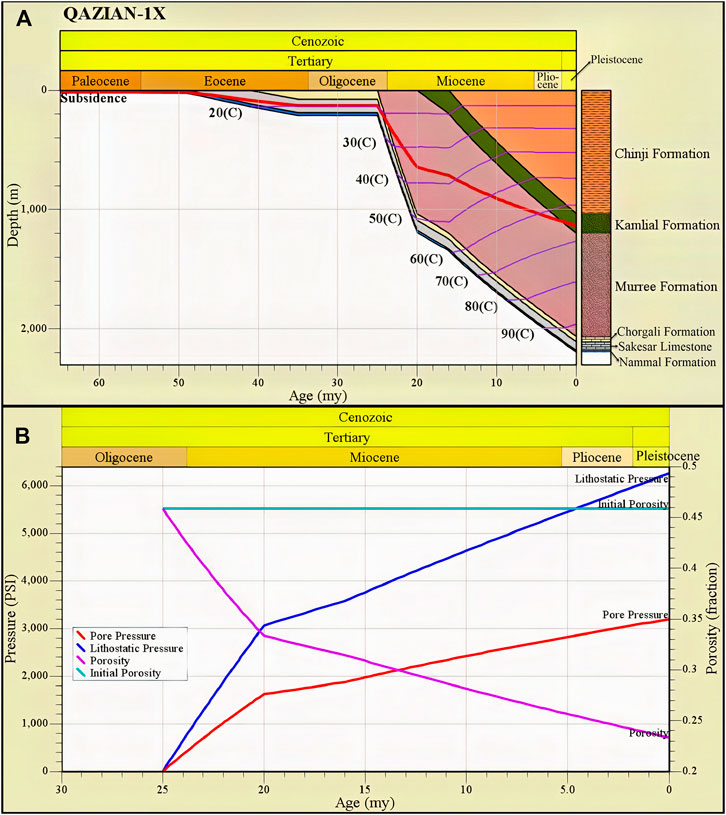
FIGURE 9. Burial history plot (A) and the effect of lithostatic pressure on porosity and pore pressure (B) of Murree Formation in Qazian-1X. In (A) Subsidence curve (red) depicts the increase in the burial depth during Miocene age resulting from the high rate of sedimentation of Neogene molasse deposits. In (B), an abrupt increase in pore pressure and decrease in porosity can be observed between 25 and 20 my due to the high rate of sedimentation and increase in lithostatic pressure. Porosity of Murree Formation decreased from 0.46 (initial porosity) to 0.23 (current porosity) due to overburden pressure with an increase up to maximum pressure of about 3200 psi.
In order to compare the changes in the porosity and pressure values with respect to time and burial depth, crossplot of porosity and pressure with respect to geological ages is prepared for Murree Formation. Relationship of porosity and pore pressure with lithostatic pressure for Murree Formation is shown in Figure 9B. This pressure plot is generated to show the rate of increase of pore pressure during the depositional history in response to burial depth. Pressure values are plotted on the left vertical axis, porosity on the right vertical axis, and age in million years is plotted on the x-axis of the crossplot. It can be observed that computed pressure initiated from 0 psi at the start of deposition around 25 my, showing a sharp increase until 20 my and increased up to 3300 psi at present. This marks a drastic increase in lithostatic and PP during the same time, which represents a sudden drop in the subsidence curve at Qazian-1X well location (Figure 9B).
4.3 Pore Pressure Prediction From Well Logs
4.3.1 Prediction and Calibration of Pore Pressure in Qazian-1X Well
Different methods can be used for the pore pressure prediction using wireline log data. However, calibration of these predicted pressure values with actual measured pressure data is mandatory for the validation of results (Mahmood et al., 2021). PPP values using Eaton’s method needs validation with the measured pressure data for the selection of Eaton’s index (2.7 for Qazian-1X well). DST data of Murree Formation in Qazian-1X well are used to calibrate the PPP values (Table 3). This calibration enhanced the accuracy level of the adopted methodology which is then further implemented on other wells drilled in the study area.
For further validation, relationship of PPP with DT is tested with regression analysis to enhance the confidence level regarding the selection of Eaton’s index and the normal compaction trend. The crossplot between PPP (x-axis) and DT (y-axis) is generated for Murree Formation, in which the volume of clay was used in the color bar to show the variation of clay percentage with respect to PP (Figure 10). Data represented by the red dots indicates upper sand facies with low clay percentage and yellow to green color dots represents the middle and lower part of the formation having relatively higher percentage of clay. The data are also differentiated into overpressure (blue) and underpressure (green) intervals with the colored polygons. Linear regression analysis shows good correlation with r 86% and r-squared value of 74%, validating the accuracy for the computed PPP values.
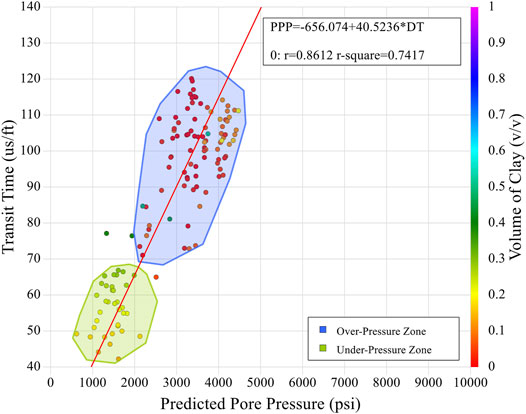
FIGURE 10. Relationship of predicted pore pressure (PPP) and sonic transit time (DT) in Qazian-1X. Pore pressure is predicted for Murree Formation using sonic log-based Eaton’s method, resulting in the identification of overpressure and underpressure zones. Regression analysis is performed after plotting PPP (x-axis) against DT (y-axis) with volume of clay (color bar), to validate the selection of Eaton’s index and normal compaction trend line. Green polygon represents the underpressure zone, and blue polygon represents overpressure zone. Regression curve (red line) shows the relationship of PPP and DT with r (0.8612) and r-squared (0.7417) values.
Detailed analysis of PP within Murree Formation in Qazian-1X well is shown in Figure 11. Four tracks are used for displaying the results, where track 1 shows the GR curve in red color used for marking the shale baseline. Scale of the GR log is used as 0–150 API. Track 2 displays the sonic transit time curve in microseconds per feet along with the normal compaction trend (NCT) with a scale of 40–240 μs/ft. Computed facies for sand and clay intervals are plotted in track 3, whereas track 4 displays complete results of pressure curves.
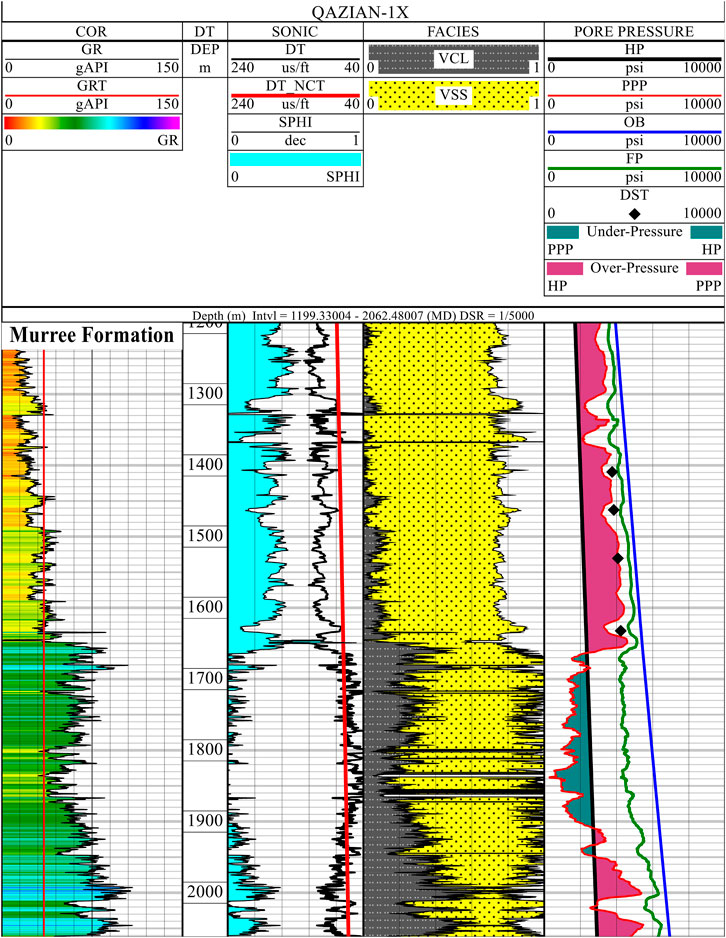
FIGURE 11. Porosity, facies, and predicted pore pressure results of Murree Formation in Qazian-1X well along with calibrated DST data. Plotted data include the gamma ray curve in correlation track (COR); sonic log curve, normal compaction trend line, and porosity in sonic track; predicted facies including clay and sand in facies track; hydrostatic pressure (HP) in black color, overburden pressure (OB) in blue color, predicted pore pressure (PPP) in red color, fracture pressure (FP) in green color, and DST data (black diamond symbols) plotted in pore pressure track. Clean sand facies with high porosities and overpressure zones are identified in top interval of Murree Formation, showing a very good correlation with measured pressure values of DST data. Middle part of formation shows underpressure conditions with low porosity and high pressures in the lower most part. FP curve depicts crucial drilling conditions in upper part as the PPP values are very close to FP curve, whereas middle and lower part displays easier drilling conditions.
The GR color filled curve plotted in the correlation track divided the formation into three parts. The upper part of the formation (yellow color fill; 1199–1650 m) showed low GR values, whereas an increasing trend is shown in middle (green color fill; 1650–1900 m) and lower parts (blue color fill; 1900–2062 m), reaching up to 80–100 API values. Facies track demarcate the clean sands in the upper part of Murree Formation with very little amount of clay. Porosity (SPHI) computed from DT shows very high values in this sand interval (sonic track). This high porosity sand interval in Murree Formation is marked as the overpressure zone (purple color fill), as shown in the PP track of Figure 11.
Undercompaction of strata in the top part of the formation is indicated by the deflection of DT from the NCT line, which marks the overpressure conditions as shown by the PPP curve (Figure 11). DST data of Qazian-1X well are also recoded in this top interval at four different depths. Black diamonds plotted on the PP track indicates the measured pressure values of DST record mentioned in Table 3. The middle and lower part of the formation shows high percentage of clay volume ranging between 20 and 40%. Porosity values decreases drastically in the highly compacted middle part and underpressure conditions in these clay rich sands indicates that the strata followed a normal compaction trend. Lower most part of Murree Formation in Qazian-1X well shows relatively high porosity and clay percentage. This clay rich interval exhibits high pressure values, except a few meter interval at the depth of around 2015 m where the pressure, porosity, and clay percentage values dropped.
The computed FP curve indicates the maximum pressure limit applied on the strata in order to fracture the rock, resulting in fluid losses and borehole instability (Sen and Ganguli, 2019). Overpressure conditions in the upper part of Murree Formation shows minimum difference between the PPP and FP curves. As these high pressure intervals have to be drilled with high mud weight, there is a very vital chance of inducing fractures in the formation. This makes the drilling process very critical in these high pressure intervals. In the middle and lower part of the formation, FP values are sufficiently high enough from the PPP values making easier drilling conditions.
4.3.2 Pore Pressure Prediction in Eastern Potwar
Log-based PP analysis is conducted on 19 wells of nine different fields in eastern Potwar, using Eaton’s method. After testing the accuracy of the pressure in Qazian-1X well, pressure prediction is carried out on other wells to generate a regional subsurface pressure behavior of Murree Formation. The parameters including the normal compaction trend and Eaton’s index are selected for individual wells by calibrating the predicted pressure with the static pore pressure data. The normal compaction trend is marked on the basis of the DT curve in each well, and Eaton’s index is selected by calibration with the measured pressure.
Predicted pressure values also show abnormal pressure conditions within structural compartments of Murree Formation. Once the pressure values are computed throughout eastern Potwar, the isomap layer for PPP is generated in order to see the variations of pressure conditions in the study area (Figure 12). Pressure values are ranging between 2400 and 5510 psi values. It is also very important to note the trend of porosities in the overpressure zones. In most of the wells, where overpressure intervals are identified, porosity values are high, showing that the sediments have not followed a normal compaction trend due to high sediment influx. On the other hand, those intervals where underpressure/normal pressures are observed, the NCT line overlies the DT curve (with low values), representing that the sediments have followed a normal compaction trend with less porosity values.
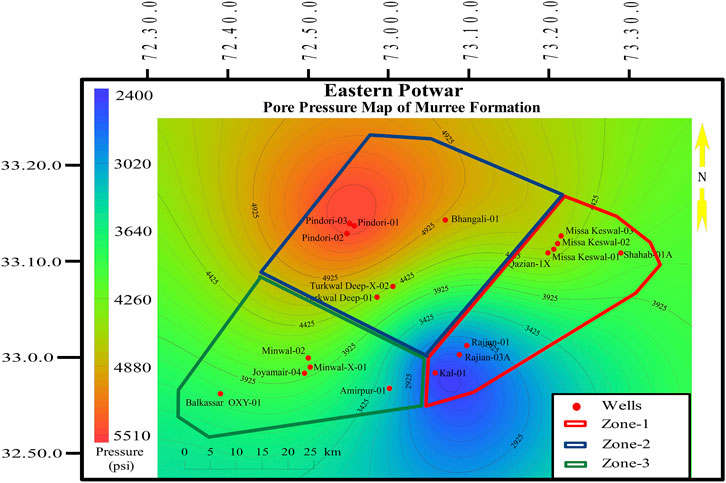
FIGURE 12. Isomap layer of pore pressure predicted in 19 wells of eastern Potwar. Pressure variations in Murree Formation shows highest pore pressures in zone-2, ranging between 5000 and 5500 psi values in Pindori field (red color fill). Rajian field of zone-1 (blue color fill), experiences the lowest pressure conditions, which are less than 3000 psi values. Murree Formation in Qazian and Missa Keswal fields (northeastern part of zone-1) exhibits high pressures at a shallower depth. Minwal, Amirpur, and Balkassar oil fields of zone-3 follow the normal compaction trend in most of the drilled interval.
4.3.2.1 Pressure prediction in zone-1
The zone-1, which is dominated by duplex structures with repeated thrust sheets, depicts a variable trend of pressure. Missa Keswal and Qazian oil fields, where average depth of Murree Formation is about 1200 m, have moderate to high pressure values ranging between 3500 and 4500 psi. Wells drilled in these fields have penetrated the top most thrusted sheet forming a pop-up structure, which can be classified as open fold (Figure 5). PPP values in Missa Keswal-03 well show a very consistent pressure trend from top to bottom with exception of only a few meter interval of normal/hydrostatic pressure (Figure 13). Murree Formation is dominantly composed of sand facies with low clay percentage (12–18%) and porosity values ranging between 8 and 18%. About 60 m interval in lower part of the formation, an increase in the clay percentage is observed with a decreasing porosity trend.
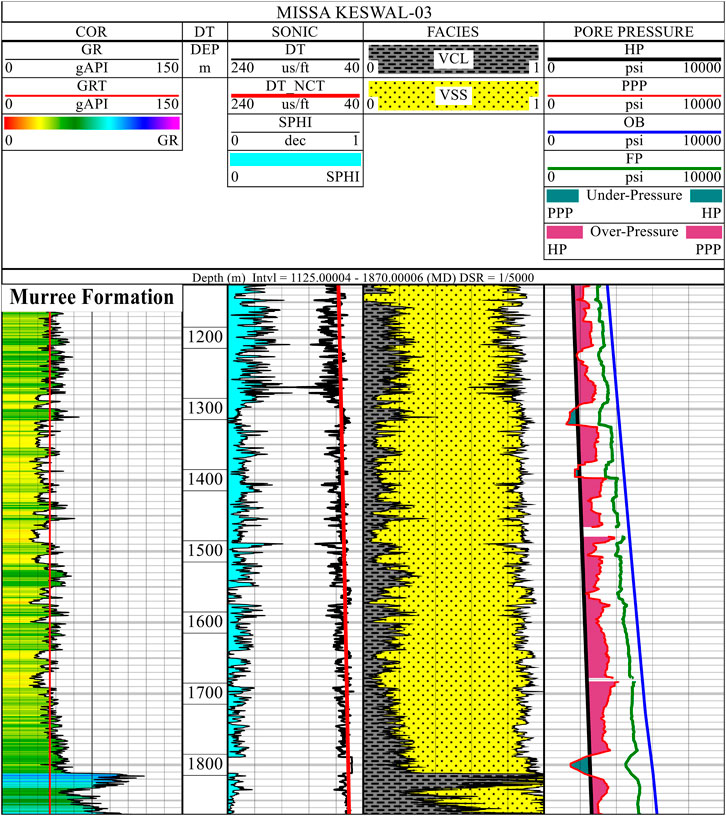
FIGURE 13. Porosity, facies and predicted pore pressure results in Missa Keswal-03 well. Log plot template for input data and computed results is same as used for Qazian-1X well. Murree Formation show constant sand facies with good porosities and overpressure zones throughout the interval with only few low-pressure zones. FP curve represent relatively easier drilling conditions in the lower part, as its values are significantly higher than the PPP values.
However, in Rajian (Figure 4) and Kal oil fields, gentle folding exists within the top thrusted sheet of Murree Formation. This gentle folding supports hydrostatic pressures ranging between 2400 and 2700 psi values within the sand facies at a shallow depth of 770 m. Computed results of Rajian-03A well (Figure 14A) show a very smooth trend of clay volume with an average value of about 30%. The formation shows dominating sand facies having underpressure conditions of pore fluids in top interval up to the depth of about 2500 m. In lower part of the formation, two intervals of about 120 m each, at the depth of 2750 m and 3000 m, exhibits overpressure conditions. Porosity values in Rajian-03A well are ranging between 12 and 20%. These results show that the formation follows the normal compaction trend due to less overburden in this area.
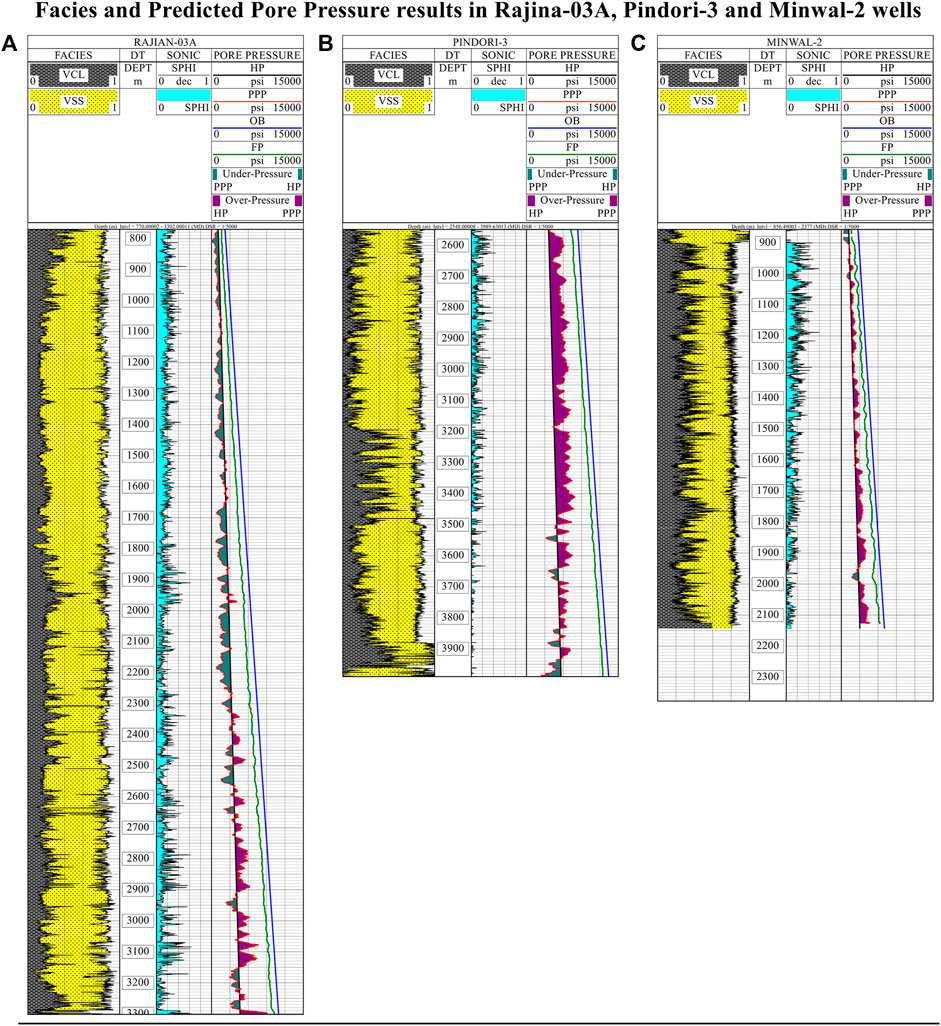
FIGURE 14. Facies, porosity, and predicted pore pressure results in Rajian-03A, Pindori-3, and Minwal-2 wells. Plotted data include, predicted facies in facies track; porosity curve is plotted in sonic track; HP, OB, PPP, and FP plotted in the pore pressure track. In Rajian-03A well (A), Murree Formation is having normal and underpressure condition within most of the formation except for two zones (at around 2800 m and 3000 m) in the lower part where pressure is increased. Pindori-3 well (B) mostly represents overpressured conditions in the upper part and converts into normal pressures in lower part. In Minwal-2 well (C), most of the interval depicts near to hydrostatic pressures with few exceptions in the lower part.
4.3.2.2 Pressure prediction in zone-2
Highest pressure conditions are evaluated in zone-2 (northern part of study area), mainly controlled by the salt-cored anticlines. Pindori and Bhangali oil fields show a very consistent overpressuring trend throughout Murree Formation. Average depth of the formation in the Pindori area is about 2400 m, contributing the highest overburden pressures coupled with the salt tectonics. Increased overburden stresses and close folding in Pindori area (Figure 6) contributed in the generation of overpressure conditions within Murree Formation. Pindori-03 well shows clean sand facies in the upper part whereas clay percentage is high in middle part and in lower most part at the depth of around 3900 m (Figure 14B). The porosity curve shows a decreasing trend with respect to depth, and the formation bears very low porosities (0.5–1.5%), below 3600 m.
4.3.2.3 Pressure prediction in zone-3
The south western part of the study area encompasses the Minwal, Amirpur, and Balkassar oil fields. This area is mainly dominated by triangular zones in the Minwal (Figure 7) and Amirpur fields, excluding the Balkassar oil field, which is marked by the box fold geometry. Pressure conditions in these triangular zones are moderately overpressured in the Minwal and Amirpur fields. Minwal-02 well shows comparatively high clay percentage throughout the formation ranging between 30 and 40% (Figure 14C). Top of Murree Formation in Minwal-02 well is at 856 m depth and shows good porosity values in upper part under hydrostatic pressure conditions. With increase in depth, the porosity curve shows a decreasing trend under relatively high pressure condition in the lower part of the formation. Thickness of Murree Formation in the Balkassar oil field is about 800 m and is composed of clean sand facies with very good porosities, which follows a normal compaction trend.
4.3.3 Overpressure Induced by Compaction Disequilibrium
The relationship between acoustic velocity and vertical effective stress in overpressured wells of the Qazian and Pindori oil fields is generated for the identification of the overpressuring mechanism (Figure 15). Facies analysis in Murree Formation shows clean sand intervals at the top and relatively clay rich sands in the middle and lower part. The inconsistent porosity trend represents that the rock is having a variable grain size and clay percentage, controlling the permeability of the rock. A rock with good permeability would easily dissipate the overpressures under a normal compaction trend as compared to low permeability clay rich sands (Talinga and Reine, 2021). Depositional and burial history of Murree Formation (Figure 9A) indicates a time span where high rate of sedimentation was followed by the subsidence. This type of depositional history creates compaction disequilibrium causing undercompaction of sediments.
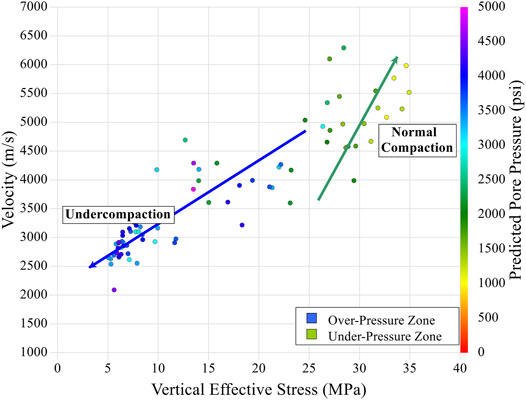
FIGURE 15. Relationship between acoustic velocity (y-axis) and vertical effective stress (x-axis) in Qazian-1X well. Data plot represents the mechanism of overpressuring in Murree Formation due to the undercompaction of sediments. Overpressure (blue) and underpressure (green) zones show an opposite trend as the velocity and effective stress both are decreasing in the overpressure zone indicating undercompaction of sediments. In the underpressure zone there is an increase in velocity, which represents a normal compaction trend.
The crossplot between the acoustic velocity and vertical effective stress is analyzed to identify the compaction disequilibrium mechanism. Velocity (m/s) is plotted on y-axis, vertical effective stress (MPa) on x-axis, and PPP values are used to differentiate the pressure variations with a color bar. The overpressure zone of Murree Formation is shown by blue color dots, and green color dots represent the underpressure zone (Figure 15). With a high sedimentation rate, the fluid escape from sediments could not maintain pace with the burial depth causing compaction disequilibrium, which creates overpressure conditions. High porosities within these overpressure zones also represent undercompaction of sediments. This resulted in the decrease of velocity values and low effective stress within Murree Formation. The decrease of velocity and effective stress is highlighted with the blue arrow in Figure 15 and marked as an undercompaction zone. On the other hand, green arrow shows normal compaction with increase in velocity and effective stress values.
5 Discussions
Eastern Potwar is characterized by compressional tectonics resulted in fault bounded anticlines and low angle thrusts. The overall structural deformation is controlled by a basal decollement (SRT), which is regarded as a splay of main boundary thrust and distributing the displacement to all linked faults in the sub-Himalayan region (Aamir and Siddiqui, 2006; Qayyum et al., 2021). Overpressuring in Neogene sediments is thought to be caused by tectonic activity linked with the collision of Indian and Eurasian plates (Sahay and Fertl, 1988). According to Satti et al. (2021), compaction disequilibrium may also contribute to the development of high formation pressures in addition to tectonic stresses. Therefore, it is necessary to understand the tectonics and structural framework along with the burial history trend of Murree Formation for the identification of overpressure zones induced by compaction disequilibrium.
In order to determine the mechanism of overpressuring in Murree Formation, structural interpretation, geohistory analysis, and log-based pore pressure prediction has been carried out. Geohistory analysis helped in evaluating the sedimentation rate and burial history depicted an abrupt increase in lithostatic and pore pressure corresponding to a high sedimentation rate between the ages of 25–20 my. Sediment compaction contributes in porosity reduction resulting in high bulk density due to the increase in overburden stress (Wahid et al., 2021). According to Zhang (2013), porosity in the rocks is not only dependent on the depth factor but also influenced by effective stress. In general, porosity will decrease with burial depth if the rock follows normal compaction (Chen et al., 2020).
The porosity change with burial depths can be used for determining the effect of compaction (Bredesen et al., 2019). Deviations in the compaction curve with decreasing porosity depicts that mechanical compaction might not be the only reason for porosity reduction at shallow depths (Puttiwongrak et al., 2020). Moreover, it cannot always be true that porosity might have an indirect relation with depth, as porosities may enhance during diagenetic processes as well (Zhang, 2013). Geohistory analysis reveals that overpressured zones with high porosities of Murree Formation demonstrate a low porosity reduction rate despite varying overburden pressure conditions. Formation fluid which was trapped in pore spaces during deposition, instigate deviation from the normal compaction. Moreover, computed pore pressure values from geohistory analysis also showed good correlation with log-based PPP in Qazian-1X well.
The deformation mechanism and structural geometries varies within eastern Potwar and are generating different level of stresses affecting geopressures. All major thrust faults are dipping in the north or northwest direction following the regional trend of north dipping SRT (Qayyum et al., 2015). Three different structural geometries aided in generating overpressure conditions; however, it has to be noted that the high sediment influx during Miocene time played a very critical role in retaining pore fluids. As rapid rate of deposition makes very difficult for pore fluids to escape out of the rocks with mechanical compaction (Abbey et al., 2020), these molasse sediments did not follow NCT, resulting in undercompaction of the strata, followed by the generation of overpressure conditions.
According to Qayyum et al. (2021), eastern Potwar is affected mostly by the second phase of deformation initiated in Late Pliocene-to-recent. The point of agreement lies in the study area as well, where the presence of major thrust faults are characterized by NNE-SSW directed compression and near vertical intermediate principle stress (σ2), indicative of transcurrent tectonics. Most of the oil and gas fields including Pindori, Bhangali, Adhi, Missa Keswal, Turkwal, Rajian, and Balkassar are marked by pop-up structural geometries (Ahmed et al., 2012; Abid et al., 2019; Sajid et al., 2021); however, opening and closing of folds varies among these fields. The triangular zones which have been exploited for the hydrocarbon productions in Amirpur and Minwal fields (Ali et al., 2015; Ashraf et al., 2016) exhibits normal pressure conditions.
To analyze the anomalous pressure behavior of Murree Formation, pore pressure has been initially predicted in Qazian-1X well, and after calibration of results other wells were evaluated. Overpressure zones were identified in the Qazian-1X well in the upper and lower parts of the formation while the middle part showed the underpressure zone. It is very critical to observe overpressure zones with high porosity values indicating the undercompaction of sediments. The underpressure zone in the middle part showed very low porosities with the NCT line overlying the DT curve. This depicts the sediments followed normal compaction with a high porosity reduction rate. Borehole stability depends upon the FP representing maximum pressure limit for safe drilling (Sen and Ganguli, 2019). Computed FP showed minimum difference between PPP and FP in the upper part making the drilling process critical in high pressure intervals. In the middle and lower parts of the formation, FP values are sufficiently high enough from the PPP values making drilling conditions easier.
Pressure prediction was then applied to other wells from nine different fields, and the same trend of overpressuring has been observed in Missa Keswal wells of zone-1, adjacent to Qazian-1X and drilled on the same structure. However, Rajian and Kal fields having consistent sand facies with intermediate porosities mostly show underpressure conditions in most of the formations with minor overpressure zones at the bottom. Zone-2 is marked by the highest pressures within Murree Formation where Pindori and Bhangali wells exhibit constant overpressuring although the formation is buried at a greater depth. Triangular zones in Amirpur and Minwal fields of zone-3 represent moderate pressure conditions at shallow depths where Murree Formation possesses relatively high clay percentage.
Based on the study conducted in eastern Potwar, it is observed that the overpressuring in Murree Formation is induced due to the undercompaction of sediments during Miocene time. Presence of these high pressure zones with good porosities resulted in low effective stress and velocities. The decrease of these parameters clearly indicates compaction disequilibrium, and it is believed to be the major cause of the overpressuring mechanism in this area.
6 Conclusion
1) Pore pressure analysis revealed that primarily, overpressuring in Murree Formation is induced by the compaction disequilibrium mechanism due to the rapid rate of sedimentation during the Neogene times. However, generation of these overpressures is also facilitated by tectonic stresses and structural geometries.
2) As a result of dissimilar deformation styles, the study area is categorized into three different zones on the basis of structural geometries. In zone-1, undercompaction of the sediments induced overpressuring in Qazian and Missa Keswal fields at shallow depth with more than 4000 psi pressure.
3) Maximum pressures are identified in the Pindori oil field of zone-2 (northern part). In Pindori field, Murree Formation is encountering huge overburden stress at a depth of around 2400 m, and the pore pressure values are exceeding 5500 psi.
4) Triangular zones are delineated in zone-3 of the study area, including Minwal and Amirpur fields. Murree Formation experiences moderate pressure conditions with appreciable difference between the PPP and FP curves. Formation bears high porosities in this area and the interpreted pressures depicts favorable drilling conditions.
Data Availability Statement
The original contributions presented in the study are included in the article/Supplementary Material; further inquiries can be directed to the corresponding author.
Author Contributions
MRA provided main conceptual idea, data interpretation, and manuscript writing; MZ supervised the study and reviewed the manuscript; TA helped in structural interpretation; MH contributed in data analysis and software support; US worked on technical details in manuscript writing. All authors contributed to the article and approved the submitted version.
Conflict of Interest
Author MH is employed by LMK Resources. LMK Resources provided free software license to Bahria University under its University Grant Program for research purposes.
The remaining authors declare that the research was conducted in the absence of any commercial or financial relationships that could be construed as a potential conflict of interest.
Publisher’s Note
All claims expressed in this article are solely those of the authors and do not necessarily represent those of their affiliated organizations, or those of the publisher, the editors, and the reviewers. Any product that may be evaluated in this article, or claim that may be made by its manufacturer, is not guaranteed or endorsed by the publisher.
Acknowledgments
The authors are grateful to Department of Earth and Environmental Sciences, Bahria University, Islamabad for providing support and geophysical software lab facility to conduct this study. We are extremely obliged to GeoSoftware LLC, LMK Resources (LMKR) and Platte River Associates (PRA) for providing geoscience interpretation software including PowerLog by GeoSoftware LLC, GVERSE by LMKR, and BasinMod by PRA. We would also like to acknowledge Directorate General of Petroleum Concession for granting approval of public domain data used in the study.
References
Aamir, M., and Siddiqui, M. M. (2006). Interpretation and Visualization of Thrust Sheets in a Triangle Zone in Eastern Potwar, Pakistan. Lead. Edge 25 (1), 24–37. doi:10.1190/1.2164749
Abbey, C. P., Osita, M. C., Sunday, O. A., and Dabari, M. Y. (2020). Disequilibrium Compaction, Fluid Expansion and Unloading Effects: Analysis from Well Log and its Pore Pressure Implication in Jay Field, Niger Delta. eijs 61, 389–400. doi:10.24996/ijs.2020.61.2.17
Abdelghany, W. K., Radwan, A. E., Elkhawaga, M. A., Wood, D. A., Sen, S., and Kassem, A. A. (2021). Geomechanical Modeling Using the Depth-Of-Damage Approach to Achieve Successful Underbalanced Drilling in the Gulf of Suez Rift Basin. J. Petroleum Sci. Eng. 202, 108311. doi:10.1016/j.petrol.2020.108311
Abid, M., Riaz, M., Shah, M., Zafar, T., and Malik, A. (2019). Structural Interpretation and Reservoir Characterisation of the Missa Keswal Area, Upper Indus Basin, Pakistan. Boll. Geofis. Teor. Appl. 60 (3).
Afzal, M., and Rasool, S. A. (2000). “Problems in Drilling through Abnormal/subnormal Pore Pressures of Post Eocene Formations in the Potwar Basin of Pakistan with Special Reference to Adhi Field,” in IADC/SPE Drilling Conference: OnePetro. doi:10.2118/59220-ms
Agbasi, O. E., Sen, S., Inyang, N. J., and Etuk, S. E. (2021). Assessment of Pore Pressure, Wellbore Failure and Reservoir Stability in the Gabo Field, Niger Delta, Nigeria - Implications for Drilling and Reservoir Management. J. Afr. Earth Sci. 173, 104038. doi:10.1016/j.jafrearsci.2020.104038
Ahmed, K. A., Man, H. Q., and Zeb, Y. (2012). Seismic Facies Modelling of Potwar Basin Using Seismic and Well Log Data. Geosciences 2012 (6), 192–211. doi:10.5923/j.geo.20120206.07
Ali, A., Kashif, M., Hussain, M., Siddique, J., Aslam, I., and Ahmed, Z. (2015). An Integrated Analysis of Petrophysics, Cross-Plots and Gassmann Fluid Substitution for Characterization of Fimkassar Area, Pakistan: A Case Study. Arab. J. Sci. Eng. 40 (1), 181–193. doi:10.1007/s13369-014-1500-1
Amjad, M. R., Hameed, M. S., Mujtaba, M., and Munir, M. N. (2019). Petrophysical and Geochemical Analysis of Chichali Formation for the Source Rock Evaluation: A Case Study of Chanda-01 Well, Upper Indus Basin, Pakistan. Int. J. Econ. Environ. Geol. 8, 32–39. doi:10.46660/ijeeg.Vol0.Iss0.0.58
Ashraf, U., Zhu, P., Anees, A., Abbas, A., and Talib, A. (2016). Analysis of Balkassar Area Using Velocity Modeling and Interpolation to Affirm Seismic Interpretation, Upper Indus Basin. Geosciences 6 (3), 78–91. doi:10.5923/j.geo.20160603.02
Baouche, R., Sen, S., Sadaoui, M., Boutaleb, K., and Ganguli, S. S. (2020). Characterization of Pore Pressure, Fracture Pressure, Shear Failure and its Implications for Drilling, Wellbore Stability and Completion Design - A Case Study from the Takouazet Field, Illizi Basin, Algeria. Mar. Petroleum Geol. 120, 104510. doi:10.1016/j.marpetgeo.2020.104510
Batzle, M., and Wang, Z. (1992). Seismic Properties of Pore Fluids. Geophysics 57 (11), 1396–1408. doi:10.1190/1.1443207
Bell, D. W., Huffman, A., and Bowers, G. (2002). Velocity Estimation for Pore-Pressure Prediction. Memoirs-American Association of Petroleum Geologists, 177–216.
Biot, M. A. (1941). General Theory of Three‐Dimensional Consolidation. J. Appl. Phys. 12 (2), 155–164. doi:10.1063/1.1712886
Bjorlykke, K. (2010). Petroleum Geoscience: From Sedimentary Environments to Rock Physics. Springer Science & Business Media.
Bowers, G. L. (1995). Pore Pressure Estimation from Velocity Data: Accounting for Overpressure Mechanisms besides Undercompaction. SPE Drill. Complet. 10 (02), 89–95. doi:10.2118/27488-pa
Bredesen, K., Avseth, P., Johansen, T. A., and Olstad, R. (2019). Rock Physics Modelling Based on Depositional and Burial History of Barents Sea Sandstones. Geophys. Prospect. 67 (4), 825–842. doi:10.1111/1365-2478.12683
Burbank, D. W., and Raynolds, R. G. H. (1988). “Stratigraphic Keys to the Timing of Thrusting in Terrestrial Foreland Basins: Applications to the Northwestern Himalaya,” in New Perspectives in Basin Analysis (Springer), 331–351. doi:10.1007/978-1-4612-3788-4_17
Chen, J., Kuang, X., and Zheng, C. (2020). An Empirical Porosity-Depth Model for Earth's Crust. Hydrogeol. J. 28 (7), 2331–2339. doi:10.1007/s10040-020-02214-x
Craig, J., Hakhoo, N., Bhat, G. M., Hafiz, M., Khan, M. R., Misra, R., et al. (2018). Petroleum Systems and Hydrocarbon Potential of the North-West Himalaya of India and Pakistan. Earth-Science Rev. 187, 109–185. doi:10.1016/j.earscirev.2018.09.012
Dodson, J., Dodson, T., and Schmidt, V. (2004). “Gulf of Mexico ‘trouble Time’ Creates Major Drilling Expenses: Use of Cost-Effective Technologies Needed,” in Offshore (Conroe, Tex.), 64.1.
Eaton, B. A. (1975). “The Equation for Geopressure Prediction from Well Logs,” in Fall Meeting of the Society of Petroleum Engineers of AIME (Richardson, Dallas, TX: Society of Petroleum Engineers). doi:10.2118/5544-ms
Fatmi, A., Akhtar, M., Alam, G., and Hussain, I. (1984). “Guide Book to Geology of Salt Range,” in First Pakistan Geological Congress Lahore (Lahore: Geological Survey of Pakistan), 14p.
Gardner, G. H. F., Gardner, L. W., and Gregory, A. R. (1974). Formation Velocity and Density-The Diagnostic Basics for Stratigraphic Traps. Geophysics 39 (6), 770–780. doi:10.1190/1.1440465
Gutierrez, M. A., Braunsdor, N. R., and Couzens, B. A. (2006). Calibration and Ranking of Pore-Pressure Prediction Models. Lead. Edge 25 (12), 1516–1523. doi:10.1190/1.2405337
Haq, B. U., Hardenbol, J., and Vail, P. R. (1987). Chronology of Fluctuating Sea Levels since the Triassic. Science 235 (4793), 1156–1167. doi:10.1126/science.235.4793.1156
Heppard, P., Cander, H., and Eggertson, E. (1998). “Memoir 70,” in Chapter 13: Abnormal Pressure and the Occurrence of Hydrocarbons in Offshore Eastern Trinidad (West Indies.
Hottmann, C. E., and Johnson, R. K. (1965). Estimation of Formation Pressures from Log-Derived Shale Properties. J. Petroleum Technol. 17 (06), 717–722. doi:10.2118/1110-pa
Jaumé, S. C., and Lillie, R. J. (1988). Mechanics of the Salt Range‐Potwar Plateau, Pakistan: A Fold‐and‐thrust Belt Underlain by Evaporites. Tectonics 7 (1), 57–71. doi:10.1029/TC007i001p00057
Johnson, G. D., Raynolds, R. G., and Burbank, D. W. (1986). “Late Cenozoic Tectonics and Sedimentation in the North-Western Himalayan Foredeep: I. Thrust Ramping and Associated Deformation in the Potwar Region,” in Foreland Basins (Belgium: Blackwell Publishing), 273–291.
Kadri, I. B. (1991). “Abnormal Formation Pressures in Post-eocene Formation, Potwar Basin, Pakistan,” in SPE/IADC Drilling Conference (Richardson, Dallas, TX: Society of Petroleum Engineers). doi:10.2118/21920-ms
Khan, M., Ahmed, R., Raza, H. A., and Kemal, A. (1986). Geology of Petroleum in Kohat-Potwar Depression, Pakistan. AAPG Bull. 70 (4), 396–414. doi:10.1306/9488571e-1704-11d7-8645000102c1865d
Law, B. E., Shah, S. H. A., and Malik, M. A. (1998). “Memoir 70,” in Chapter 14: Abnormally High Formation Pressures (Pakistan: Potwar Plateau).
Law, B. E., and Spencer, C. (1998). “Memoir 70,” in Chapter 1: Abnormal Pressure in Hydrocarbon Environments.
Lillie, R. J., Johnson, G. D., Yousuf, M., Zamin, A. S. H., and Yeats, R. S. (1987). “Structural Development within the Himalayan Foreland Fold-And-Thrust Belt of Pakistan,” in The AAPG/Datapages Combined Publications Database (Tulsa, OK: American Association of Petroleum Geologists), 379–392.
Mahmood, N., Ali, A., and Hussain, M. (2021). The Accuracy in Pore Pressure Prediction via Seismic and Well Log Data: A Case Study. Arabian J. Geosciences 14 (21), 1–10. doi:10.1007/s12517-021-08640-9
Malick, A. (1979). Pressures Plague Pakistan’s Potwar. Dallas, TX: Petroleum Engineer International, 26–36. International.
Morley, C., King, R., Hillis, R., Tingay, M., and Backe, G. (2011). Deepwater Fold and Thrust Belt Classification, Tectonics, Structure and Hydrocarbon Prospectivity: A Review. Earth-Science Rev. 104 (1-3), 41–91. doi:10.1016/j.earscirev.2010.09.010
Mouchet, J.-P., and Mitchell, A. (1989). Abnormal Pressures while Drilling: Origins, Prediction, Detection, Evaluation. Paris: Editions Technip.
Najibi, A. R., Ghafoori, M., Lashkaripour, G. R., and Asef, M. R. (2017). Reservoir Geomechanical Modeling: In-Ssitu Stress, Pore Pressure, and Mud Design. J. Petroleum Sci. Eng. 151, 31–39. doi:10.1016/j.petrol.2017.01.045
Nelson, P. H., and Bird, K. J. (2005). Porosity-depth Trends and Regional Uplift Calculated from Sonic logsNational Petroleum Reserve in Alaska. Reston, VA: United States Geological Survey.
Nwankwo, C. N., and Kalu, S. O. (2016). Integrated Approach to Pore Pressure and Fracture Pressure Prediction Using Well Logs: Case Study of Onshore Niger-Delta Sedimentary Basin. Ojg 06 (10), 1279–1295. doi:10.4236/ojg.2016.610094
Patriat, P., and Achache, J. (1984). India-eurasia Collision Chronology Has Implications for Crustal Shortening and Driving Mechanism of Plates. Nature 311 (5987), 615–621. doi:10.1038/311615a0
Pennock, E. S., Lillie, R. J., Zaman, A. S. H., and Yousaf, M. (1989). Structural Interpretation of Seismic Reflection Data from Eastern Salt Range and Potwar Plateau, Pakistan. AAPG Bull. 73 (7), 841–857. doi:10.1306/44b4a27b-170a-11d7-8645000102c1865d
Pilbeam, D., Barry, J., Meyer, G. E., Shah, S. M. I., Pickford, M. H. L., Bishop, W. W., et al. (1977). Geology and Palaeontology of Neogene Strata of Pakistan. Nature 270 (5639), 684–689. doi:10.1038/270684a0
Plumb, R. A., Evans, K. F., and Engelder, T. (1991). Geophysical Log Responses and Their Correlation with Bed-To-Bed Stress Contrasts in Paleozoic Rocks, Appalachian Plateau, New York. J. Geophys. Res. 96 (B9), 14509–14528. doi:10.1029/91jb00896
Puttiwongrak, A., Giao, P. H., and Vann, S. (2020). An Easily Used Mathematical Model of Porosity Change with Depth and Geologic Time in Deep Shale Compaction. Geomate J. 19 (73), 108–115. doi:10.21660/2020.73.39179
Qayyum, A., Poessé, J. W., Kaymakci, N., Langereis, C. G., Gülyüz, E., and Ahsan, N. (2021). Neogene Kinematics of the Potwar Plateau and the Salt Range, NW Himalayan Front: A Paleostress Inversion and AMS Study. Int. Geol. Rev., 1–19. doi:10.1080/00206814.2021.1929514
Qayyum, M., Spratt, D. A., Dixon, J. M., and Lawrence, R. D. (2015). Displacement Transfer from Fault-Bend to Fault-Propagation Fold Geometry: An Example from the Himalayan Thrust Front. J. Struct. Geol. 77, 260–276. doi:10.1016/j.jsg.2014.10.010
Radwan, A. E., and Sen, S. (2021). Characterization of Iin-Ssitu Stresses and its Implications for Production and Reservoir Stability in the Depleted El Morgan Hydrocarbon Field, Gulf of Suez Rift Basin, Egypt. J. Struct. Geol. 148, 104355. doi:10.1016/j.jsg.2021.104355
Raynolds, R. G. H., and Johnson, G. D. (1985). Rate of Neogene Depositional and Deformational Processes, North-West Himalayan Foredeep Margin, Pakistan. Geol. Soc. Lond. Memoirs 10 (1), 297–311. doi:10.1144/gsl.mem.1985.010.01.24
Rider, M. (1996). The Geological Interpretation of well Logs. Scotland. Rider-French Consulting Ltd.
Sahay, B., and Fertl, W. H. (1988). Origin and Evaluation of Formation Pressures. New Delhi: Allied Publishers.
Sajid, M., Kashif, M., Zahid, M., Javed, A., and Shaikh, A. (2021). “Petrophysical Evaluation of Reservoir Rocks of Rajian-01, Daiwal-01, and Kal-01 by Well Log Data, Potwar Plateau, Upper Indus Basin, Pakistan,” in Bollettino di Geofisica Teorica ed Applicata, 62. doi:10.4430/bgta0340
Satti, I. A., Farooq, M., and Hermana, M. (2021). Integration of Seismic Methods and 3D Basin Modeling Approach for Improved Predrill Pore Pressure Prediction: an Example from Malay Basin, Malaysia. Arabian J. Geosciences 14 (18), 1–12. doi:10.1007/s12517-021-08326-2
Satti, I. A., Ghosh, D., Yusoff, W. I., and Hoesni, M. J. (2015). Origin of Overpressure in a Field in the Southwestern Malay Basin. SPE Drill. Complet. 30 (03), 198–211. doi:10.2118/176034-pa
Sayers, C. M. (2006). An Introduction to Velocity-Based Pore-Pressure Estimation. Lead. Edge 25 (12), 1496–1500. doi:10.1190/1.2405335
Sen, S., and Ganguli, S. S. (2019). “Estimation of Pore Pressure and Fracture Gradient in Volve Field, Norwegian North Sea,” in SPE Oil and Gas India Conference and Exhibition (Richardson, Dallas, TX: Society of Petroleum Engineers). doi:10.2118/194578-ms
Shakir, U., Abbas, M., Ahmad, W., Mahmood, M., Hussain, M., Anwar, M., et al. (2020). Hydrocarbon Reservoir Evaluation and Fault Seal Analysis of Balkassar Area, Potwar Sub Basin, Pakistan. Nucl. 56 (3), 96–104. http://thenucleuspak.org.pk/index.php/Nucleus/article/view/515
Shakir, U., Amjad, M. R., Mehmood, M. F., Hussain, M., Abuzar, M. K., Ahmad, T., et al. (2019). Structural Delineation and Hydrocarbon Potential Evaluation of Lockhart Limestone in Basal Area, Upper Indus Basin, Pakistan. Nucl. 56 (2), 55–62. http://thenucleuspak.org.pk/index.php/Nucleus/article/view/514
Stoneley, R. (1974). “Evolution of the Continental Margins Bounding a Former Southern Tethys,” in The Geology of Continental Margins (Springer), 889–903. doi:10.1007/978-3-662-01141-6_65
Talinga, D., and Reine, C. (2021). Integrating Pore Pressure and Lithology Prediction from well and Seismic Data to Characterize Abnormal Pressures in the Compartmentalized Volve Oil Field. Central North Sea.
Terzaghi, K., Peck, R. B., and Mesri, G. (1996). Soil Mechanics in Engineering Practice. John Wiley & Sons.
Udo, K., Akpan, M., and Agbasi, O. (2015). Estimation of Overpressures in Onshore Niger Delta Using Wire-Line Data. Int. J. Sci. Res. 438 (5), 2780–2784. https://www.ijsr.net/get_abstract.php?paper_id=SUB154579
Villacastin, P. F. (2012). “Using Qualitative Techniques to Constrain Normal Compaction Trendlines: A Methodology for Real-Time Pore Pressure Prediction in Exploration Wells,” in IADC/SPE Asia Pacific Drilling Technology Conference and Exhibition (Richardson, Dallas, TX: Society of Petroleum Engineers). doi:10.2118/156510-ms
Wahid, A., Rauf, A., Ali, S. H., Khan, J., Iqbal, M. A., and Haseeb, A. (2021). Impact of Complex Tectonics on the Development of Geo-Pressured Zones: A Case Study from Petroliferous Sub-himalayan Basin. Pakistan: Geopersia.
Wandrey, C. J., Law, B., and Shah, H. A. (2004). Patala-Nammal Composite Total Petroleum System, Kohat-Potwar Geologic Province, Pakistan. Reston, VA: United States Geological Survey.
Wangen, M., Antonsen, B., Fossum, B., and Alm, L. K. (1990). A Model for Compaction of Sedimentary Basins. Appl. Math. Model. 14 (10), 506–517. doi:10.1016/0307-904x(90)90183-6
Yassir, N., Addis, M. A., Huffman, A., and Bowers, G. (2002). Relationships between Pore Pressure and Stress in Different Tectonic Settings. Memoirs-American Association of Petroleum Geologists, 79–88.
Keywords: pore pressure, compaction disequilibrium, overpressure, Murree Formation, Potwar basin, undercompaction, Eaton’s method, structural geometries
Citation: Amjad MR, Zafar M, Ahmad T, Hussain M and Shakir U (2022) Overpressures Induced by Compaction Disequilibrium Within Structural Compartments of Murree Formation, Eastern Potwar, Pakistan. Front. Earth Sci. 10:903405. doi: 10.3389/feart.2022.903405
Received: 24 March 2022; Accepted: 25 April 2022;
Published: 13 June 2022.
Edited by:
Ahmed E. Radwan, Jagiellonian University, PolandReviewed by:
Shuai Yin, Xi’an Shiyou University, ChinaChao Li, Institute of Geology and Geophysics (CAS), China
Copyright © 2022 Amjad, Zafar, Ahmad, Hussain and Shakir. This is an open-access article distributed under the terms of the Creative Commons Attribution License (CC BY). The use, distribution or reproduction in other forums is permitted, provided the original author(s) and the copyright owner(s) are credited and that the original publication in this journal is cited, in accordance with accepted academic practice. No use, distribution or reproduction is permitted which does not comply with these terms.
*Correspondence: Muhammad Raiees Amjad, bXJhaWVlcy5idWljQGJhaHJpYS5lZHUucGs=